Abstract
Quantification of the water budget of an arid inland river ecosystem is essential but still a challenge for the sustainable development of water resources. In situ observed data were used to analyze the monthly and annual water budgets and the soil hydrological cycle for six typical ecosystems in the Heihe River Basin (HRB). The two-source model was used to partition evapotranspiration (ET) into transpiration (T) and evaporation, after which the validated model was applied to quantitatively analyze the biological water use fraction [T/Ecosystem Water Supply (WS)] for different ecosystems. There were differences in the water budgets of the different ecosystems due to differences in climate, vegetation, soil, and external inputs. Precipitation in the HRB decreased from upstream to downstream, whereas there was a gradual increase in ET. External sources of water (e.g., natural runoff from upstream, irrigation in the middle reaches, and groundwater recharge in the lower reaches) to soil layers played an important role in regulating the water budgets of HRB ecosystems. Cropland obtained the maximum biological water use fraction (0.50), followed by Populus euphratica (0.49), alpine meadow (0.49), alpine swamp meadow (0.44), Tamarix ramosissima (0.42), and Kalidium foliatum (0.4). The soil water residence time (at a depth of 40 cm) varied from 14 d to 97 d (average of 60 d). The order of plant species in terms of soil water residence time was: K. foliatum (88 d) > T. ramosissima (72 d) > alpine meadow (68 d) > alpine swamp meadow (63 d) > cropland (53 d) > P. euphratica forest (20 d). Differences in the biological water use fraction and soil water residence time could be attributed to the characteristics of the water budget for each ecosystem. This study quantified the water budget, biological water use, and soil hydrological cycle across typical ecosystems in HRB, and can act as a reference for ecosystem management of the arid inland river basin.
1. Introduction
Inland river basins in arid and semi-arid regions account for 13.3% of the Earth’s land area [1]. Terrestrial ecosystems comprising inland rivers and terminal lakes are considered to be highly sensitive to climate change and anthropogenic activities [2]. The water budget is a quantitative description of elements of the water cycle, such as precipitation, evapotranspiration (ET), runoff, and soil water storage. Therefore, characterization of the water budget is essential for water resources planning and management, particularly in arid inland river basins. There has been increasing attention focused on many watersheds in recent decades within the context of global climate change, population growth, water shortages, and ecosystem degradation [3,4]. Estimating the water budgets of arid inland river ecosystems is essential for the sustainable development of water resources.
The Heihe River Basin (HRB) is in the inland arid region of northwestern China and is characterized by a complex natural and geographical environment with a unique water system from upper to downstream [5]. Although there have been many studies on hydrological processes in the HRB, most simulated the water balance at a watershed scale or focused on individual elements of the water balance [6,7,8,9]. The Variable Infiltration Capacity (VIC) model was used to estimate the water balance of different landscape types in the upper reaches of the HRB [10]. The water budget of the HRB was studied by using the modified Budyko hypothesis and a validated monthly water balance model to divide the HRB into six different regions according to differences in hydrothermal conditions [11]. Gao et al. [3] used the distributed eco-hydrological model to estimate hydrological processes in the upper reaches of the Heihe River and analyzed the relationships between the water balance characteristics of the river basin and vegetation patterns. Li et al. [12] combined an integrated ecohydrology model with systematic observations to analyze the hydrology cycle in the HRB. Although the above studies allowed a rigorous analysis of the water balance at the basin scale, there remains a lack of verification of water budgets at the ecosystem scale. In addition, vegetation transpiration is an important component of the water budget of terrestrial ecosystems and is directly related to ecosystem water use efficiency. The ratio of direct biological water use (T) to total water supply (including precipitation, irrigation, and groundwater supply; WS) at the ecosystem scale remains poorly characterized [13]. A study by Good et al. [13] applying field and remote sensing data to an ecohydrological model showed that the maximum biological water use fraction (T/P) (P was the only supply of water) occurred under a mesic condition. T/WS is an important indicator for understanding the mechanism and efficiency of water use. There has been increasing attention on partitioning ET in recent years, with most related studies in the HRB focusing on individual ecosystems [7,14]. However, there remains a lack of understanding of the role of vegetation transpiration in the water budget and how biological water use varies under differences in the hydroclimate. The water budget describes various components of the hydrological cycle. While the residence time of soil water reflects the hydrological cycle when precipitation is the main water source [15], ecosystem hydrological processes are complex, and soil responses to precipitation events are also affected by irrigation, groundwater, lateral runoff, and other sources of water. Quantifying the residence time of soil water can reflect the water-flow path, water storage, and water sources, and is also a comprehensive indicator describing the hydrological function of an ecosystem [5]. Many studies have attempted to characterize catchments based on soil water retention time. Since most studies have also focused on small watersheds due to the difficulties in field sampling and observations, there have been few studies on the HRB.
Linking vegetation water demands with ecosystem water supplies can be achieved though quantification of the fraction of total water supply used by vegetation. Transpiration is broadly understood to comprise most global surface-to-atmosphere vapor flux. However, the interactions between soil moisture availability, vegetation structure, and plant water use remain poorly understood across typical ecosystems in the HRB. The aim of this study was to: (1) quantify the characteristics of water budgets of typical ecosystems at monthly and annual scales based on first-hand observation; (2) explore characteristics of biological water use fraction (BWF) and soil residence time among ecosystems of the HRB; (3) analyse the main factors and process on the water budgets of each ecosystem and possible impacts under future climate change.
2. Materials and Methods
2.1. Study Location
The Heihe River is the second largest inland river in China, and originates from the glacial snow belt in the Qilian Mountains in Qinghai Province. The HRB lies between 97.1° E–102° E and 37.7° N–42.7° N, and has an area of 143,000 km2 (Figure 1). The ecosystems of the HRB are complex and comprise high mountain glaciers, forest grasslands, plain oasis, and Gobi Desert [16,17]. The upper reaches of Heihe River are located at 1674–5564 m above sea level in the Qilian Mountains, with a cold and dry climate and mean annual precipitation of 300–600 mm. Vegetation in this area has an obvious vertical distribution due to the numerous mountains and significant elevation differences. The vegetation types mainly include frozen desert zone, forest zone, alpine meadow zone, mountain steppe zone, steppe desert zone, glacier zone, etc. The middle reaches are 1352 to 1700 m above sea level, and there is a temperate continental arid climate, an average annual precipitation of 90–160 mm, and annual evaporation of 2000–2500 mm. Vegetation in this middle area were natural desert vegetation (e.g., Reaumurica soongorica, Kalidium foliatum and Nitria sphaerocarpa) and artificial oases vegetation types (e.g., Maize, wheat, rape, potato). The middle reaches experienced the most intense anthropogenic activities, leading to centralized agricultural consumption of water resources in the basin. The lower reaches of the HRB with elevation are less than 1352 m, which have relatively lower precipitation with average annual values of 36.6 mm and higher ET. The vegetation in this region is mainly desert and riparian forest. The depth of groundwater is heterogeneous. In the upper mountainous area and middle natural desert vegetation area, previous studies have shown that the depth was more than 100 m, and were much decreased due to flood irrigation recharged in the farmland area [18]. The groundwater depth of lower reaches was about 2~5 m [18].
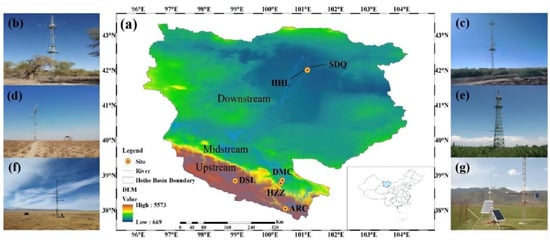
Figure 1.
The location of observation sites and landscape of each site on the HRB. (a) The location of six observation sites; (b) P. euphratica at the HHL site; (c) T. ramosissima at the SDQ site; (d) Kalidium foliatum at the HZZ site; (e) Cropland at the DMC site; (f) Apline swamp meadow at the DSL site; (g) Apline meadow at the ARC site.
The present study selected six typical ecosystems of the HRB separated by environment gradients (altitude, precipitation, and temperature). The land surface of those selected six sites was wide and flat with enough footprints. The characteristics of the selected ecosystems, including soil, vegetation type, and climate, were summarized in Table 1. Briefly, two upstream alpine meadows at different elevations, named the A’rou (ARC) and Dashalong (DSL) sites, were selected. The Apline meadow is the main vegetation type in the ARC site, which has a rich variety of plants including Kobresia humilis, Stellera chamaejasme L., Poa calliopsis, Potentilla multifida, Medicago Sativa L., Elymus nutans et al. Different to the ARC, the DSL site belongs to the Apline swamp meadow; Kobresia pygmaea was the dominant species at the DSL site, and other herbs include Carex atrofusca, Schkuhr subsp, Kobresia tibetica Maxim, et al. The cropland at the Daman site (DMC) and nature desert at the Huazhaizi site (HZZ) in the middle reaches were chosen. Maize was planted at DMC in late April and harvested during mid-to-late September. During the growing season, flood irrigation was generally performed four times (e.g., May, June, July, and August). Kalidium foliatum is the dominate and key plant species in the HZZ site, whereas the other plants were fewer. In the lower reaches, two different types of desert riparian forest ecosystems which serve as important wildlife habitat were selected. At the sidaoqiao (SDQ) site, T. ramosissima were dominated in this site by a few herbs such as Phragmites communis, Sophora alopecuroides L., Achnatherum splendens, and Agropyron cristatum. For the Hunhelin (HHL) site, P. euphratica and T. ramosissima are key species, accompanied by herbs similar to those in the SDQ.

Table 1.
Main characteristics of the typical ecosystems in the study region.
2.2. Description of Datasets
The present study used a hydrometeorological observation network dataset provided by the National Tibetan Plateau Data Center (TPDC) (https://data.tpdc.ac.cn/, accessed on 27 December 2019), which includes eddy covariance (EC) and automatic weather station (AWS) data. The data collection process by the TPDC is described in detail in previous studies [20,21]. EC post-processing calculations were performed using EdiRe, as described by Xu et al. [21]. In-filling of missing data was performed using the “REddyProc” R-package [22]. Module-simulated data were used to fill data gaps extending beyond a month. After data gap filling, energy budget closure was used to elevate the EC data using linear regression statistics between available energy flux (Rn-G) and the sum (LE + H) of latent heat (LE) and sensible heat flux (H) [23]. The annual mean energy budget closure values during the study period were 0.95 for the alpine meadow (ARC site), 0.83 for the alpine swamp meadow (DSL site), 0.84 for cropland (DMC site), 0.81 for Kalidium foliatum (HZZ site), 0.78 for Populus euphratica (HHL site), and 0.89 for Tamarix ramosissima (SDQ site). The closures of the energy budgets indicated that EC data for the HRB were seasonably accurate. Precipitation data measured by a tipping bucket rain gauge and other meteorology data were used for input into the model. Transpiration data for P. euphratica measured using a Thermal Dissipation Probe (TDP) [24,25] at the Hunhelin site were obtained from TPDC (https://data.tpdc.ac.cn/, accessed on 6 May 2019) and were used to test model performance. The GLASS leaf area index (LAI) products (http://glassproduct.bnu.edu.cn/,accessed on 1 January 2020) were obtained from Beijing Normal University [26]. These data had an 8-day interval and were interpolated into a daily interval, following which they were used to represent vegetation dynamics in the present study.
2.3. Water Balance of the Terrestrial Ecosystem
The basic equation of the terrestrial ecosystem water budget [27,28,29] can be defined as:
where P is precipitation, GW is groundwater recharge, I is irrigation, ΔR is lateral inflow/outflow of the ecosystem, ET is evapotranspiration, which can be partitioned into evaporation and transpiration, D is soil drainage (since the depths of observations of soil moisture ranged from 0 cm to 160 and 320 cm, D was ignored in calculation), and ΔQ is the change in soil water storage.
The present study simplified the water budget equation for different ecosystems according to their characteristics. The formula for the water budget can be simplified for the alpine meadow area of the upper HRB as P + ΔR = ET + ΔQ. The water supply (WS) is equal to P + ΔR. The formula for the ecosystem water balance can be simplified to P + I = ET + ΔQ in cropland ecosystems due to the influence of anthropogenic activities, thereby stressing the importance of irrigation as a water source. WS is equal to P + I. The water budget formula can be simplified to P + GW = ET + ΔQ in desert scrub and riparian forest ecosystem. WS is equal to P + GW.
2.4. Estimation of Potential ET
The Food and Health Organization (FAO) Penman-Monteith method is recommended to estimate potential ET which can be derived by:
where ETo is potential ET (mm/day), Rn is net radiation at the crop surface [MJ m−2 day−1], G represents soil heat flux density [MJ m−2 day−1], u2 is wind speed at a height of 2 m [m s−1], es and ea represent saturation and actual vapor pressure [kPa], respectively, ∆ is the slope of the vapor pressure curve [kPa °C−1], and γ is the psychrometric constant [kPa °C−1].
2.5. Estimation of Biological Water Use Fraction
Biological water use fraction (BWF) in a terrestrial ecosystem can be defined as:
where T is transpiration, WS is the water supply (WS varied across the different ecosystems), and the main source of WS was precipitation (P), irrigation (I) in agricultural ecosystems, groundwater recharge (GW) for desert ecosystems, or lateral runoff supply (ΔR) in alpine ecosystems. T was estimated by the two-source model by partitioning the ET flux in the ecosystems. The Appendix A describes the partitioning of ET of typical ecosystems in the HRB, whereas more details are available in the literature (Tong et al., 2019). The Appendix A provides more information on the two-source model.
2.6. Estimation of Soil Water Residence Time
Water storage in a soil column with a unit ground-surface area Q (mm) can be evaluated by summing the water storage in each sub-layer. If all water from precipitation returns to the atmosphere by ET, the mean residence (or turnover) time of water in the column, τ (day), can be evaluated as:
where Q (mm) is the mean water storage in the soil column for a given period, P (mm/day) is the mean precipitation for the same period, and represents other sources of water (e.g., irrigation, groundwater recharge, lateral runoff) within the ecosystem. The parameter provides a measure of the timescale of the soil–hydrological cycle within the study region [27].
3. Results
3.1. Seasonal Variations in the Observed Soil Water Profile and Water Budget Components in the HRB
Figure 2 shows the observed spatial distribution of daily average soil moisture of different ecosystems in the HRB at different soil depths. In the alpine meadow ecosystem, soil moisture was mainly distributed in the surface soil layer (0–40 cm), whereas soil moisture showed an inverse relationship with soil depth in the 40–320 cm soil layer and soil water was stable throughout growing season. In the alpine swamp meadow ecosystem, soil moisture first decreased with increasing depth in the 0–80 cm soil layer, following which it gradually increased with increasing depth in the 80–160 cm soil layer. The change in water storage of deep soil showed a time lag compared with that in the surface soil. The soil moisture content of the cropland ecosystem was affected by irrigation, characterized by four peaks a year from 2014 to 2016. Soil moisture content increased sharply at the beginning of the growing season, but then decreased sharply at the end of the growing season with a relatively uniform vertical distribution. There was relatively high evaporation of surface soil water in the K. foliatum ecosystem. In addition, the water content of surface soil was less than that of the deep soil. Soil moisture increased with increasing depth, and there were no obvious inter-annual changes. In the P. euphratica ecosystem, the 0–100 cm soil layer showed a low soil moisture, with a minimum occurring in the 20–40 cm soil layer from December to February of the next year. This could be attributed to P. euphratica mainly using deeper soil water. The distribution of soil water in the T. ramosissima ecosystem varied sharply among different layers, and soil moisture in the 20–160 cm soil layer from March to July exceeded that in other soil layers and was relatively stable. The soil water regime in the HRB showed both consistencies and variations among the different ecosystems, and was mainly regulated by the water budget and the trade-off between water loss (transpiration and soil evaporation) and supply (e.g., P, I, GW, or ΔR).
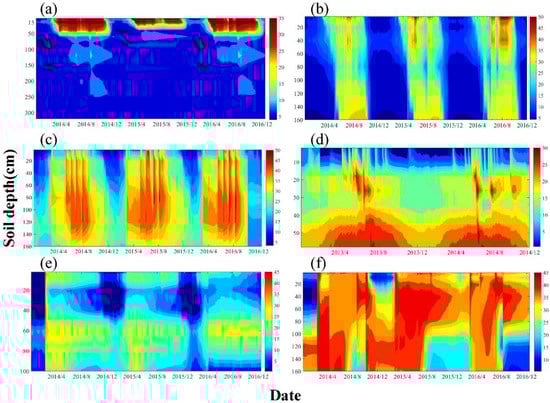
Figure 2.
Spatial distribution of average daily soil moisture during study period for (a) alpine meadow; (b) alpine swamp meadow in 2014–2016; (c) cropland in 2013–2014; (d) Kalidium foliatum in 2013–2014; (e) P. euphratica in 2014–2015; (f) T. ramosissima in 2014–2016.
As shown in Figure 3, the present study analyzed the monthly variation ΔR in the water budget of each ecosystem over two typical years. Precipitation decreased from upstream to downstream, whereas there was a gradual increase in ET, mainly between April–September. The variations in soil water storage could be attributed to differences growing between the ecosystems. The maximum upstream ΔQ occurred in April in the alpine meadow ecosystem, whereas that of the high-altitude alpine swamp meadow occurred in May and June. These results could be attributed to soil layers experiencing a maximum water content after recharge by the thawing of snow and frozen soil during the rising temperature. P exceeded the sum of ET and ΔQ in the alpine meadow at the end of the season during rainy years when the ecosystem showed a water surplus, whereas the alpine swamp meadow ecosystem showed a water deficit during other periods. ET was sustained by water storage to a greater degree than by direct precipitation. This result indicated that an absence of snow melt water and stream inflow would lead to considerable stress amongst the upstream vegetation in the growing season. In the cropland ecosystem, the maximum ΔQ occurred in March, whereas ΔQ remained constant and positive in May–August and was hardly affected by irrigation. The decrease in ΔQ between September and October was due to the halting of irrigation after crop maturity. There was small monthly variation in the ΔQ of the natural desert K. foliatum ecosystem, with changes mainly occurring between June and August, which indicated that soil storage water in K. foliatum was related to precipitation in the growing season. In the riparian forest ecosystem, ΔQ was positive in February–April, with the maximum reached in March due to diversion of ecological water. Water originating from the upper and middle reaches of the river replenished soil moisture, following which soil water storage gradually decreased under high ET.
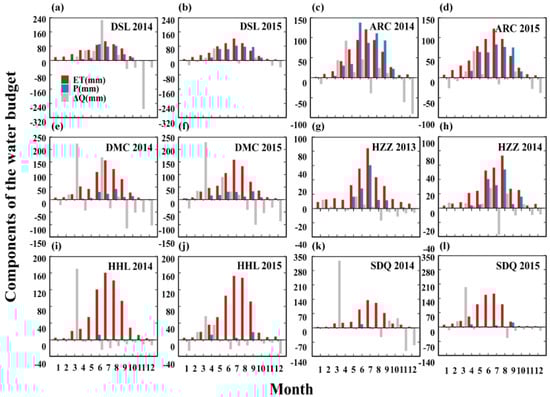
Figure 3.
Monthly variation of observed water budget components (precipitation, ET and change of soil water storage) of two years in (a,b) alpine swamp meadow (DSL) in 2014–2015 year; (c,d) alpine meadow (ARC) in 2014–2015 year; (e,f) cropland (DMC) in 2014–2015 year; (g,h) Kalidium foliatum (HZZ) in 2013–2014 years, (i,j) T. ramosissima (SDQ) in 2014–2015 year; (k,l) P. euphratica in 2014–2015 year.
3.2. Statistics of the Water Budget and Its Components across Ecosystems in the HRB
The upstream alpine and swamp meadow ecosystems constituted the main areas for water conservation and ecosystem water yield. As summarized in Table 2, the mean precipitation of the alpine meadow ecosystem varied from 392 to 520 mm during 2013 to 2016, with a mean annual precipitation of 444 mm, and mean ET varied from 471 to 551 mm, with a mean of 508 mm. Water storage in the soil layer showed a small interannual change. ET was the main form of water loss from the ecosystem, and mainly comprised vegetation transpiration, particularly during the growing season in the alpine meadow ecosystem. The mean precipitation of the alpine swamp meadow ecosystem at high altitude varied from 310 to 388 mm during 2014 to 2016, with a mean annual precipitation of 341 mm, whereas ET varied from 202 to 232 mm, with a mean of 215 mm. Water storage in the soil layer remained constant. Annual ET was largely attributed to soil evaporation (66%), even though its contribution was less than that of T during the growing season. The calculation of the water budget showed deficits in both the alpine and swamp meadow ecosystems (water loss > water supply), and no surface runoff occurred for most of the time, besides for the peak rainfall season between June and September.
Table 2.
Components of the water budget in the alpine meadow ecosystem of the upper stream.
Table 3 summarizes the annual water budget and its components in the middle and downstream ecosystems. Precipitation of the cropland ecosystem varied from 101 to 161 mm during 2013–2016, with a mean annual precipitation of 133 mm. ET varied from 638 to 703 mm during 2013–2016, with a mean of 662 mm, of which T accounted for ~50% and ~82% of the average annual and growing season ET, respectively. The calculation of the water balance indicated an average irrigation of 556 mm, close to that calculated by Yang et al. [30] of the irrigation depth of the DMC in 2012 of 540 mm. The average annual precipitation of the desert K. foliatum ecosystem was 149 mm for three years, accounting for 59.4% of water consumed by the ecosystem. The average annual ET was 251 mm, with T for K. foliatum of ~111 mm accounting for 56% of the total water supply for the three years. The ecosystem showed a water deficit, and the average local irrigation recharge of 129 mm was a possible water source, similar to the conclusion of the study by Zhao et al. [31] of the desert shrub Calligonum mongolicum in the HRB.
Table 3.
Components of water budget in ecosystems of midstream and downstream.
ET far exceeded precipitation in the downstream region. Mean P was ~33 mm at two riparian forest ecosystems, whereas there were significant differences in mean ET and BWF (Table 3). The ET of P. euphratica of 694 mm exceeded that of T. ramosissima of 604 mm. The deep root system of P. euphratica allows it to use deeper groundwater, resulting in a higher transpiration flux compared with T. ramosissima. The calculated changes in soil water storage and water budget indicated that groundwater supplies most water in desert riparian ecosystems in an extremely dry climate (P < 50 mm).
3.3. Biological Water Uses and Soil Water Residence among Ecosystems
Most water assimilated by plants is lost through transpiration. Therefore, BWF is an index reflecting the real water demand of plants during photosynthesis [13]. BWF can be quantified by dividing plant transpiration by WS for each ecosystem. The BWF values of the ecosystems from upstream and downstream in the HRB ranged from 0.3 to 0.52, with an average of 0.47. As shown in Table 4, among the six ecosystems, the rank of the different ecosystems in terms of mean annual BWF was cropland (0.50) > P. euphratica (0.49) > alpine meadow (0.49) > alpine swamp meadow (0.44) > T. ramosissima (0.42) > K. foliatum (0.4). The BWF of the cropland ecosystem exceeded that of other ecosystems in the middle and lower reaches of the HRB when evaporative demand (potential ET) slightly exceeded supplied precipitation.
Table 4.
Fraction of biological water use and residence time of soil water in ecosystems in Heihe River Basin.
The differences in the water budget and BWF among different ecosystems can be associated with soil water residence time (τ, day). The observations of soil water storage (Q) in each sub-layer were used to calculate the total soil water residence time of typical ecosystems in the HRB. The present study compared the soil water residence times (days) of different ecosystems at shallow layers (0–40 cm) to allow a comparison at different soil depths in the HRB (Table 3). The τ values of shallow soil layers (0–40 cm) ranged from 14 to 97 days from upstream and downstream in the HRB, with an average of 60.3 days. The rank of the six ecosystems in terms of τ was: K. foliatum (88) > T. ramosissima (72) > alpine meadow (68) > alpine swamp meadow (63) > cropland (53) > P. euphratica (20).
4. Discussion
4.1. Water Budget across Different Ecosystems and Uncertainties
While accurate estimation of the water budget of ecosystems is vital for promoting sustainable development, this remains a challenge amongst diverse ecosystems. The present study used the observed dataset and water balance equation to identify clear differences in the water budget amongst the six typical ecosystems in the HRB. Previous studies have indicated the clear water conservation and water yield functions of grassland meadow ecosystems [32]. Soil evaporation and transpiration of the alpine and swamp meadow ecosystems investigated in the present study not only consumed all precipitation, but also soil water. Therefore, these two ecosystems play an important role in regulating the water budget. Although ET was similar to precipitation in the alpine swamp meadow ecosystem, soil water storage increased greatly, indicating that changes in soil water storage were due to external supplies, such as glacier and snow melt water or subsurface flow. There was no net runoff at an annual scale in the alpine and swamp meadow ecosystems, except for during the growing season of wet years during which there were higher levels of precipitation. The relatively small runoff of the alpine and swamp meadow ecosystems with runoff coefficients of ~0.08 and ~0.13, respectively, could be attributed to their relatively lower elevation. A study by Yang et al. [29] which used a distributed hydrological model to study the water balance in the upper reaches of the HRB found that groundwater runoff and subsurface flow accounted for ~80% and 20% of total runoff, respectively. In addition, the small contribution of surface runoff in the study by Yang et al. of 2–3% was consistent with the results of the present study. Chen et al. [33] showed that the main runoff areas of alpine cold desert occur in the mountain basin, whereas the alpine meadow/grassland areas showed little contribution to runoff, with their ecological function exceeding their hydrological function. Alpine grass/meadow with a flat terrain typically showed greater water conservation functions and less contribution to runoff. Stream inflow in swamp meadow ecosystems exceed that of alpine meadows ecosystem, which can be attributed to higher altitudes and greater external sources of water (e.g., snowmelt). Lateral inflow, which may originate from snow melt and subsurface flow, is an important source of water in upstream ecosystems in the HRB. Precipitation decreased from upstream to downstream in the cropland ecosystems of the middle reaches, whereas ET increased gradually, mainly from April to September. Annual ET was significantly greater than precipitation, resulting in ecosystem water stress, consistent with the results of the study by Chen [34] on the effects of irrigation on ET of the cropland ecosystem. ET due to crop growth is mainly supplied by irrigation. The calculation of the water budget showed that irrigation varied from 512 to 597 mm, with a mean of 529 mm [35], consistent to the recorded irrigation depth of 540 mm in 2012 [36]. The estimates of irrigation depth in the present study are reasonable considering the uncertainties in both actual measurements of water components (e.g., P, ET, and soil water) and statistics. Smart irrigation techniques are currently applied within agricultural irrigation management in arid and semi-arid areas to improve water use efficiency [37,38]. Accurate management of irrigation is needed to avoid waste of valuable water resources in deserted oases regions. Rainfall was insufficient to meet vegetation water demand in the dry downstream ecosystems, such as the HHL and SDQ sites. Hence, natural vegetation at these sites is mainly dependent on groundwater [39]. Groundwater is the main source of recharge to shallow soil water and sustains the ET process driven by strong vapor pressure deficiencies (VPDs). Although P. euphratica and T. ramosissima showed similar ET characteristics, the water consumption capacity of P. euphratica exceeded that of T. ramosissima. Riparian forest can regulate stream-flow dynamics and water budgets by assimilating large volumes of water from groundwater compartments [40]. Yuan et al. [41] also found that water consumption of P. euphratica exceeds that of T. ramosissima in the lower reaches of the Tarim River. A study by Yu et al. [42] that analyzed the variation in daily ET of P. euphratica and T. ramosissima in the lower reaches of the HRB found that the daily average ET of P. euphratica exceeded that of T. ramosissima. The studies mentioned above obtained results that were consistent with those of the present study for the downstream reaches of the HRB.
Climate change will directly affect water budget by changes in water input such as glacier melting and precipitation. The ecosystem at the upper stream was easily influenced because of the higher elevation and more glaciers, which possibly increases melting runoff under future warming and a wet climate. At the same time, the permafrost will depredate, which may impair the ecosystem structure and function such as water conservation and yield in this area. For the middle stream, irrigated water sustains the oasis transpiration, which relies heavily on the incoming water resource from the upper stream. For the lower stream, priority should be given to ecological water requirements to sustain the ecosystem function which needs to control the level of agricultural water use in the middle stream to solve the water use conflicts. Overall, it is necessary to carry out climate impact assessment and comprehensive water resource management in the whole river basin.
However, many uncertainties in the estimations of the current study exist. While precipitation is a critical input variable for calculation of the water balance, it is difficult to measure accurately [43], especially in alpine areas. Additionally, winter snowfall in the alpine region may be underestimated, and it is difficult to discriminate between snow melt water and subsurface flow within the water consumption of the ecosystems. Therefore, the present study collectively referred to these elements as external stream inflow recharge. The present study assumed simple water budgets for the upper, middle, and lower reaches based on observational data. However, it is recognized that although this assumption is reasonable, it may lead to uncertainties in the calculation of the water budget components.
4.2. Differences in the Biological Water Use Fraction among Different Ecosystems
A study by Good et al. [13] on the global BWF (T/P, in which P was the only water source) identified a maximum aridity index (ET0/P) between 1.3 and 1.9, following which BWF decreased with increases or decreases in aridity. The results of the present study indicated similar changes in BWF in the six ecosystems, although they exhibited divergences in the water environment (e.g., irrigation, widely developed runoff, and groundwater). The rank of the six typical ecosystems of the HRB in the growing season according to mean annual water supply (WS) was: alpine swamp meadow (664 mm) > P. euphratica (557 mm) > cropland (500 mm) > T. ramosissima (480 mm) > alpine meadow (425 mm) > K. foliatum (258 mm) (Figure 4 and Table 4). There were significant differences in aridity (ET0/WS) between the different ecosystems in the HRB. Figure 5 shows the relationship between BWF and ecosystem aridity. The rank of the six ecosystems in terms of mean annual BWF was: cropland (0.50) > P. euphratica (0.49) > alpine meadow (0.49) > alpine swamp meadow (0.44) > T. ramosissima (0.42) > K. foliatum (0.4). The cropland ecosystem achieved the maximum BWF due to moderate dryness and irrigation. However, the lowest BWF of the K. foliatum ecosystem could be attributed to its high aridity (2.31) and water limitation. The BWF of the alpine swamp meadow ecosystem was lower than that of the alpine meadow due to the former being limited by available sunlight energy at higher elevation. The higher BWF of P. euphratica compared to T. ramosissima could be attributed to its larger leaf area index and deeper roots, consistent with the results of a study by Zhang et al. [44] which determined that the root system of P. euphratica has a large extension range (reaching 7.0 m).
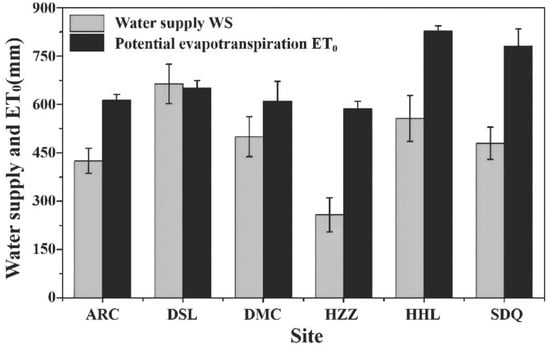
Figure 4.
Water supply and potential ET of growing season for alpine meadow (ARC), alpines swamp meadow (DSL), cropland (DMC), Kalidium foliatum (HZZ), P. euphratica (HHL), T. ramosissima (SDQ) ecosystems of HRB.
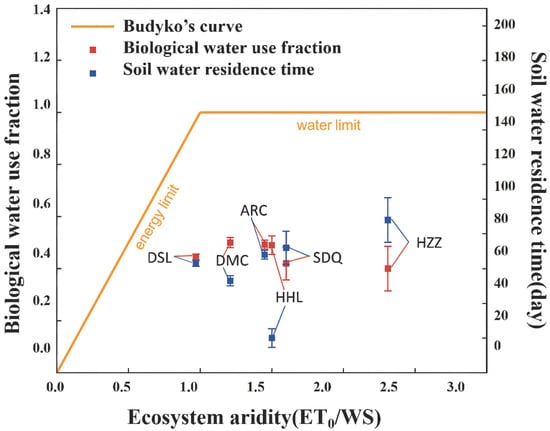
Figure 5.
The biological water use fraction and soil water residence time (for 40 cm depth) plotted with respect aridity in growing season for alpine meadow (ARC), alpines swamp meadow (DSL), cropland (DM), Kalidium foliatum (HZZ), P. euphratica (HHL), T. ramosissima (SDQ). T means transpiration, WS means total water supply in ecosystems, ET0 calculated with FAO Penman Monteith equation.
4.3. The Soil Water Residence Time and Soil Hydrological Cycle
Soil water residence time varies with ecosystem topography, land cover type, climate, and soil texture, thereby reflecting the characteristics of the soil hydrological cycle for each unique ecosystem. The present study selected three soil depths (10 cm, 20 cm, and 40 cm) of measured soil water to calculate the total soil water storage (Q) for easy comparison among the six ecosystems. The soil water residence time of ecosystems in the HRB varied from 14 d to 97 d, with an average of 60 d. The rank of the six ecosystems in terms of soil water residence time was: K. foliatum (88 d) > T. ramosissima (72 d) > alpine meadow (68 d) > alpine swamp meadow (63 d) > cropland (53 d) > P. euphratica forest (20 d). The soil water residence time of P. euphratica was the lowest among all the ecosystems. The soil water storage (Q) of P. euphratica was lower than that of T. ramosissima and the other ecosystems in the HRB, which may be related to its higher BWF and more rapid soil hydrological cycle compared with those of the other ecosystems. For cropland, τ varied from 48 d to 59 d, with an average of 53 d, which may be related to its high evapotranspiration and highest BWF. The higher Q and lower ET of the alpine meadow resulted in a τ ranging from 63 d to 75 d, with an average of 68 d, exceeding that of the alpine swamp meadow of 59 d to 67 d, with an average of 63 d. K. foliatum achieved the highest τ among the ecosystems, varying from 72 d to 97 d, with an average of 88 d, which may be related to its smaller evapotranspiration characterized by the lowest BWF among the ecosystems.
5. Conclusions
The present study analyzed and modelled the monthly and annual water budget of the ecosystems of the HRB using meteorological data. The ecosystems showed increasing water deficit from upstream to downstream, i.e., precipitation entering the ecosystems was insufficient to meet ET demand. Snowmelt water and stream inflow were important sources of ecosystem water in the upper reaches, and the volume of replenishment increased with increasing altitude. Irrigation accounted for ~80% of ecosystem water supply in the cropland ecosystem in the middle reaches, thereby maintaining a high ET. Groundwater is a key factor maintaining vegetation growth in desert and desert riparian forest ecosystems, and groundwater consumed by desert riparian forests exceeded that of natural desert ecosystems by a factor of ~5. Water consumption of ecosystems in the riparian zone was related to the vegetation type. Water consumption of P. euphratica exceeded that of T. ramosissima due to its larger LAI and deeper roots. The maximum BWF of the cropland ecosystem could be attributed to its moderate dryness and irrigation, whereas the small BWF of the alpine swamp meadow ecosystem and K. foliatum ecosystem could be attributed to limited available energy and limited water, respectively. The soil water residence time of ecosystems in the HRB varied from 14 d to 97 d, with an average of 60 d. The rank of the six ecosystems in terms of soil water residence time was: K. foliatum (88 d) > T. ramosissima (72 d) > alpine meadow (68 d) > alpine swamp meadow (63 d) > cropland (53 d) > P. euphratica forest (20 d). The characteristics of the water budget for each ecosystem could be explained by their differentiates in biological water use fraction and soil water residence time.
Author Contributions
Conceptualization, P.W.; methodology, Q.C.; software, Q.C.; validation, Y.X. and D.Z.; formal analysis, H.S.; investigation, P.W.; resources, P.W.; data curation, Q.C.; writing—original draft preparation, Q.C.; writing—review and editing, P.W.; visualization, Q.C.; supervision, P.W.; project administration, P.W.; funding acquisition, P.W. All authors have read and agreed to the published version of the manuscript.
Funding
This research was funded by the National Natural Science Foundation of China, grant number U21A2001 and 42071034.
Data Availability Statement
All hydrometeorological datasets used in this paper are available on request from the National Qinghai-Tibet Plateau Data Center (TPDC) (https://data.tpdc.ac.cn, accessed on 6 May 2019).
Conflicts of Interest
The authors declare no conflict of interest.
Appendix A
Appendix A.1. Model ET Partitioning and Estimation of Transpiration
The two-source model is based on the energy balance between the soil surface and the vegetation canopy and considers the energy interaction between the canopy and the soil. The model was used to divide ET into soil evaporation and plant transpiration for the selected ecosystems and among different spatial and temporal scales. The results were used to assess vegetation productivity and the water budget in the context of climate change.
The formula of the model is as follows:
where RnV is the net radiation of the vegetation canopy(W m−2), HV is the sensible heat flux from the vegetation canopy (Wm−2), T is the transpiration flux (kg m−2 s−1), fv is the permittivity of the vegetation canopy, αV is the albedo of the vegetation canopy, Sd is the downward shortwave radiation (W m−2), Ld is the downward longwave radiation (W m−2), σ is the Stefan–Boltzmann constant (=5.67 × 10⁻⁸ W m−2 K−4), TG is the ground surface temperature (°C), TL is the leaf temperature (°C), RnG is the net radiation at the ground surface (W m−2), G is the ground heat flux (W m−2), HG is the sensible heat flux from the ground surface (W m−2), E is the evaporation flux (kg m−2 s−1), and αG is the albedo of the ground surface. αG and αV can be approximated to constants 0.1 and 0.2.
RnV = (1 − fV) [(1 − αV)Sd + Ld + σTG4 − 2σTL4]
= HV + lT,
= HV + lT,
RnG = fV [(1 − αG)Sd + Ld] + (1 − fV)σTL4 − σTG4
= G + HG + lE,
= G + HG + lE,
The HV and HG can be given by the following bulk equations:
where cp is the heat capacity of dry air, raV is the aerodynamic impedance of the vegetation canopy, and raG is the aerodynamic impedance of the surface (s/m). These parameters are mainly related to wind speed, vegetation height, and the height of anemometer. A more detailed description is provided by Wang and Yamanaka [45].
HV = cpρa (TL − Ta)/raV,
HG = cpρa (TG − Ta)/raG,
Appendix A.2. Assessment of the Model Performance
Previous studies have assessed the model performance for estimation of transpiration [46]. Specifically, the root-mean-square error (RMSE), correlation coefficient (R2), and agreement index were used to validate and test the model performance. Agreement between observations and model simulations of total energy flux demonstrated good performance of the model in capturing the radiation transfer and energy partition of ecosystems in the HRB (Table A1). In addition, the two-source model partitioned ET into evaporation and transpiration. The agreement between the results of the present study and those of related previous studies demonstrated the good performance of the model in capturing the transpiration of each ecosystem (Table A2). In addition, a model sensitivity analysis indicated that the model is insensitive to errors in measured input variables and parameters [46]. Therefore, despite some uncertainty in partitioning ET, there was good consistency between simulated and measured T.
Table A1.
Model performance statistics with daily mean data in the five typical ecosystems.
Table A1.
Model performance statistics with daily mean data in the five typical ecosystems.
| Site | Index | IE |
|---|---|---|
| ARC | R2 | 0.91 |
| I | 0.96 | |
| RMSE (W/m2) | 16.02 | |
| n | 711 | |
| DSL | R2 | 0.8 |
| I | 0.95 | |
| RMSE (W/m2) | 20.18 | |
| n | 724 | |
| DMC | R2 | 0.84 |
| I | 0.94 | |
| RMSE (W/m2) | 23.67 | |
| n | 669 | |
| HHL | R2 | 0.84 |
| I | 0.95 | |
| RMSE (W/m2) | 27.4 | |
| n | 673 | |
| SDQ | R2 | 0.78 |
| I | 0.89 | |
| RMSE (W/m2) | 38.61 | |
| n | 716 |
Note: LE, latent heat flux; RMSE (W/m2), root-mean-square error; R2, coefficient of determination; n, number of data points.
Table A2.
Summary of transpiration fraction (T/ET) of typical ecosystems estimated by different method at daily time interval in the HRB.
Table A2.
Summary of transpiration fraction (T/ET) of typical ecosystems estimated by different method at daily time interval in the HRB.
| Reference | Approach | Dominated Vegetation | T/ET | |
|---|---|---|---|---|
| Growing Season | Whole Year | |||
| Su et al. [47] | Lysimeters | T. ramosissima | 0.37–0.50 | N/A |
| Zhao et al. [31] | Sap flow measurement | Calligonum L. | 0.64 | N/A |
| Zhou et al. [48] | uWUE | Alpine meadow | 0.55 | 0.51 |
| Cropland | 0.63 | 0.52 | ||
| P. euphratica | 0.55 | 0.53 | ||
| Tong et al. [46] | Two-source model | Alpine meadow | 0.79 ± 0.12 | 0.51 ± 0.26 |
| Alpine swamp meadow | 0.55 ± 0.23 | 0.31 ± 0.28 | ||
| Cropland | 0.80 ± 0.13 | 0.53 ± 0.26 | ||
| P. euphratica | 0.67 ± 0.07 | 0.52 ± 0.17 | ||
| T. ramosissima | 0.67 ± 0.06 | 0.50 ± 0.20 | ||
Note: N/A, not available; uWUE, underlying water use efficiency.
References
- Hostetler, S.W. Hydrological and Thermal Response of Lakes to Climate: Description and Modeling. In Physics and Chemistry of Lakes; Lerman, A., Imboden, D.M., Gat, J.R., Eds.; Springer: Berlin/Heidelberg, Germany, 1995; pp. 63–82. ISBN 978-3-642-85132-2. [Google Scholar]
- Yapiyev, V.; Sagintayev, Z.; Inglezakis, V.; Samarkhanov, K.; Verhoef, A. Essentials of Endorheic Basins and Lakes: A Review in the Context of Current and Future Water Resource Management and Mitigation Activities in Central Asia. Water 2017, 9, 798. [Google Scholar] [CrossRef]
- Gao, B.; Qin, Y.; Wang, Y.; Yang, D.; Zheng, Y. Modeling Ecohydrological Processes and Spatial Patterns in the Upper Heihe Basin in China. Forests 2015, 7, 10. [Google Scholar] [CrossRef]
- Stone, R. Saving Iran’s great salt lake. Science 2015, 349, 1044–1047. [Google Scholar] [CrossRef] [PubMed]
- Cheng, G.D.; Zhao, C.Y. An Integrated Study of Ecological and Hydrological Processes in the Inland River Basin of the Arid Regions, China. Adv. Earth Sci. 2008, 23, 1005–1012. [Google Scholar]
- Zhu, G.-F.; Zhang, K.; Li, X.; Liu, S.-M.; Ding, Z.-Y.; Ma, J.-Z.; Huang, C.-L.; Han, T.; He, J.-H. Evaluating the complementary relationship for estimating ET using the multi-site data across north China. Agric. For. Meteorol. 2016, 230, 33–44. [Google Scholar] [CrossRef]
- Wang, P.; Li, X.-Y.; Huang, Y.; Liu, S.; Xu, Z.; Wu, X.; Ma, Y.-J. Numerical modeling the isotopic composition of ET in an arid artificial oasis cropland ecosystem with high-frequency water vapor isotope measurement. Agric. For. Meteorol. 2016, 230, 79–88. [Google Scholar] [CrossRef]
- Bai, X.; Zhang, L.-H.; Wang, Y.-B.; Tian, J.; He, C.-S.; Liu, G.-H. Variations of Soil Moisture under Different Land Use and Land Cover Types in the Qilian Mountain, China. Res. Soil Water Conserv. 2017, 24, 17–25. [Google Scholar] [CrossRef]
- Yang, Y.; Chen, R.-S.; Song, Y.-X.; Liu, J.-F.; Han, C.-T.; Liu, Z.-W. Measurement and estimation of grassland ET in a mountainous region at the upper reach of Heihe River basin, China. Chin. J. Appl. Ecol. 2013, 24, 1055–1062. [Google Scholar] [CrossRef]
- Qin, J.; Ding, Y.; Wu, J.; Gao, M.; Yi, S.; Zhao, C.; Ye, B.; Li, M.; Wang, S. Understanding the impact of mountain landscapes on water balance in the upper Heihe River watershed in northwestern China. J. Arid Land 2013, 5, 366–383. [Google Scholar] [CrossRef]
- Du, C.; Sun, F.; Yu, J.; Liu, X.; Chen, Y. New interpretation of the role of water balance in an extended Budyko hypothesis in arid regions. Hydrol. Earth Syst. Sci. 2016, 20, 393–409. [Google Scholar] [CrossRef]
- Li, X.; Cheng, G.; Ge, Y.; Li, H.; Han, F.; Hu, X.; Tian, W.; Tian, Y.; Pan, X.; Nian, Y.; et al. Hydrological Cycle in the Heihe River Basin and Its Implication for Water Resource Management in Endorheic Basins. J. Geophys. Res. Atmos. 2018, 123, 890–914. [Google Scholar] [CrossRef]
- Good, S.P.; Moore, G.W.; Miralles, D.G. A mesic maximum in biological water use demarcates biome sensitivity to aridity shifts. Nat. Ecol. Evol. 2017, 1, 1883–1888. [Google Scholar] [CrossRef] [PubMed]
- Wen, X.; Yang, B.; Sun, X.; Lee, X. ET partitioning through in-situ oxygen isotope measurements in an oasis cropland. Agric. For. Meteorol. 2016, 230, 89–96. [Google Scholar] [CrossRef]
- Wang, K.; Dickinson, R.E. A review of global terrestrial ET: Observation, modeling, climatology, and climatic variability: GLOBAL TERRESTRIAL ET. Rev. Geophys. 2012, 50. [Google Scholar] [CrossRef]
- Ma, N.; Wang, N.-A.; Wang, P.-L.; Sun, Y.-M.; Dong, C.-Y. Temporal and Spatial Variation Characteristics and Quantification of the Affects Factors for Reference ET in Heihe River Basin. J. Nat. Resour. 2012, 27, 975–989. [Google Scholar]
- Cheng, G.-D.; Xiao, H.-L.; Fu, B.-J.; Xiao, D.-N.; Zheng, C.-M.; Kang, S.-Z.; Yan, X.-D.; Wang, Y.; An, L.-Z.; Li, X.-B.; et al. Advances in Synthetic Research on the Eco-hydrological Process of the Heihe River Basin. Adv. Earth. Sci. 2014, 29, 431–437. [Google Scholar] [CrossRef]
- Yao, Y.; Tian, Y.; Andrews, C.; Li, X.; Zheng, Y.; Zheng, C. Role of groundwater in the dryland ecohydrological system: A case study of the Heihe River Basin. J. Geophys. Res. Atmos. 2018, 123, 6760–6776. [Google Scholar] [CrossRef]
- Beck, H.E.; Zimmermann, N.E.; McVicar, T.R.; Vergopolan, N.; Berg, A.; Wood, E.F. Present and future Köppen-Geiger climate classification maps at 1-km resolution. Sci. Data 2018, 5, 1–12. [Google Scholar] [CrossRef]
- Liu, S.M.; Xu, Z.W.; Wang, W.Z.; Jia, Z.Z.; Zhu, M.J.; Bai, J.; Wang, J.M. A comparison of eddy-covariance and large aperture scintillometer measurements with respect to the energy balance closure problem. Hydrol. Earth Syst. Sci. 2011, 15, 1291–1306. [Google Scholar] [CrossRef]
- Xu, Z.; Liu, S.; Li, X.; Shi, S.; Wang, J.; Zhu, Z.; Xu, T.; Wang, W.; Ma, M. Intercomparison of surface energy flux measurement systems used during the HiWATER-MUSOEXE: INTERCOMPARISON OF FLUX INSTRUMENTS. J. Geophys. Res. Atmos. 2013, 118, 13140–13157. [Google Scholar] [CrossRef]
- Reichstein, M.; Falge, E.; Baldocchi, D.; Papale, D.; Aubinet, M.; Berbigier, P.; Bernhofer, C.; Buchmann, N.; Gilmanov, T.; Granier, A.; et al. On the separation of net ecosystem exchange into assimilation and ecosystem respiration: Review and improved algorithm. Glob. Change Biol. 2005, 11, 1424–1439. [Google Scholar] [CrossRef]
- Liu, S.; Ahmed, S.E.; Ma, L.Y. Influence diagnostics in the linear regression model with stochastic linear restrictions. Pak. J. Stat. 2009, 25, 647–662. [Google Scholar]
- Qiao, C.; Sun, R.; Xu, Z.; Zhang, L.; Liu, L.; Hao, L.; Jiang, G. A Study of Shelterbelt Transpiration and Cropland ET in an Irrigated Area in the Middle Reaches of the Heihe River in Northwestern China. IEEE Geosci. Remote Sens. Lett. 2015, 12, 369–373. [Google Scholar] [CrossRef]
- Li, X.-J.; Zhang, F.-P.; Wang, H.-W.; Lei, S.-J.; Gao, Z. Analysis of the Spatio-Temporal Charateristics of Water Use Efficiency of Vegetation and Its Relationship with Climate in the Heihe River Basin. J. Desert Res. 2017, 37, 733–741. [Google Scholar]
- Xiao, Z.; Liang, S.; Wang, J.; Xiang, Y.; Zhao, X.; Song, J. Long-Time-Series Global Land Surface Satellite Leaf Area Index Product Derived From MODIS and AVHRR Surface Reflectance. IEEE Trans. Geosci. Remote Sens. 2016, 54, 5301–5318. [Google Scholar] [CrossRef]
- Yamanaka, T.; Kaihotsu, I.; Oyunbaatar, D.; Ganbold, T. Summertime soil hydrological cycle and surface energy balance on the Mongolian steppe. J. Arid Environ. 2007, 69, 65–79. [Google Scholar] [CrossRef]
- Zhang, X.; Chen, S.; Liu, M.; Pei, D.; Sun, H. Improved Water Use Efficiency Associated with Cultivars and Agronomic Management in the North China Plain. Agron. J. 2005, 97, 783–790. [Google Scholar] [CrossRef]
- Yu, X.-X.; Chen, L.-H. A Study on Water Balance of PROTECTIVE Forest Ecosystem in Loess Area. Acta Ecol. Sin. 1996, 16, 238–245. [Google Scholar]
- Yang, D.; Gao, B.; Jiao, Y.; Lei, H.; Zhang, Y.; Yang, H.; Cong, Z. A distributed scheme developed for eco-hydrological modeling in the upper Heihe River. Sci. China Earth Sci. 2015, 58, 36–45. [Google Scholar] [CrossRef]
- Zhao, W.; Liu, B.; Chang, X.; Yang, Q.; Yang, Y.; Liu, Z.; Cleverly, J.; Eamus, D. ET partitioning, stomatal conductance, and components of the water balance: A special case of a desert ecosystem in China. J. Hydrol. 2016, 538, 374–386. [Google Scholar] [CrossRef]
- Wen, J.; Wang, Y.-B.; Gao, Z.-Y.; Liu, G.-H. Soil Hydrological Characteristics of the Degrading Meadow in Permafrost Regions in the Beiluhe River Basin. J. Glaciol. Geocryol. 2013, 35, 929–937. [Google Scholar] [CrossRef]
- Chen, R.-S.; Yang, Y.; Han, C.-T.; Liu, J.-F.; Kang, E.-S.; Song, Y.-X.; Liu, Z.-W. Field Experimental Research on Hydrological Function over Several Typical Underlying Surfaces in the Cold Regions of Western China. Prog. Geogr. 2014, 29, 507–514. [Google Scholar] [CrossRef]
- Chen, Y.-L. Land-Use and Land-Cover Change and Its Impacts on ET in Inland River Basin of Arid Region; Zhejiang University: Hangzhou, China, 2018. [Google Scholar]
- Wang, H.-L.; Niu, J.-Y.; Wang, R.-Y.; Lv, X.-D. Impact of climate change on water requirement of main crops in irrigated oasis of Hexi corridor. Acta Pratac. Sin. 2011, 20, 245–251. [Google Scholar]
- Yang, B.; Wen, X.; Sun, X. Irrigation depth far exceeds water uptake depth inan oasis cropland in the middle reaches of Heihe River Basin. Sci. Rep. 2015, 5, 15206. [Google Scholar] [CrossRef] [PubMed]
- Geerts, S.; Raes, D. Deficit irrigation as an on-farm strategy to maximize crop water productivity in dry areas. Agric. Water Manag. 2009, 96, 1275–1284. [Google Scholar] [CrossRef]
- Fereres, E.; Soriano, M.A. Deficit irrigation for reducing agricultural water use. J. Exp. Bot. 2006, 58, 147–159. [Google Scholar] [CrossRef]
- Zhou, S. Concept, Modeling, and Application of the Underlying Water Use Efficiency for Terrestrial Ecosystems. Ph.D. Thesis, Tsinghua University, Beijing, China, 2017. [Google Scholar]
- Lupon, A.; Ledesma, J.L.J.; Bernal, S. Riparian ET shapes stream flow dynamics and water budgets in a Mediterranean catchment; Catchment hydrology/Modelling approaches. Hydrol. Earth Syst. Sci. 2018, 1–33. [Google Scholar] [CrossRef]
- Yuan, G.-F.; Luo, Y.; Shao, M.-A.; Zhang, P.; Zhu, X.-C. Evapotranspiration and its main controlling mechanism over the desert riparian forests in the lower Tarim River Basin. Sci. China Earth Sci. 2015, 58, 1032–1042. [Google Scholar] [CrossRef]
- Yu, T.-F.; Feng, Q.; Si, J.-H.; Zhang, X.-Y.; Zhao, C.-Y. Evapotranspiration of a Populus euphratica Oliv. forest and its controlling factors in the lower Heihe River Basin, Northwest China. Sci. Cold Arid. Reg. 2017, 9, 175–182. [Google Scholar] [CrossRef]
- Liljedahl, A.K.; Hinzman, L.D.; Kane, D.L.; Oechel, W.C.; Tweedie, C.E.; Zona, D. Tundra water budget and implications of precipitation underestimation. Water Resour. Res. 2017, 53, 6472–6486. [Google Scholar] [CrossRef]
- Zhang, Y.-Y.; Chen, X.; Gao, M.; Liu, X.-Q. Simulation of transpiration for typical xeromorphic plants in inland arid region of Northwestern China. Acta Ecol. Sin. 2021, 41, 7751–7762. [Google Scholar] [CrossRef]
- Wang, P.; Yamanaka, T. Application of a two-source model for partitioning ET and assessing its controls in temperate grasslands in central Japan: A two-source model of et in temperate grasslands. Ecohydrology 2014, 7, 345–353. [Google Scholar] [CrossRef]
- Tong, Y.; Wang, P.; Li, X.-Y.; Wang, L.; Wu, X.; Shi, F.; Bai, Y.; Li, E.; Wang, J.; Wang, Y. Seasonality of the Transpiration Fraction and Its Controls Across Typical Ecosystems Within the Heihe River Basin. J. Geophys. Res. Atmos. 2019, 124, 1277–1291. [Google Scholar] [CrossRef]
- Su, P.; Li, S.; Zhou, Z.; Shi, R.; Xie, T. Partitioning evapotranspiration of desert plants under different water regimes in the inland Heihe River Basin, Northwestern China. Arid Land Res. Manag. 2016, 30, 138–152. [Google Scholar] [CrossRef]
- Zhou, S.; Yu, B.; Zhang, Y.; Huang, Y.; Wang, G. Water use efficiency and evapotranspiration partitioning for three typical ecosystems in the Heihe River Basin, northwestern China. Agric. For. Meteorol. 2018, 253, 261–273. [Google Scholar] [CrossRef]
Publisher’s Note: MDPI stays neutral with regard to jurisdictional claims in published maps and institutional affiliations. |
© 2022 by the authors. Licensee MDPI, Basel, Switzerland. This article is an open access article distributed under the terms and conditions of the Creative Commons Attribution (CC BY) license (https://creativecommons.org/licenses/by/4.0/).