
Influence of Fines Content on the Stability of Volcanic Embankments under Rainfall and Earthquake

Abstract
1. Introduction
2. Materials and Methods
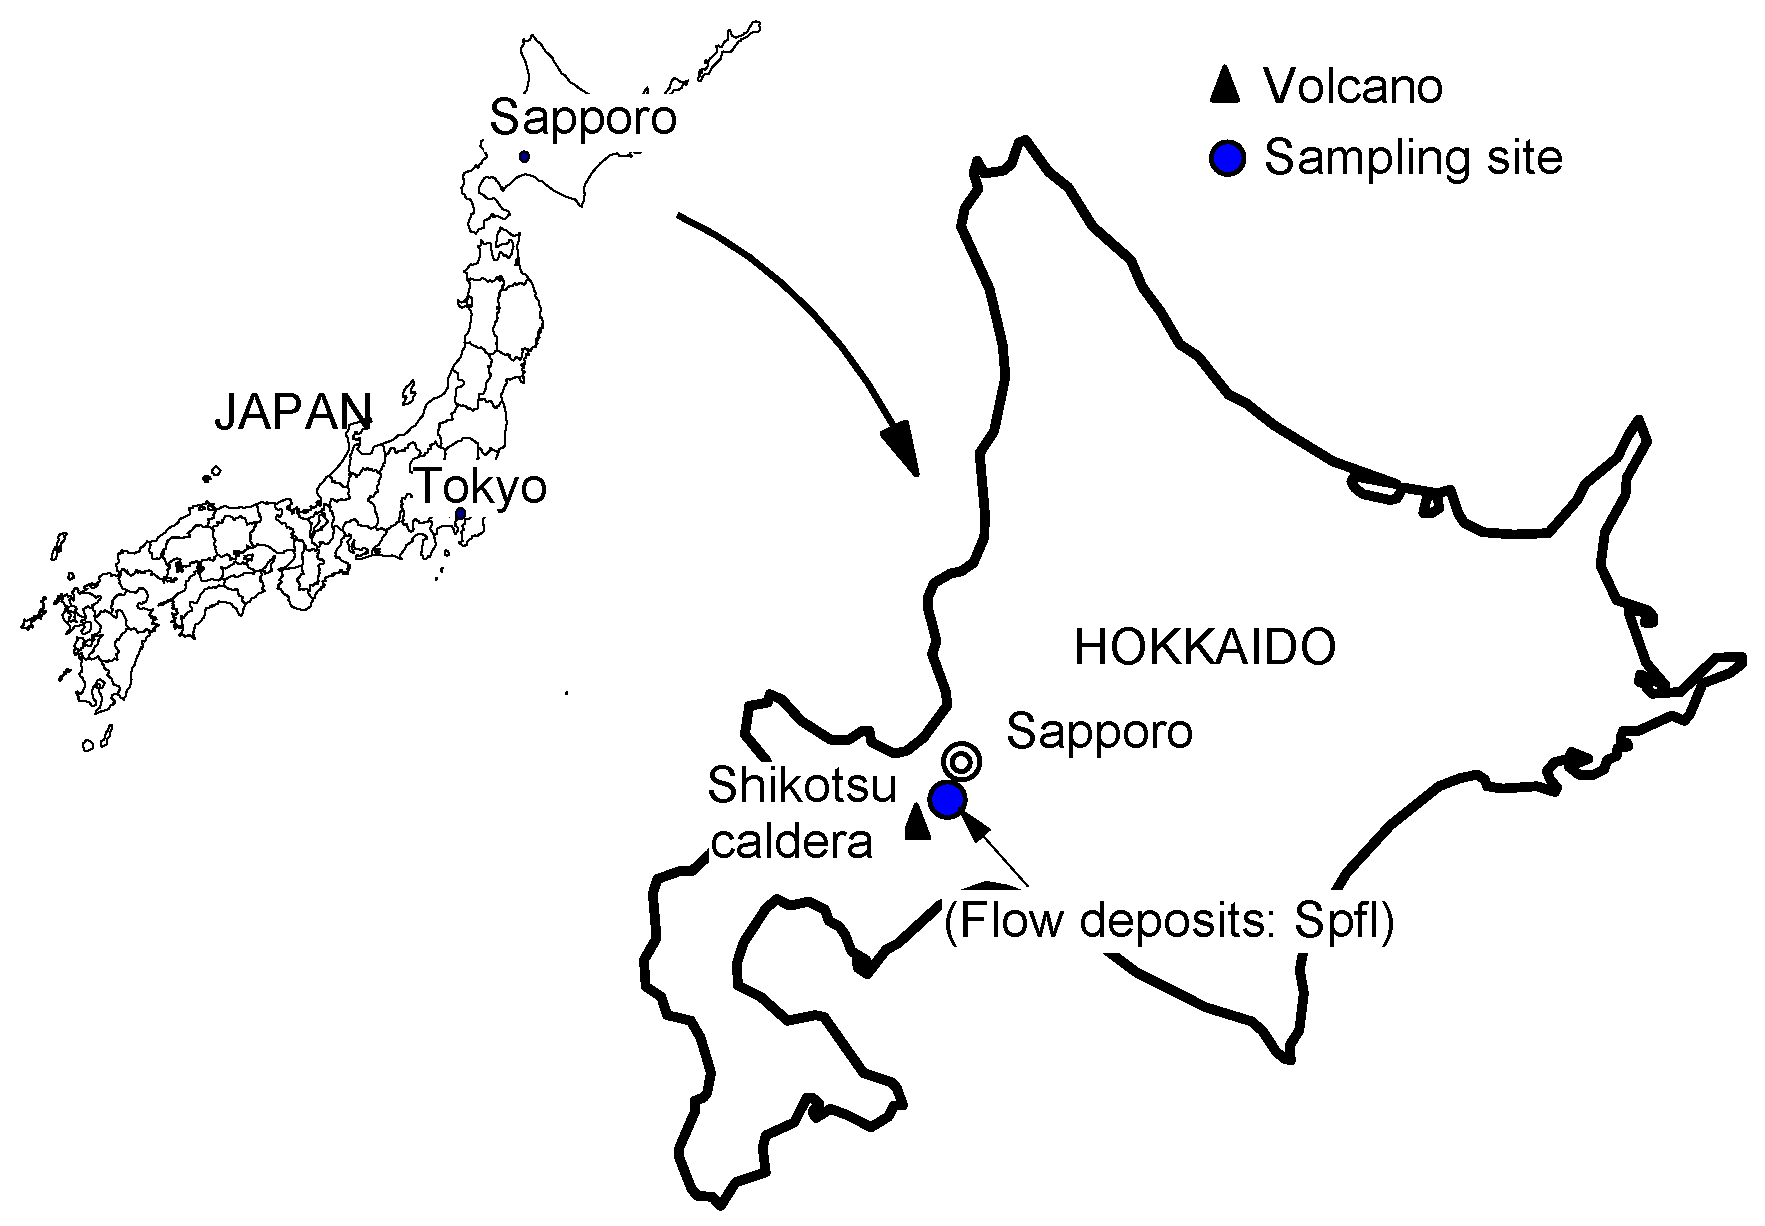
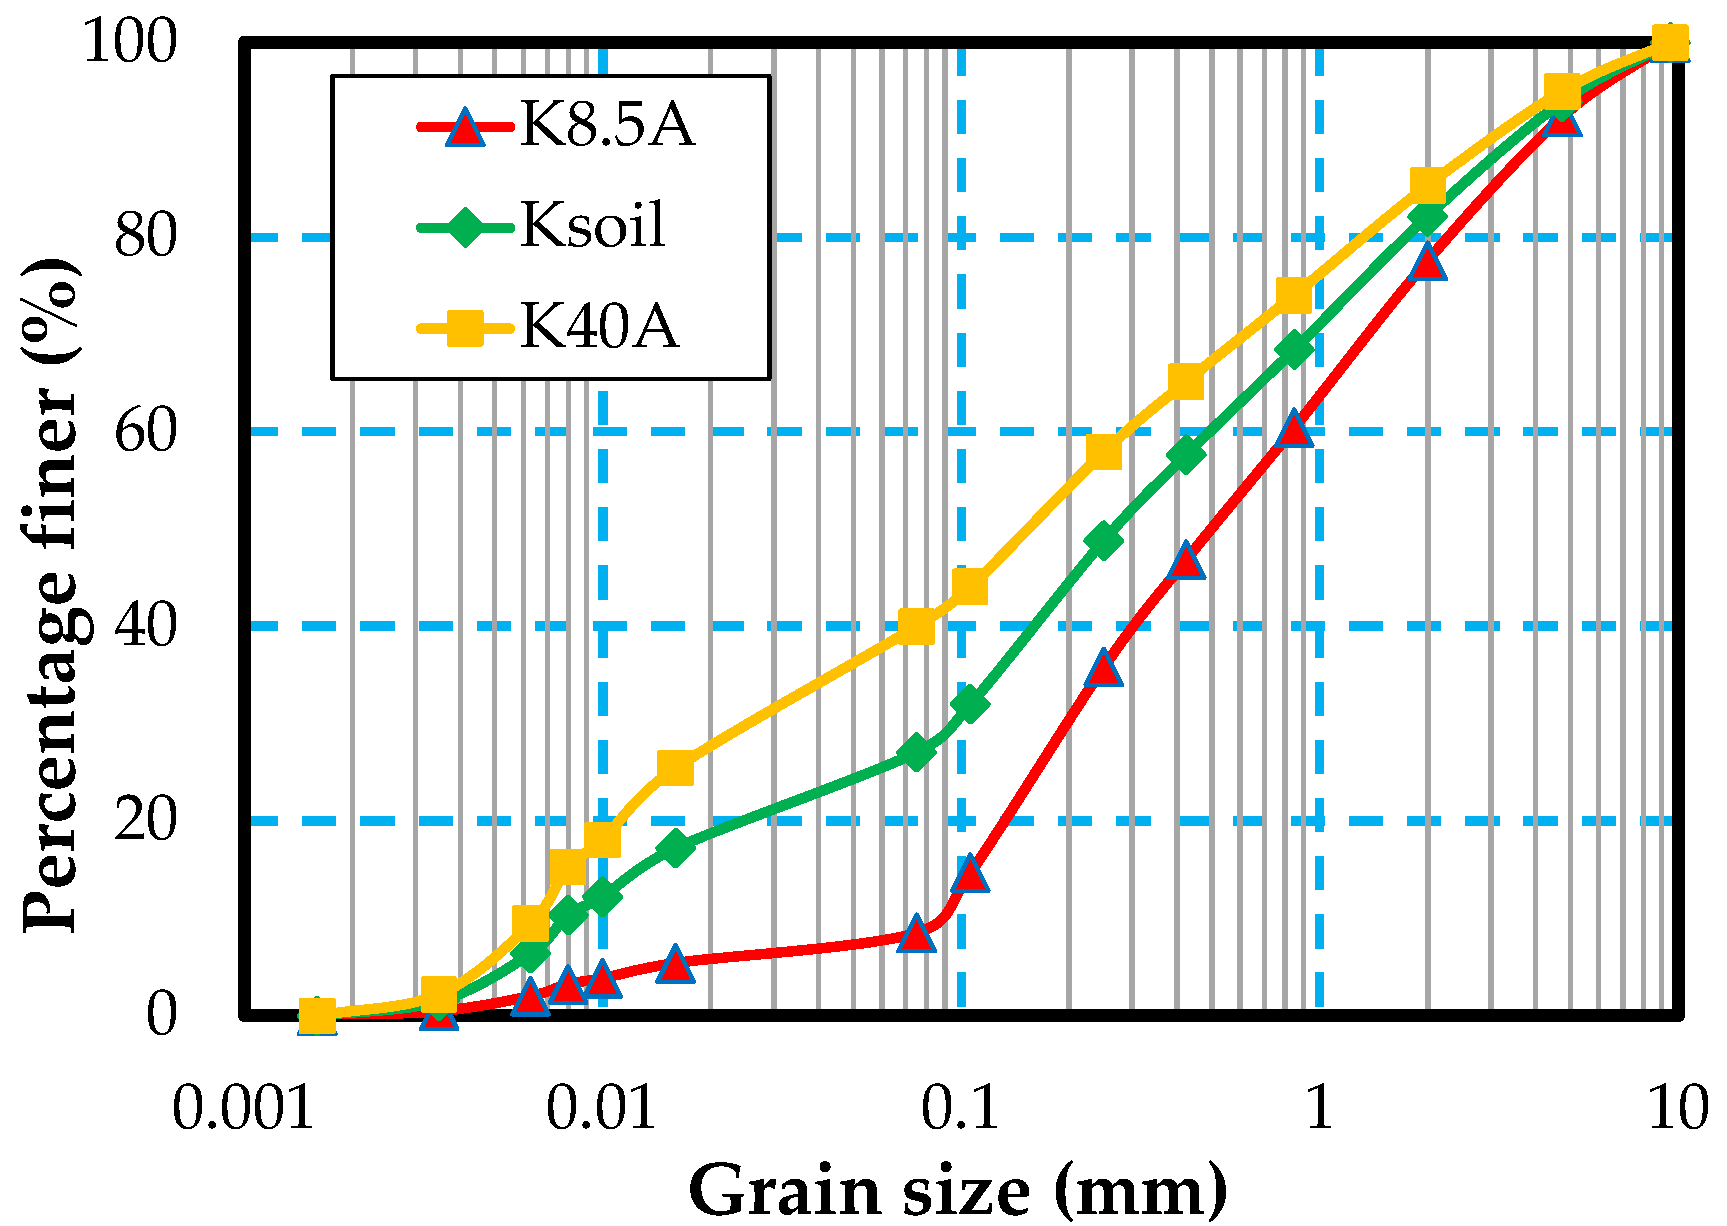
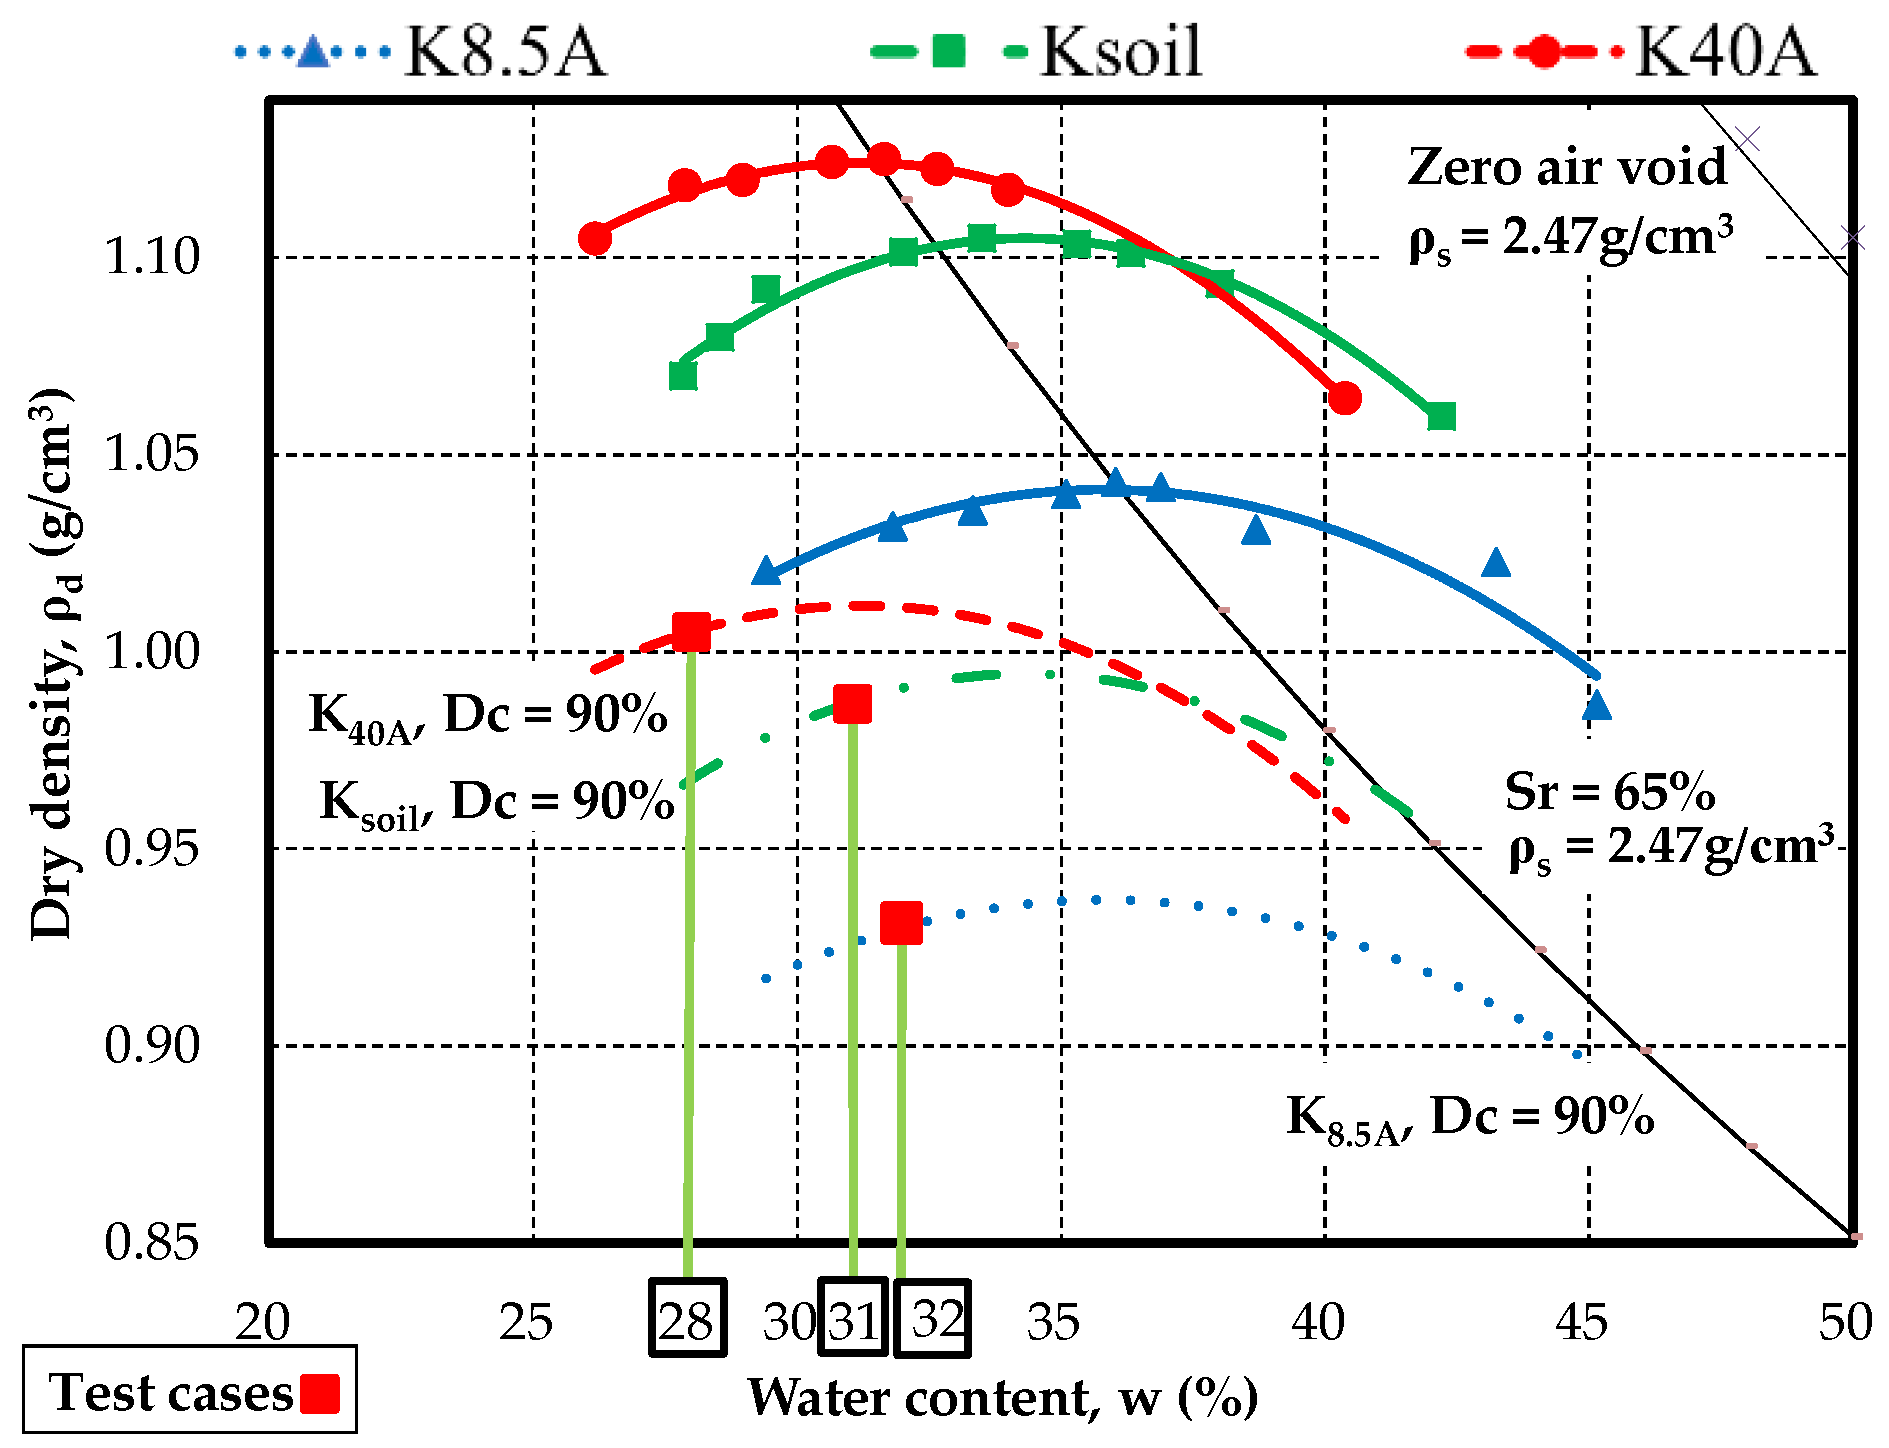
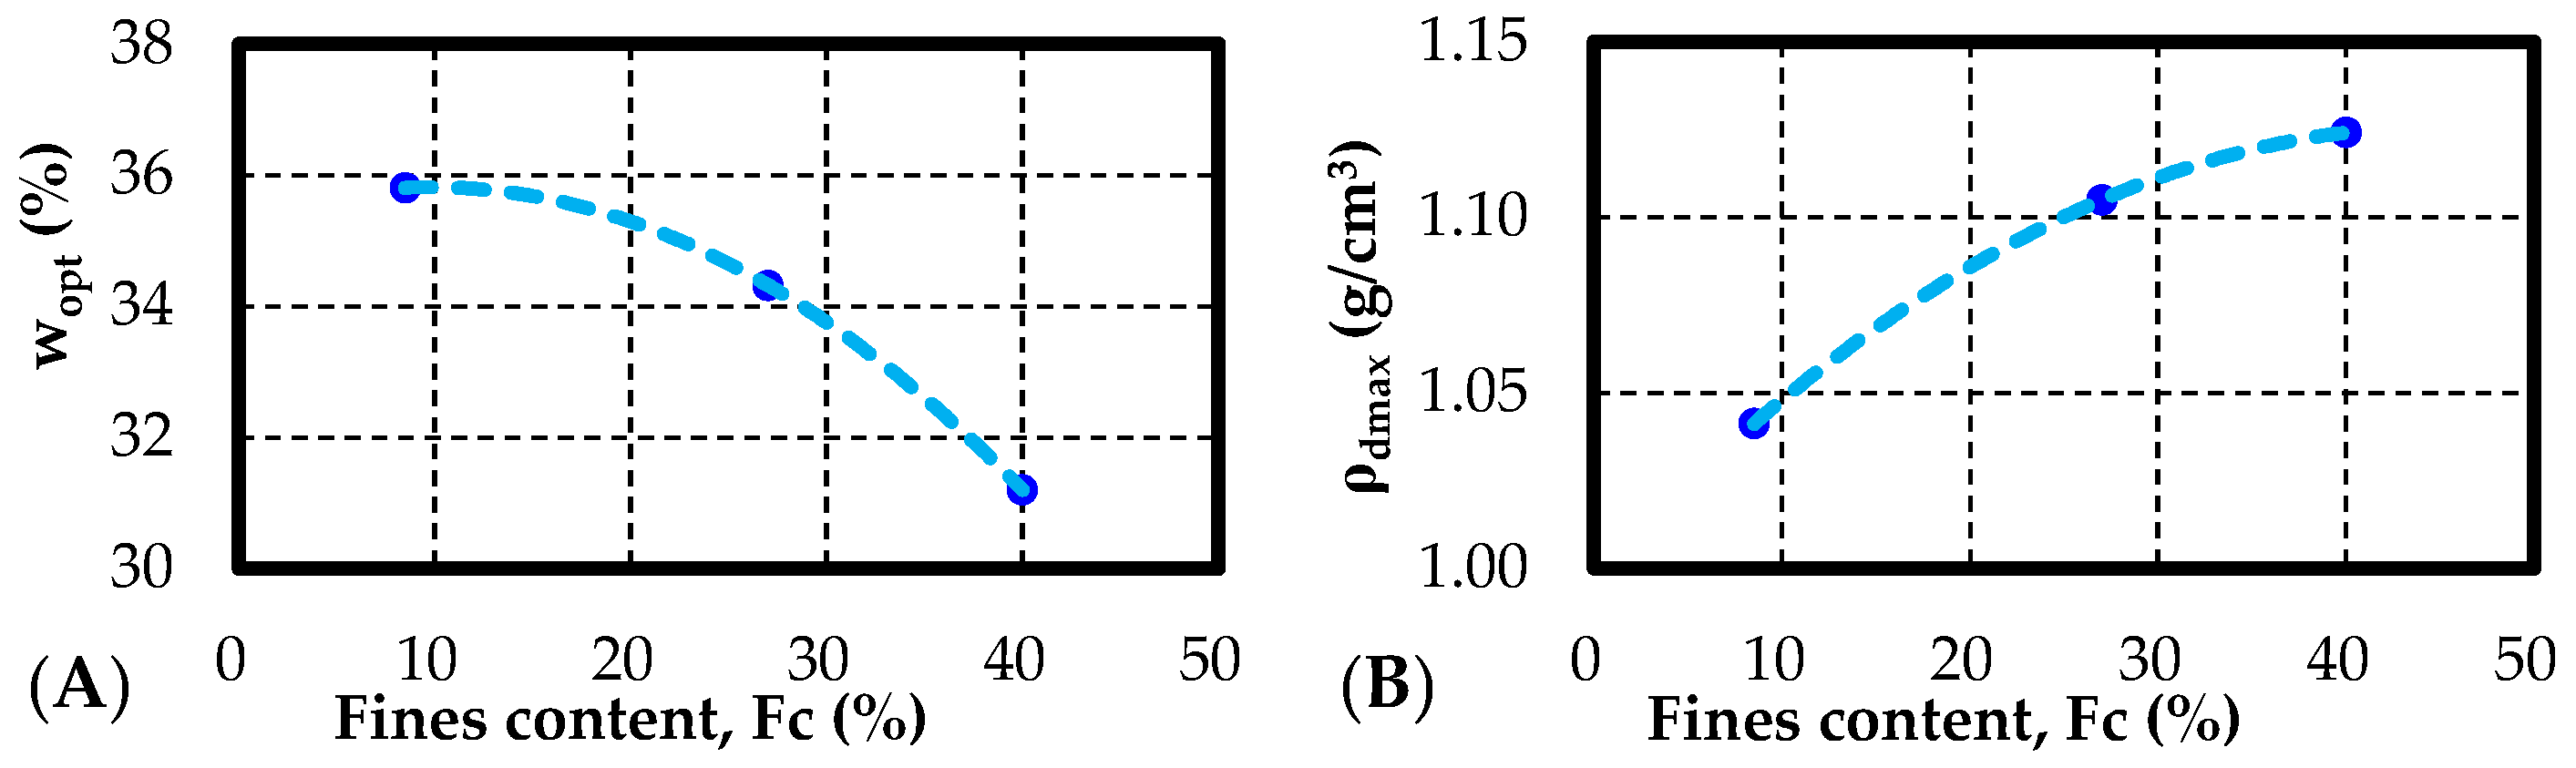
2.1. Test Materials
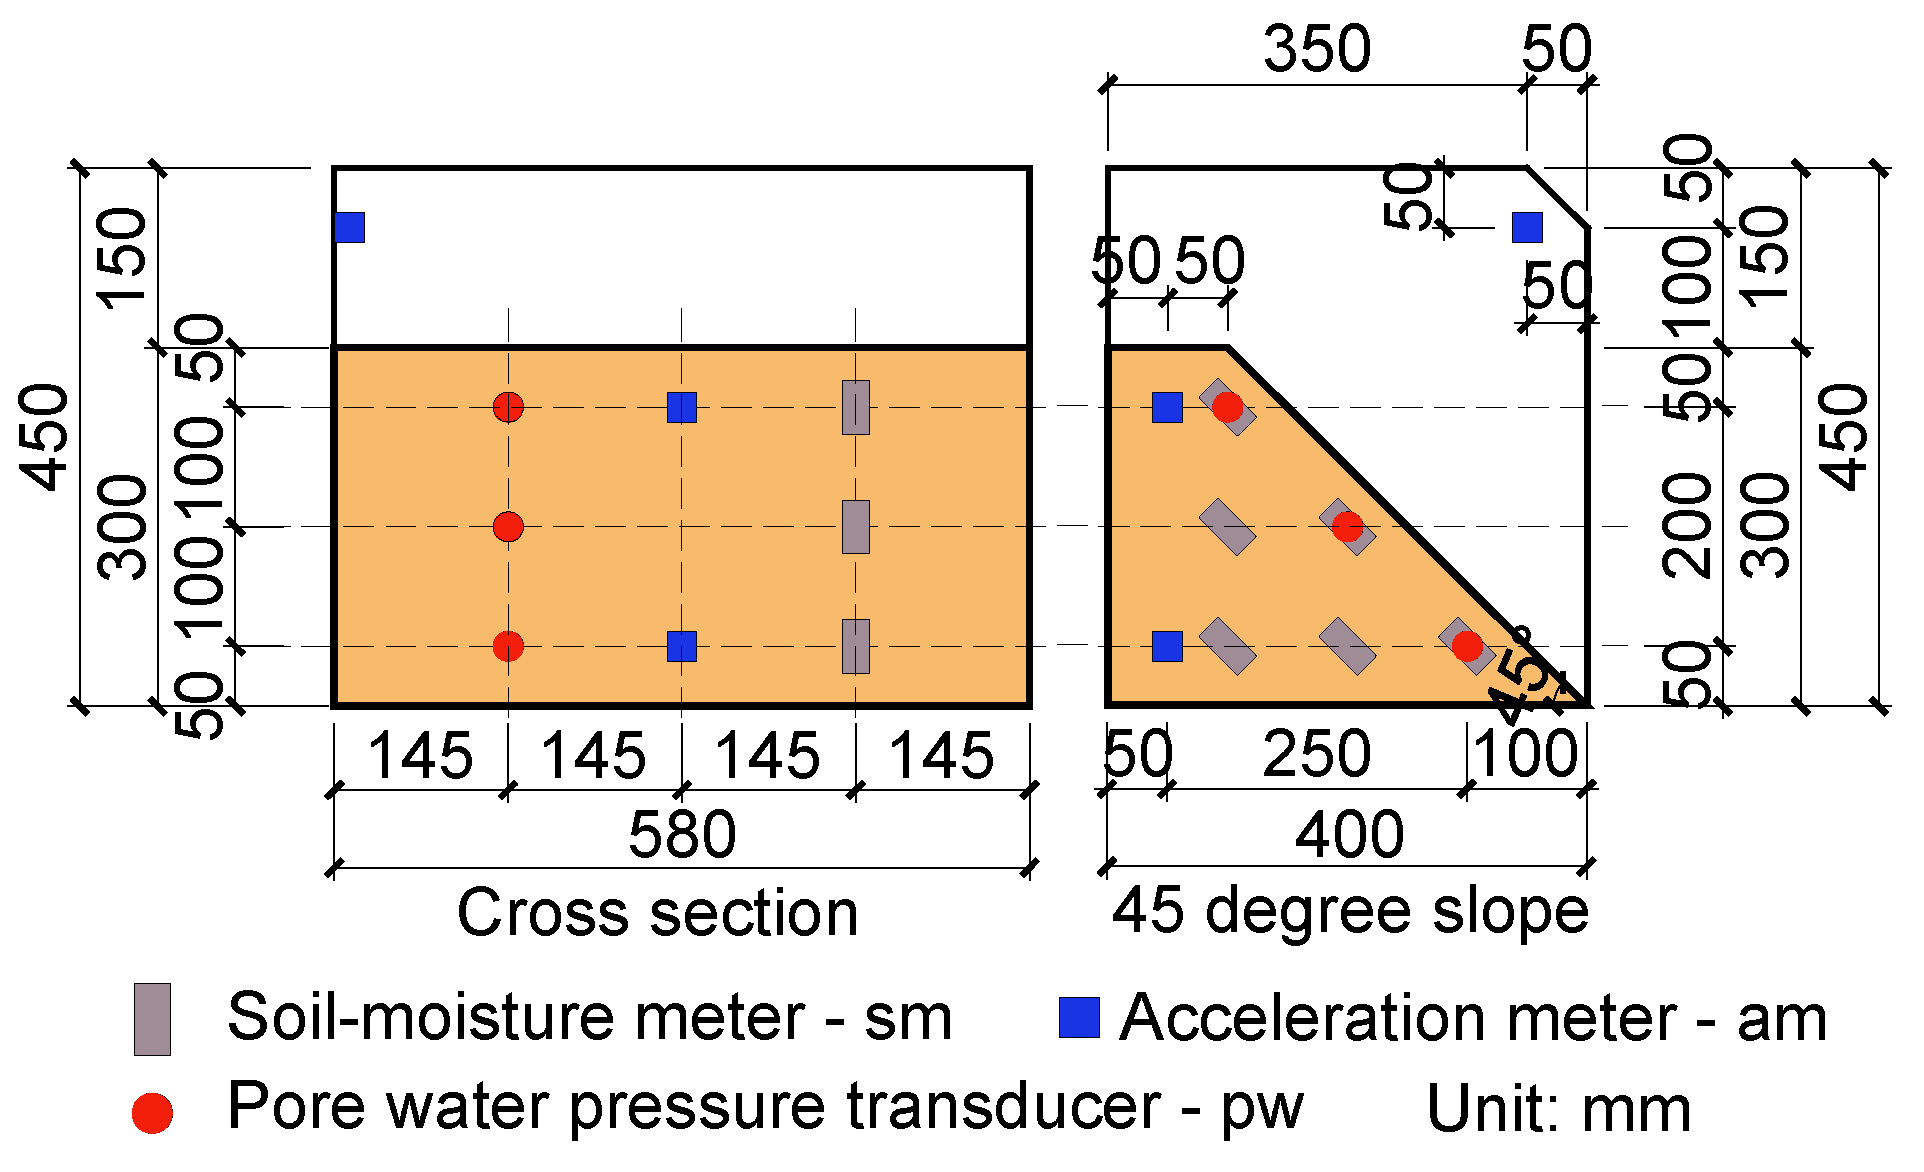
2.2. Test Apparatus and Procedures
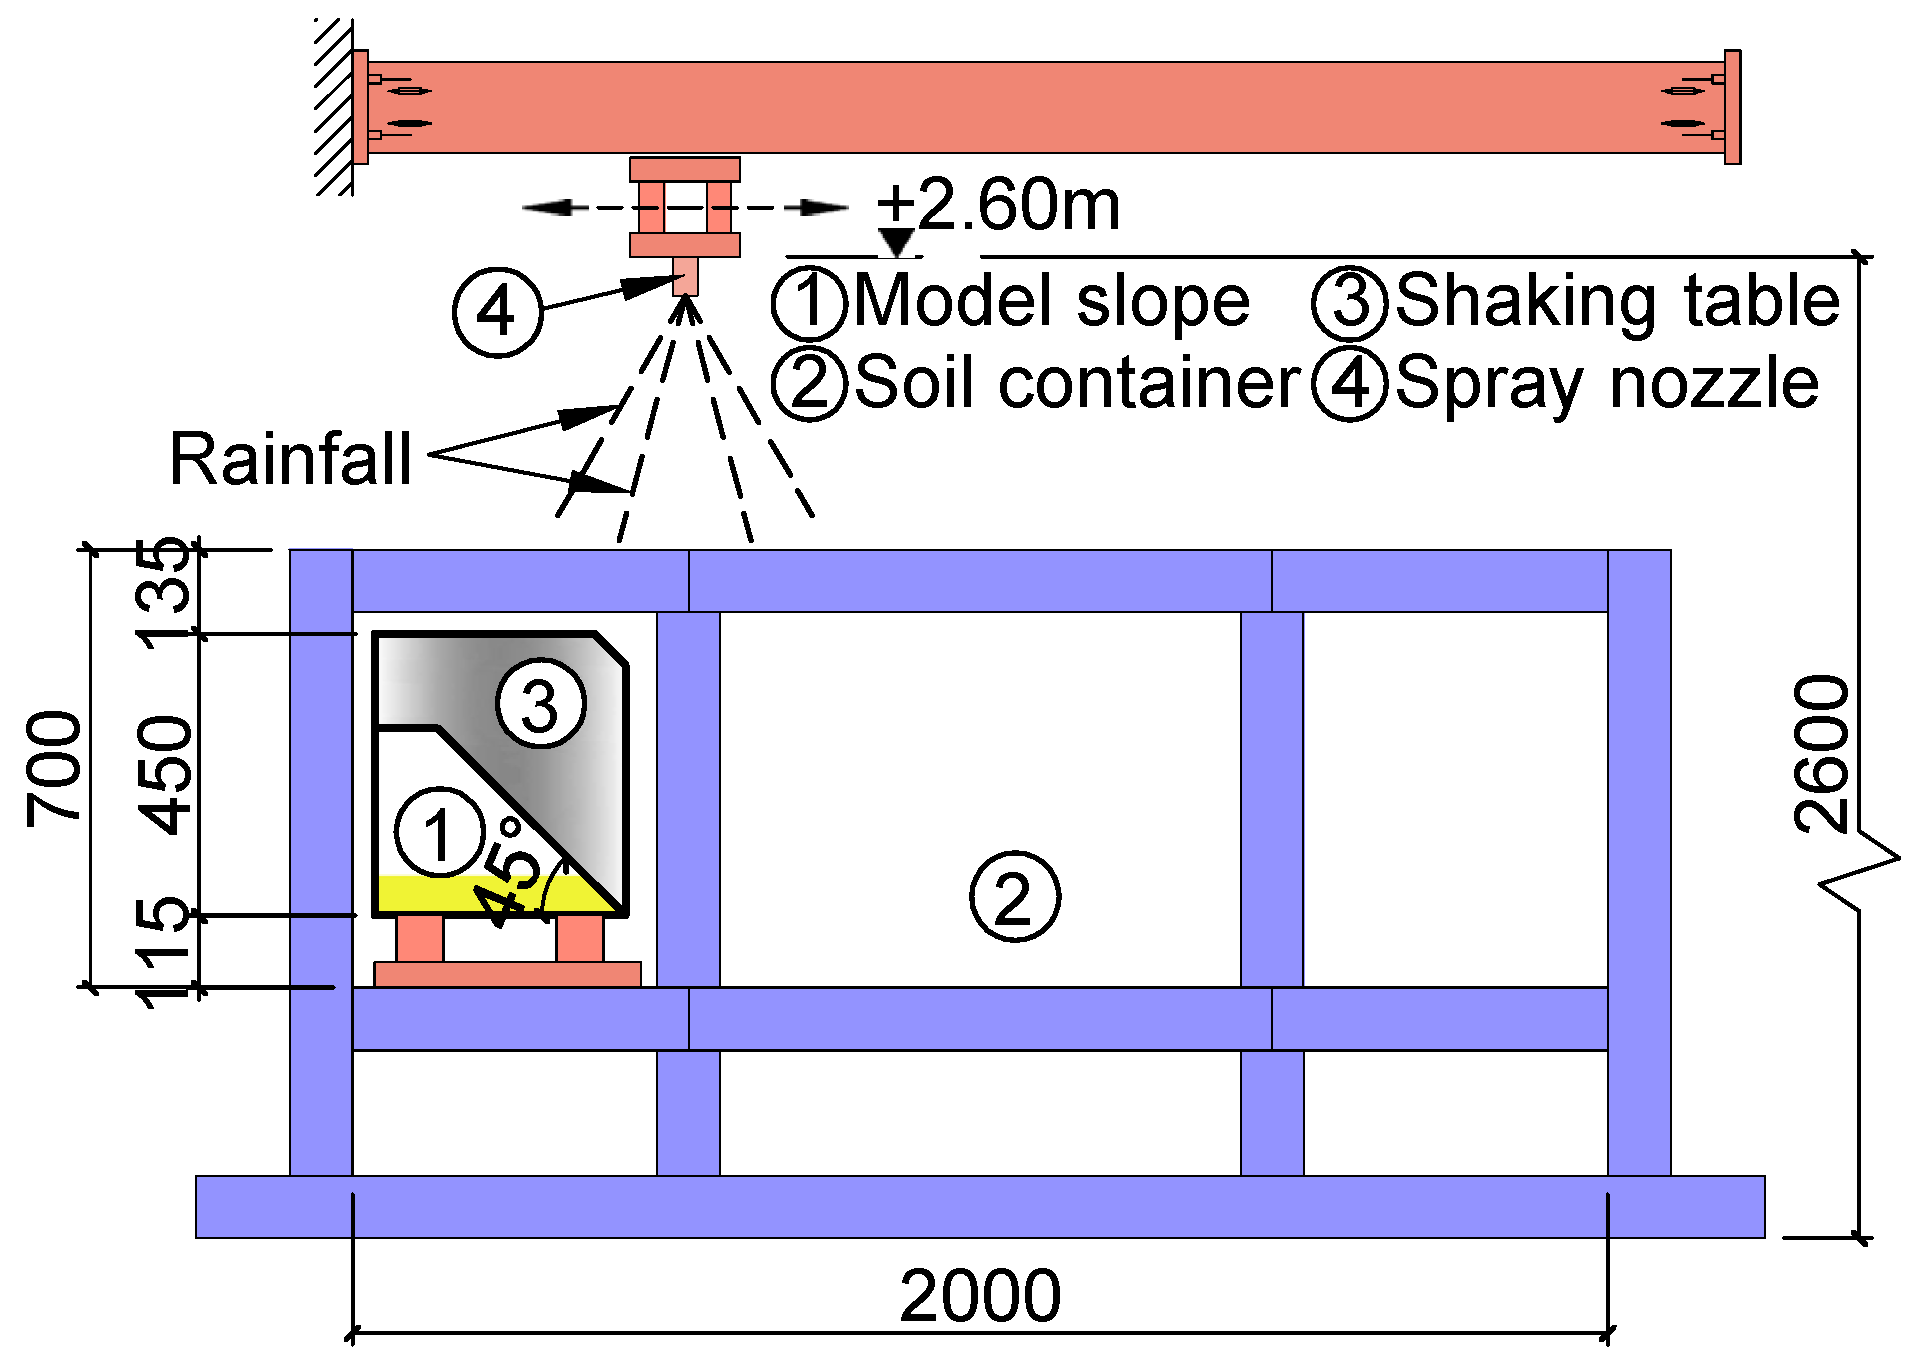
- Adjust the type, position, and water pressure of the spray nozzle installed at height G.L. + 2.6 m to obtain the rainfall intensity at the specified value (100 mm/h in this study). The acceleration is also set at 280 m/s2 as specified in Table 4;
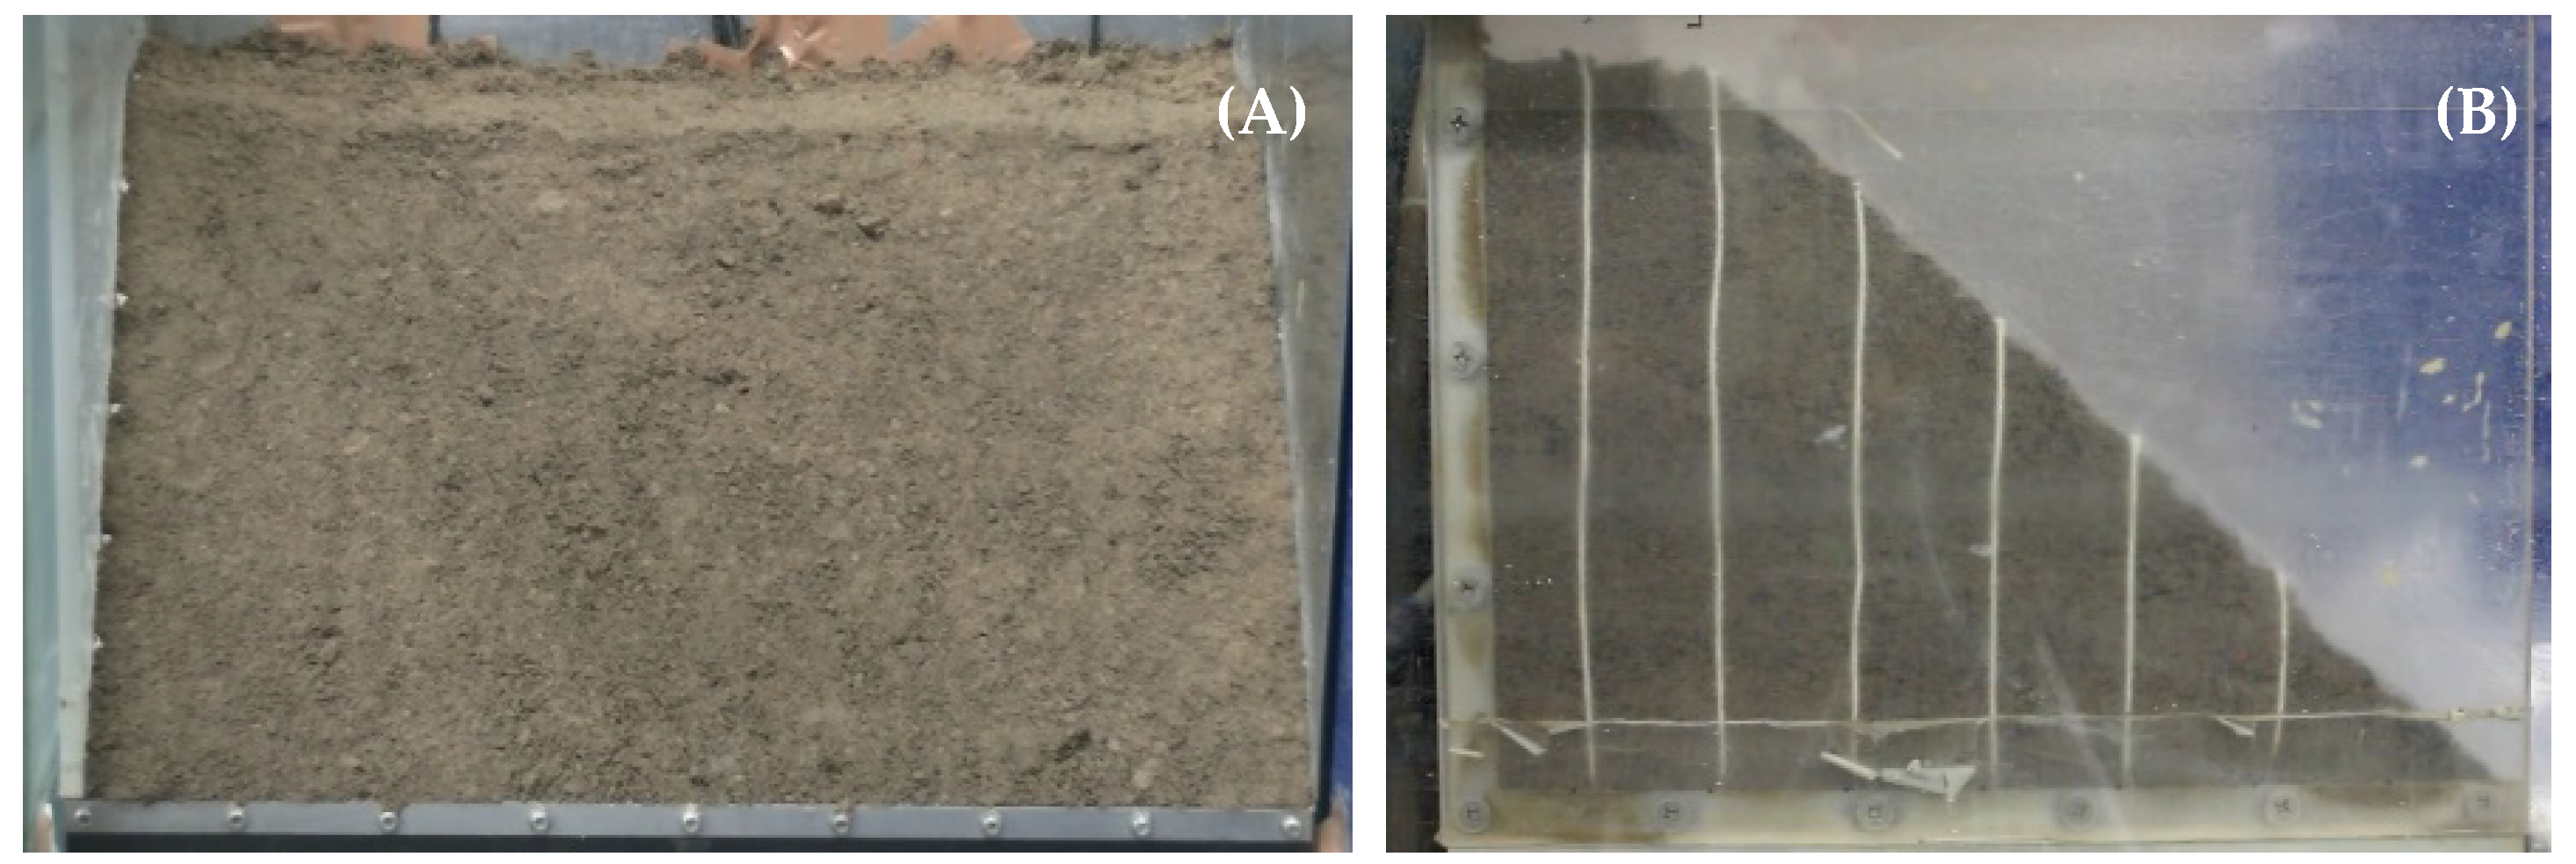
- After the slope model was completed, spray water from the spray nozzle shown in Figure 8 and simultaneously start measuring the pore water pressure transducers, soil moisture meters, and acceleration meters;
- When the amount of rainfall reaches a predetermined value, finish the rainfall test and carry out the seismic loading test.
3. Results and Analysis
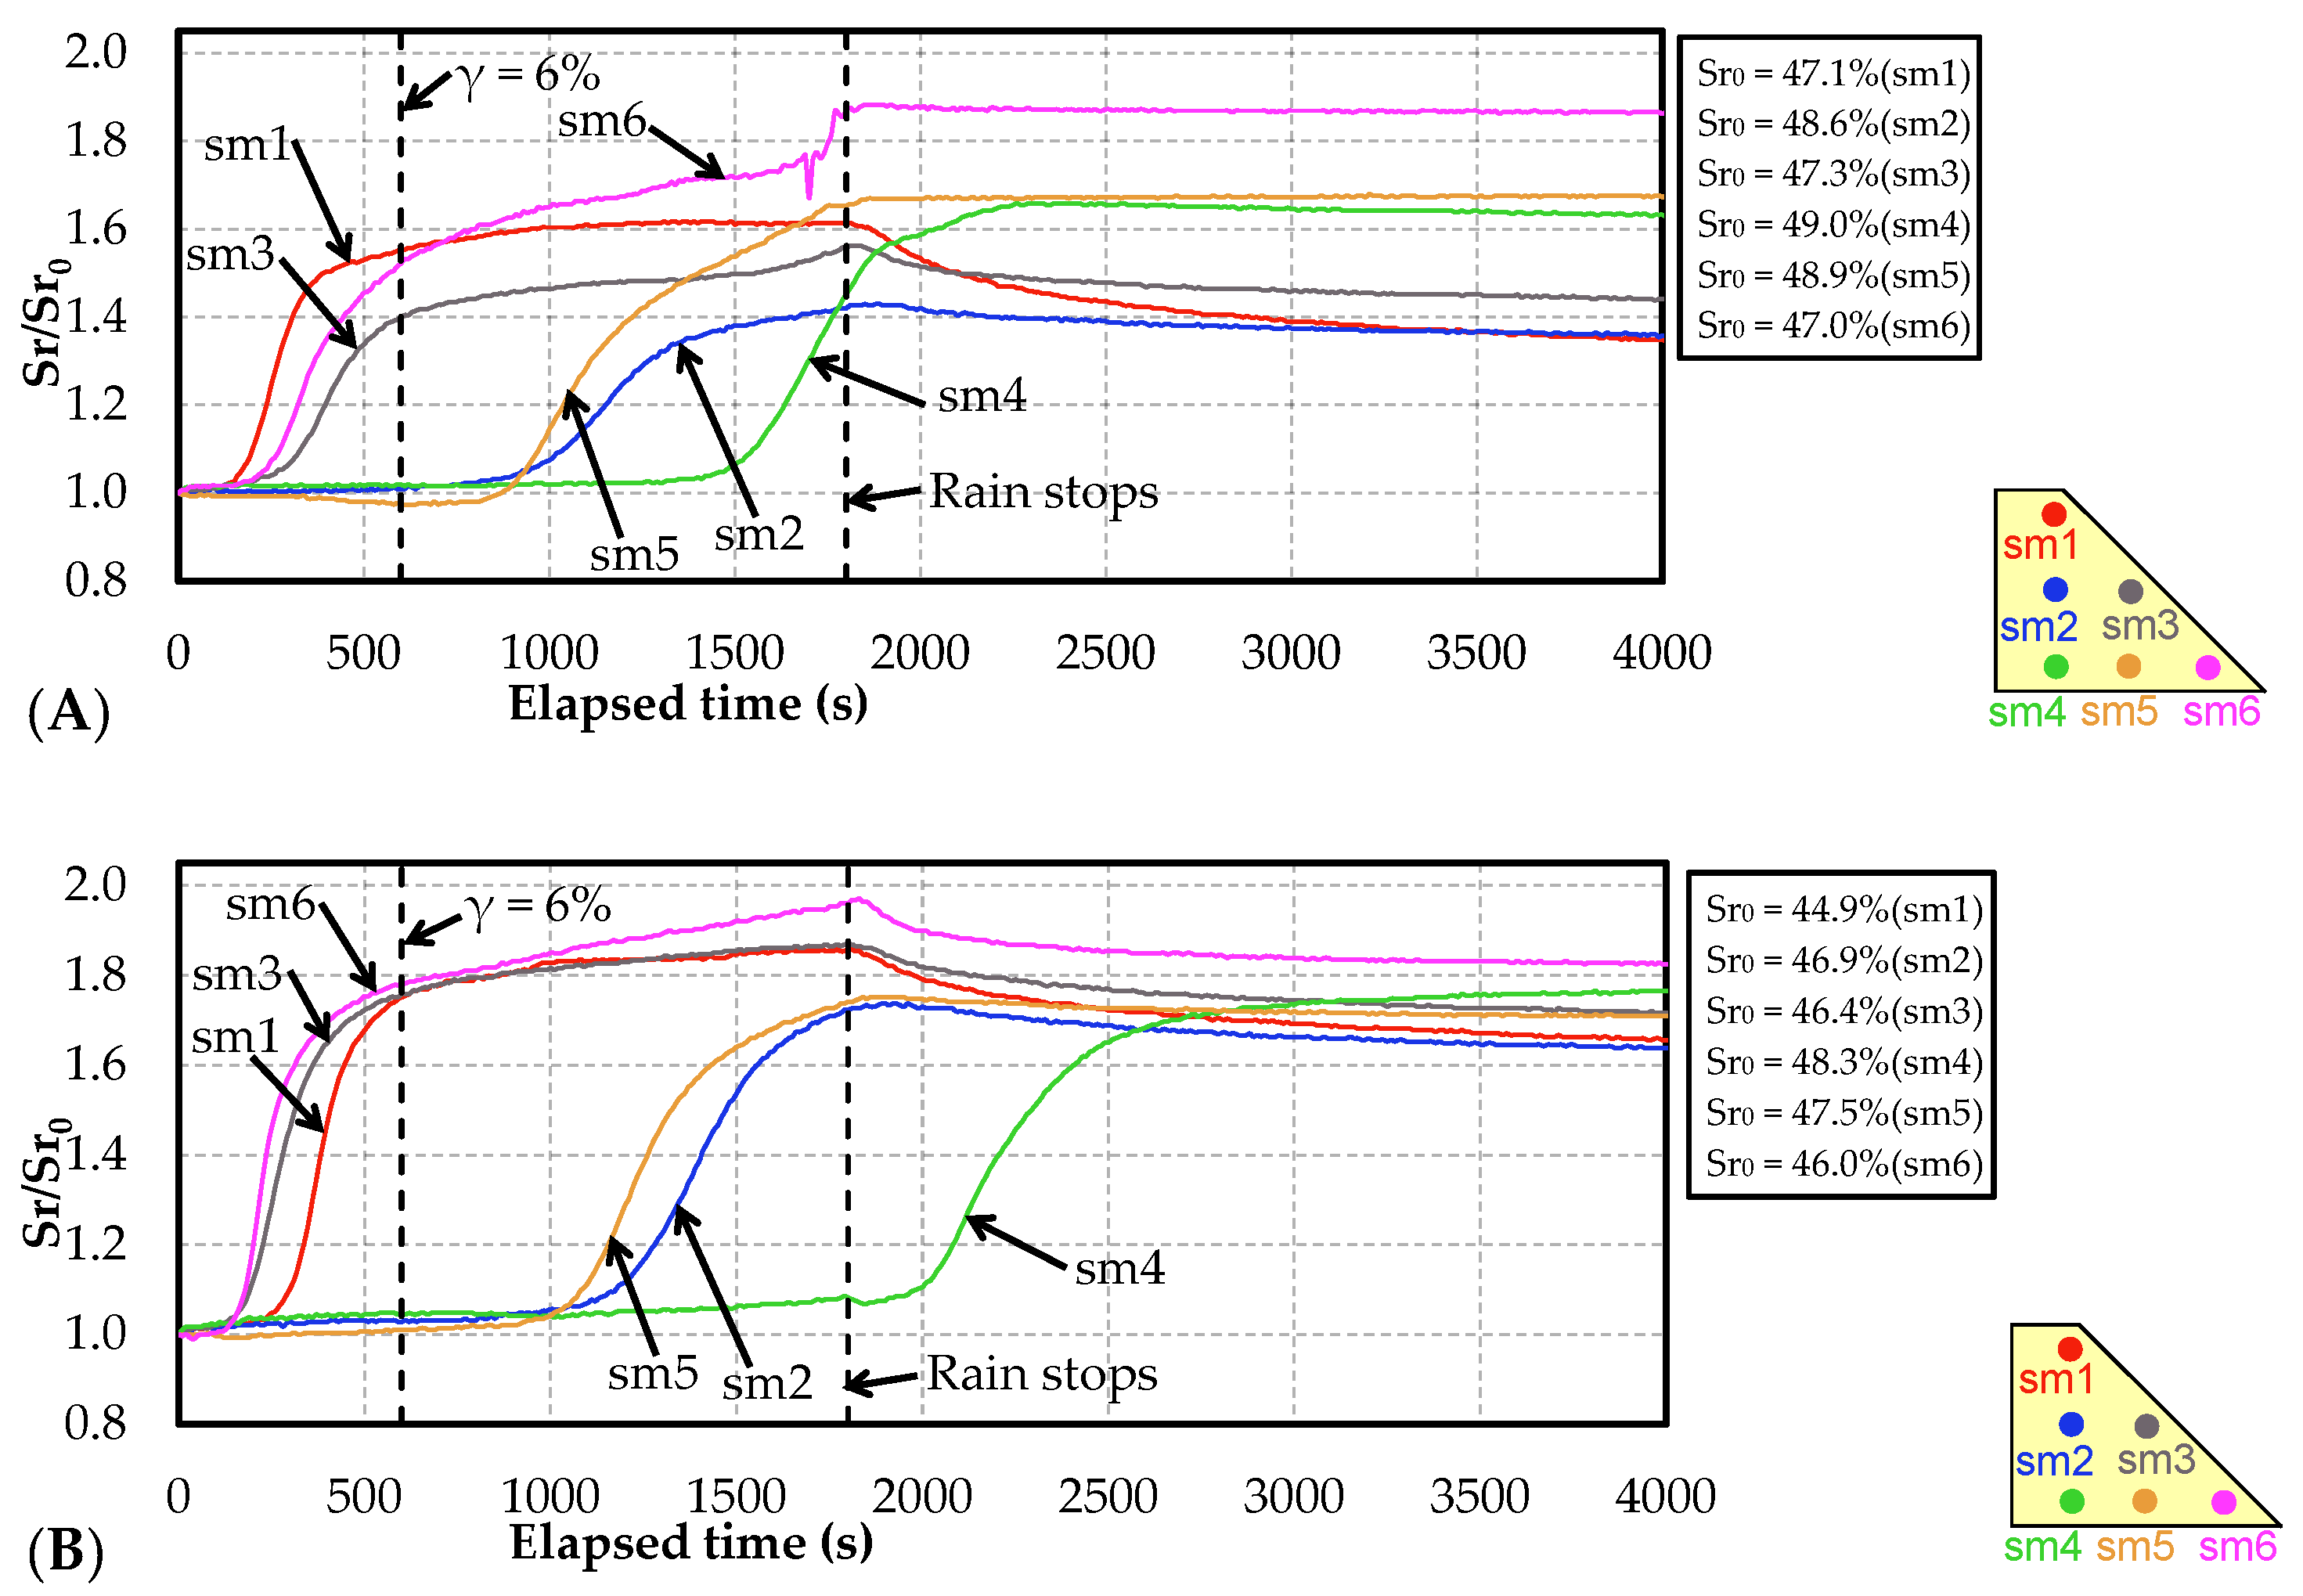
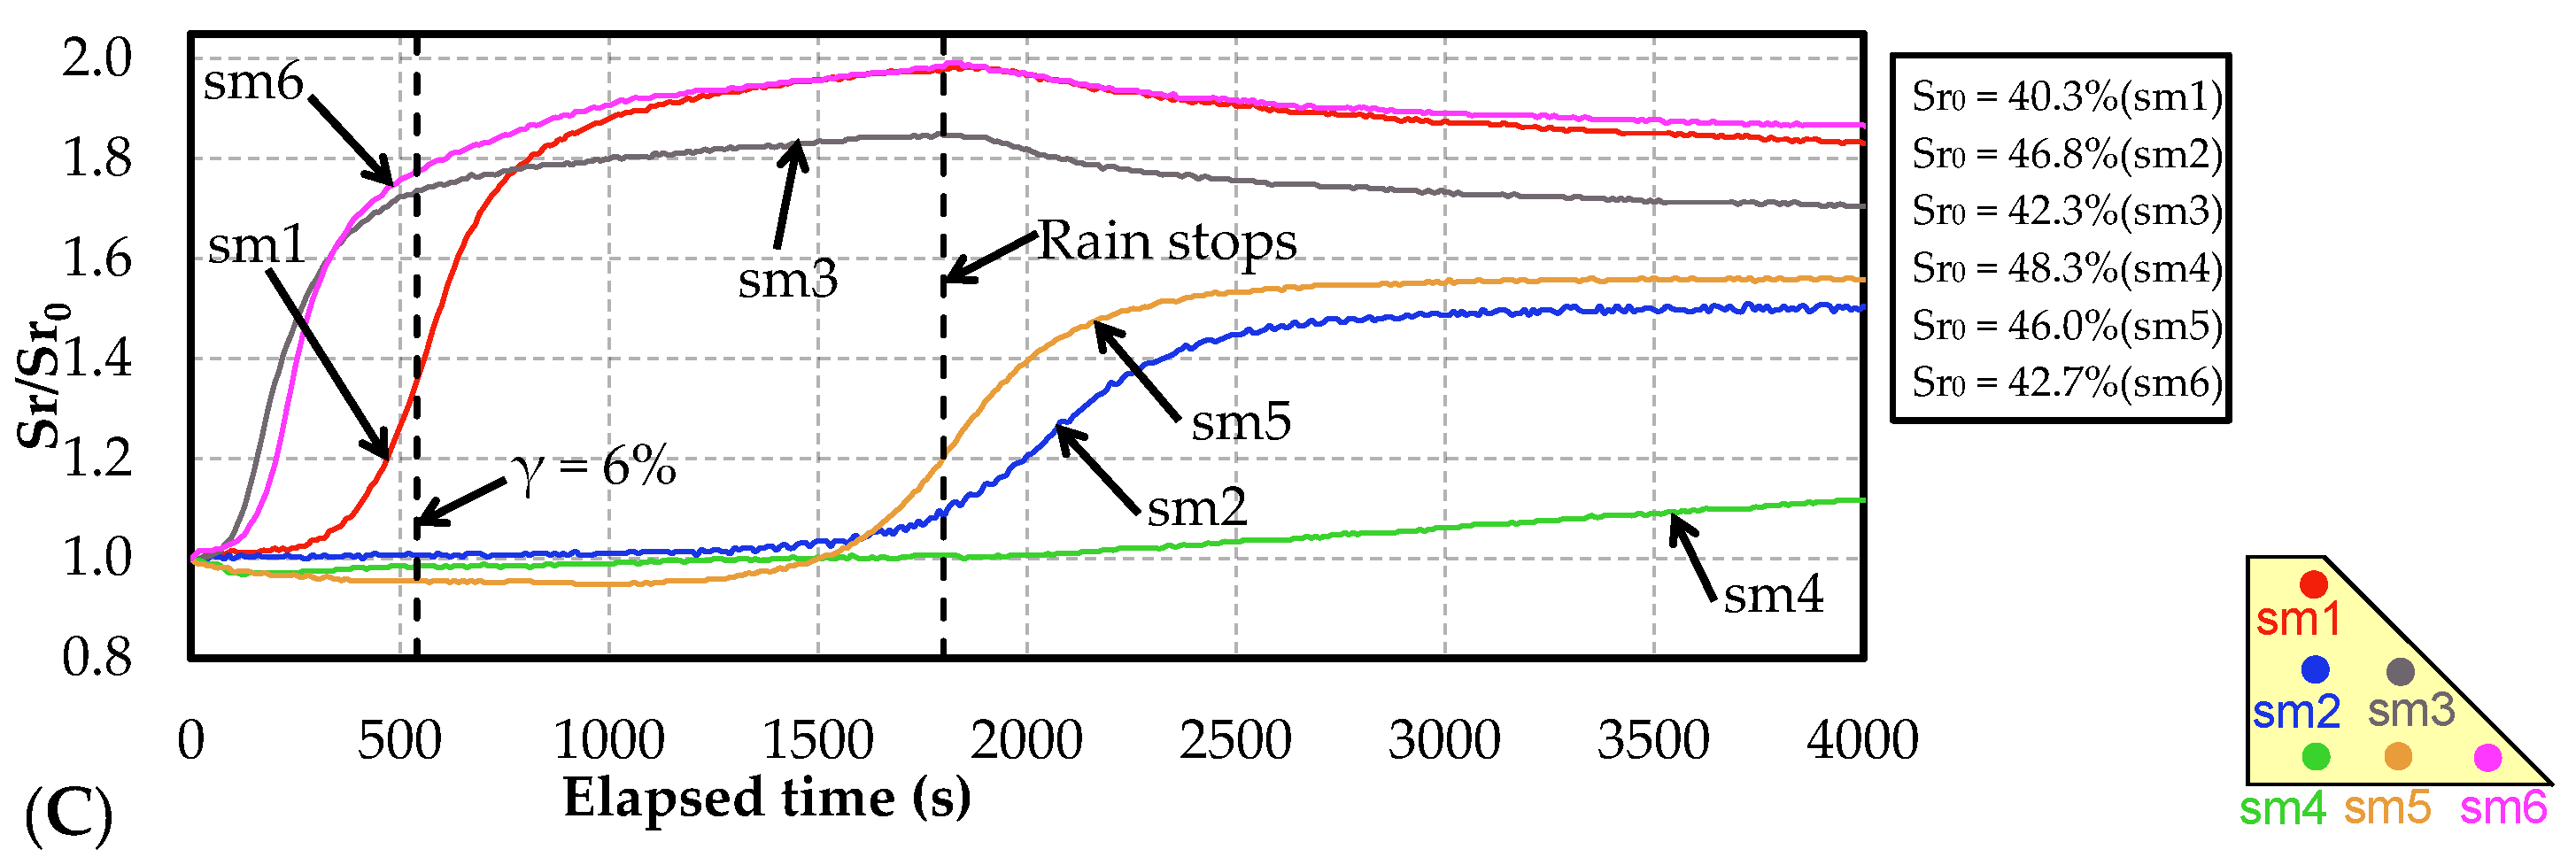
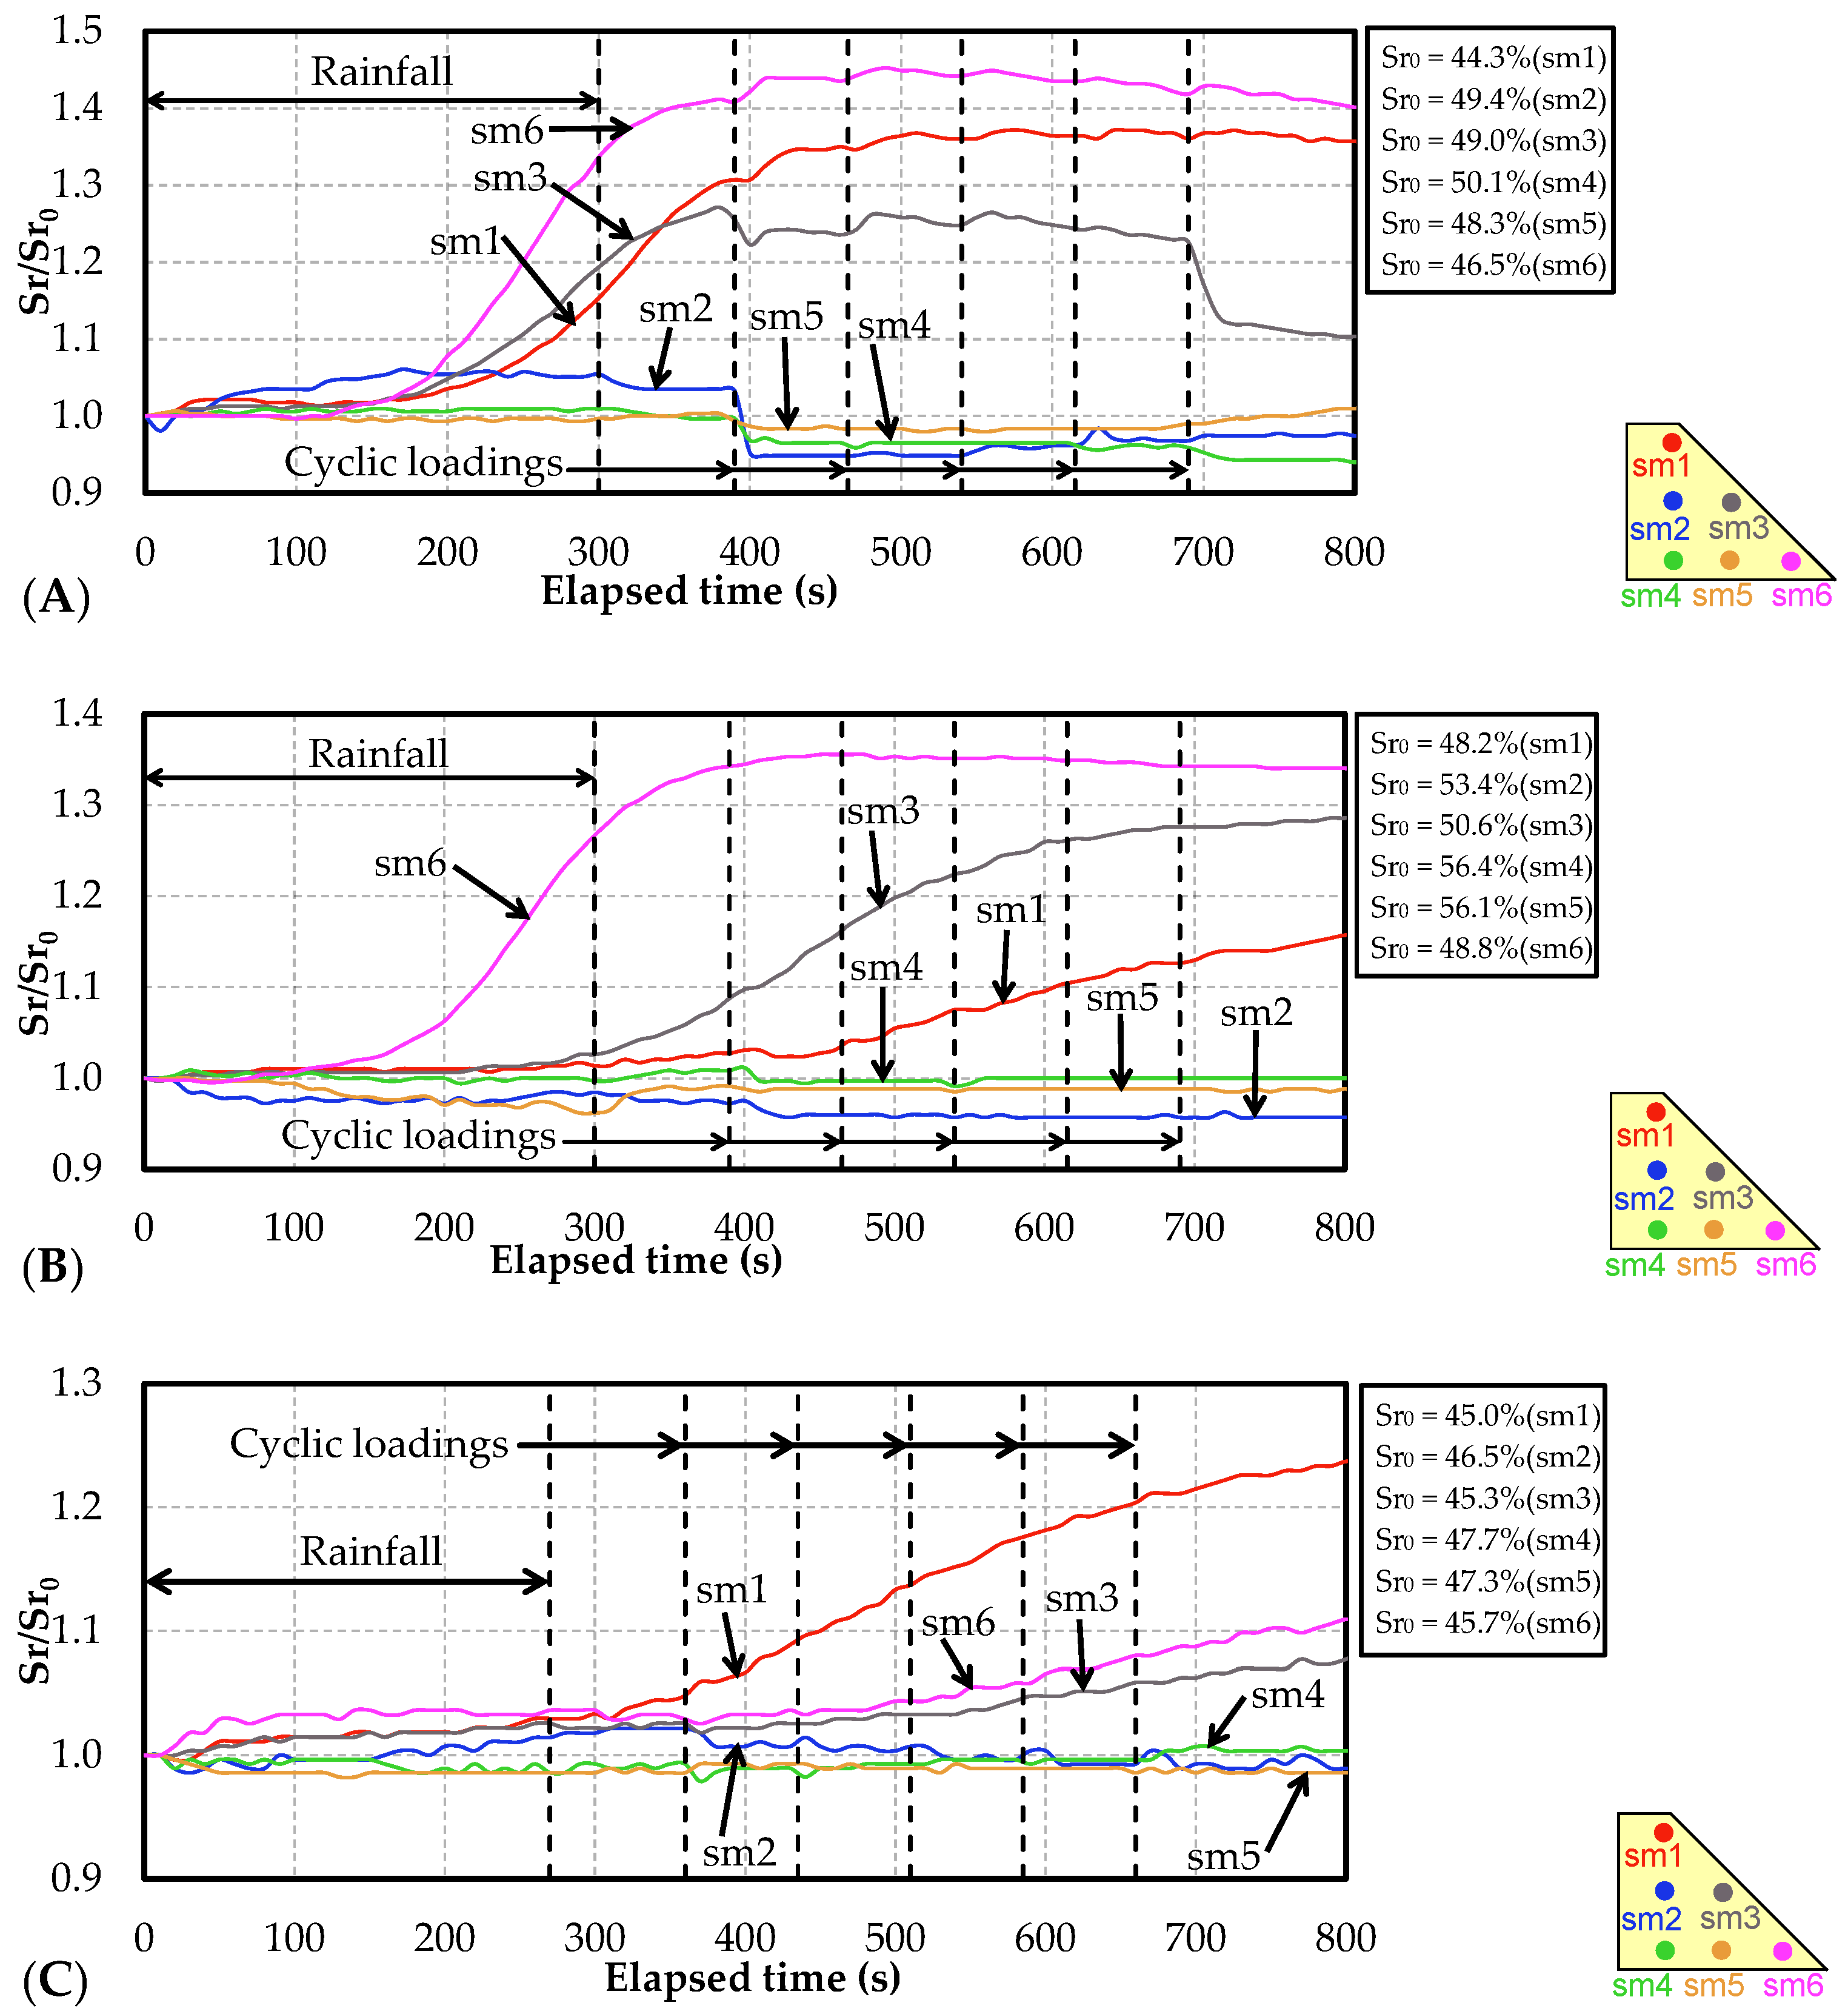
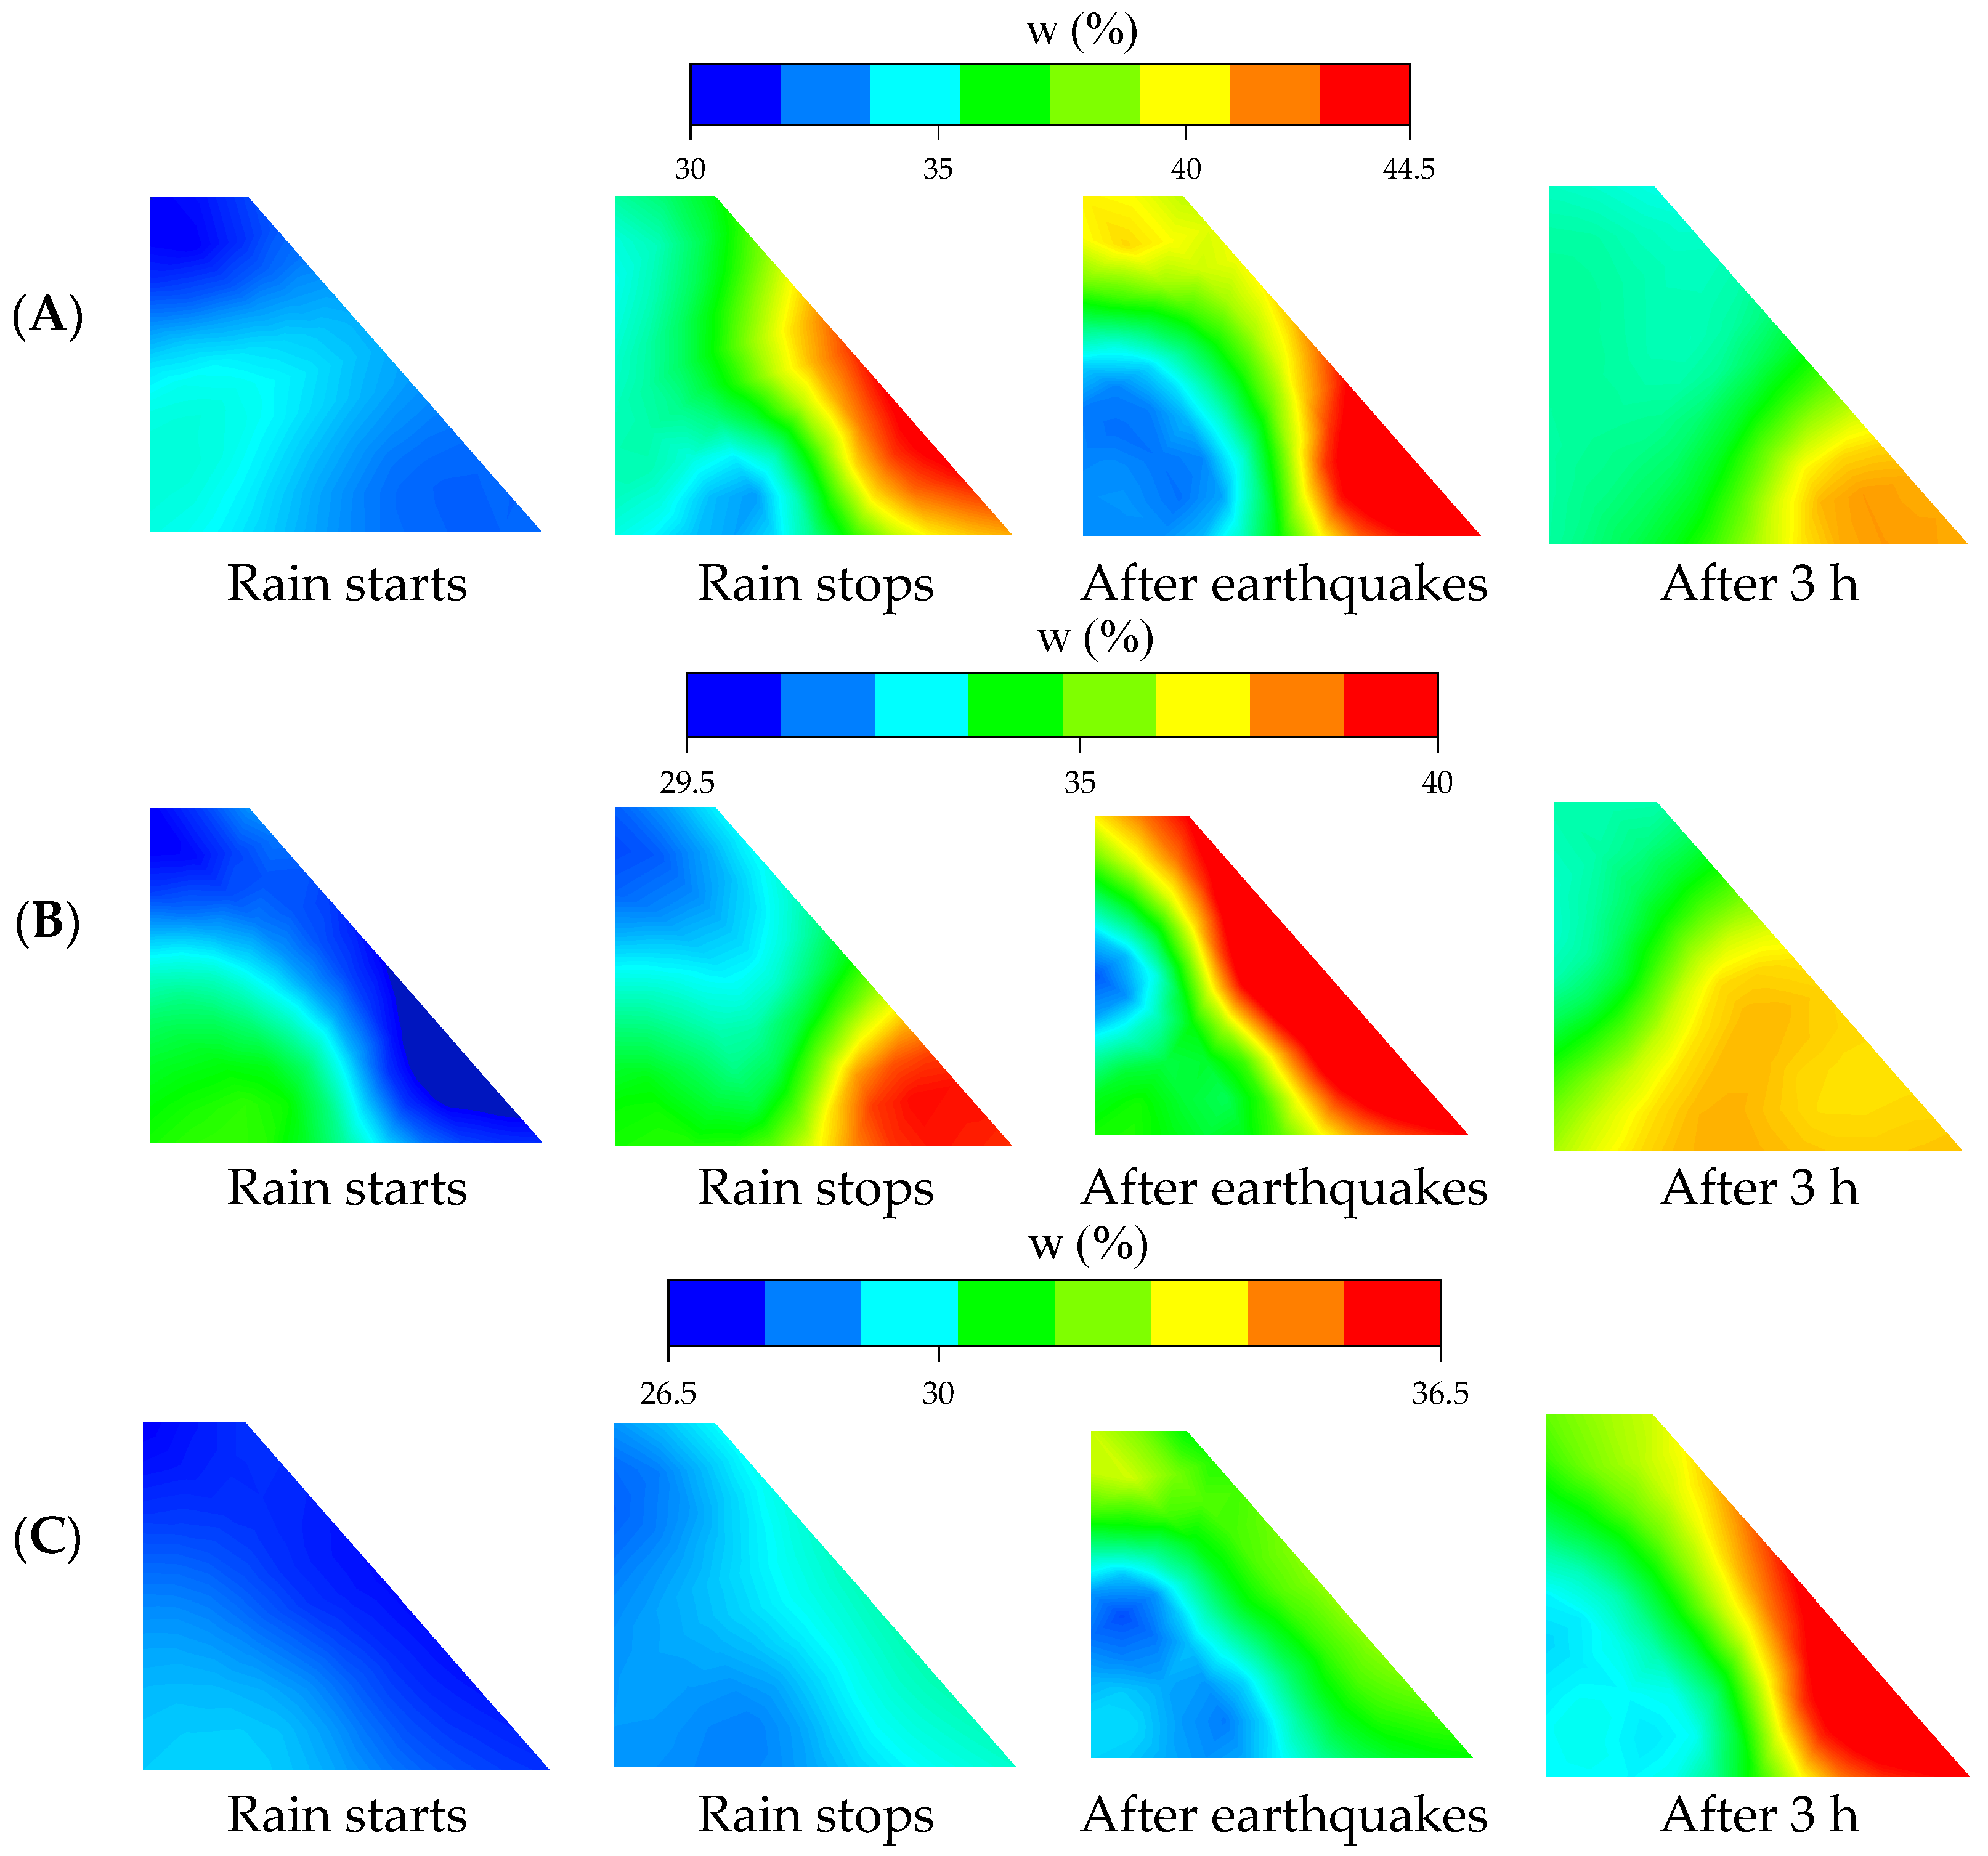
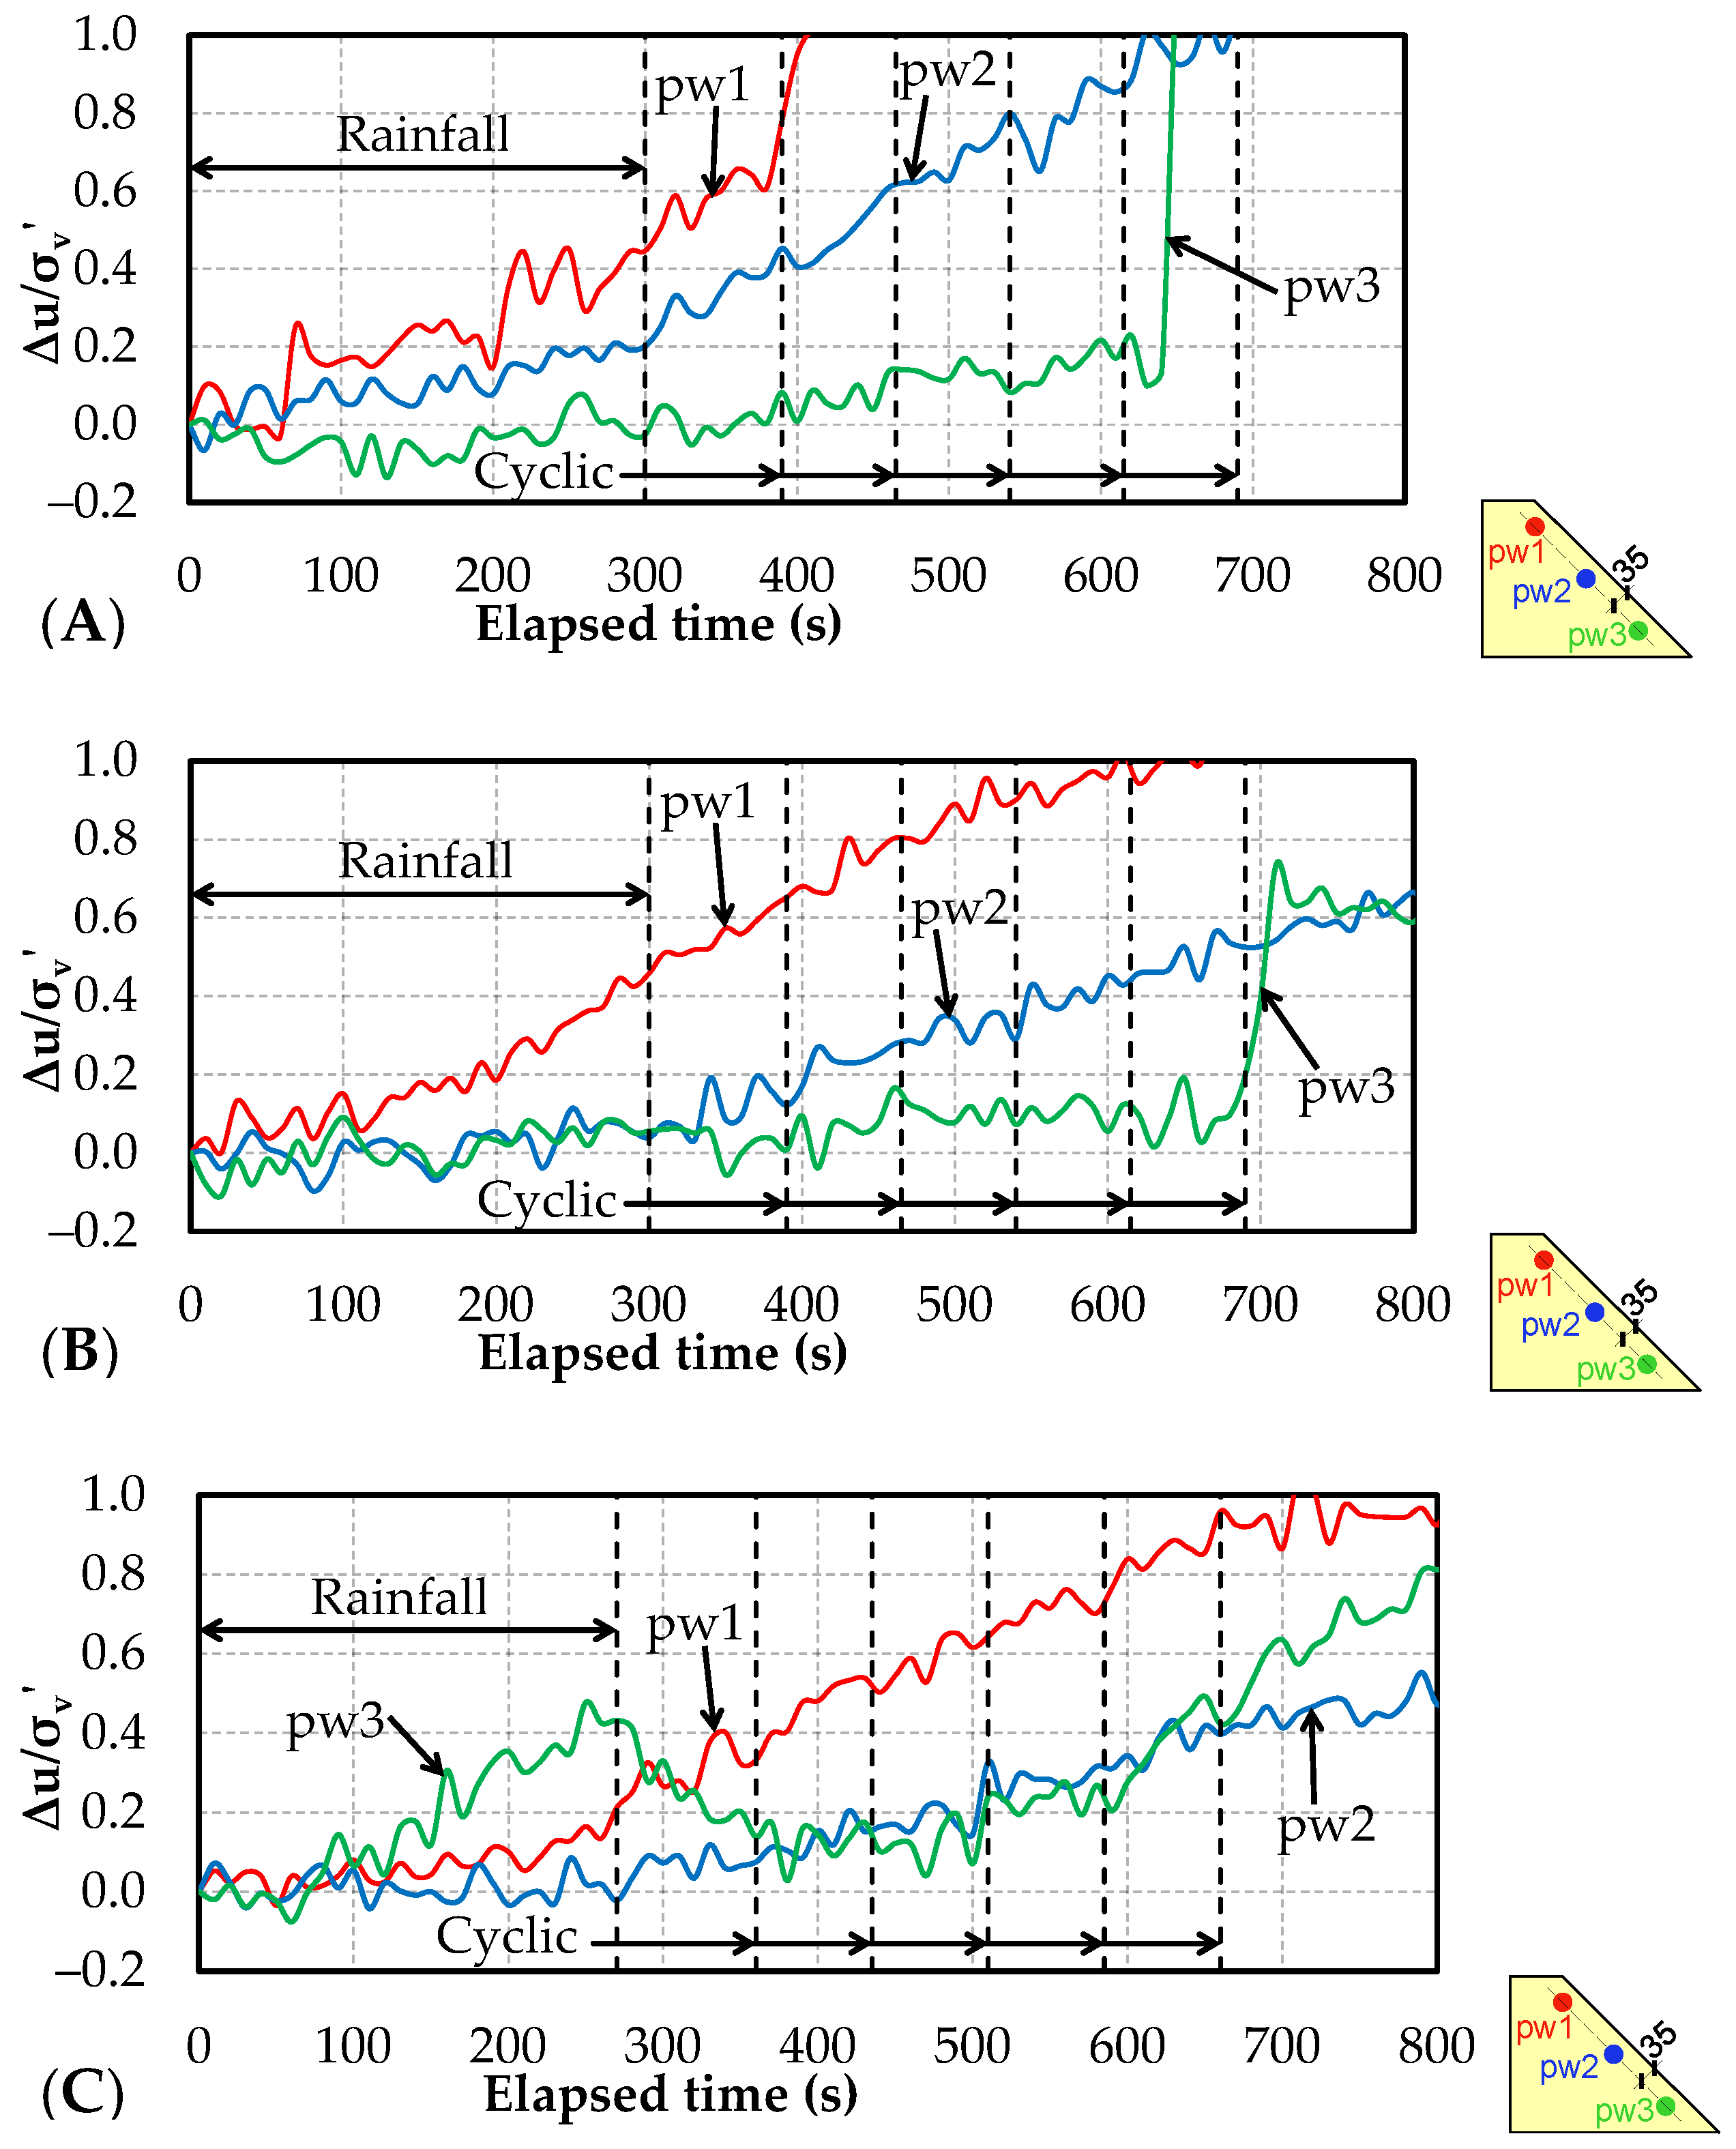
3.1. Effect of Fines Content on Slope Stability during Rainfall
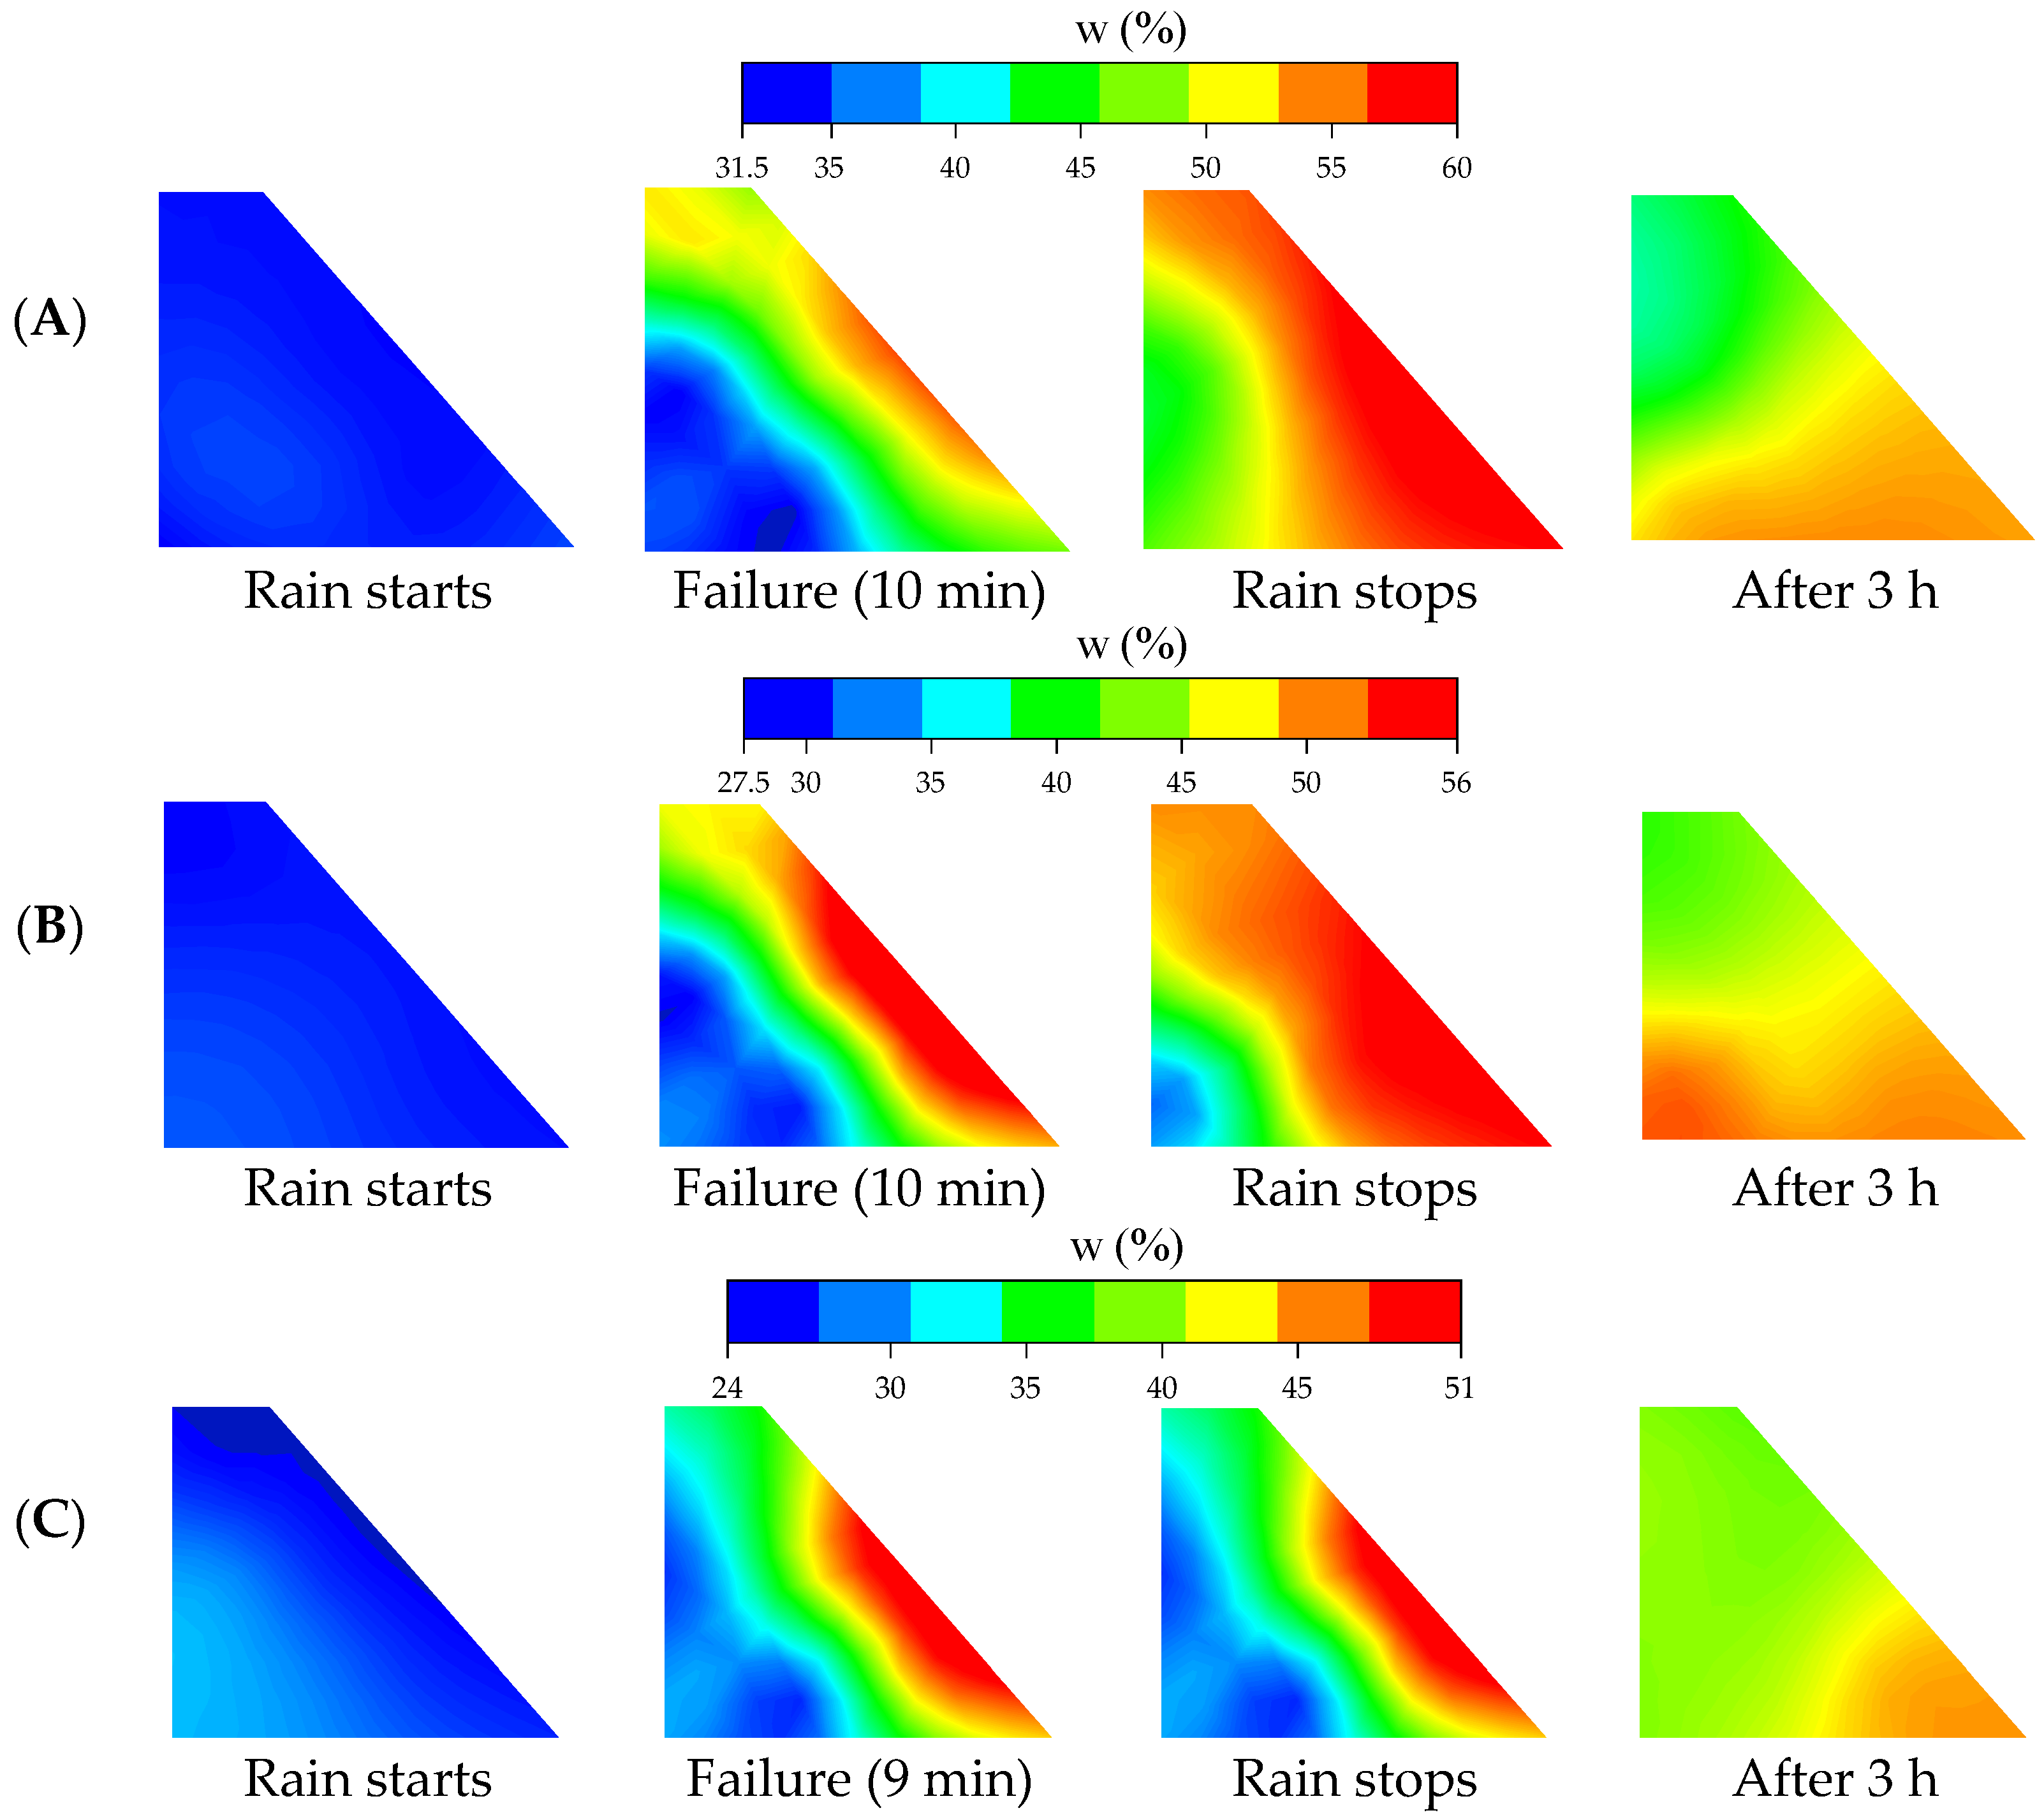
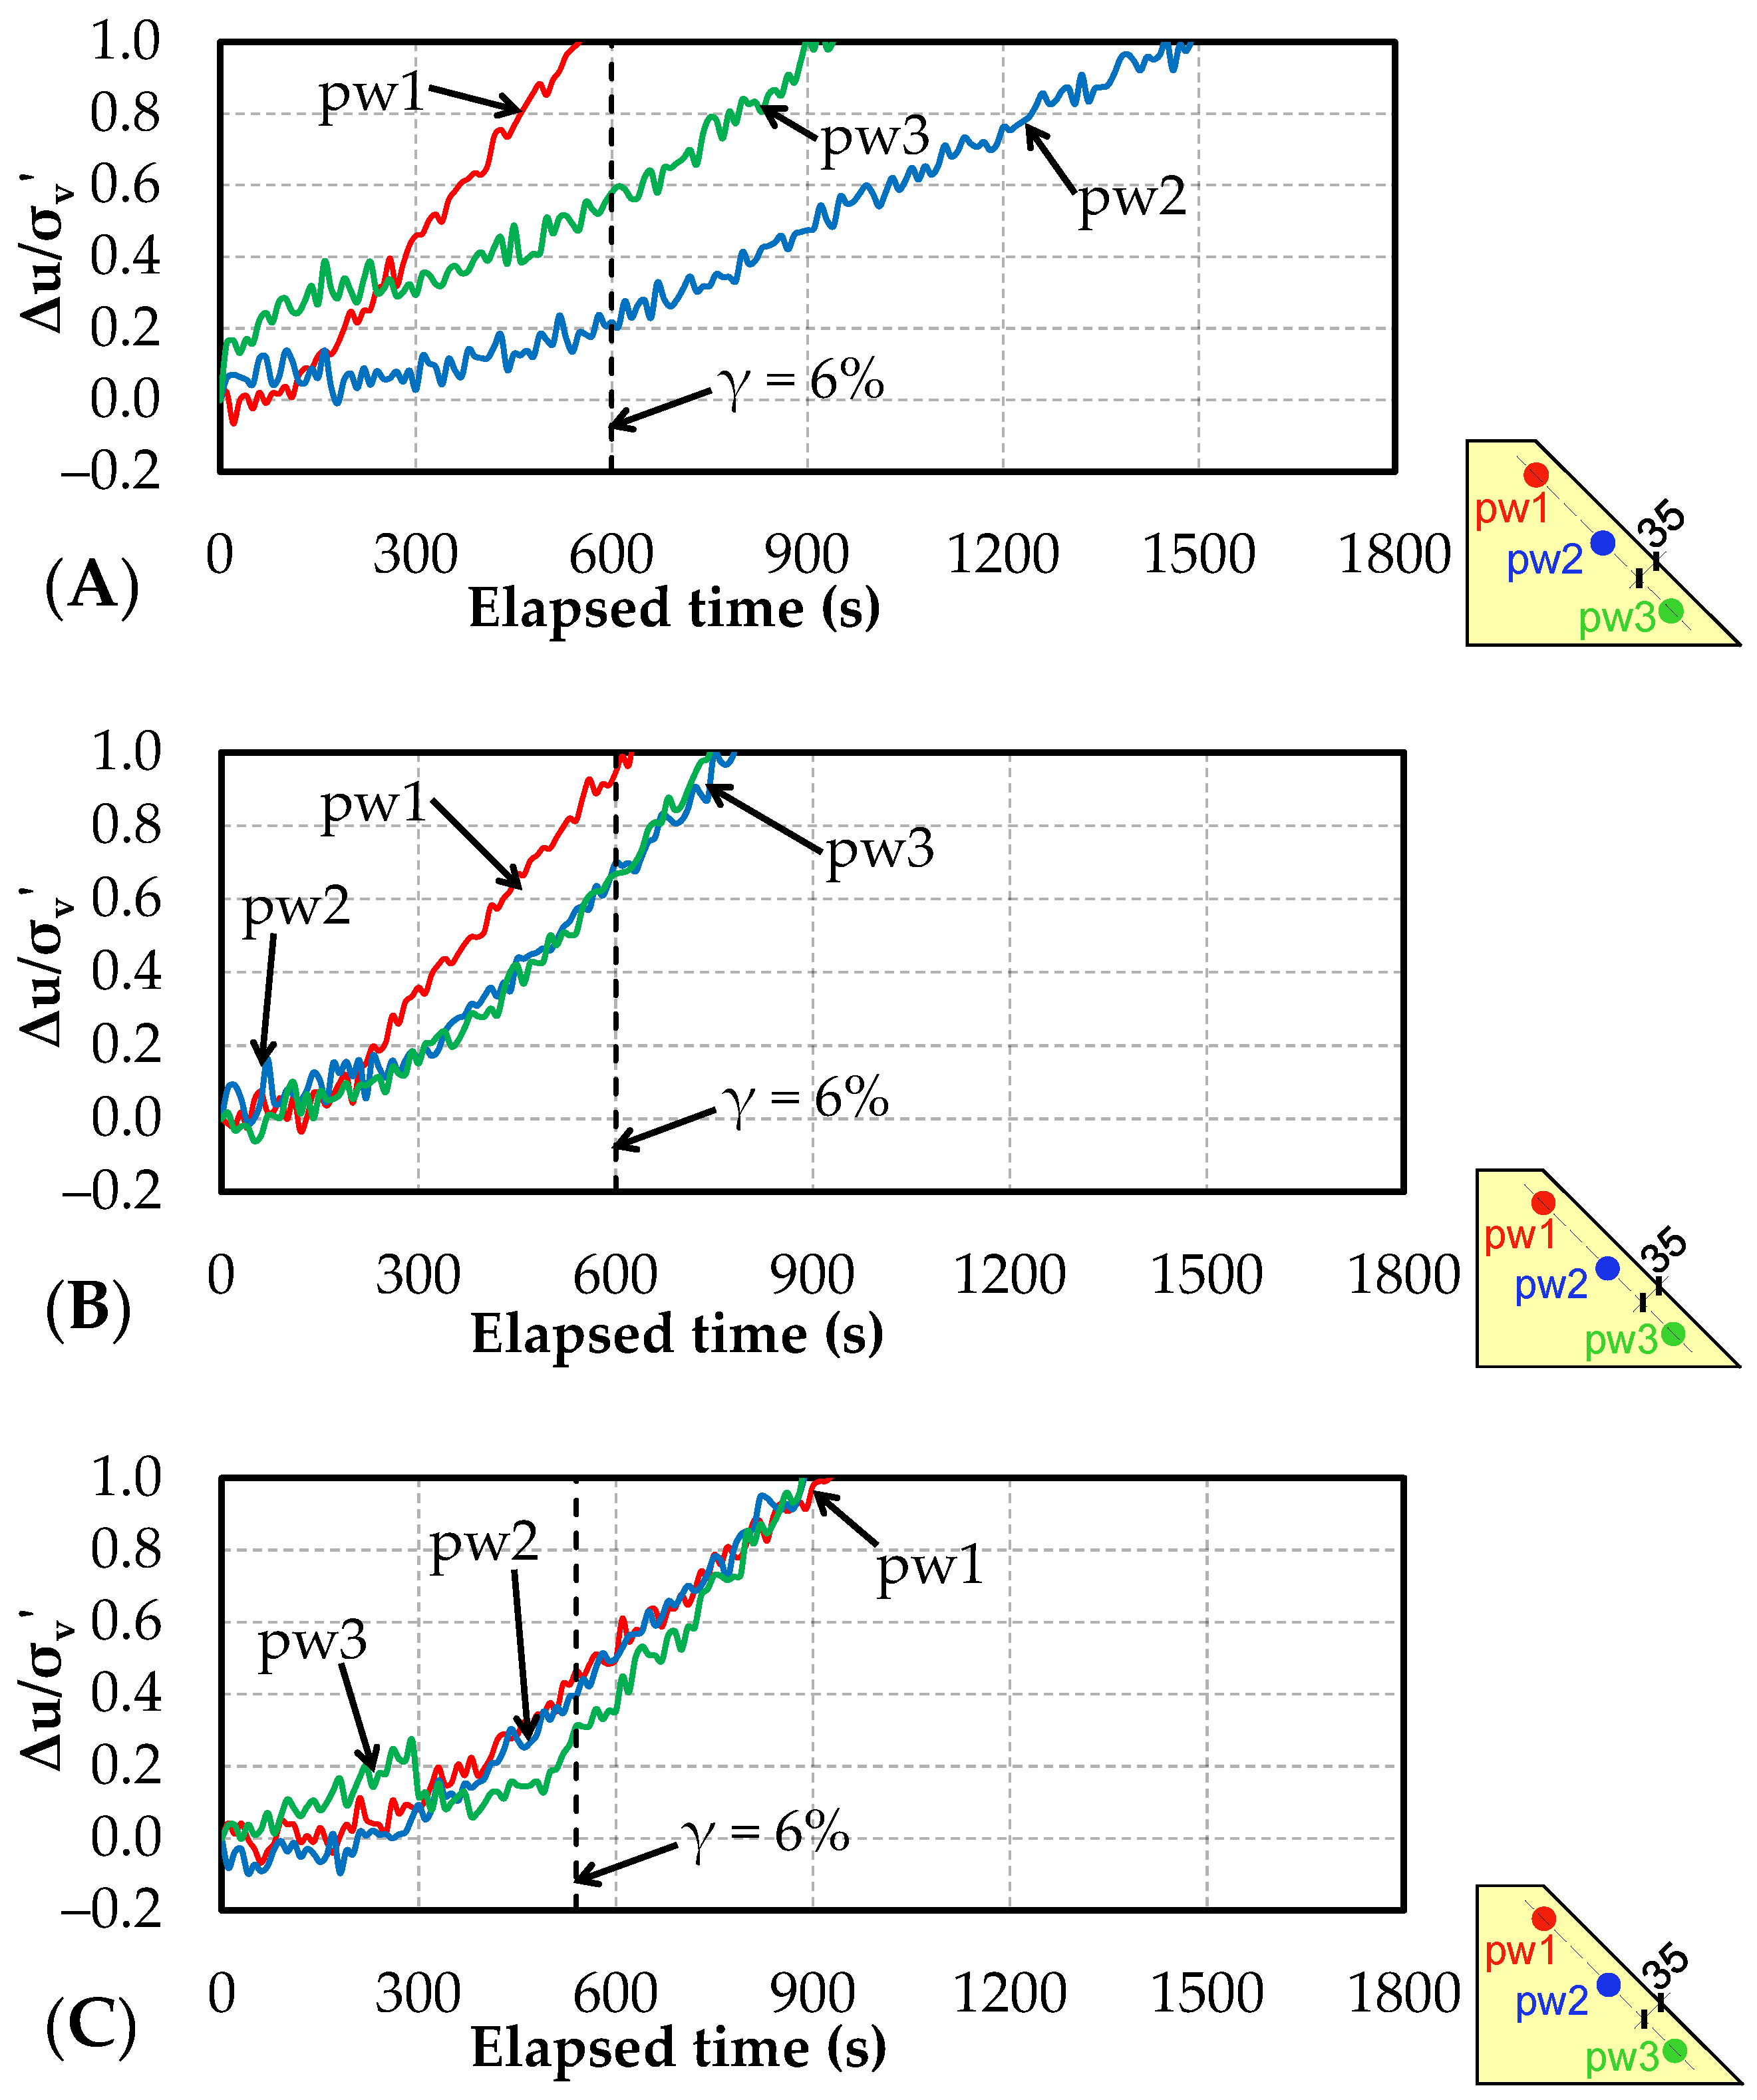
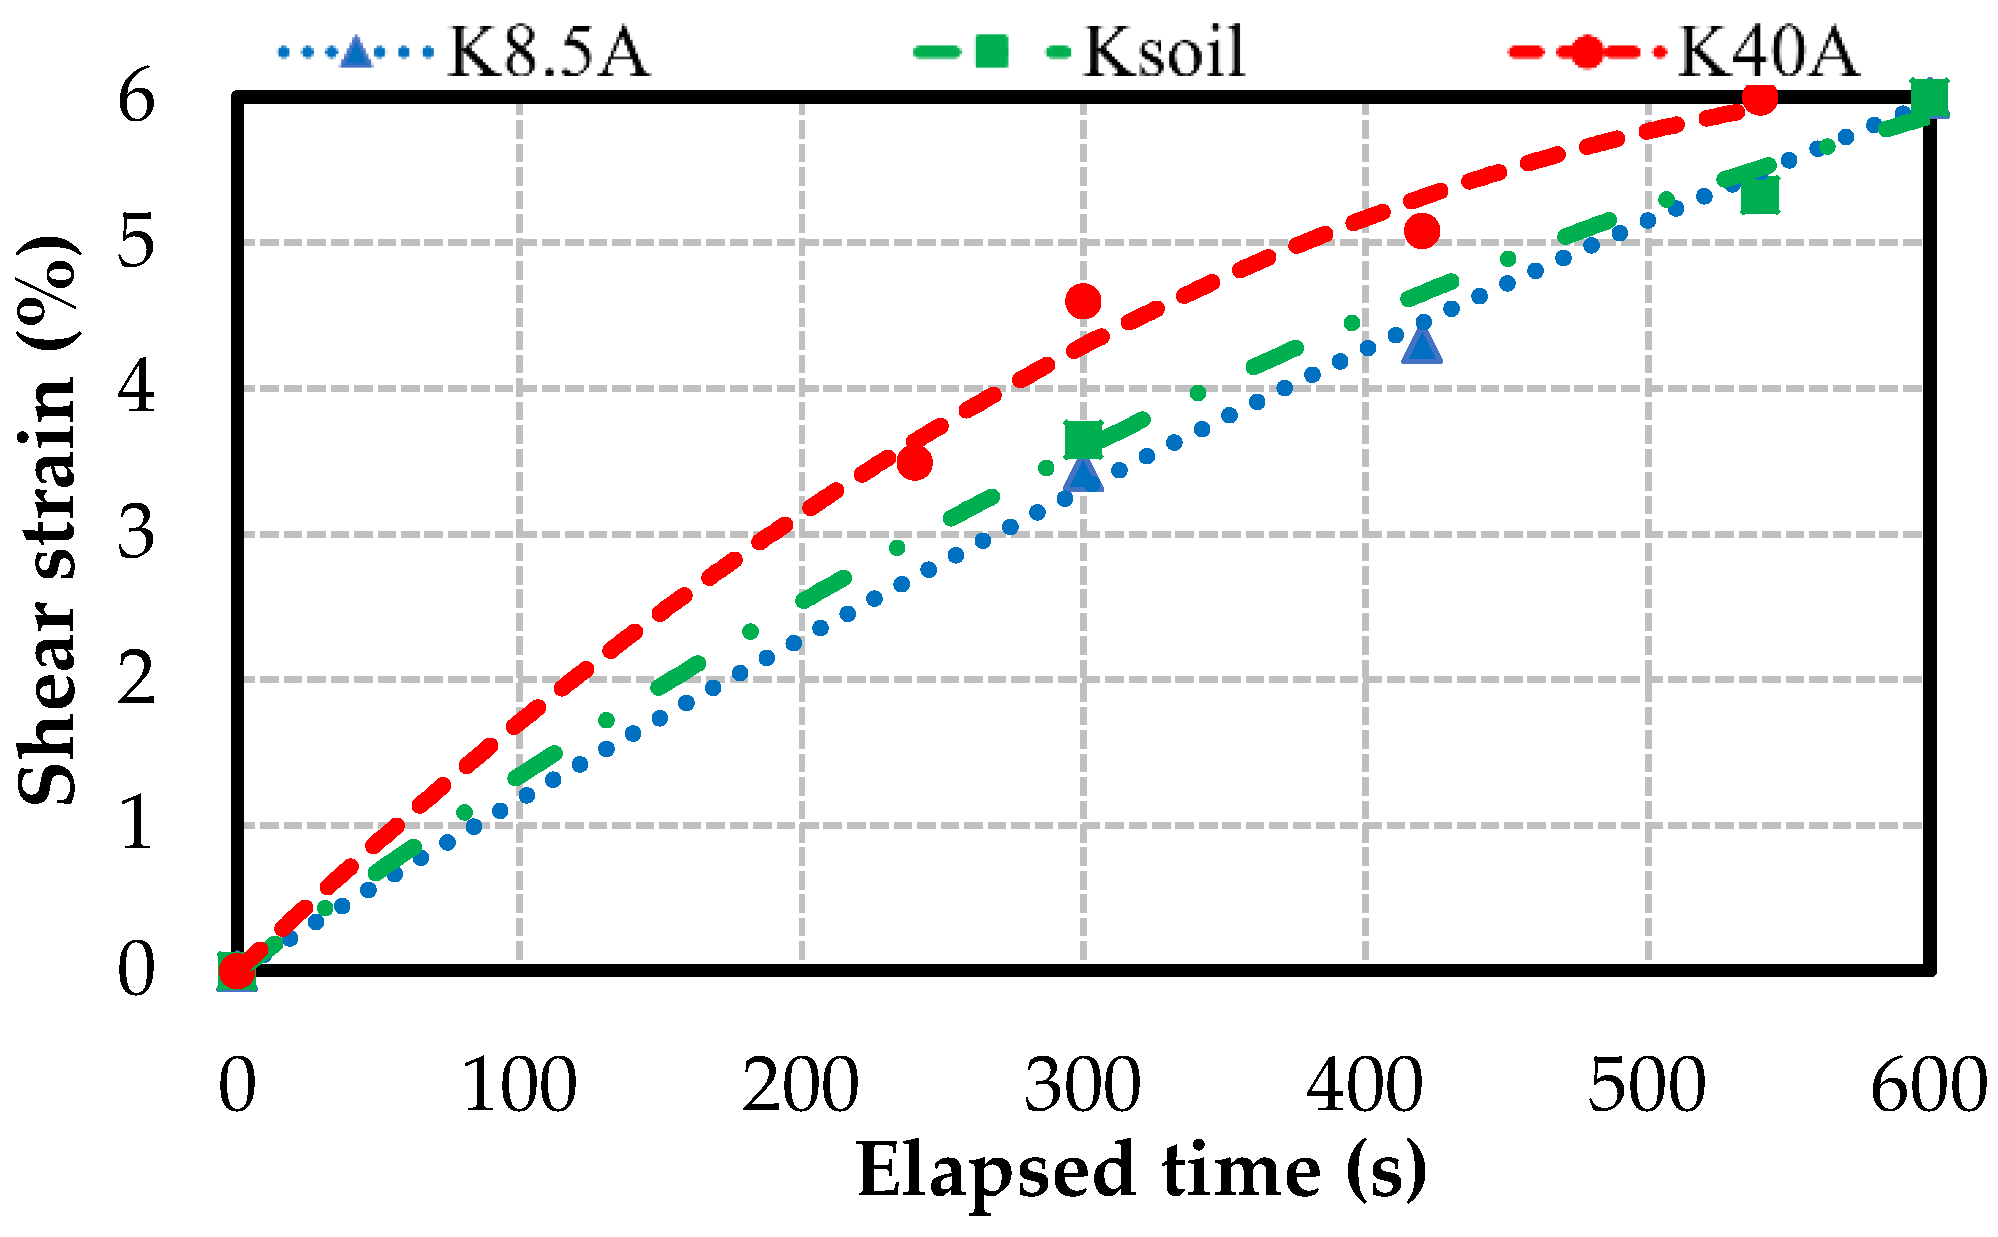
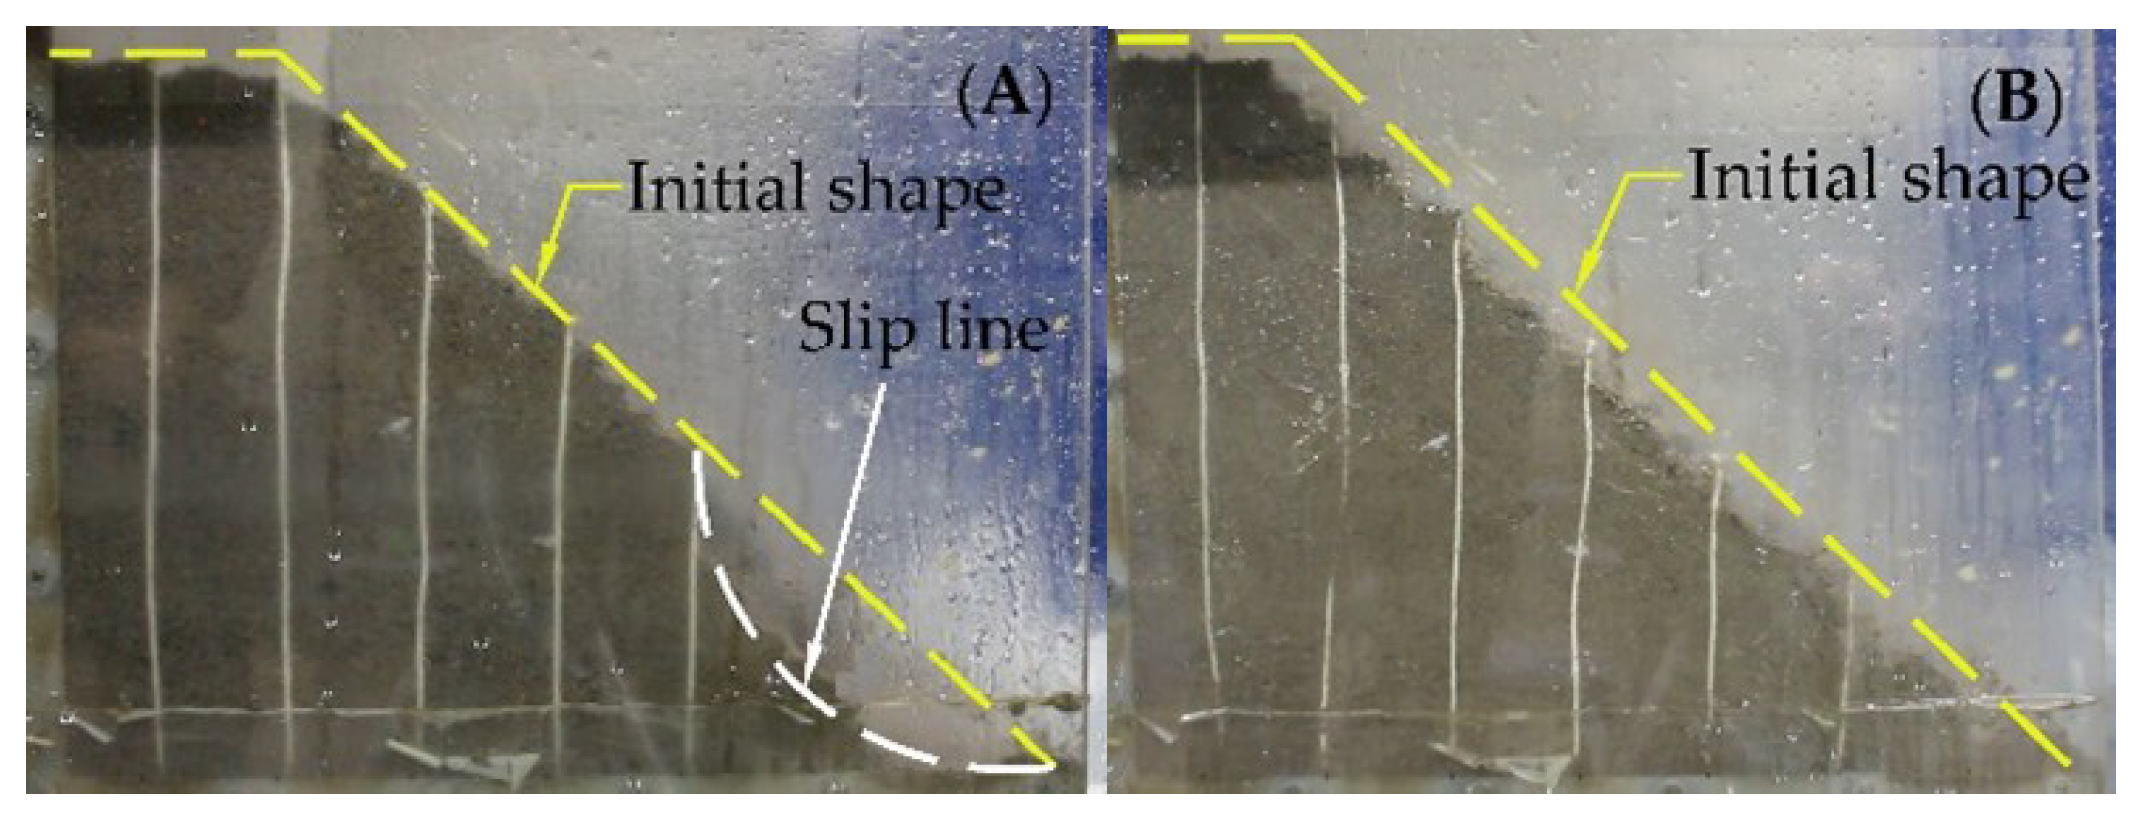
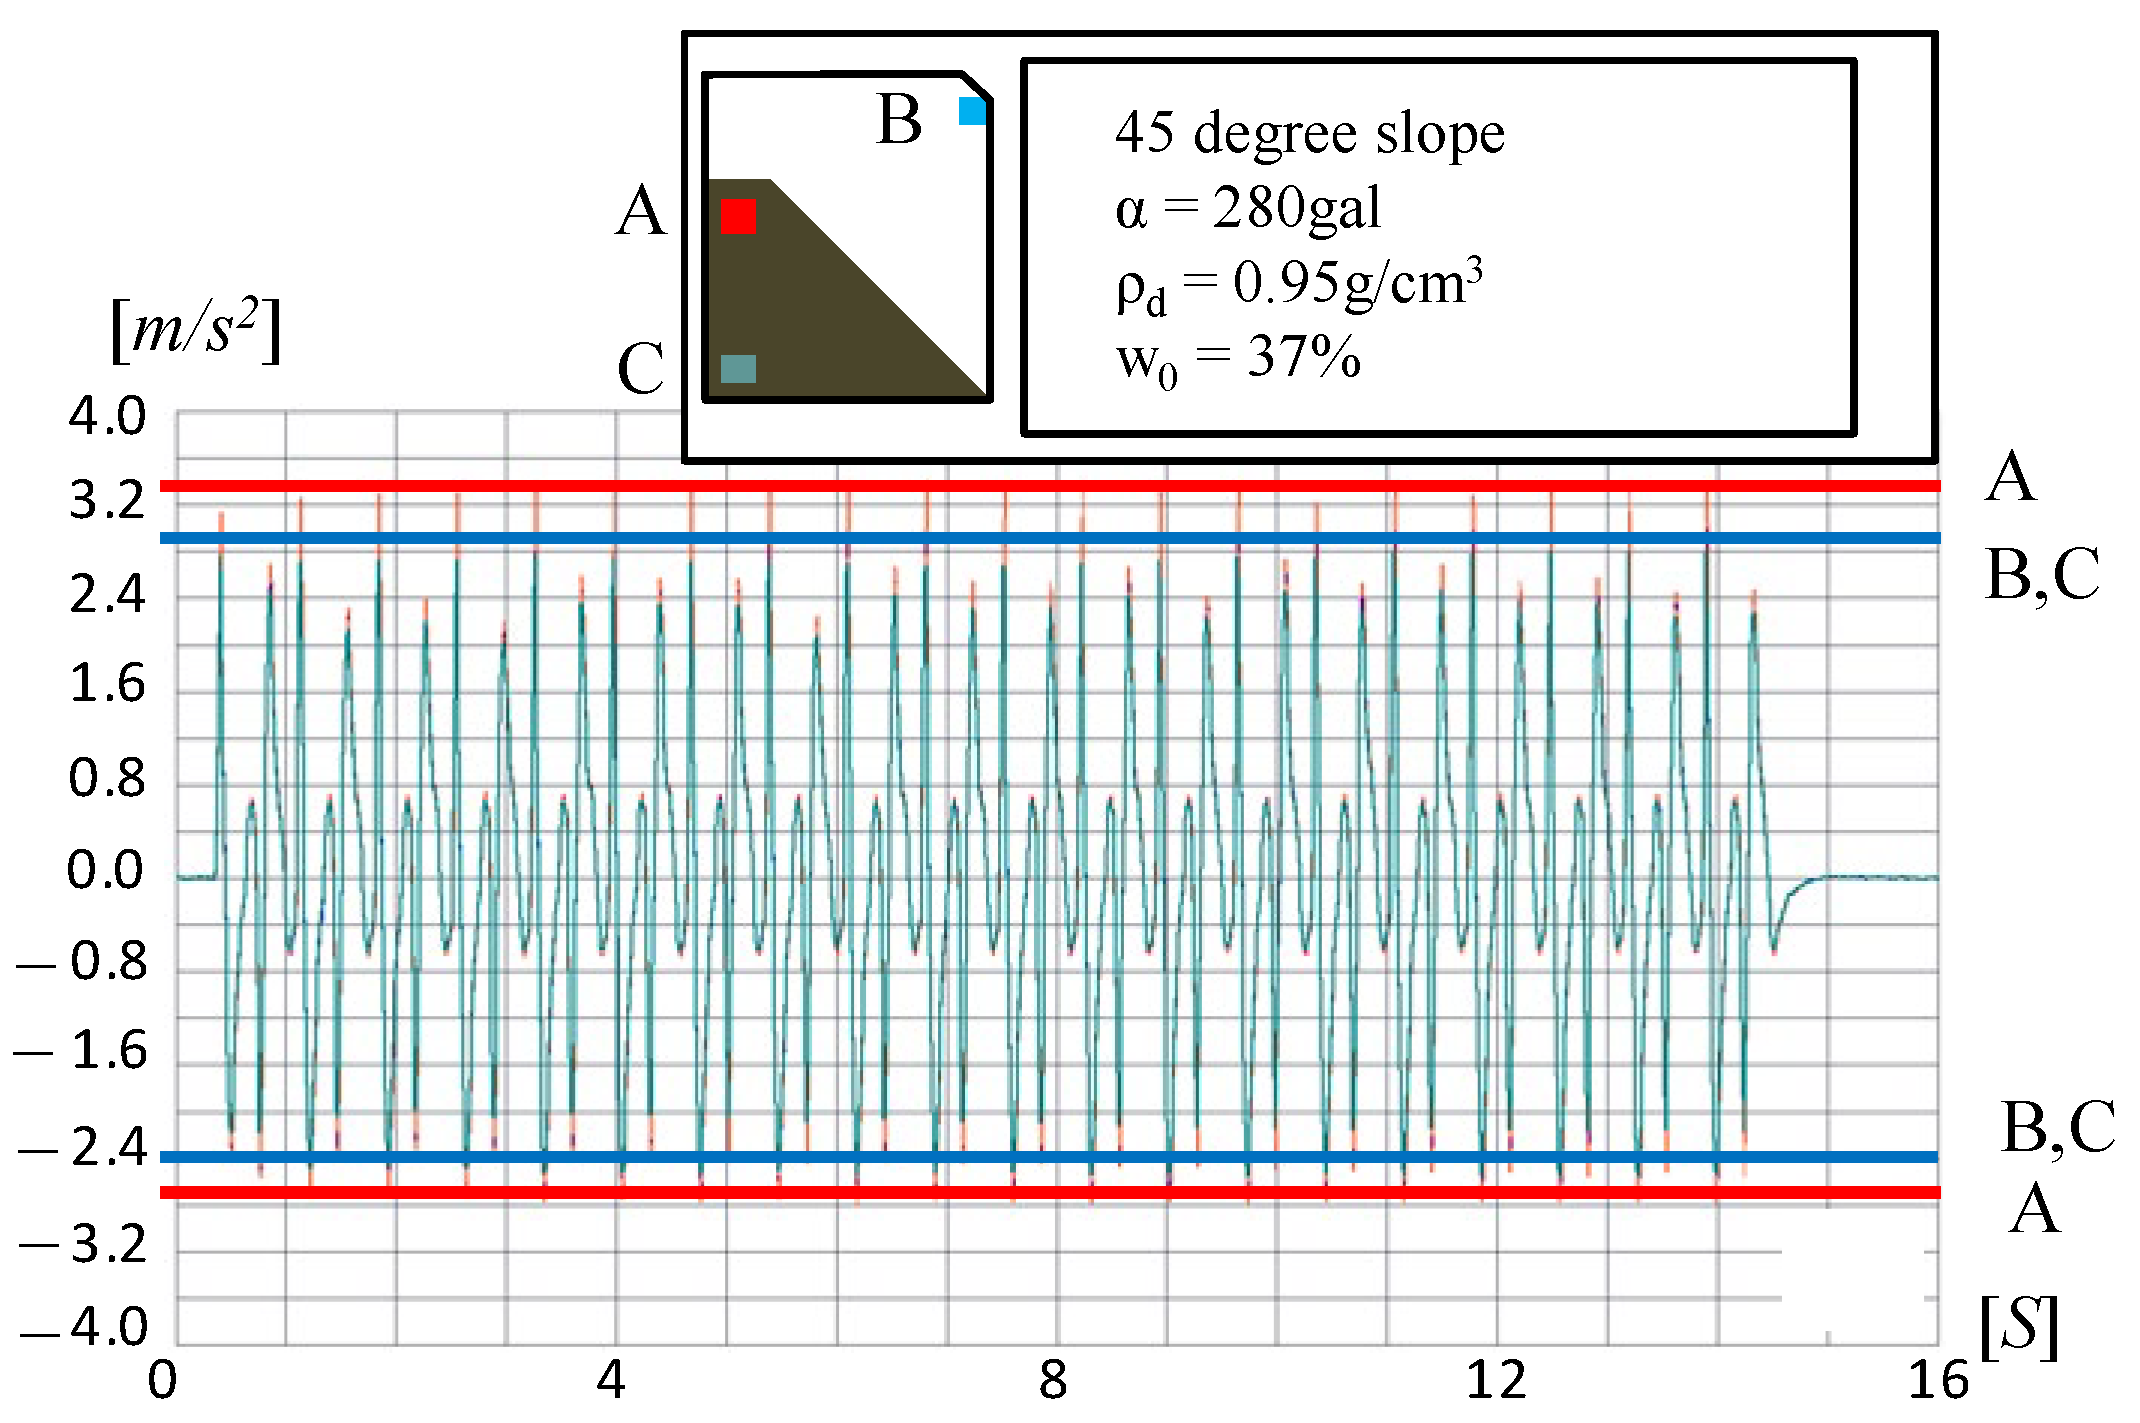
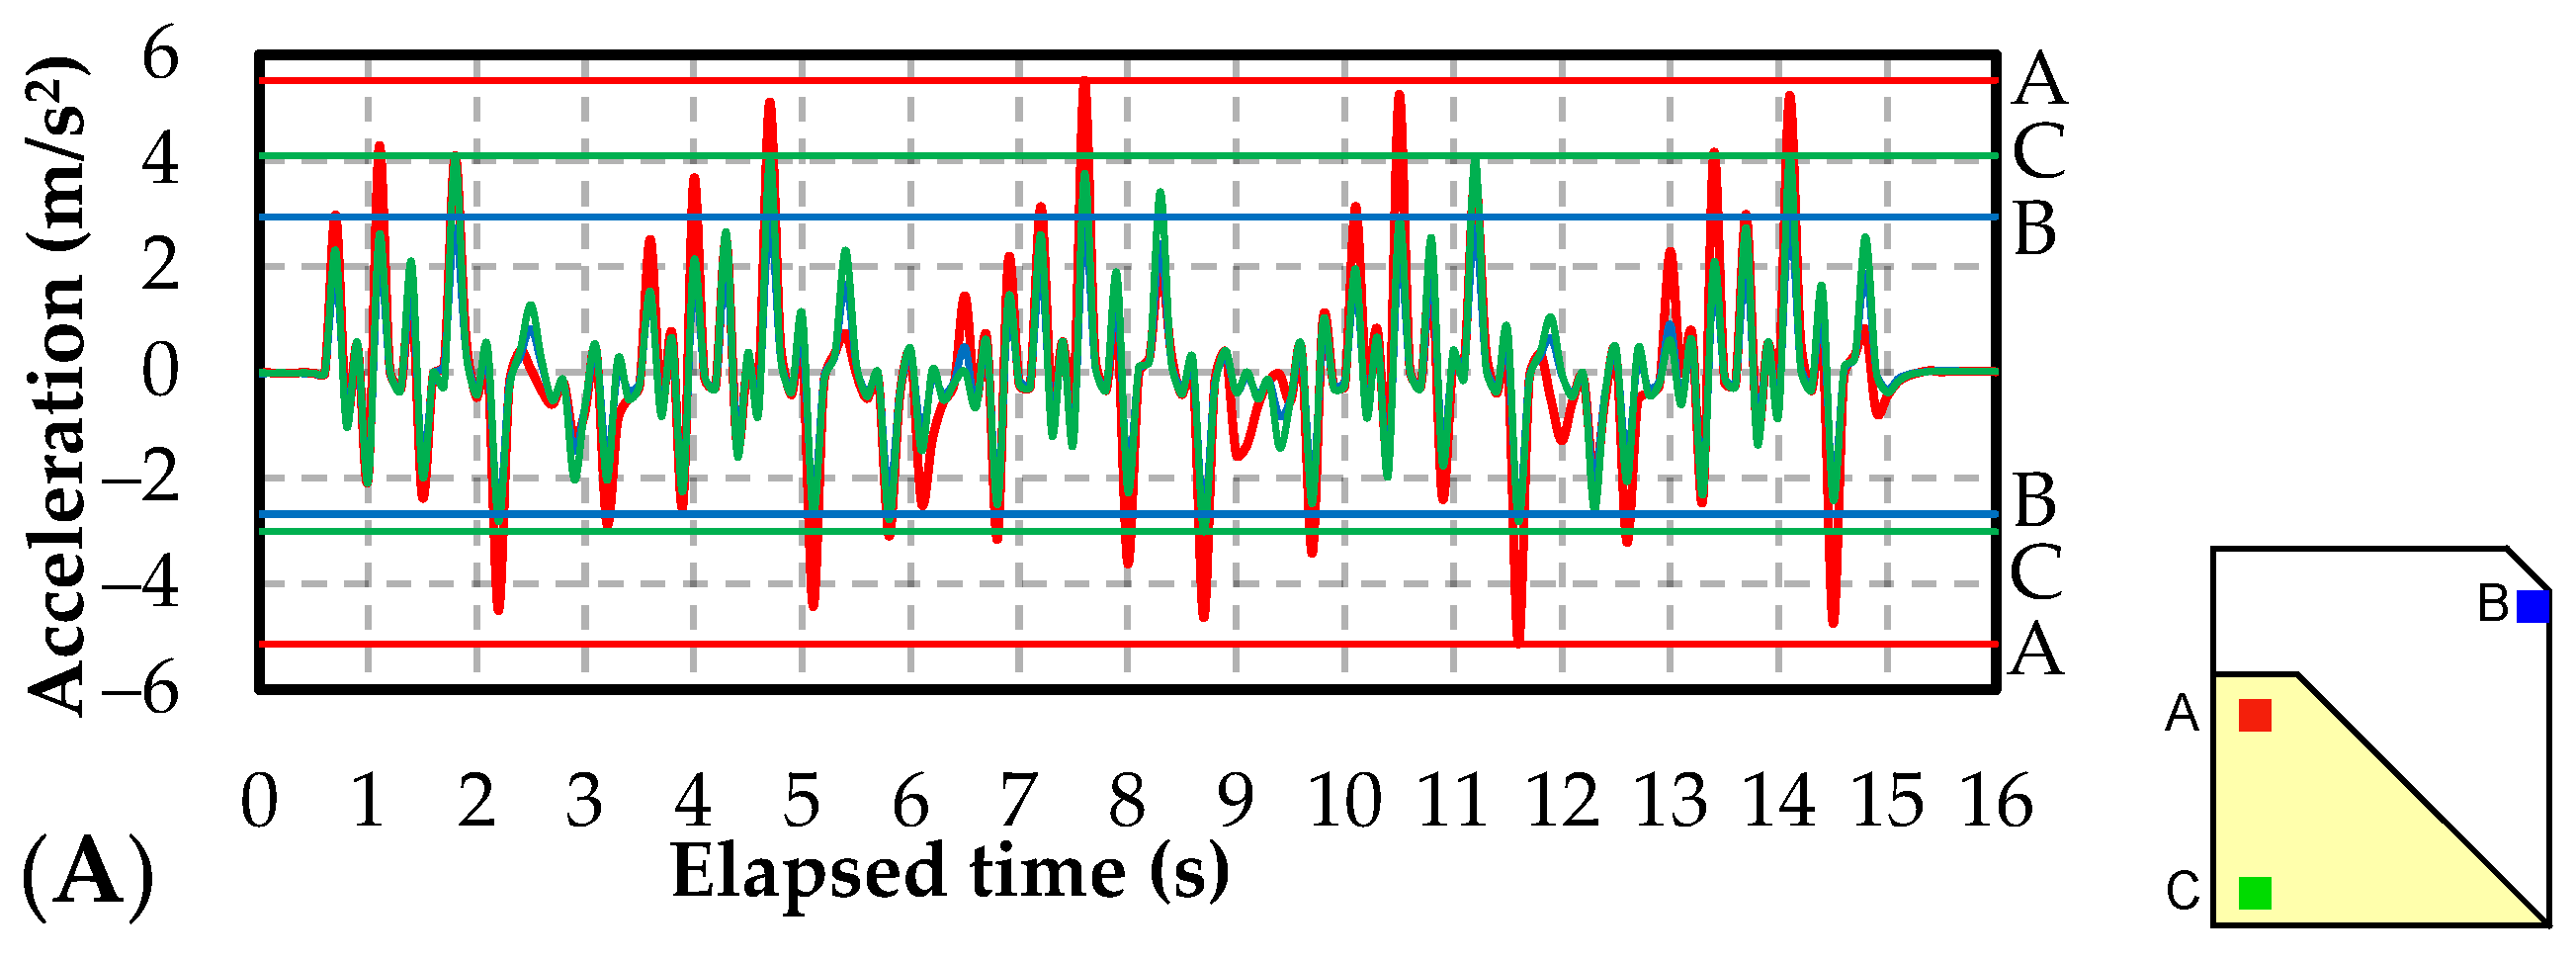
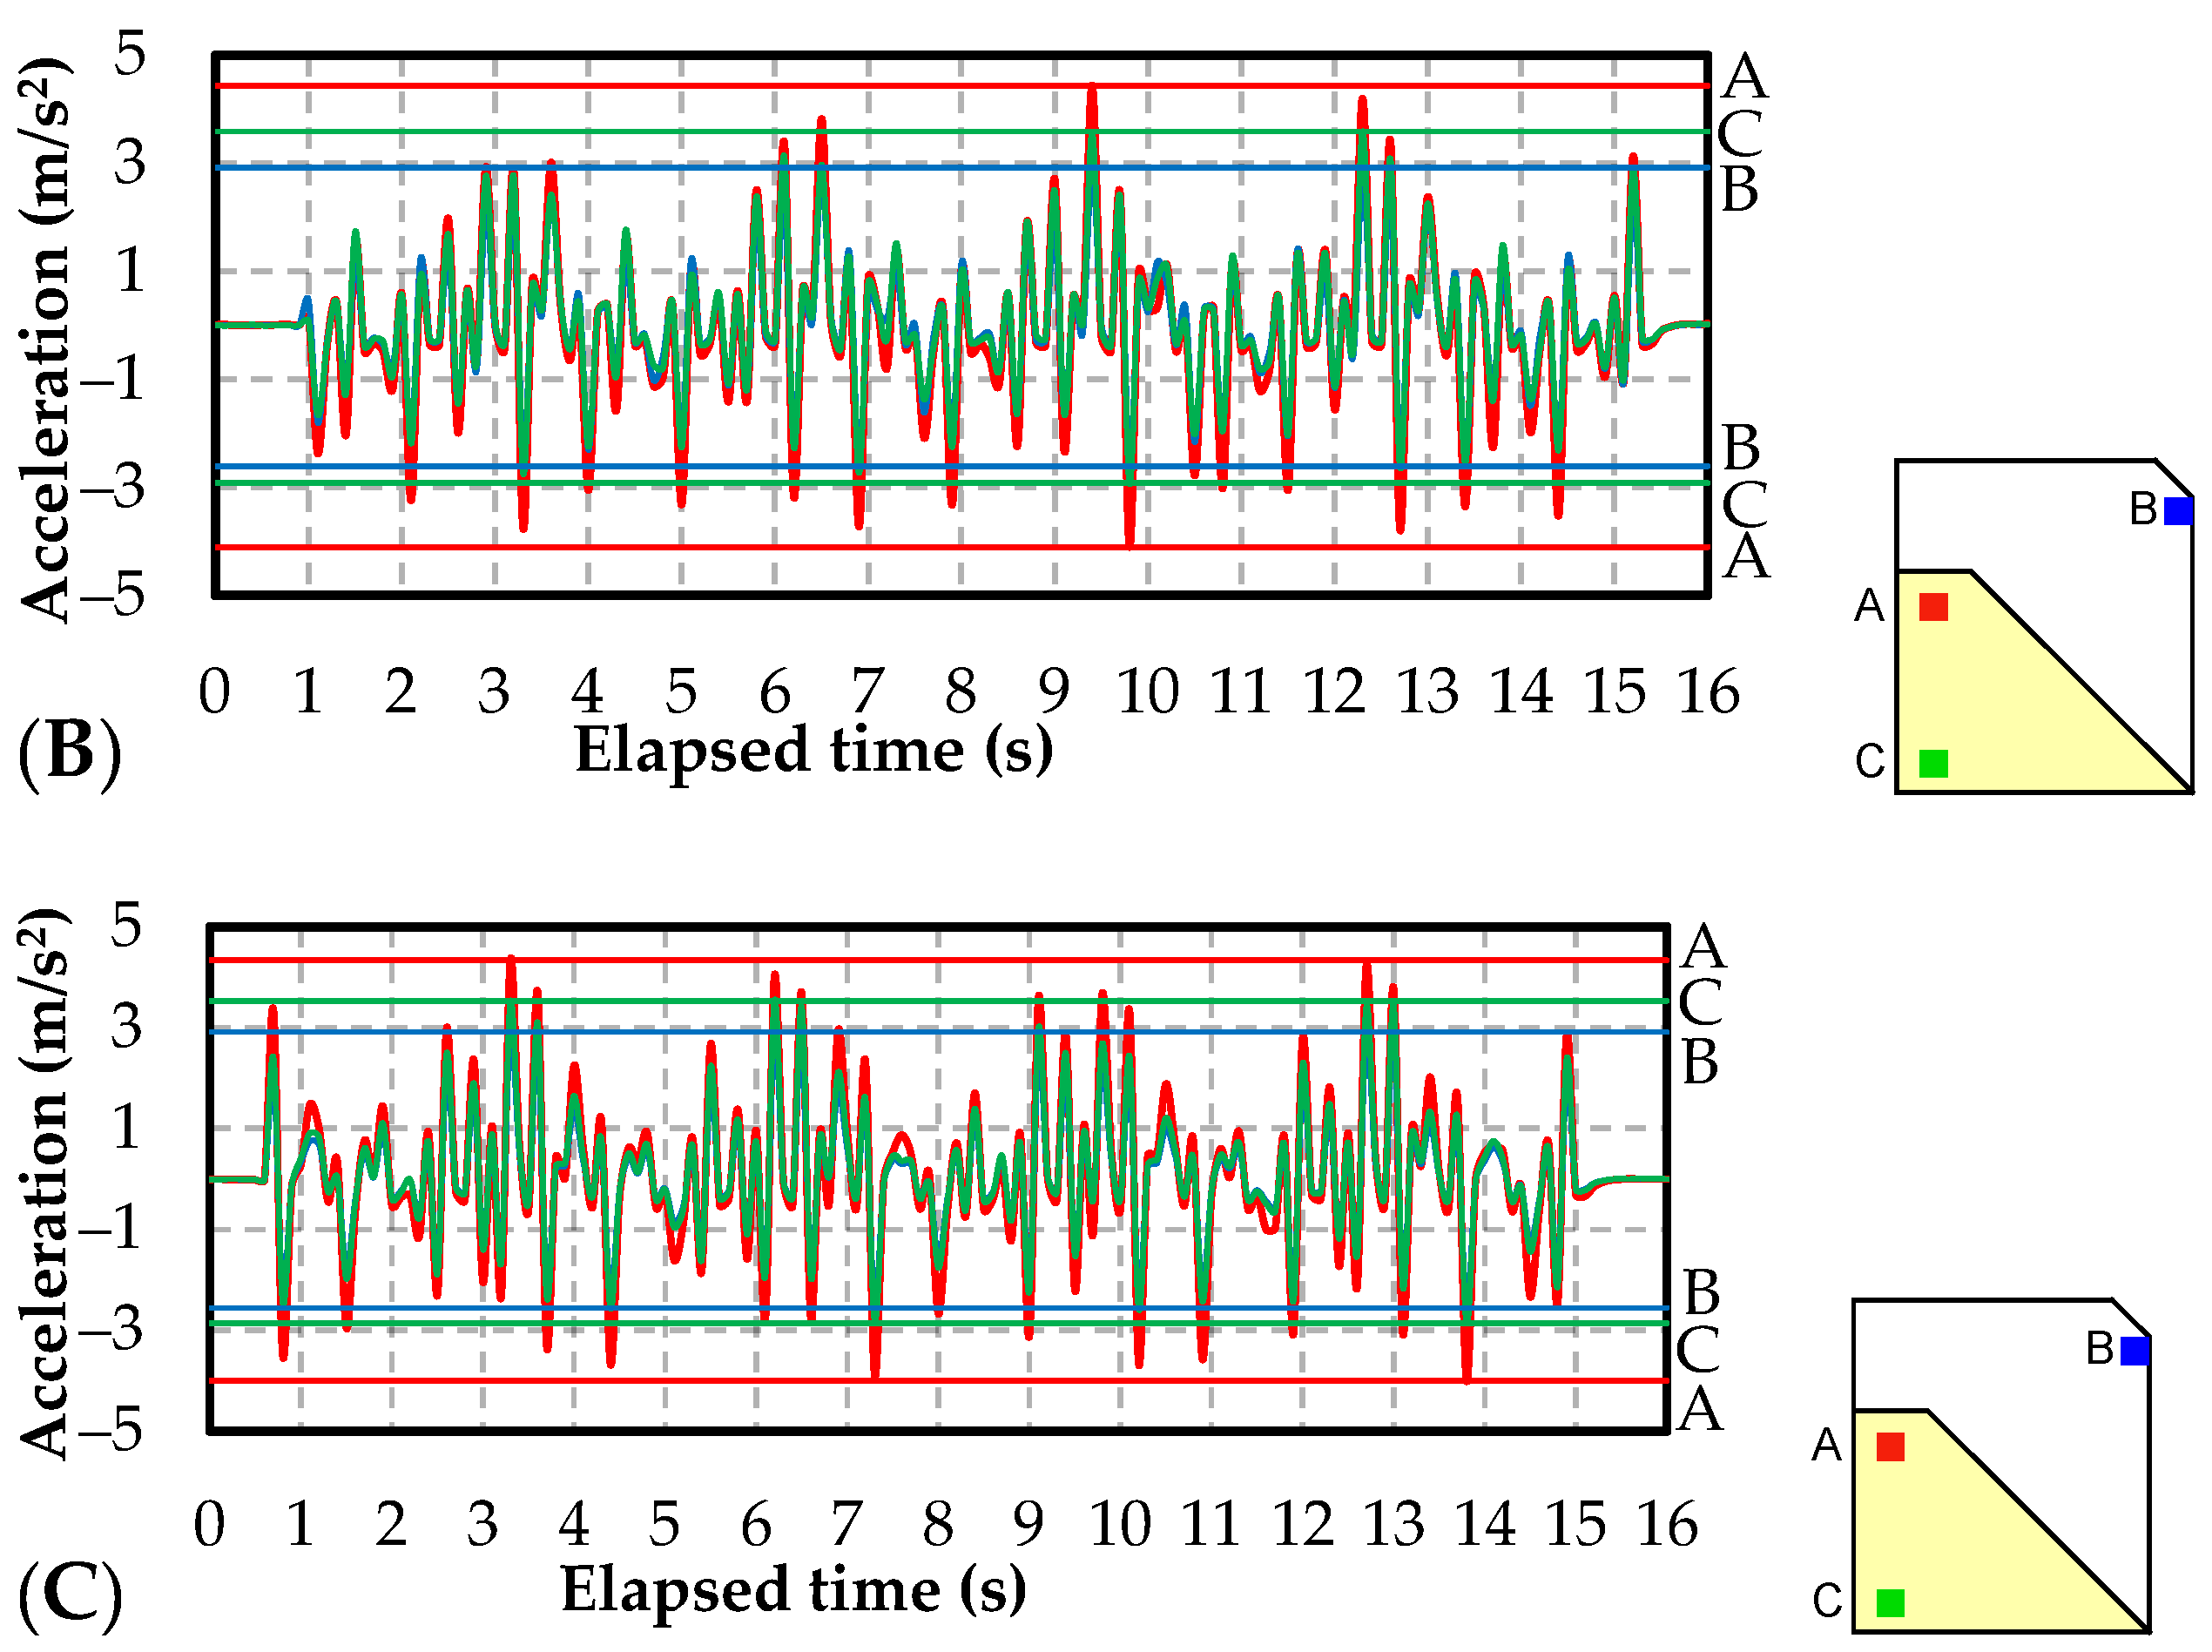
3.2. The Failure of Embankments with Different Fine Contents under Post-Rainfall Earthquake
- -
- For K40A: R0 = 100 mm/h × 9 min = 100 mm/h × 0.15 h = 15 mm;
- -
- For K8.5A, Ksoil: R0 = 100 mm/h × 10 min = 100 mm/h × 0.17 h = 17 mm.
4. Discussion
5. Conclusions
- -
- The fine particle content has a great influence and must be taken into account when studying the stability of the volcanic embankment under the independent or combined effects of rainfall and earthquake;
- -
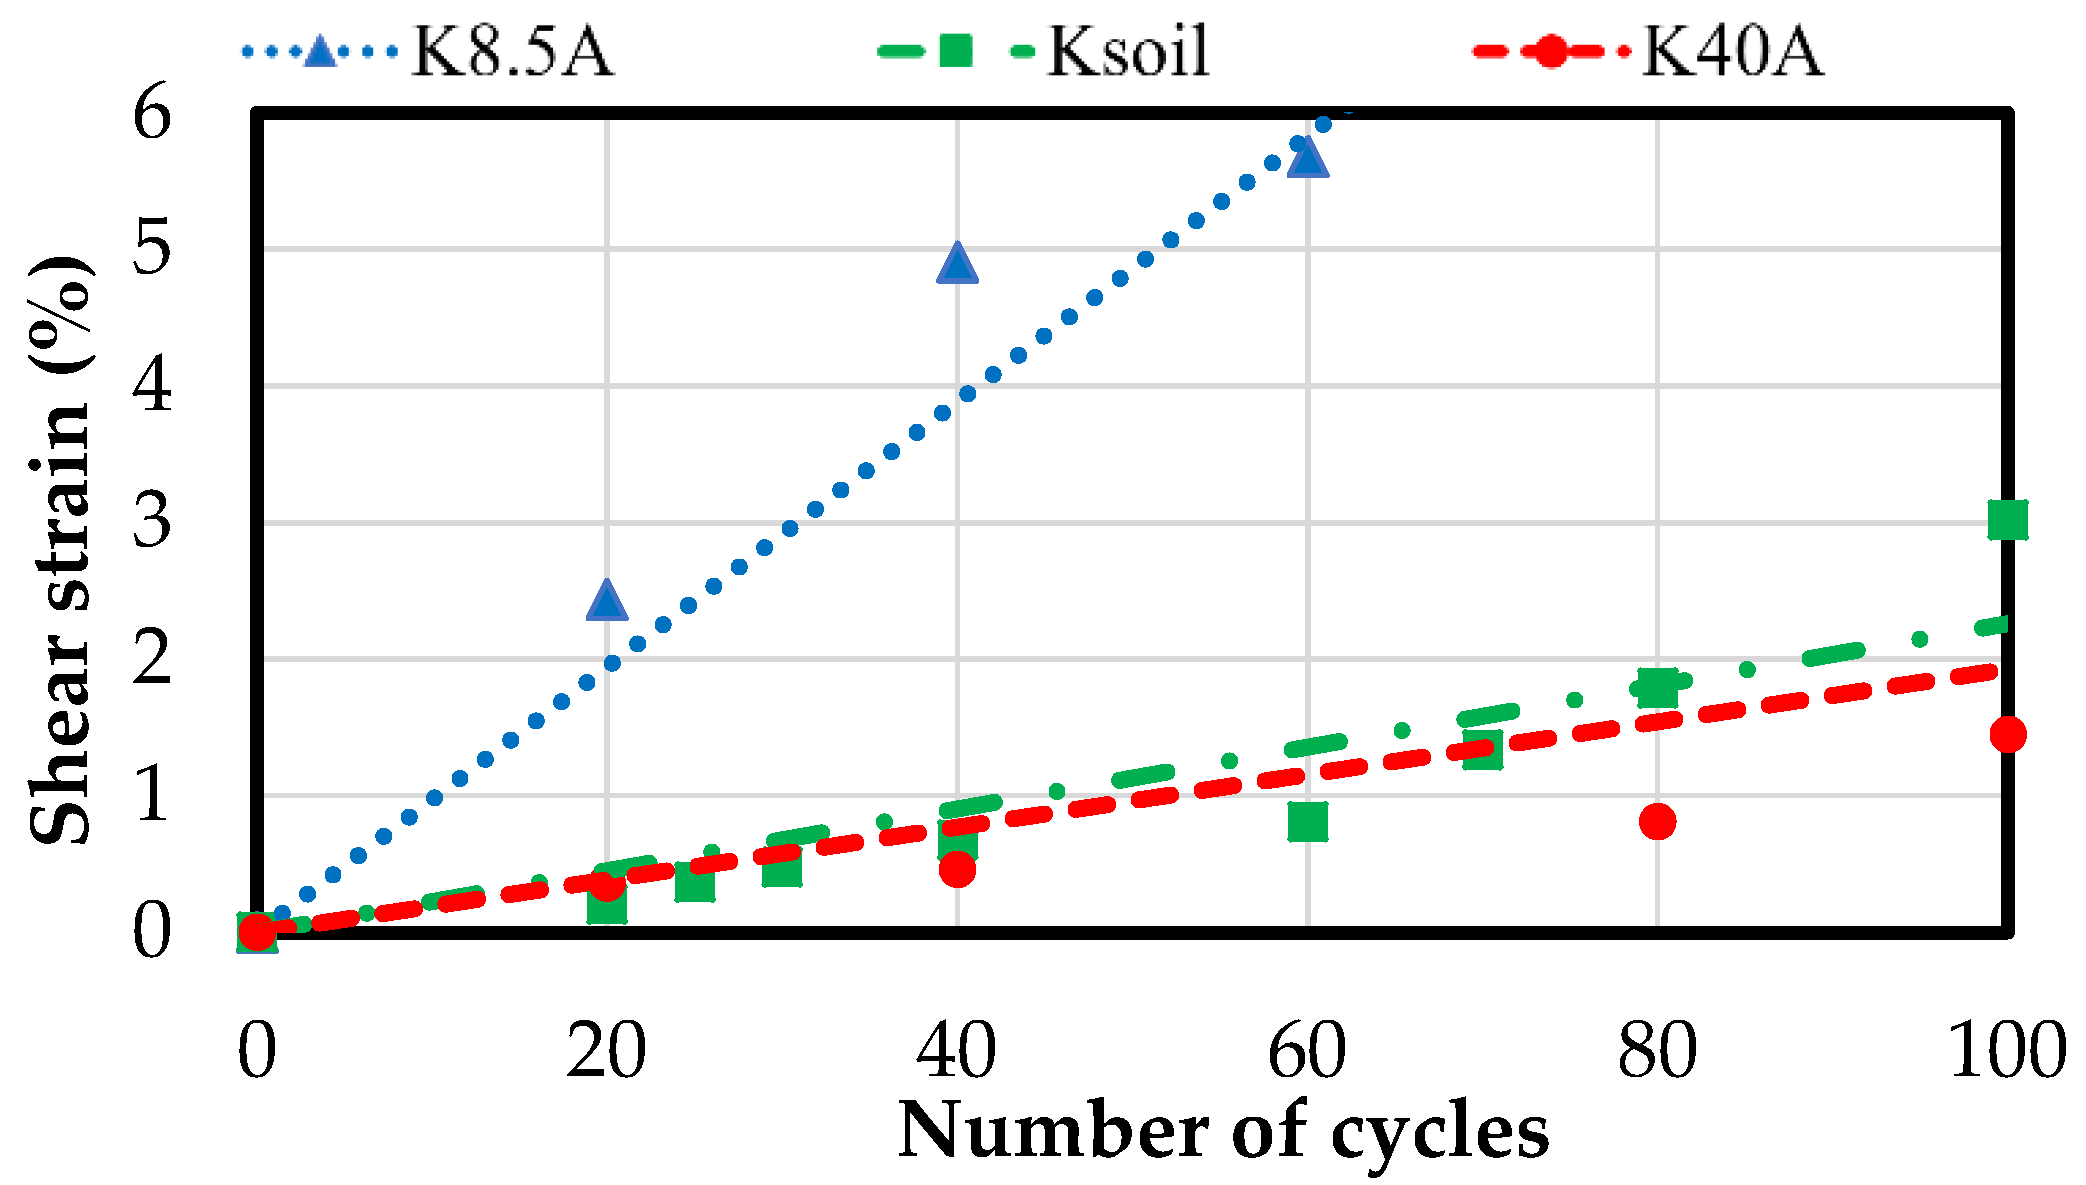
- At the same degree of compaction, the permeability of volcanic soils decreases with the increase in the fine grains content. However, the rainfall-induced failure of the slope does not depend on this factor when the shear strain is less than 6%;
- -
- The earthquake resistance of the compacted volcanic embankment subjected to previous rainfall increases as the fine content increase. Even so, this increment in seismic strength is not significant when the fines content was higher than 27%;
- -
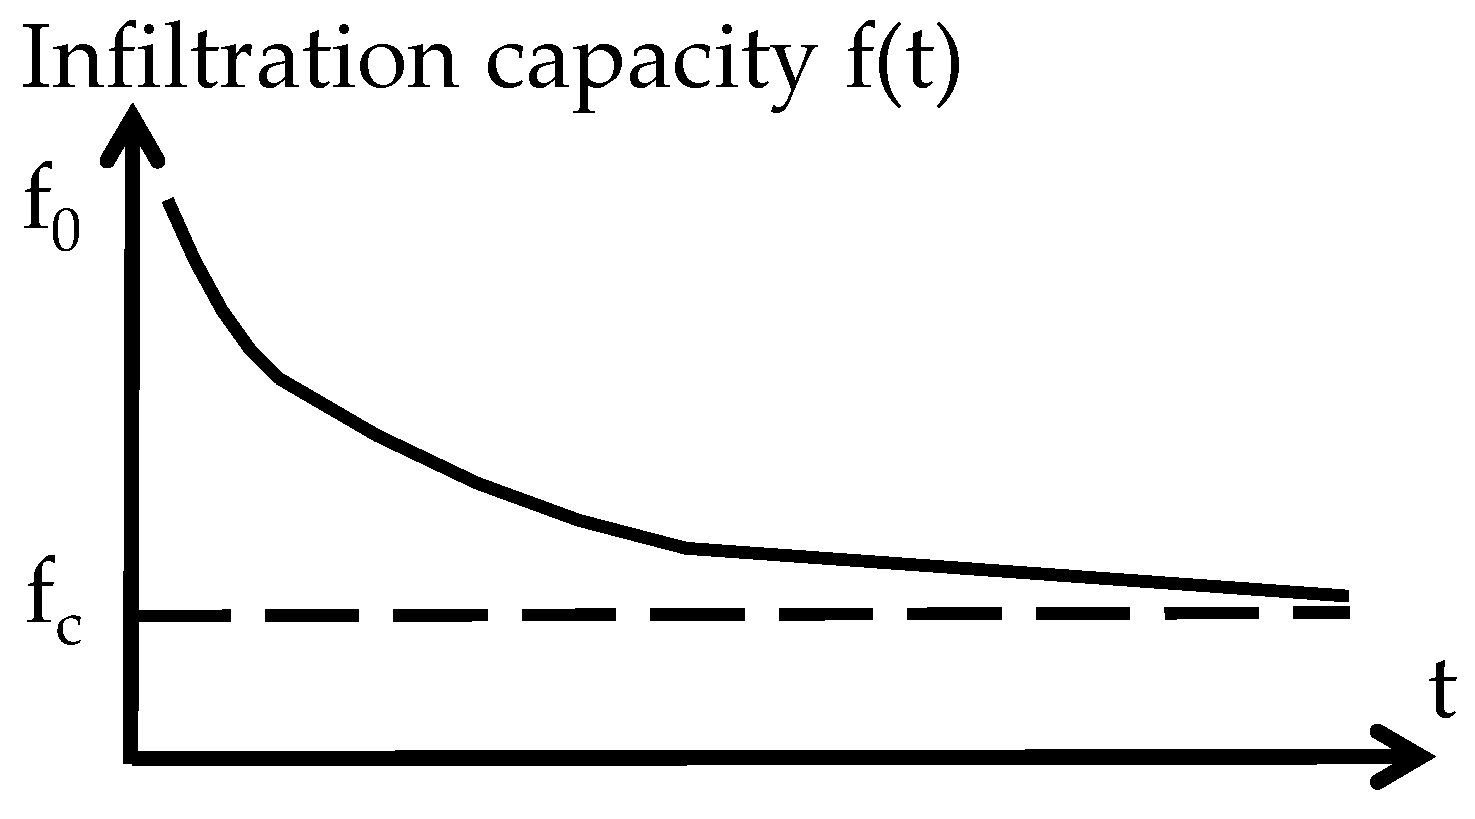
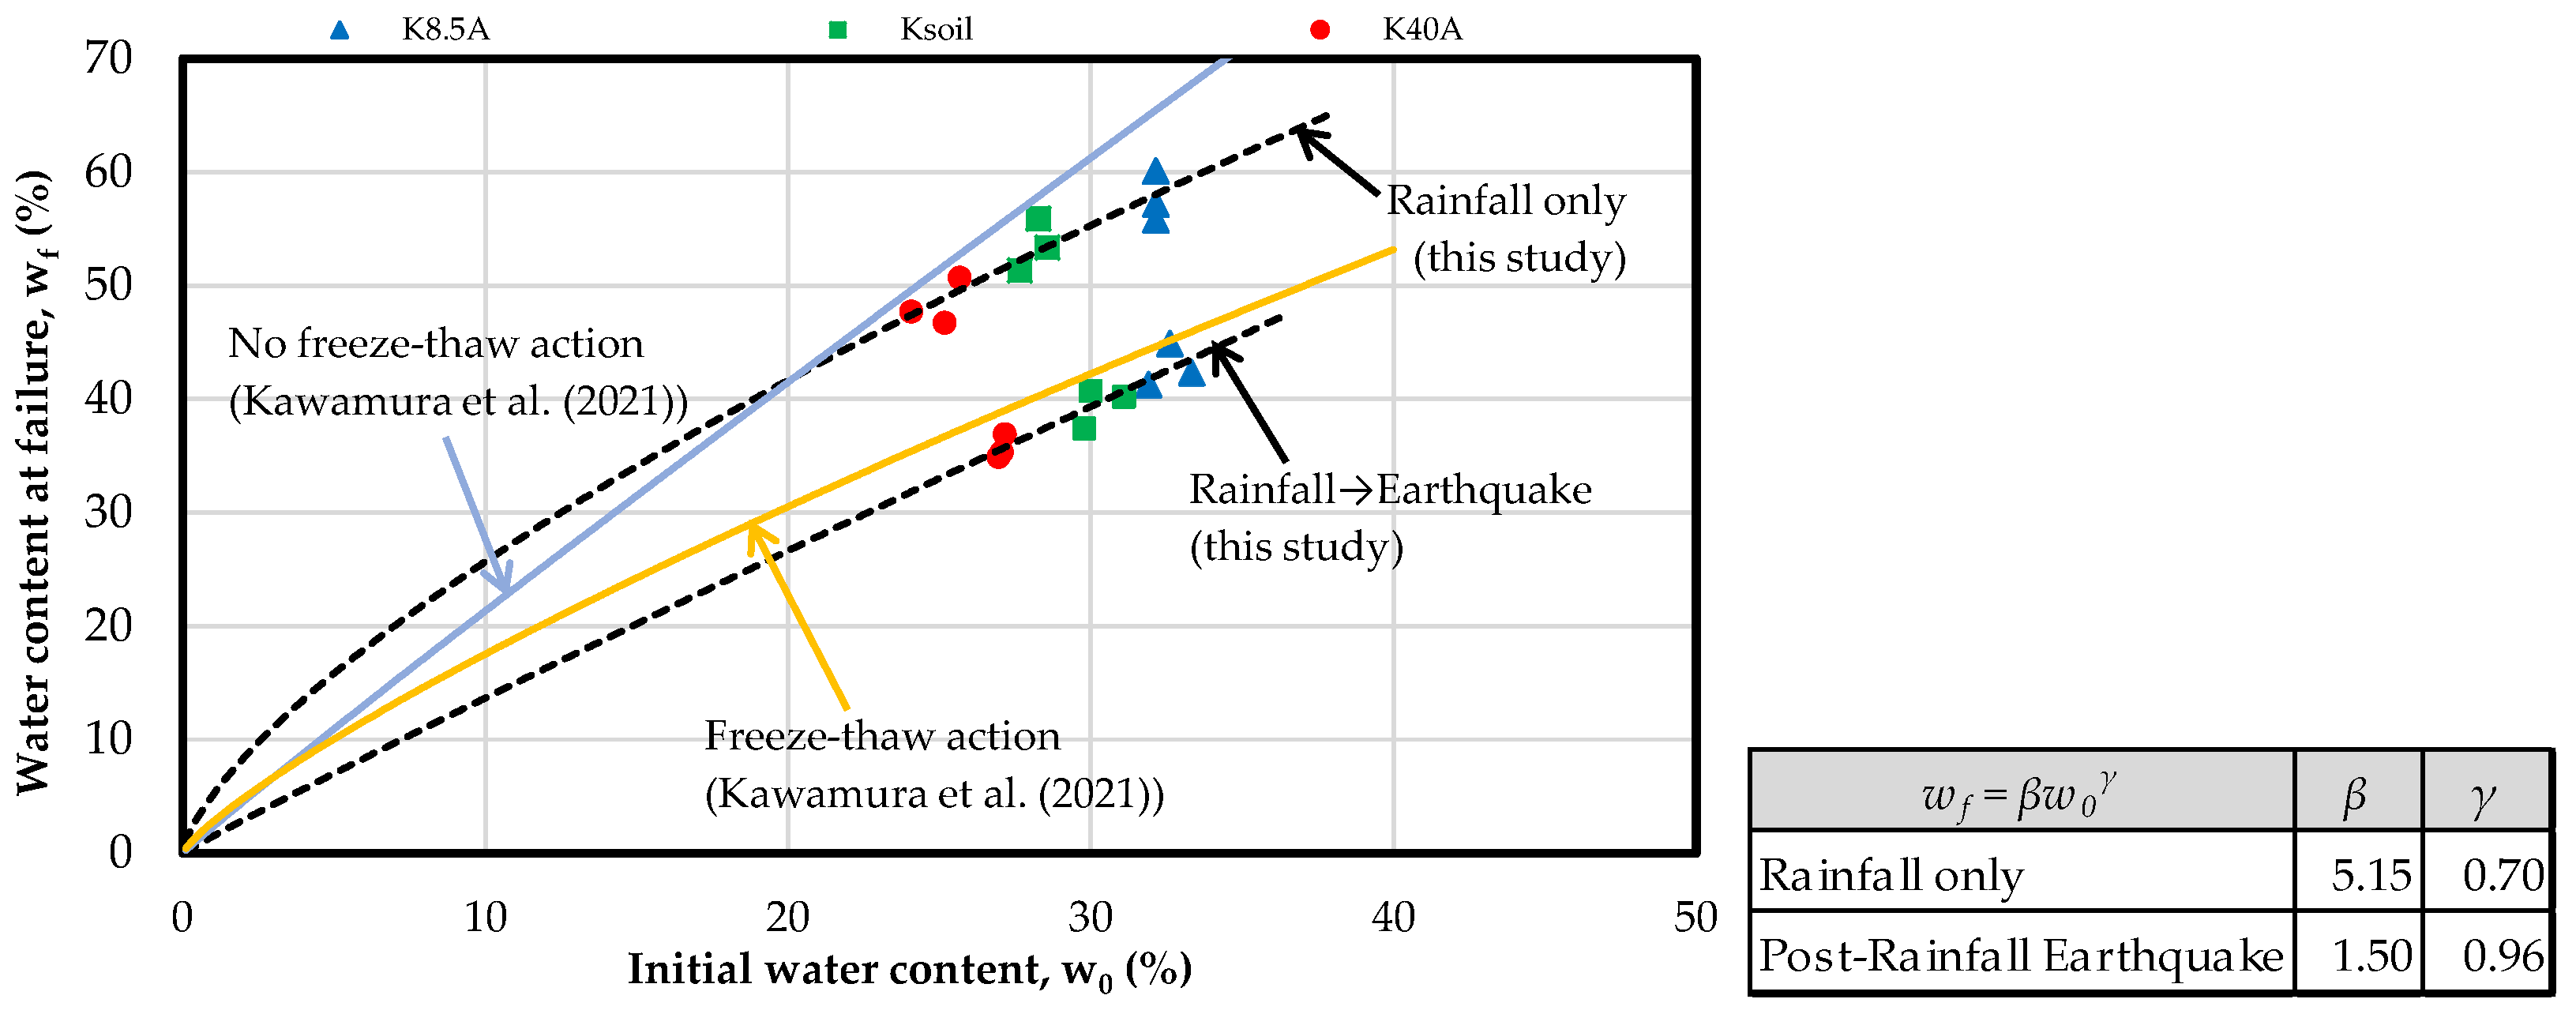
- A simple method to evaluate slope stability in practice with the measured water content as the object of assessment was proposed based on the change in soil infiltration capacity.
Author Contributions
Funding
Institutional Review Board Statement
Informed Consent Statement
Data Availability Statement
Acknowledgments
Conflicts of Interest
References
- Terzaghi, K. Mechanism of Landslides. In Application of Geology to Engineering Practice; Geological Society of America: Boulder, CO, USA, 1950; pp. 83–123. [Google Scholar]
- Kawamura, S.; Miura, S.; Ishikawa, T.; Yokohama, S. Rainfall-Induced Failure of Unsaturated Volcanic Slope Subjected to Freeze-Thaw Action and Its Mechanism. J. Geotech. Eng. 2010, 66, 577–594. (In Japanese) [Google Scholar] [CrossRef][Green Version]
- Kawamura, S.; Miura, S.; Yokohama, S.; Kudo, A.; Kaiya, N. Field Monitoring of Embankment Constructed by Volcanic Soil and Its Evaluation. In Proceedings of the Geo-Congress 2013, San Diego, CA, USA, 3–7 March 2013; American Society of Civil Engineers: Reston, CV, USA, 2013; pp. 373–382. [Google Scholar]
- Kawamura, S.; Miura, S. Rainfall-Induced Failures of Volcanic Slopes Subjected to Freezing and Thawing. Soils Found. 2013, 53, 443–461. [Google Scholar] [CrossRef]
- Kawamura, S.; Miura, S. Failure of Volcanic Slopes in Cold Regions and Its Prediction. Procedia Earth Planet. Sci. 2014, 9, 143–152. [Google Scholar] [CrossRef]
- Kawamura, S.; Miura, S. Stability of Volcanic Slopes in Cold Regions. J. Geogr. Geol. 2014, 6, 34–54. [Google Scholar] [CrossRef][Green Version]
- Kawamura, S.; Miura, S.; Dao, H.M.; Yamada, R. Rainfall-Induced Failure of Volcanic Embankments Subjected to Cyclic Loadings in Cold Regions. In Proceedings of the Geo-China 2016, Jinan, China, 25–27 July 2016; American Society of Civil Engineers: Reston, CV, USA, 2016; pp. 116–123. [Google Scholar]
- Kawamura, S.; Miura, S.; Matsumura, S. Stability Monitoring of Embankments Constructed by Volcanic Coarse-Grained Soil in Snowy-Cold Regions. J. Cold Reg. Eng. 2021, 35, 04020030. [Google Scholar] [CrossRef]
- Tuladhar, G.R.; Tiwari, B.; Marui, H. Post-Earthquake Evaluation of Higashi Takezawa Landslide Located at Niigata Prefecture of Japan. In Dynamic Response and Soil Properties, Proceedings of the Geo-Denver 2007, Denver, CO, USA, 18–21 February 2007; American Society of Civil Engineers: Reston, CV, USA, 2007; pp. 1–10. [Google Scholar]
- Matsumaru, T.; Uzuoka, R. Three-Phase Seepage-Deformation Coupled Analysis about Unsaturated Embankment Damaged by Earthquake. Int. J. Geomech. 2016, 16, C4016006. [Google Scholar] [CrossRef]
- Vickneswaran, T.; Ravichandran, N. Multi Hazard Analysis of Earth Slopes Using Coupled Geotechnical-Hydrological Finite Element Model. In Proceedings of the Geo-Congress 2020, Minneapolis, MN, USA, 25–28 February 2020; American Society of Civil Engineers: Reston, CV, USA, 2020; pp. 60–69. [Google Scholar]
- Rocha, M. The Possibility of Solving Soil Mechanics Problems by the use of Models. In Proceedings of the 4th International Conference on Soil Mechanics and Foundation Engineering, London, UK, 12–24 August 1957; Butterworths Scientific Publications: London, UK, 1957; Volume 1, pp. 183–188. [Google Scholar]
- Minardo, A.; Zeni, L.; Coscetta, A.; Catalano, E.; Zeni, G.; Damiano, E.; De Cristofaro, M.; Olivares, L. Distributed Optical Fiber Sensor Applications in Geotechnical Monitoring. Sensors 2021, 21, 7514. [Google Scholar] [CrossRef] [PubMed]
- Zhang, Y.; Tang, H.; Li, C.; Lu, G.; Cai, Y.; Zhang, J.; Tan, F. Design and Testing of a Flexible Inclinometer Probe for Model Tests of Landslide Deep Displacement Measurement. Sensors 2018, 18, 224. [Google Scholar] [CrossRef] [PubMed]
- Tiwari, B.; Ajmera, B.; Tran, D. Influence of Post-Earthquake Rainfall on the Stability of Clay Slopes (IPL-192). In Proceedings of the Advancing Culture of Living with Landslides, Ljubljana, Slovenia, 29 May–2 June 2017; Springer Nature: Cham, Switzerland, 2017; pp. 429–436. [Google Scholar]
- Tiwari, B.; Ajmera, B.; Tran, D.; Caballero, S. Effect of Post-Earthquake Rainfall in Triggering Landslides. In Proceedings of the 19th International Conference on Soil Mechanics and Geotechnical Engineering, Seoul, Korea, 17–22 September 2017; pp. 3533–3536. [Google Scholar]
- Ishikawa, T.; Yoshimi, M.; Isobe, K.; Yokohama, S. Reconnaissance Report on Geotechnical Damage Caused by 2018 Hokkaido Eastern Iburi Earthquake with JMA Seismic Intensity 7. Soils Found. 2021, 61, 1151–1171. [Google Scholar] [CrossRef]
- Ng, C.W.; Pang, Y.W. Experimental Investigations of the Soil-Water Characteristics of a Volcanic Soil. Can. Geotech. J. 2000, 37, 1252–1264. [Google Scholar] [CrossRef]
- Hernandez, O.; Neto, M.P.C.; Caicedo, B. Structural Features and Hydro-Mechanical Behaviour of a Compacted Andesitic Volcanic Soil. Géotech. Lett. 2018, 8, 195–200. [Google Scholar] [CrossRef]
- Miura, S.; Yagi, K.; Asonuma, T. Deformation-Strength Evaluation of Crushable Volcanic Soils by Laboratory and In-Situ Testing. Soils Found. 2003, 43, 47–57. [Google Scholar] [CrossRef]
- Ishikawa, T.; Miura, S. Influence of Freeze-Thaw Action on Deformation-Strength Characteristics and Particle Crushability of Volcanic Coarse-Grained Soils. Soils Found. 2011, 51, 785–799. [Google Scholar] [CrossRef]
- Miura, S.; Yagi, K. Particle Breakage of Volcanic Coarse-Grained Soils and Its Evaluation. J. Geotech. Eng. 1997, 561, 257–269. (In Japanese) [Google Scholar] [CrossRef][Green Version]
- Liu, X.; Yang, J. Laboratory Measurement of Small-Strain Shear Modulus of Volcanic Soil. In Proceedings of the Geo-Congress 2014 Technical Papers, Atlanta, GA, USA, 23–26 February 2014; American Society of Civil Engineers: Reston, CV, USA, 2014; pp. 113–122. [Google Scholar]
- Matsumura, S.; Tatsuoka, F. Effect of Compaction Conditions and Fines Content on Cyclic Undrained Strength of Saturated Soils. Soil Dyn. Earthq. Eng. 2018, 112, 152–161. [Google Scholar] [CrossRef]
- Hieu, D.M.; Kawamura, S.; Matsumura, S. Internal Erosion of Volcanic Coarse Grained Soils and Its Evaluation. Int. J. GEOMATE 2017, 13, 165–172. [Google Scholar] [CrossRef]
- Kawamura, S.; Kawajiri, S.; Hirose, W.; Watanabe, T. Slope Failures/Landslides over a Wide Area in the 2018 Hokkaido Eastern Iburi Earthquake. Soils Found. 2019, 59, 2376–2395. [Google Scholar] [CrossRef]
- JGS 0131-2009; Test Method for Particle Size Distribution of Soils. Japanese Geotechnical Society: Tokyo, Japan, 2009.
- JGS 0711-2009; Test Method for Soil Compaction Using a Rammer. Japanese Geotechnical Society: Tokyo, Japan, 2009.
- JGS 0161-2009; Test Method for Minimum and Maximum Densities of Sands. Japanese Geotechnical Society: Tokyo, Japan, 2009.
- Hayashi, M.; Kawamura, S. Effect of Particle Breakage on Permeability of Volcanic Coarse-Grained Soils. In Proceedings of the 54th Japan National Conference on Geotechnical Engineering, Saitama, Japan, 16–18 July 2019; Japanese Geotechnical Society: Tokyo, Japan, 2019; pp. 849–850. (In Japanese). [Google Scholar]
- Matsumura, S. Laboratory and In-Situ Studies on Mechanical Properties of Volcanic Soil Embankment in Cold Region. Ph.D. Thesis, Graduate School of Engineering, Hokkaido University, Hokkaido, Japan, 2014. [Google Scholar]
- Dao, M.H. Stability Evaluation on Internal Erosion of Volcanic Coarse-Grained Soil. Ph.D. Thesis, Graduate School of Engineering, Muroran Institute of Technology, Hokkaido, Japan, 2018. [Google Scholar]
- KYOWA. BPR-A-S Small-sized Pore Pressure Transducer—Technical Specifications. Available online: https://www.kyowa-ei.com/eng/product/category/sensors/bpr-a-s/index.html (accessed on 4 June 2022).
- METER Group. ECH2O EC-5—Technical Specifications. Available online: https://www.metergroup.com/en/meter-environment/products/ech20-ec-5/ech20-ec-5-tech-specs (accessed on 4 June 2022).
- METER Group. Cited Publications for ECH2O EC-5. Available online: https://www.metergroup.com/en/meter-environment/products/ech20-ec-5/cited-publications-ech20-ec-5 (accessed on 4 June 2022).
- KYOWA. ASW-A Waterproof Acceleration Transducer—Technical Specifications. Available online: https://www.kyowa-ei.com/eng/product/category/sensors/asw-a/index.html (accessed on 4 June 2022).
- Watabe, Y.; Nishimura, S. Ground Movements and Damage in Satozuka District, Sapporo Due to 2018 Hokkaido Eastern Iburi Earthquake. Soils Found. 2020, 60, 1331–1356. [Google Scholar] [CrossRef]
- Horton, R.E. Analysis of Runoff-Plat Experiments with Varying Infiltration-Capacity. Eos Trans. Am. Geophys. Union 1939, 20, 693–711. [Google Scholar] [CrossRef]


| Sample | ρs (g/cm3) | emax | emin | D501 (mm) | Uc2 | Fc3 (%) |
|---|---|---|---|---|---|---|
| Spfl | 2.47 | 2.25 | 1.21 | 0.27 | 46 | 26.0~42.6 |
| Toyoura sand | 2.68 | 0.96 | 0.64 | 0.18 | 1.5 | 0 |
| Parameters | K8.5A | Ksoil | K40A |
|---|---|---|---|
| Fine particles content, Fc (%) | 8.5 | 27 | 40 |
| Optimum water content, wopt (%) | 35.81 | 34.32 | 31.20 |
| Maximum dry density, ρd max (g/cm3) | 1.0412 | 1.1049 | 1.1241 |
| Mean grain size, D50 (mm) | 0.50 | 0.27 | 0.16 |
| Uniformity coefficient, Uc | 10.6 | 62.5 | 42.8 |
| Soil particle density, ρs (g/cm3) | 2.5289 | 2.5203 | 2.5134 |
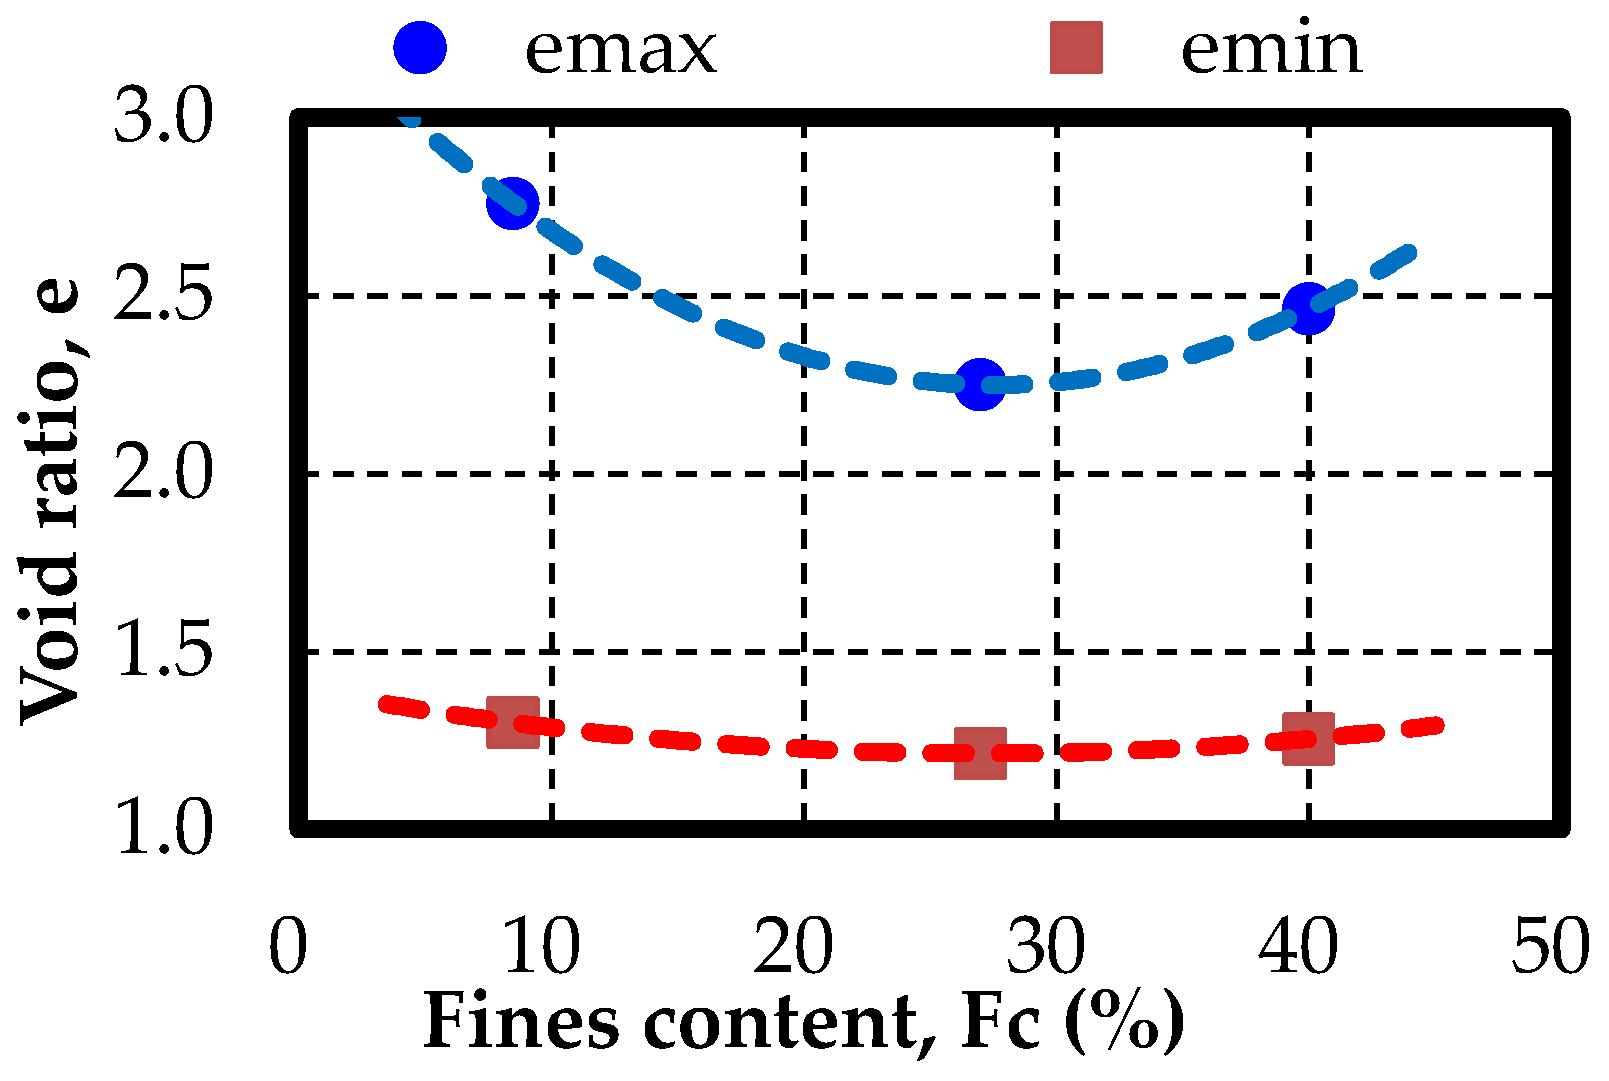
| Maximum void ratio, emax | 2.76 | 2.25 | 2.46 |
| Minimum void ratio, emin | 1.30 | 1.21 | 1.25 |
| Liquid limit, wL (%) | 46.7 | ||
| Plasticity index, wP (%) | Unavailable | ||
| Plasticity index, IP | NP | ||
| Grain Size (mm) | 4.75~9.5 | 2.0~4.75 | 0.85~2.0 | 0.425~0.85 | 0.25~0.425 | 0.106~0.25 | 0.075~0.106 | <0.075 |
|---|---|---|---|---|---|---|---|---|
| Index i | 1 | 2 | 3 | 4 | 5 | 6 | 7 | 8 |
| Soil particle density, ρsi (g/cm3) | 2.595 | 2.591 | 2.569 | 2.587 | 2.519 | 2.444 | 2.414 | 2.484 |
| Parameters | K8.5A | Ksoil | K40A |
|---|---|---|---|
| Fines content (%) | 8.5 | 27 | 40 |
| Slope angle (°) | 45 | 45 | 45 |
| Length of base (mm) | 400 | 400 | 400 |
| Initial water content (%) | 32 | 31 | 28 |
| Rainfall intensity (mm/h) | 100 | 100 | 100 |
| Acceleration (m/s2) | 2.8 | 2.8 | 2.8 |
| Degree of compaction (%) | 90 | 90 | 90 |
| Dry density (g/cm3) | 0.93 | 0.99 | 1.00 |
| Void ratio | 1.72 | 1.55 | 1.50 |
| Rainfall-only experiments | |||
| Rainfall time (min) | 30 | 30 | 30, 75 |
| Post-rainfall earthquake experiments | |||
| Rainfall time (min) | 5 | 5 | 4.5 |
| Shear strain after rainfall (%) | 3.88 | 4.68 | 3.11 |
| Dissipation time (s) | 90 | 90 | 90 |
| Number of cycles | 100 | 100 | 100, 200 |
| Parameters | Scale (Model/Prototype) |
|---|---|
| Length (L) | 1/λ |
| Time (t) | 1/λ0.75 |
| Soil density (ρ) | 1 |
| Gravity acceleration (g) | 1 |
| Stress (σ) | 1/λ |
| Strain (ε) | 1/λ0.5 |
| Deformation (d) | 1/λ1.5 |
| Friction (tanϕ) | 1 |
| Cohesion (c) | 1/λ |
| Permeability (f) | 1/λ0.25 |
| Pore water pressure (u) | 1/λ |
| Saturation degree (Sr) | 1 |
| Test Samples | Fc1 (%) | Fc2 (%) | Fc3 (%) | Fc4 (%) | m4 (kg) |
|---|---|---|---|---|---|
| K8.5A | 5.47 | 8.61 | 9.12 | 12.68 | 6.22 |
| Ksoil | 24.24 | 27.34 | 28.49 | 38.49 | 0.84 |
| K40A | 37.07 | 40.24 | 41.18 | 53.33 | 1.02 |
Publisher’s Note: MDPI stays neutral with regard to jurisdictional claims in published maps and institutional affiliations. |
© 2022 by the authors. Licensee MDPI, Basel, Switzerland. This article is an open access article distributed under the terms and conditions of the Creative Commons Attribution (CC BY) license (https://creativecommons.org/licenses/by/4.0/).
Share and Cite
Nguyen, T.N.; Kawamura, S.; Dao, M.H.; Inaba, T. Influence of Fines Content on the Stability of Volcanic Embankments under Rainfall and Earthquake. Water 2022, 14, 2096. https://doi.org/10.3390/w14132096
Nguyen TN, Kawamura S, Dao MH, Inaba T. Influence of Fines Content on the Stability of Volcanic Embankments under Rainfall and Earthquake. Water. 2022; 14(13):2096. https://doi.org/10.3390/w14132096
Chicago/Turabian StyleNguyen, Trong Nam, Shima Kawamura, Minh Hieu Dao, and Takumi Inaba. 2022. "Influence of Fines Content on the Stability of Volcanic Embankments under Rainfall and Earthquake" Water 14, no. 13: 2096. https://doi.org/10.3390/w14132096
APA StyleNguyen, T. N., Kawamura, S., Dao, M. H., & Inaba, T. (2022). Influence of Fines Content on the Stability of Volcanic Embankments under Rainfall and Earthquake. Water, 14(13), 2096. https://doi.org/10.3390/w14132096