
Wave-Powered and Zero-Discharging Membrane-Distillation Desalination System: Conceptual Design and Analysis


Abstract
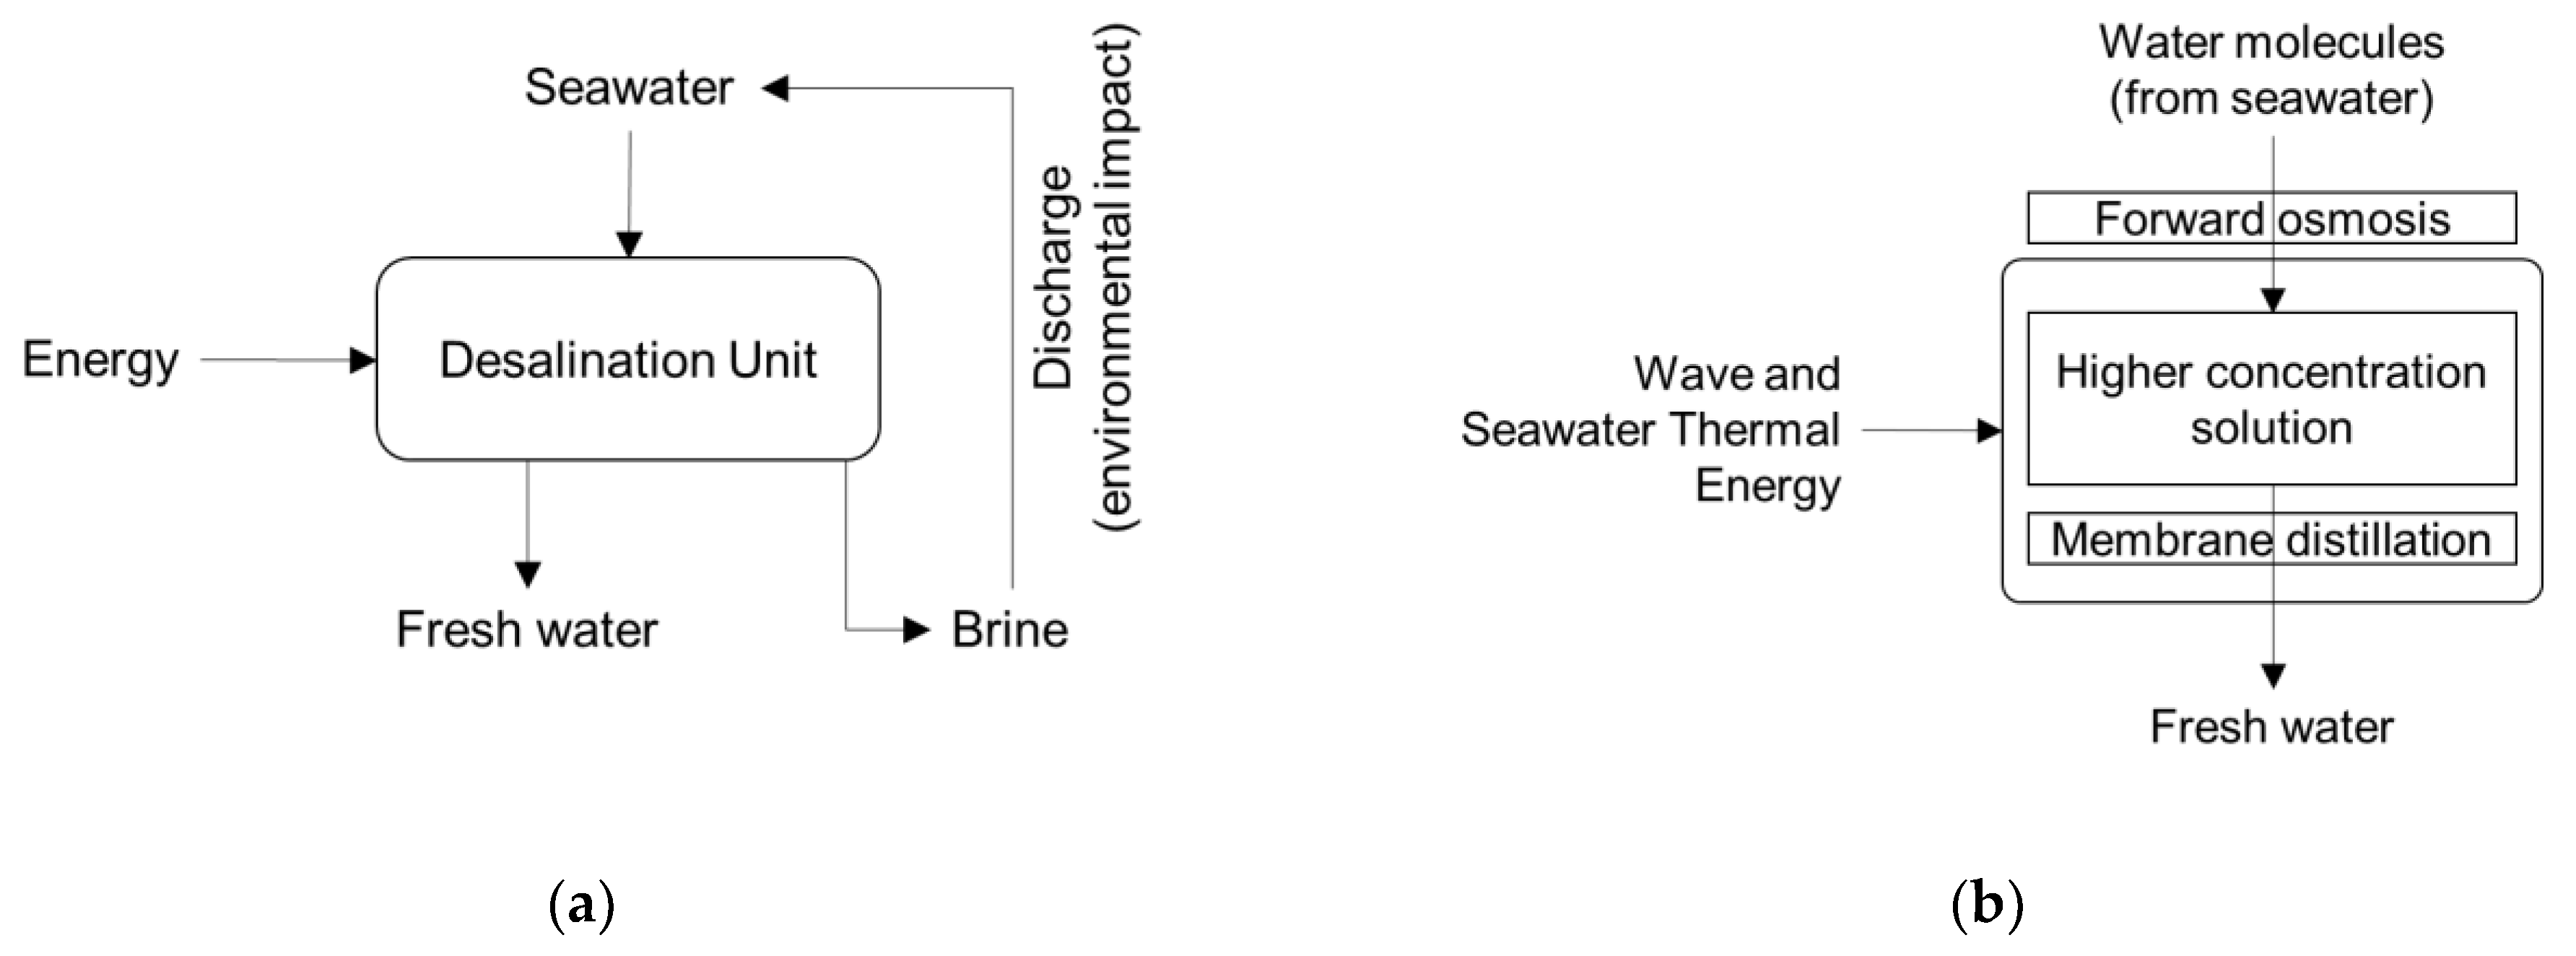
:1. Introduction
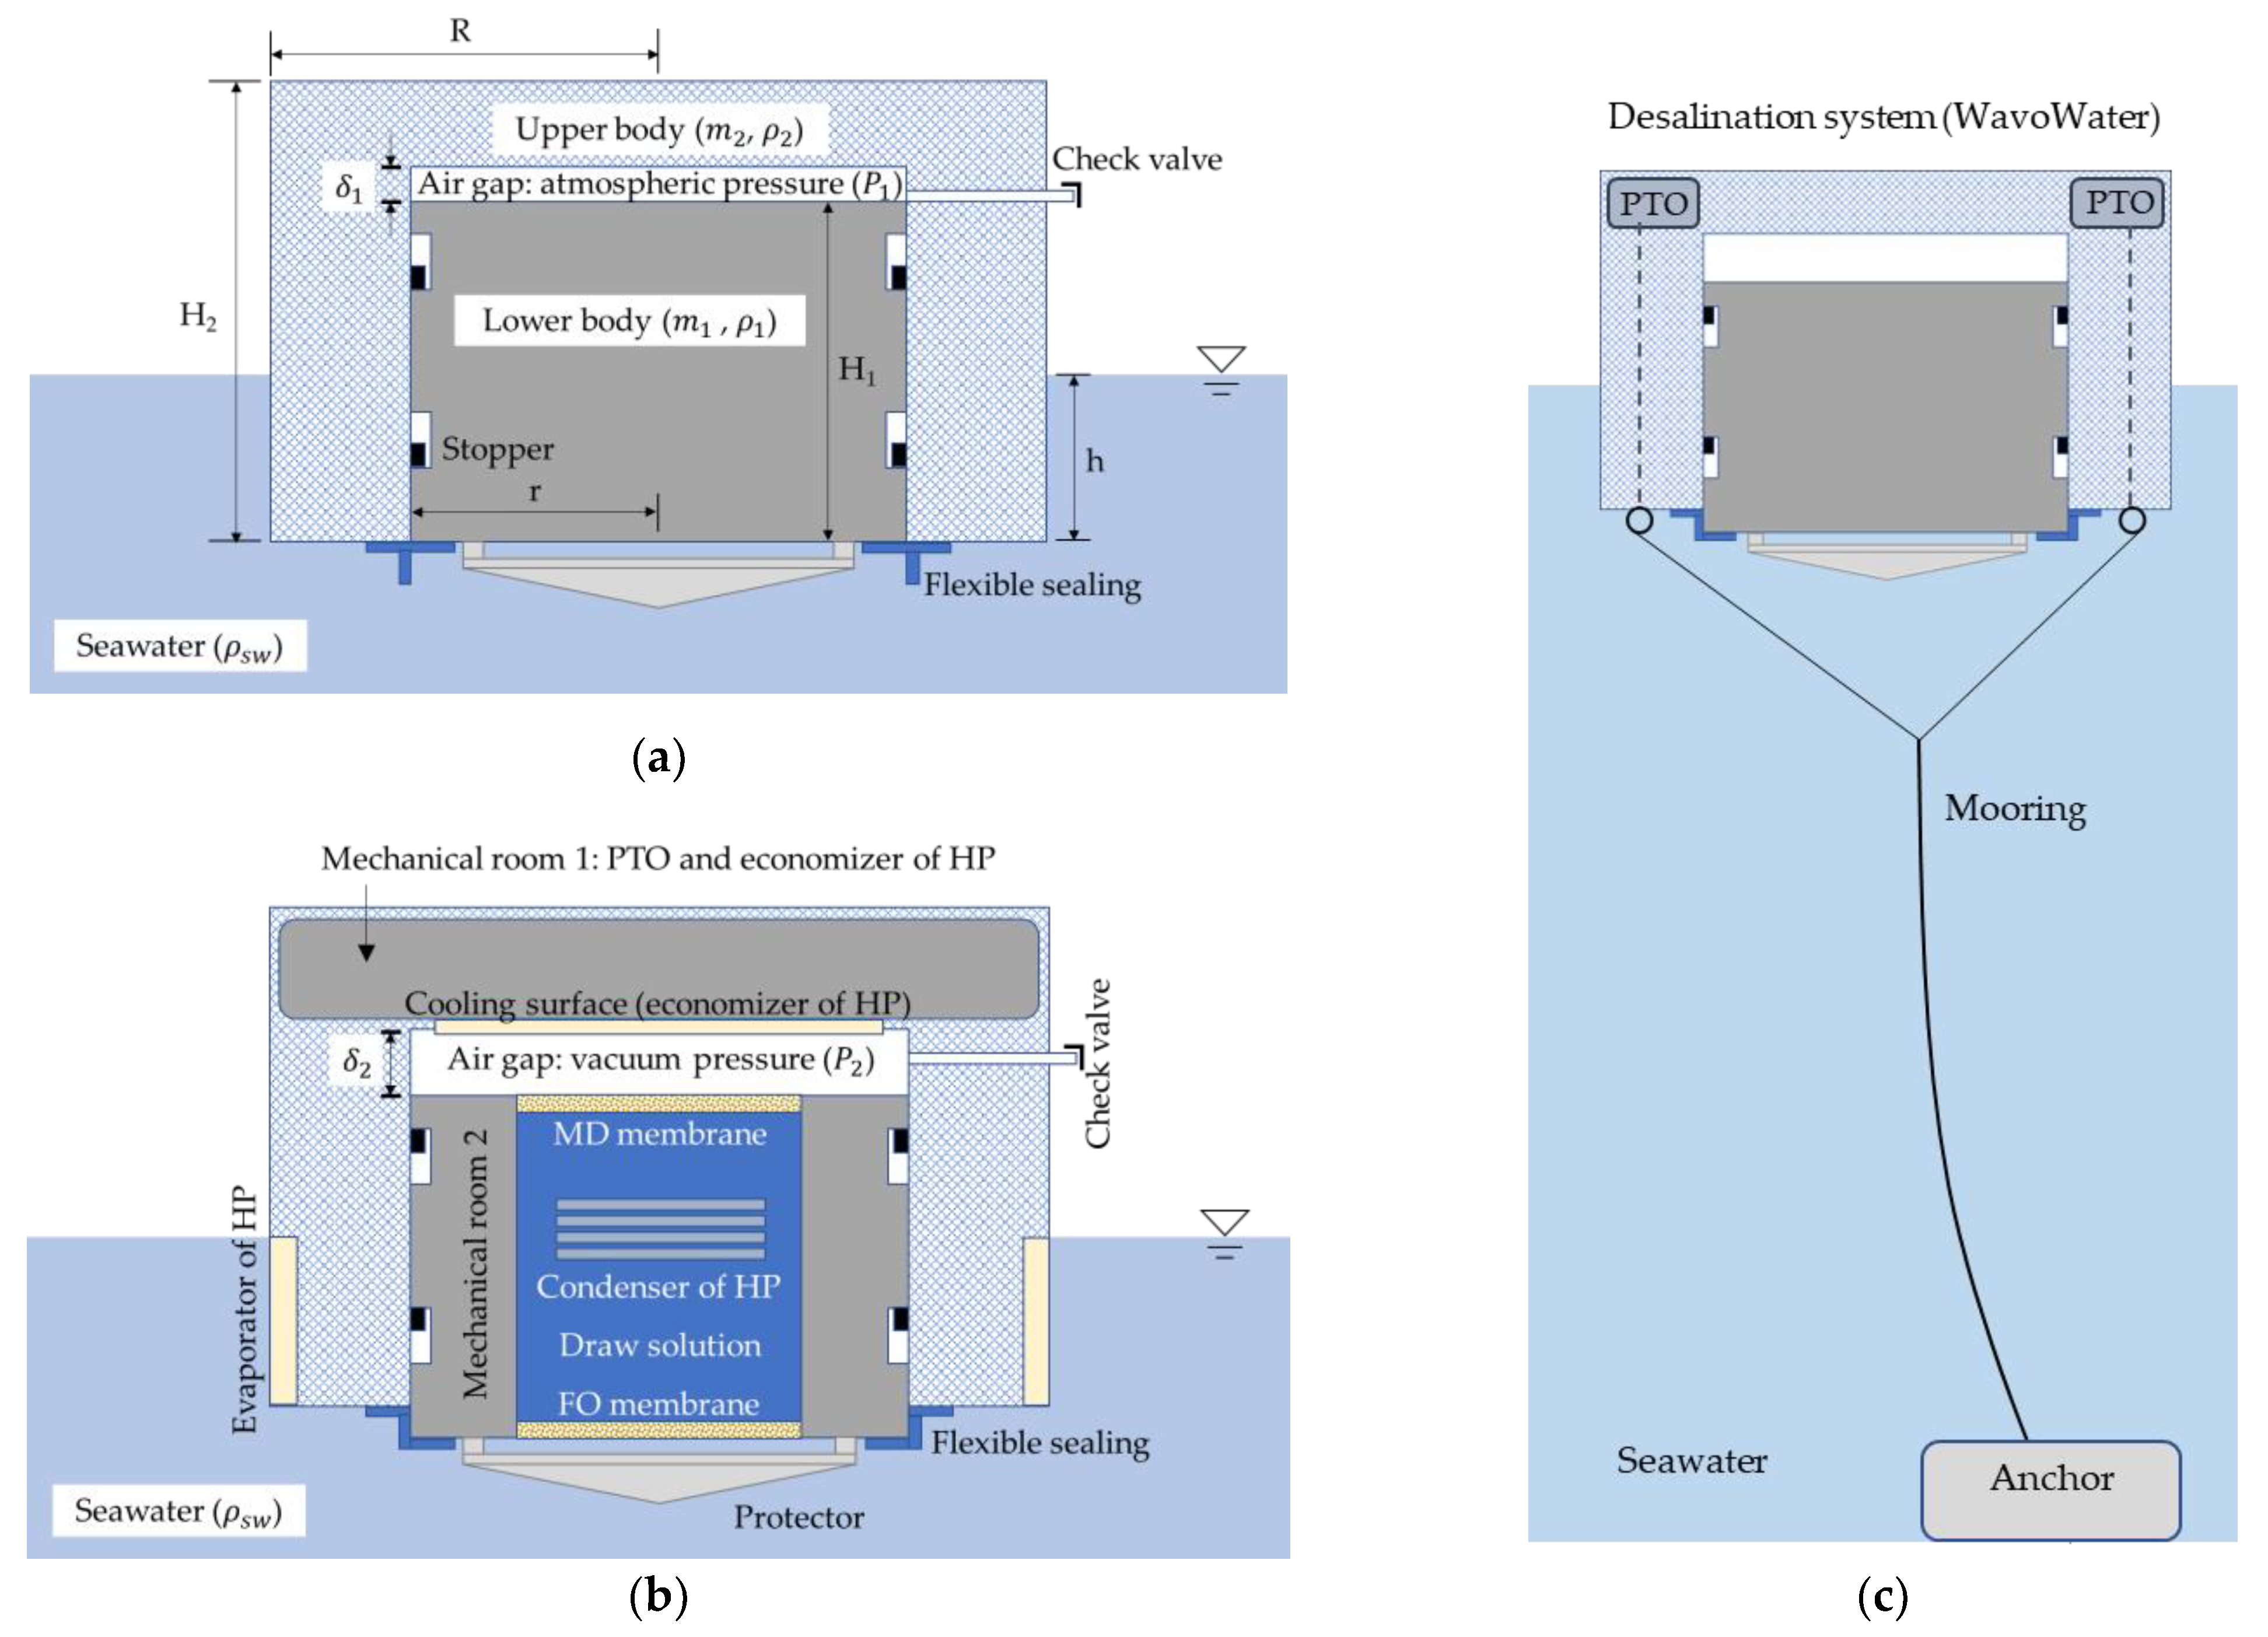
2. Wave-Powered Desalination System
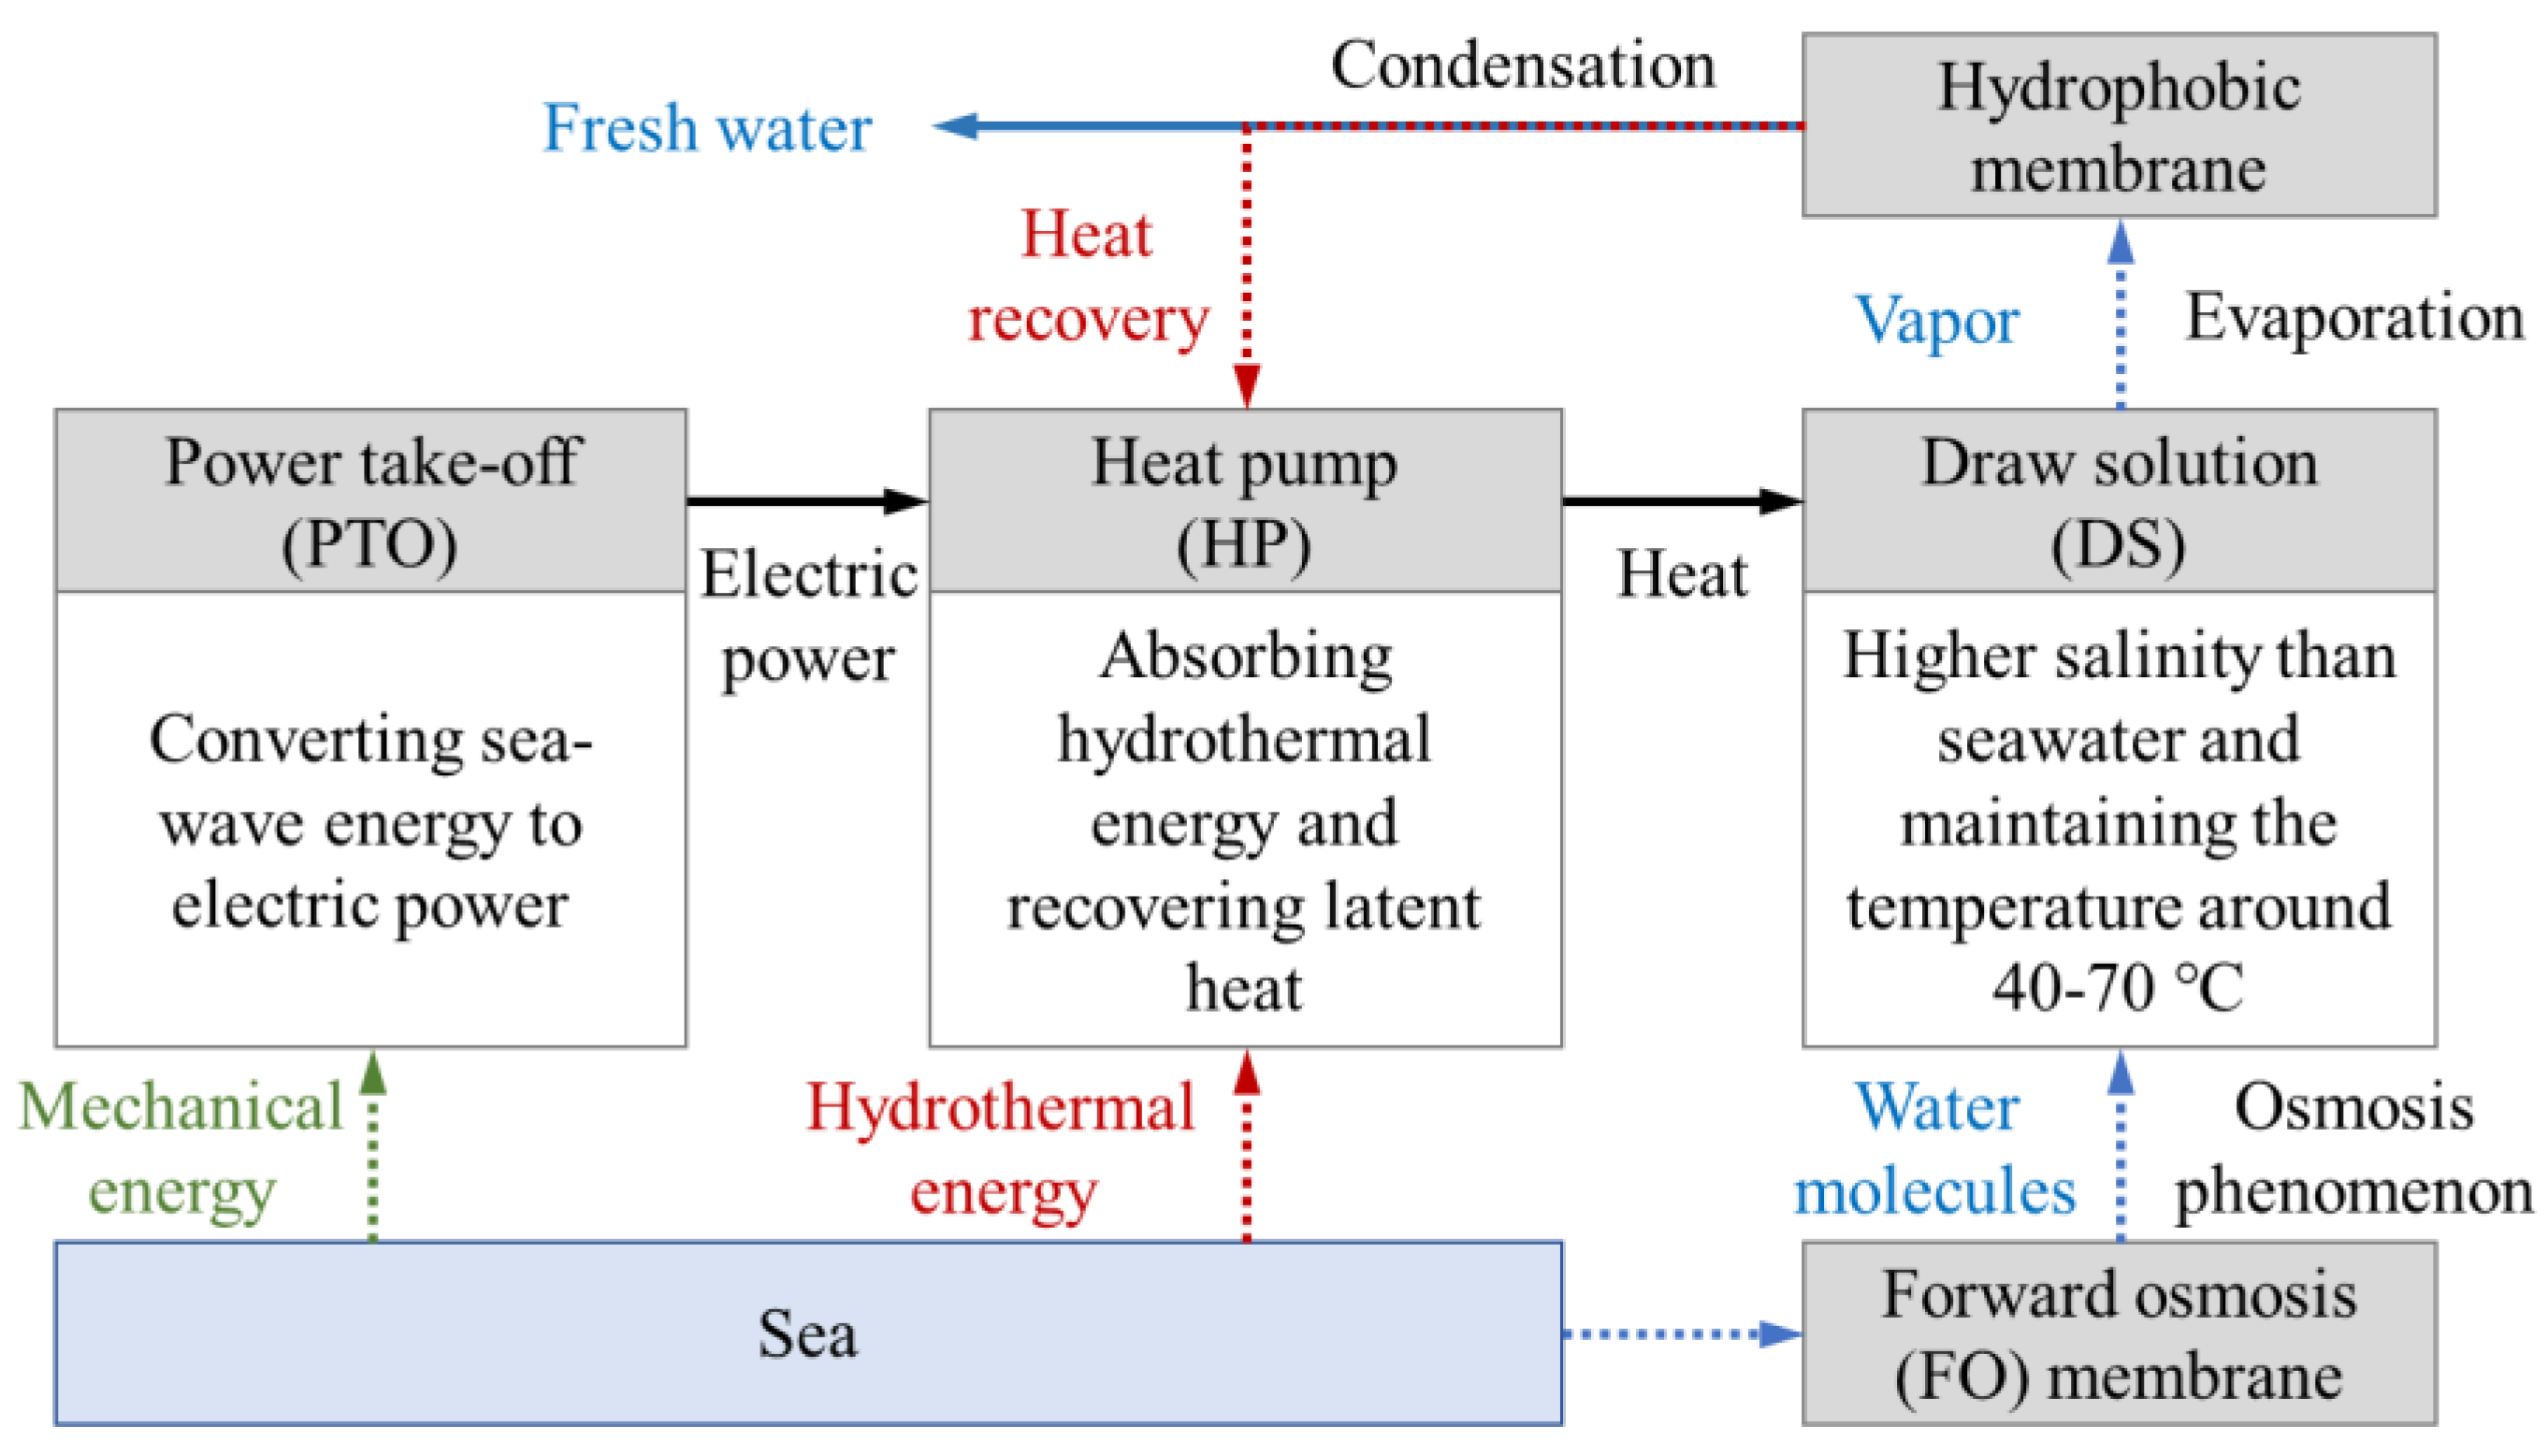
2.1. Concept Description
- (i)
- converting sea-wave energy to electric power for the heat pump (HP) operation using the power take-off (PTO) inside the WavoWater;
- (ii)
- absorbing hydrothermal energy from the sea and heating DS using the HP;
- (iii)
- generating water vapor flux through the hydrophobic membrane by the evaporation process;
- (iv)
- condensing water vapor in the air gap; and
- (v)
- transporting water molecules from the sea to the DS by the natural osmotic phenomenon.
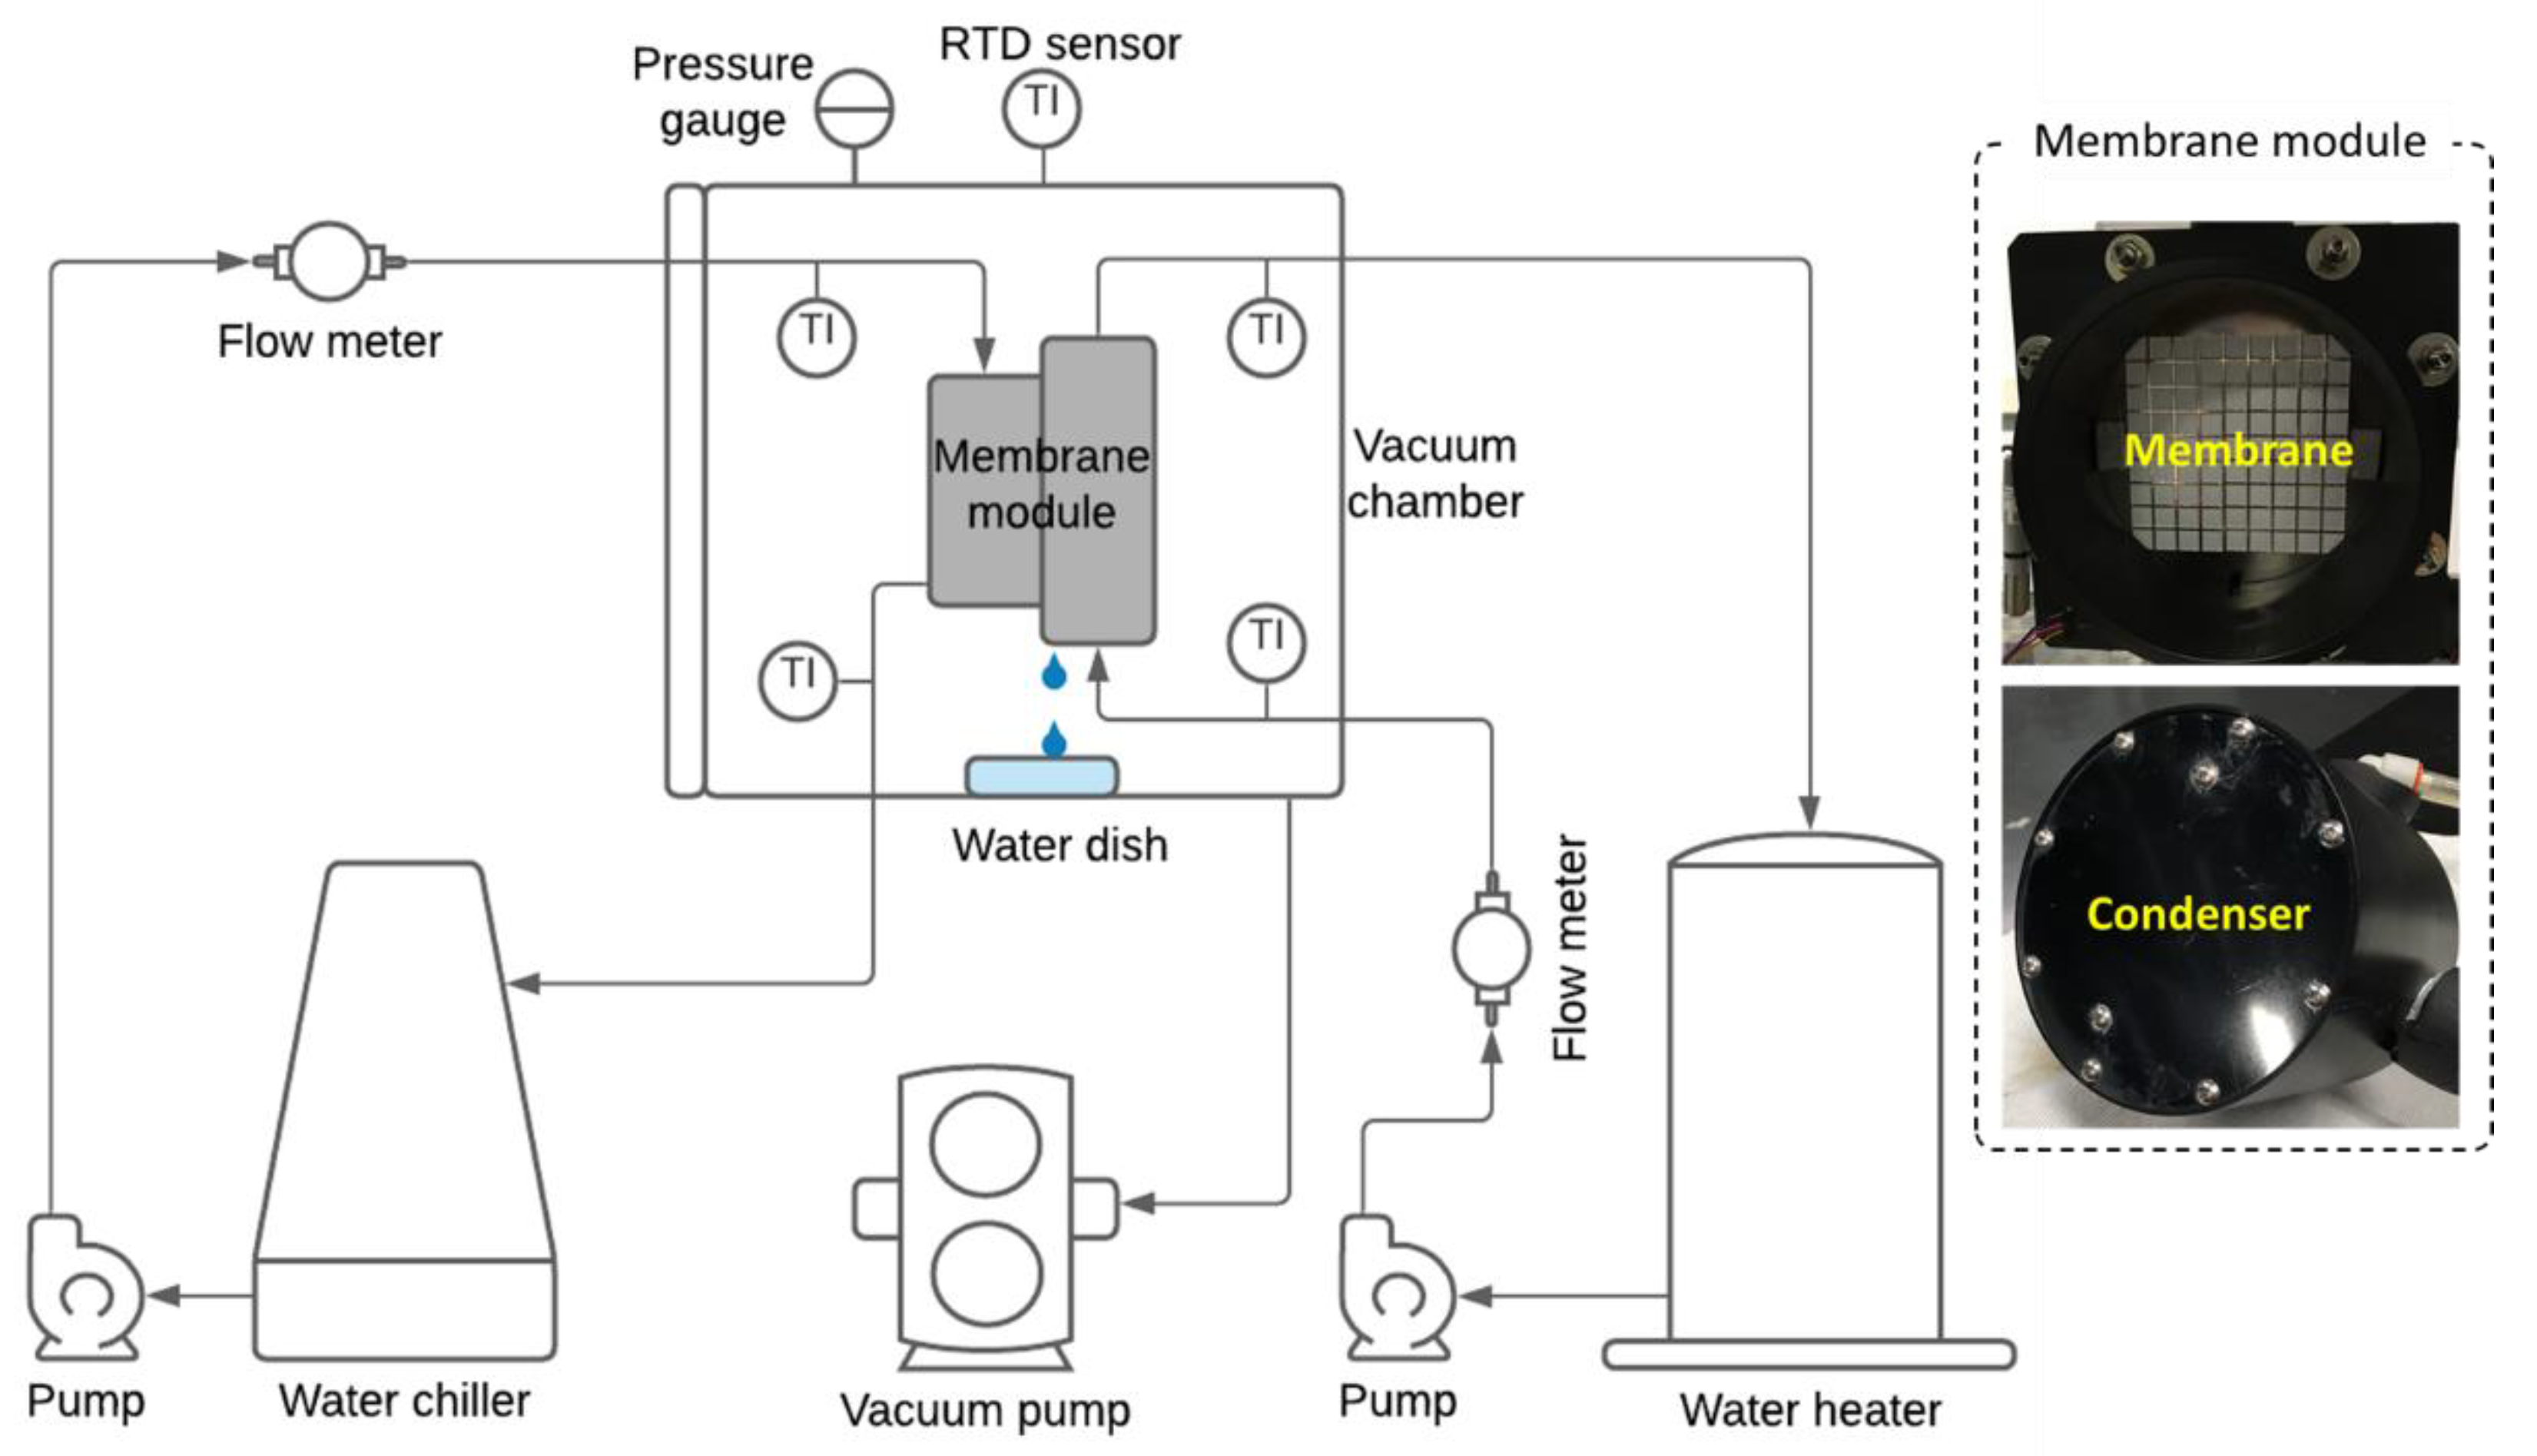
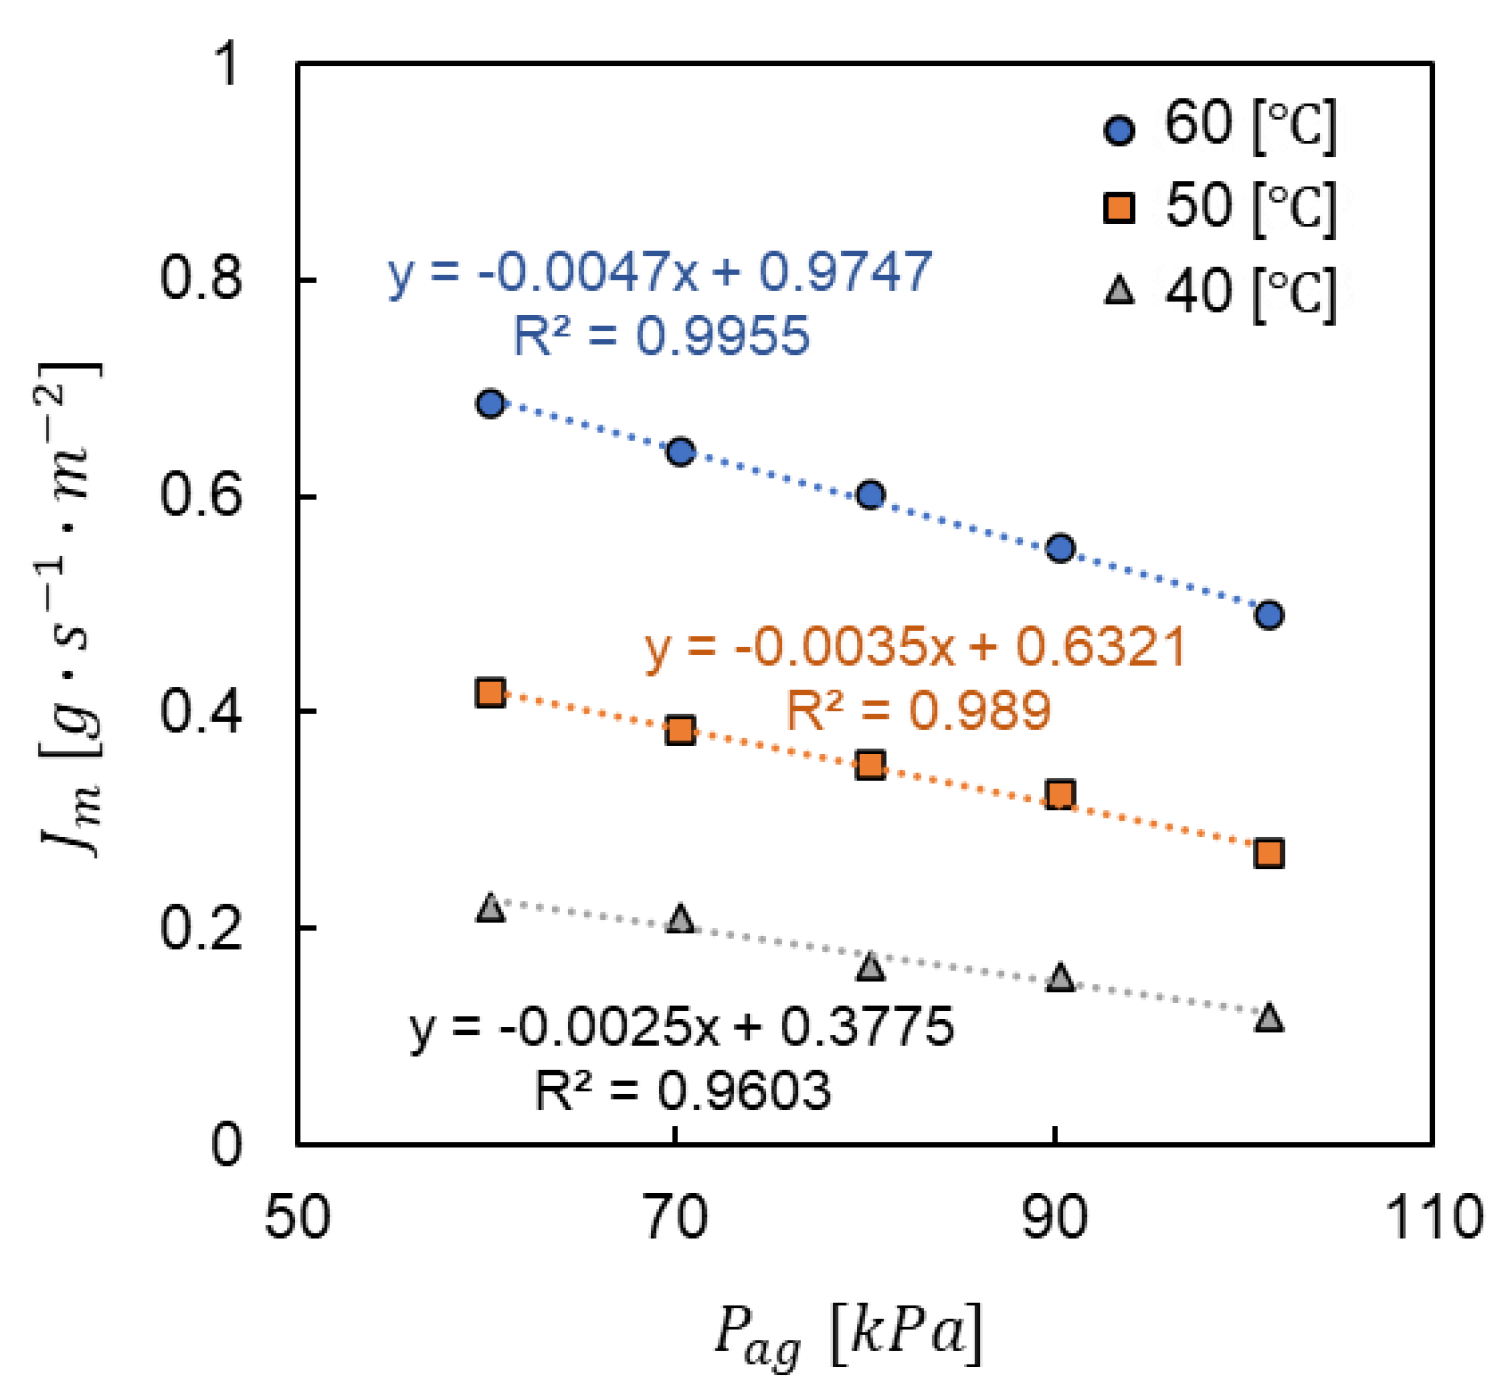
2.2. Vacuum-Enhanced Air-Gap Membrane Distillation (AGMD)
2.3. Forward Osmosis Membrane
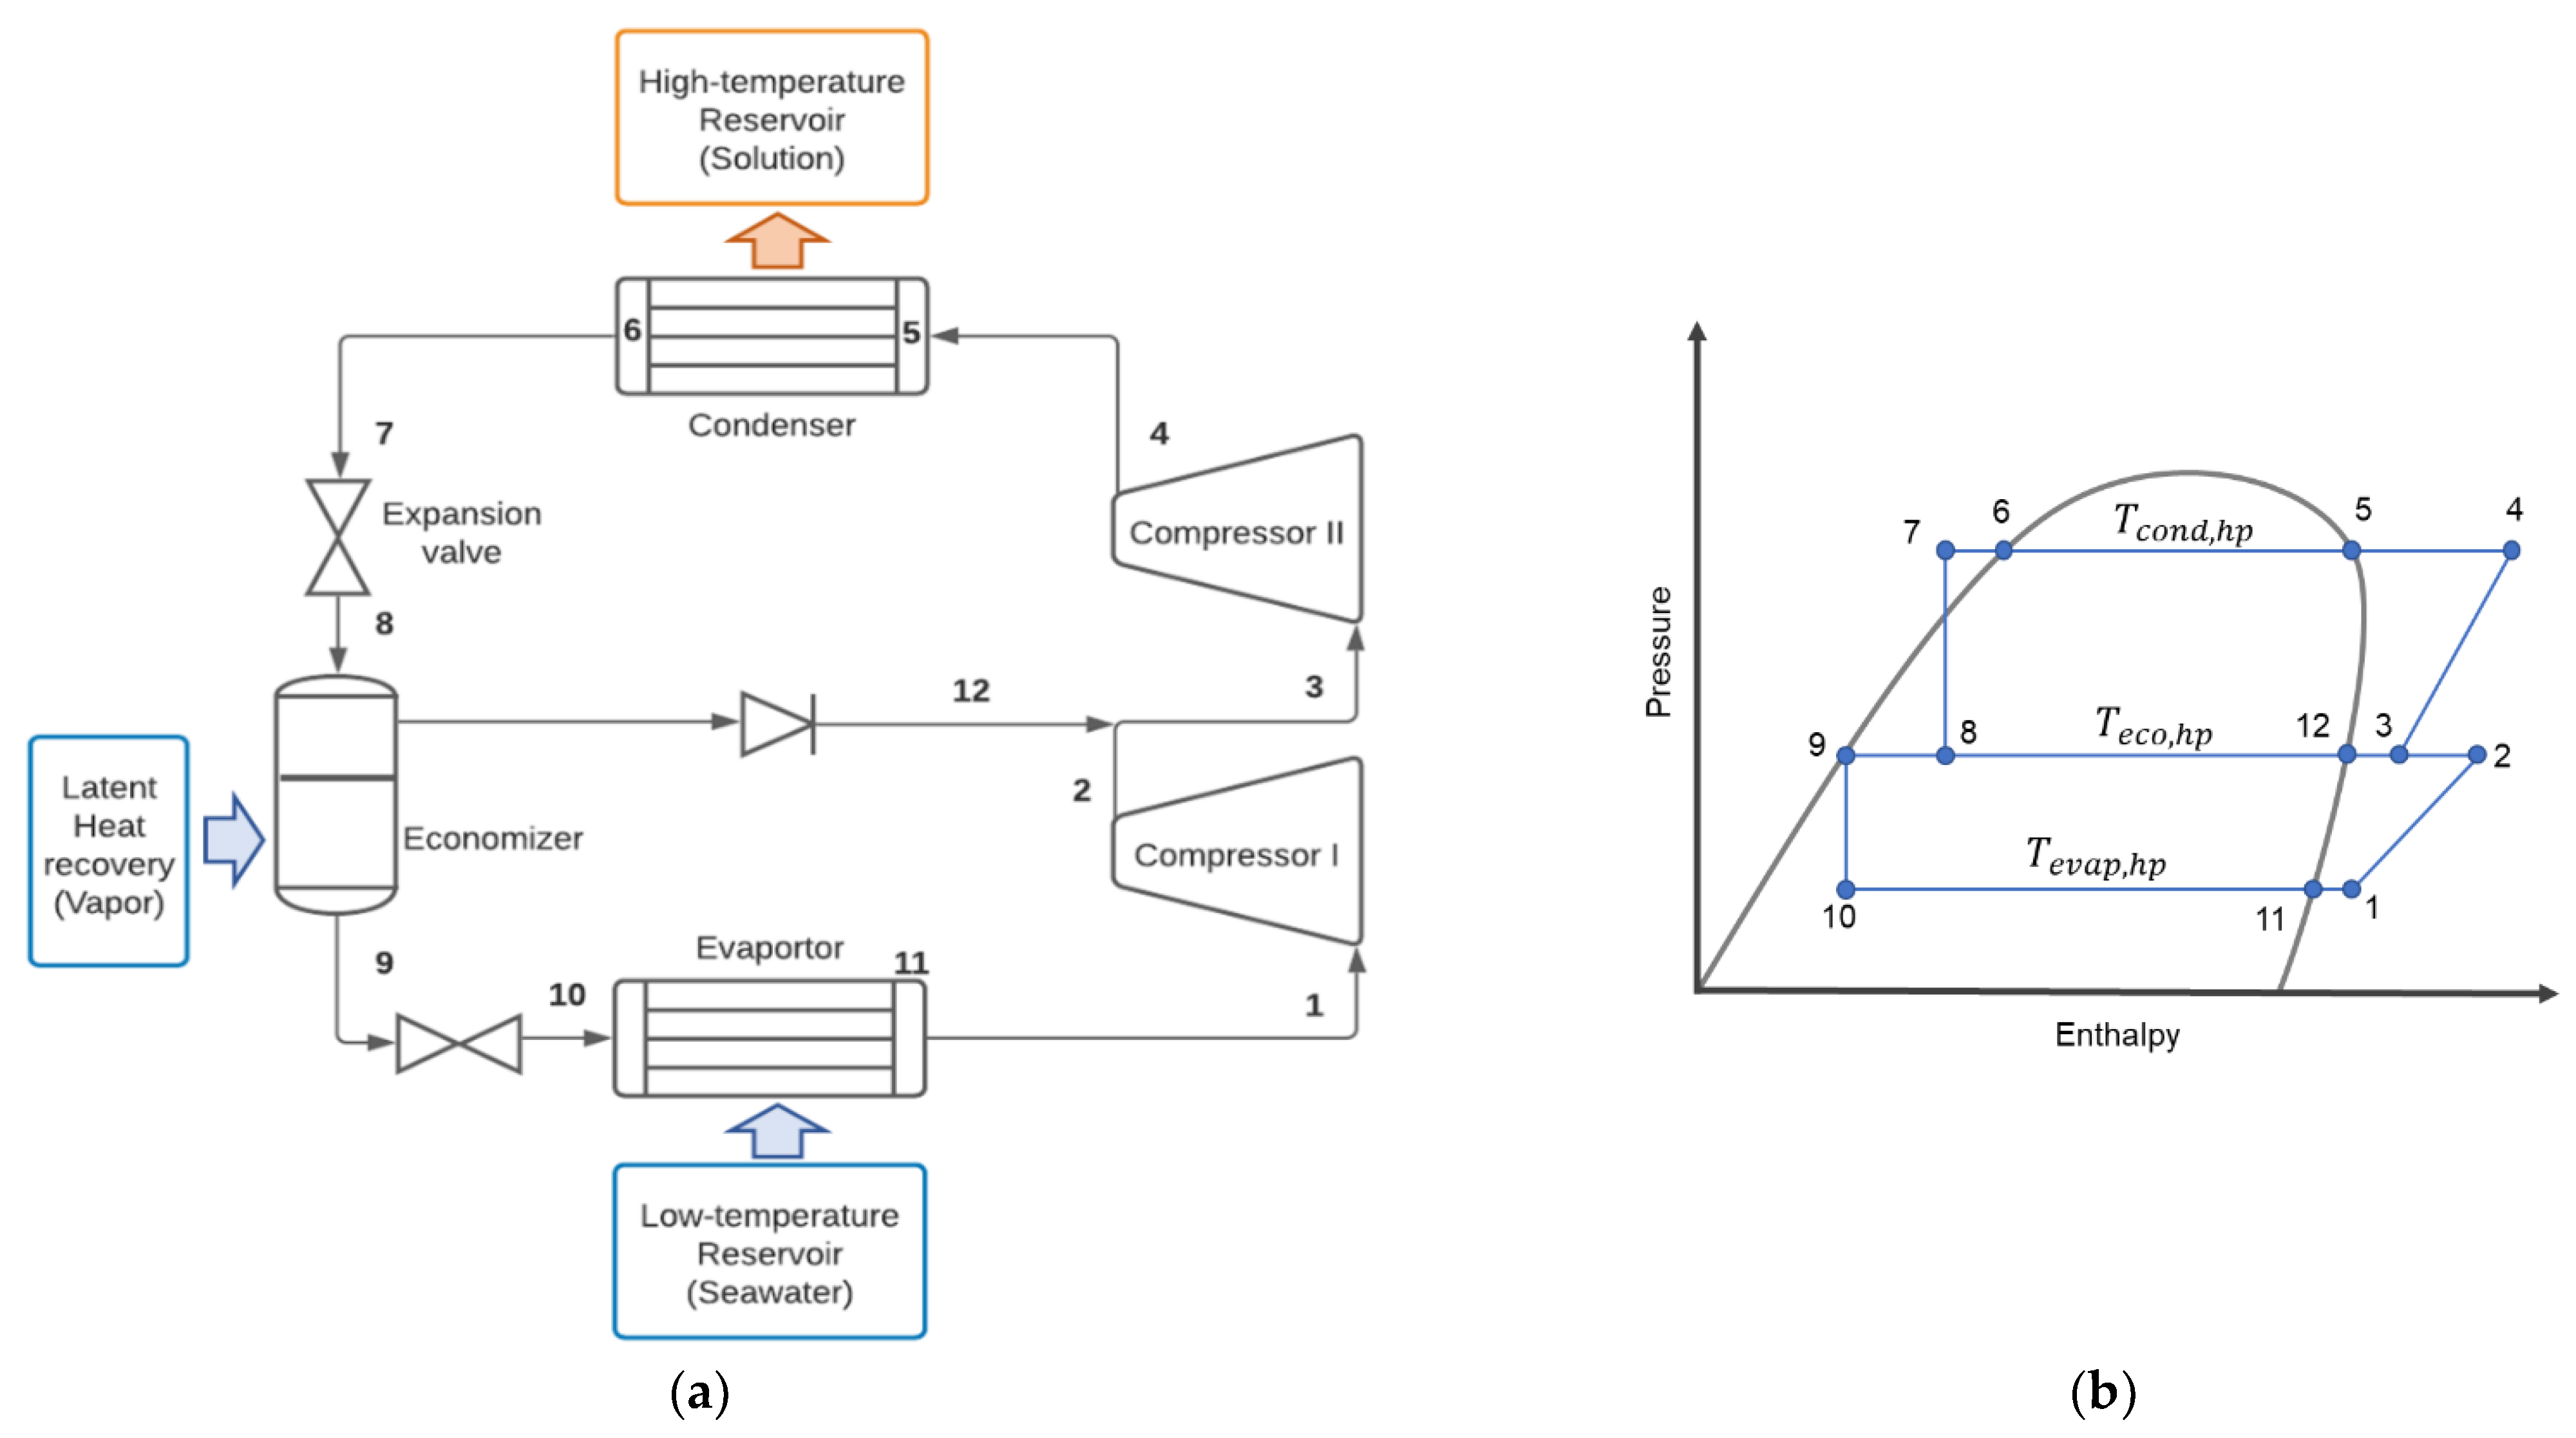
2.4. Heat Pump (HP) System

| Design High Temp. [°C] | Design Middle and Low Temp. (MT, LT) [°C] | Cycle | Refrigerant | COP | Ref. |
|---|---|---|---|---|---|
| 45 | LT: −8 | Single-stage vapor compression | R290 | - | [30] |
| 55 | LT: 23 | Single-stage vapor compression (water-to-water) | R134a | 2.65 | [31] |
| 55 ± 5 | MT: 30 ± 10; LT: 5 ± 5 | Two-stage vapor compression with an open economizer (water-to-water) | R134a | 4.3 | [28] |
| 45 | MT: 7–11; LT: 5 | Single-stage two-heat source vapor compression with ejector cycle | R134a | 6.9 | [28] |
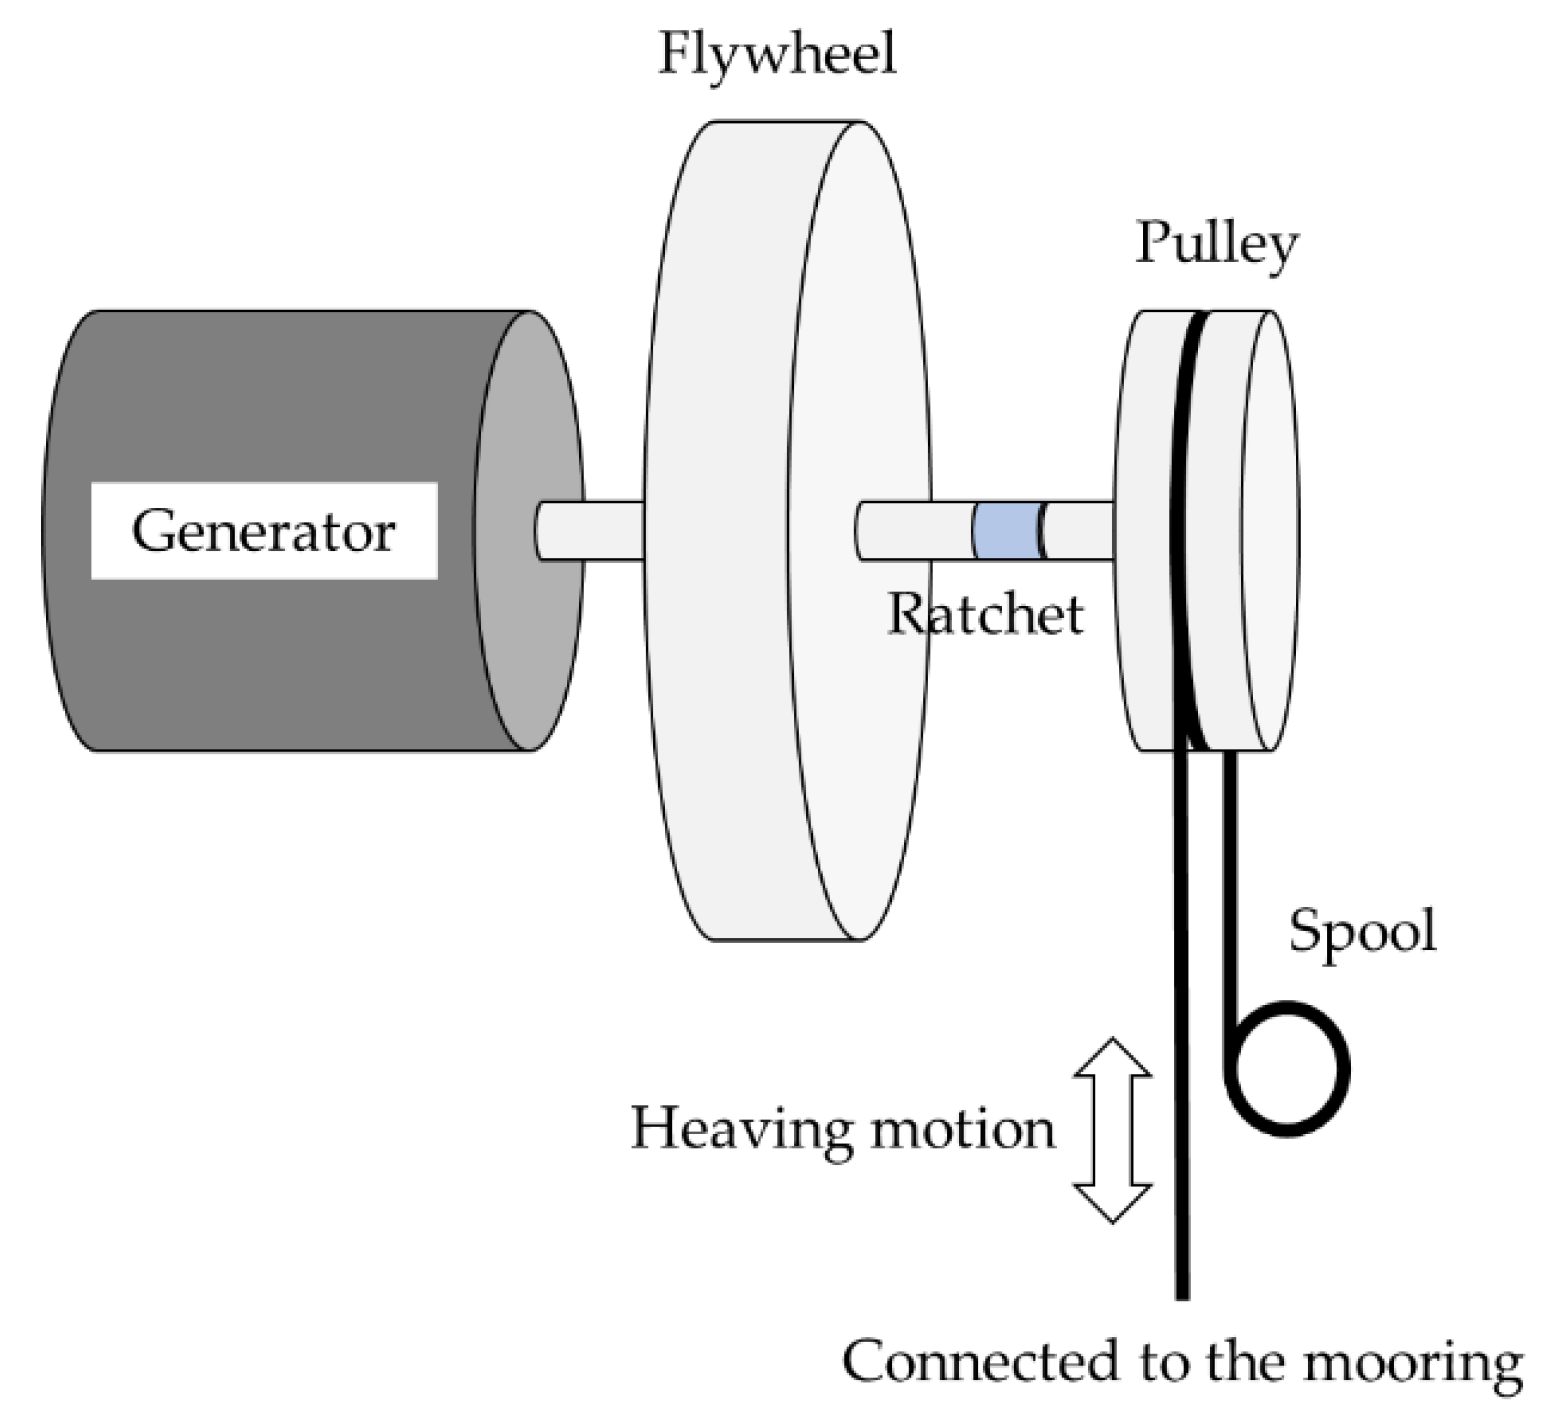
2.5. Wave Energy Converter (WEC)
3. WEC Modeling
3.1. Design Parameter
3.2. Power Output Model
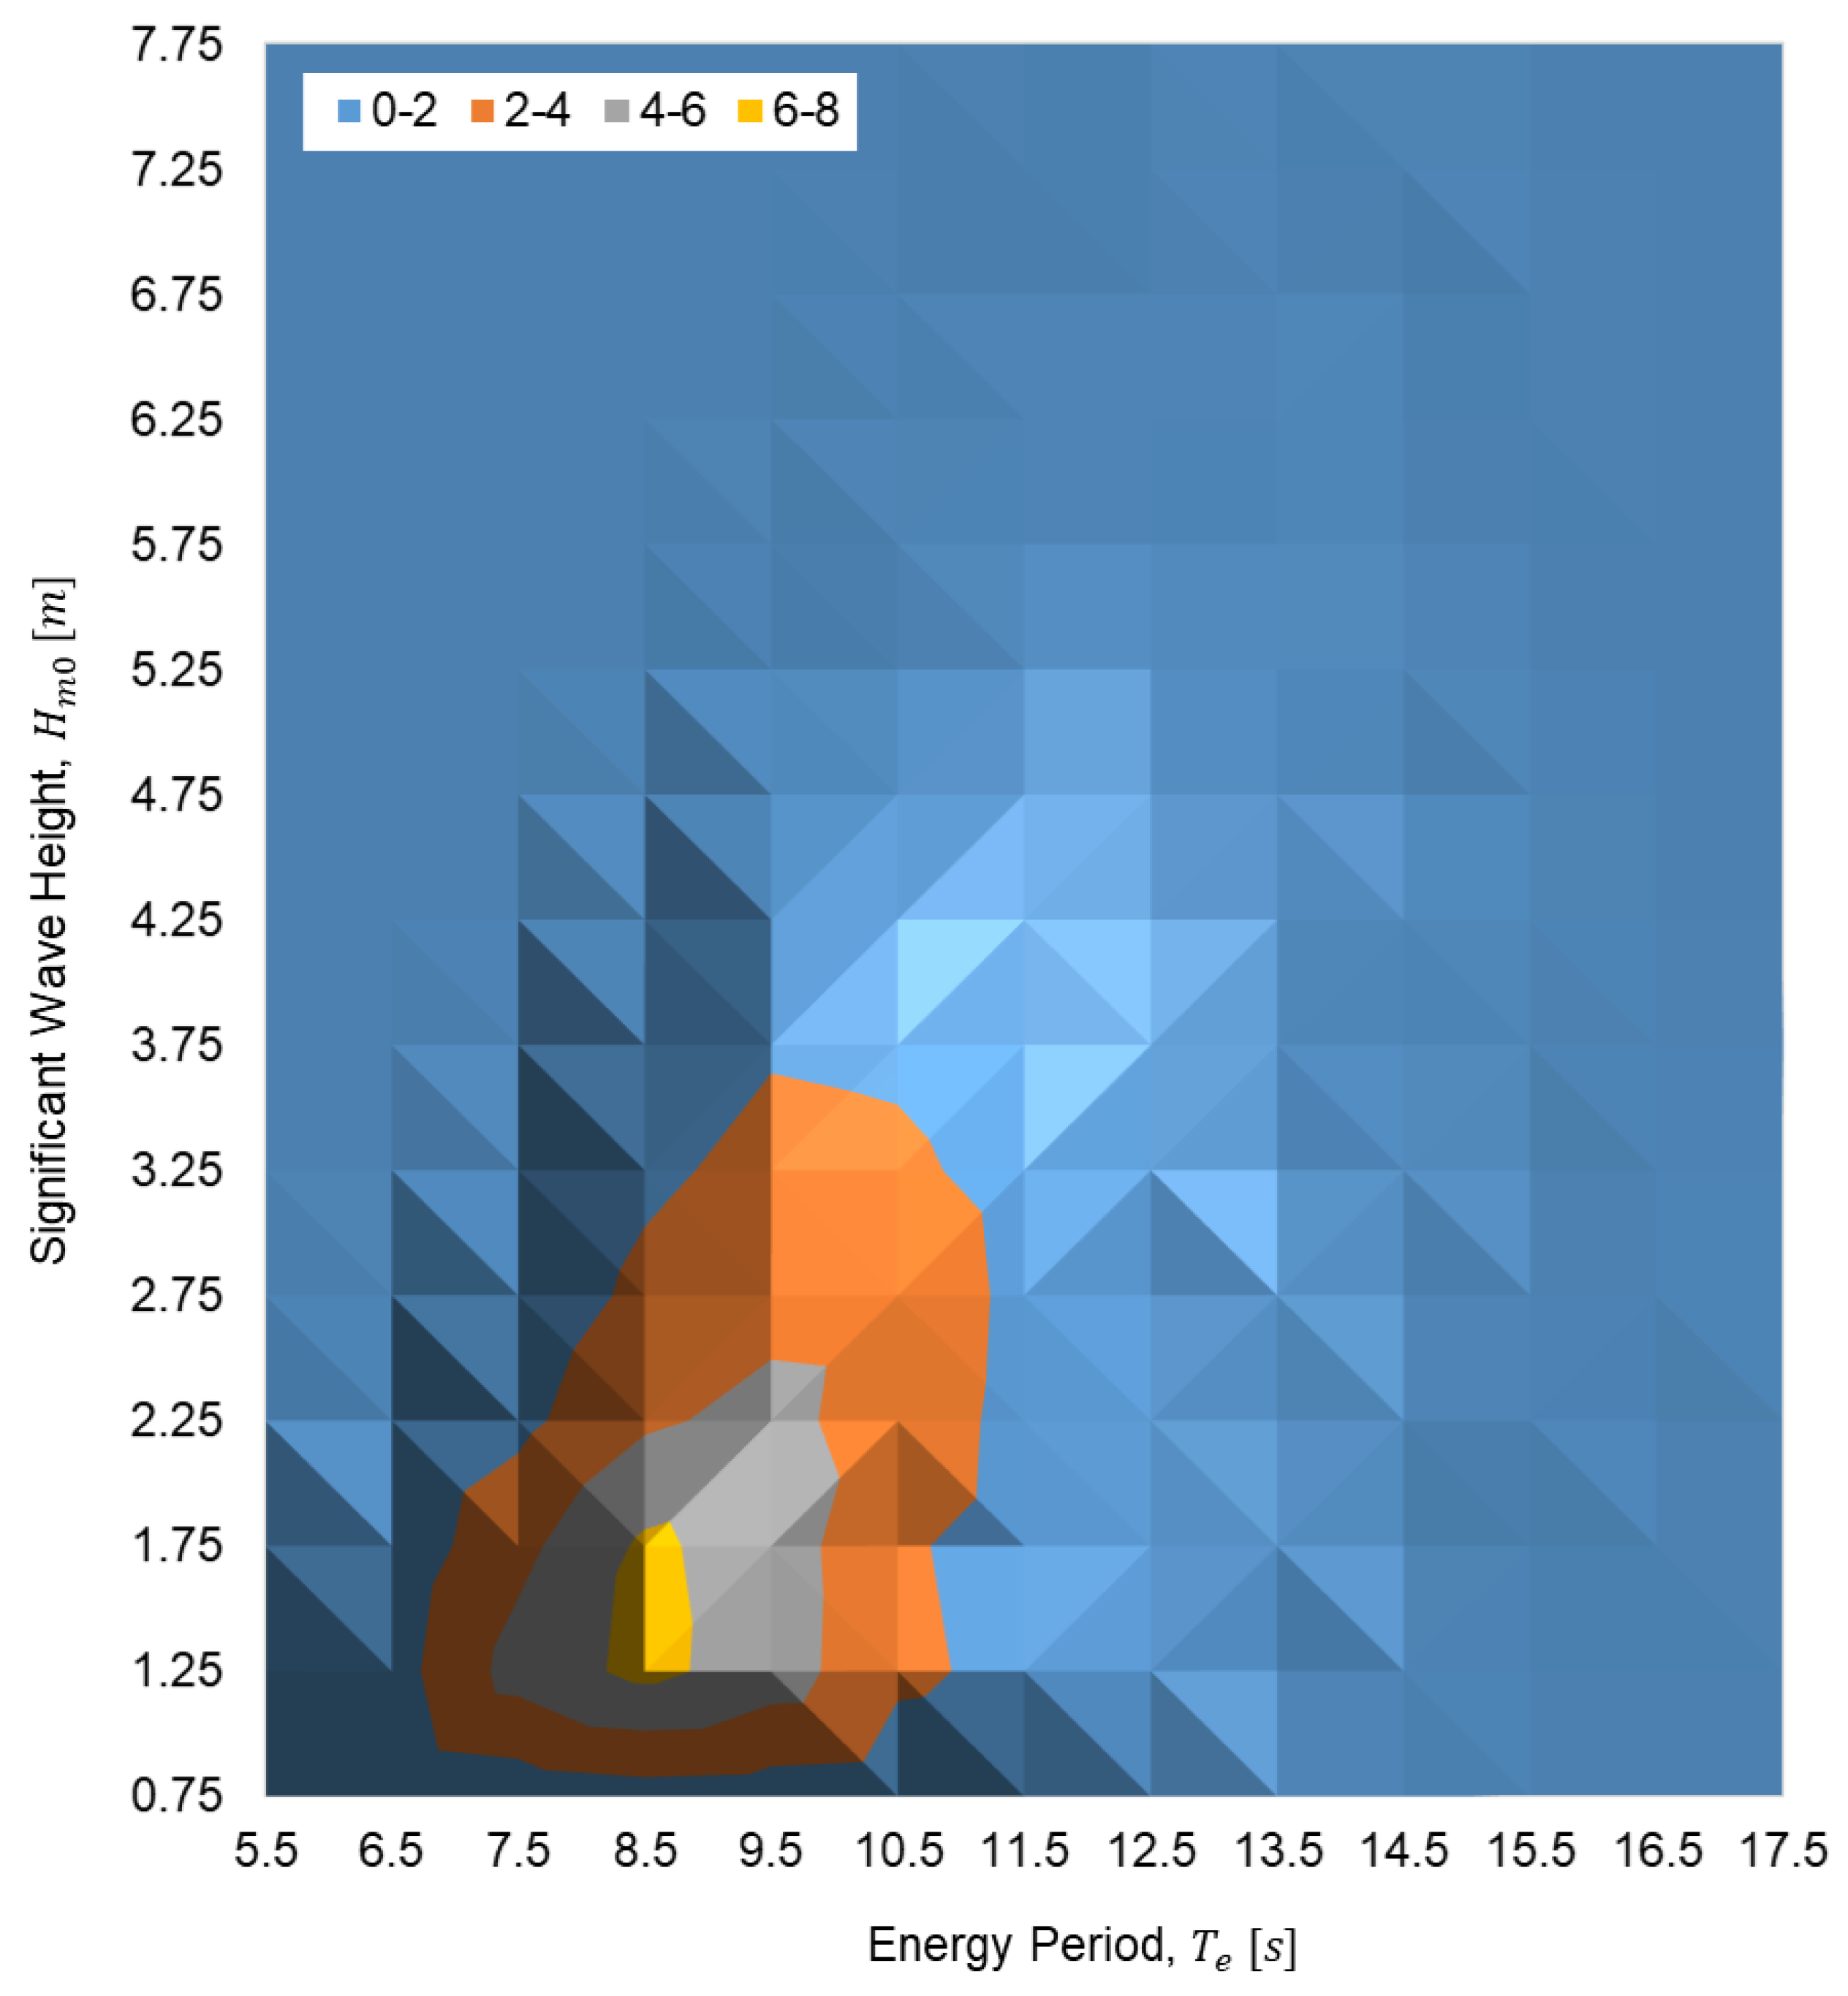
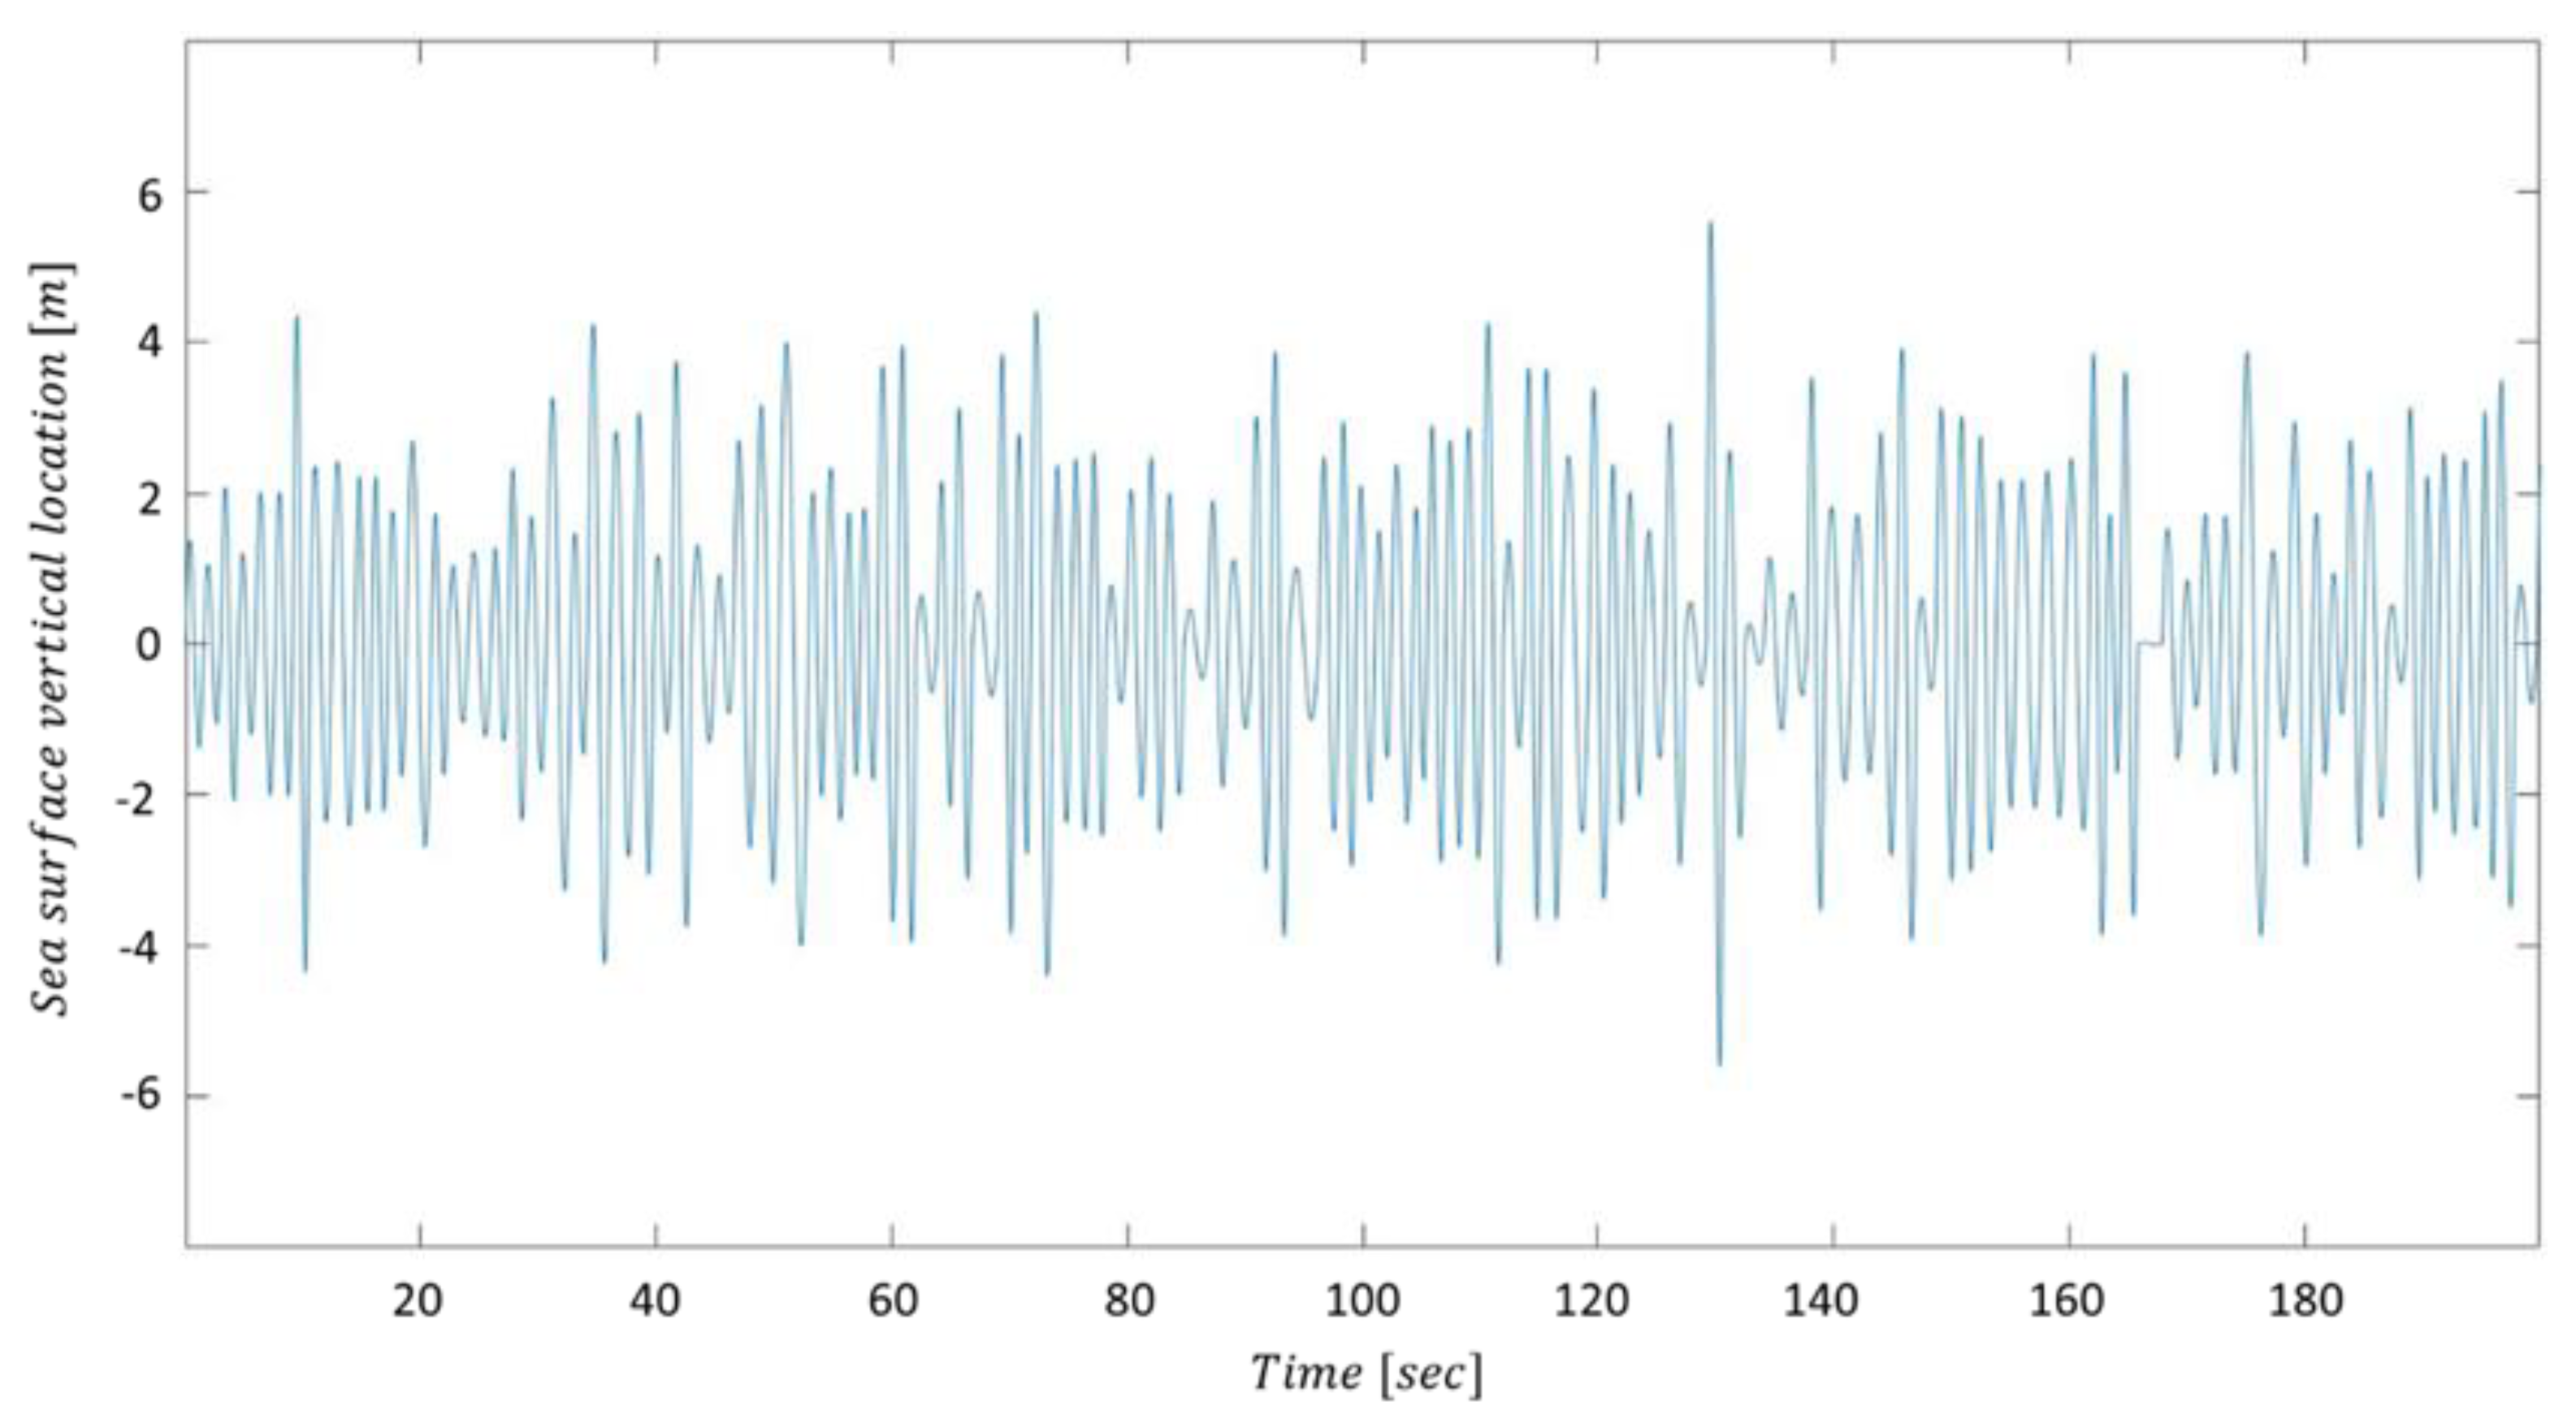
3.3. Random Wave Generation

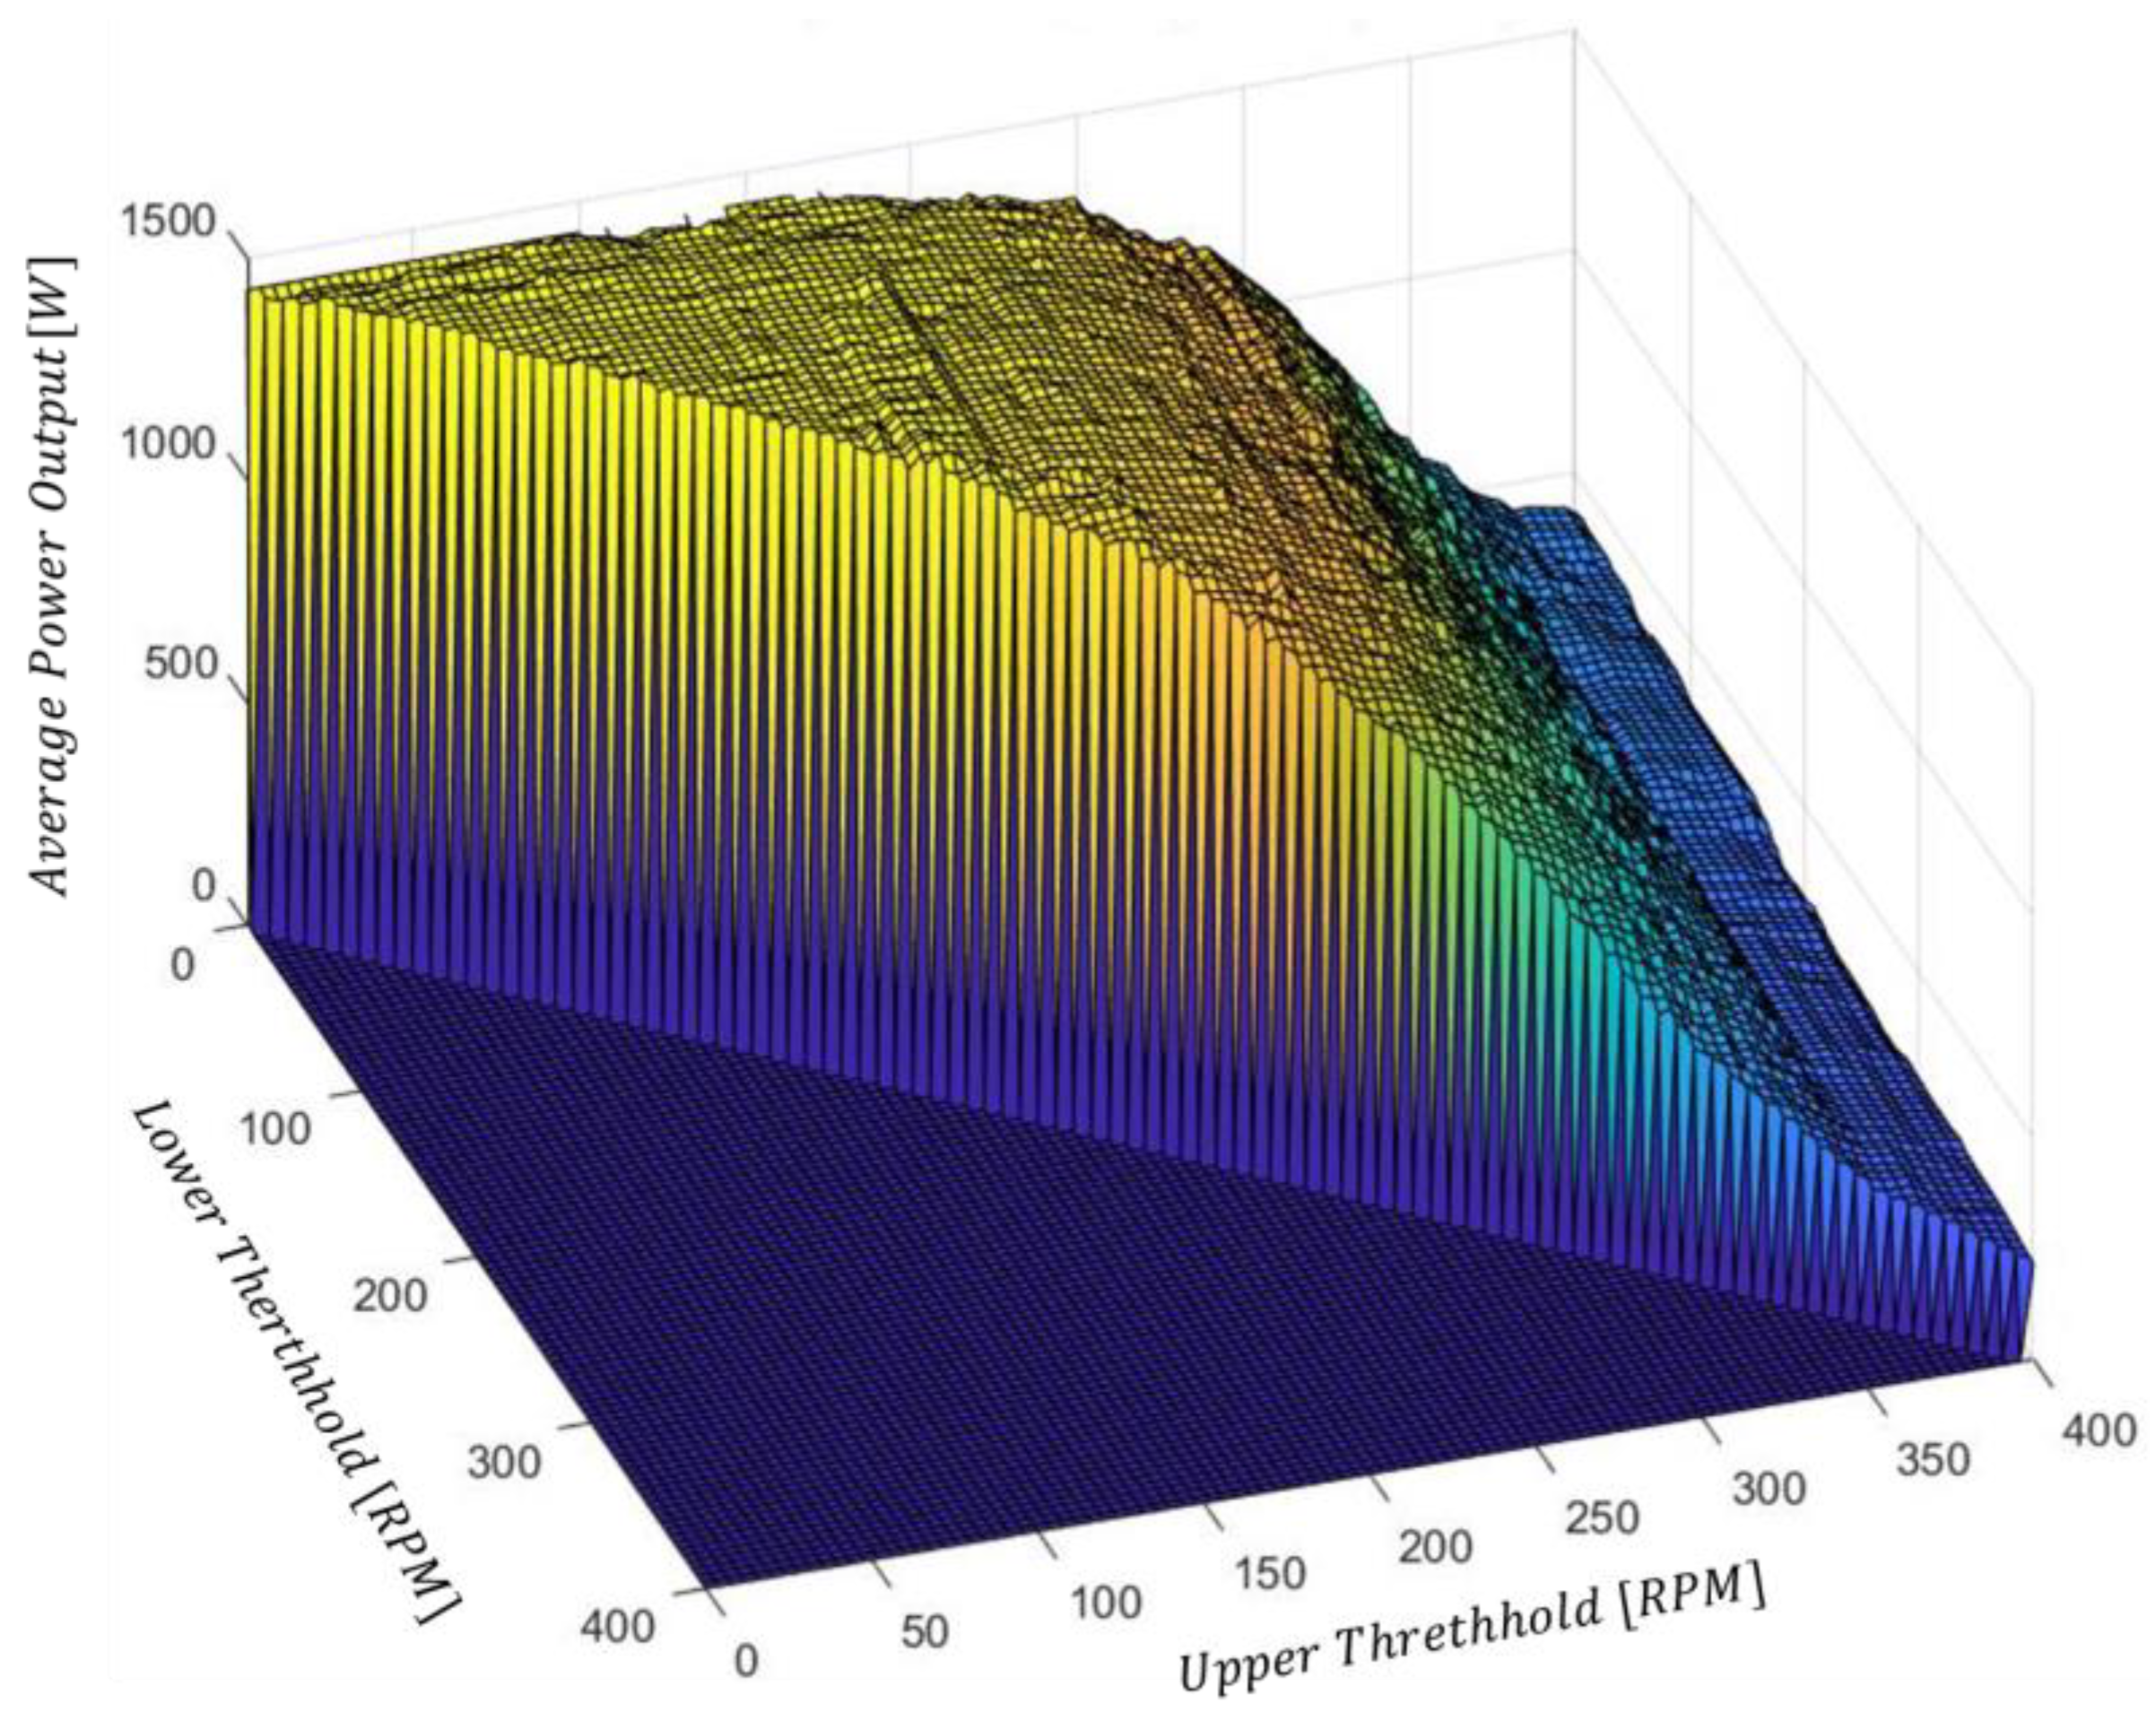
3.4. Power Output Analysis
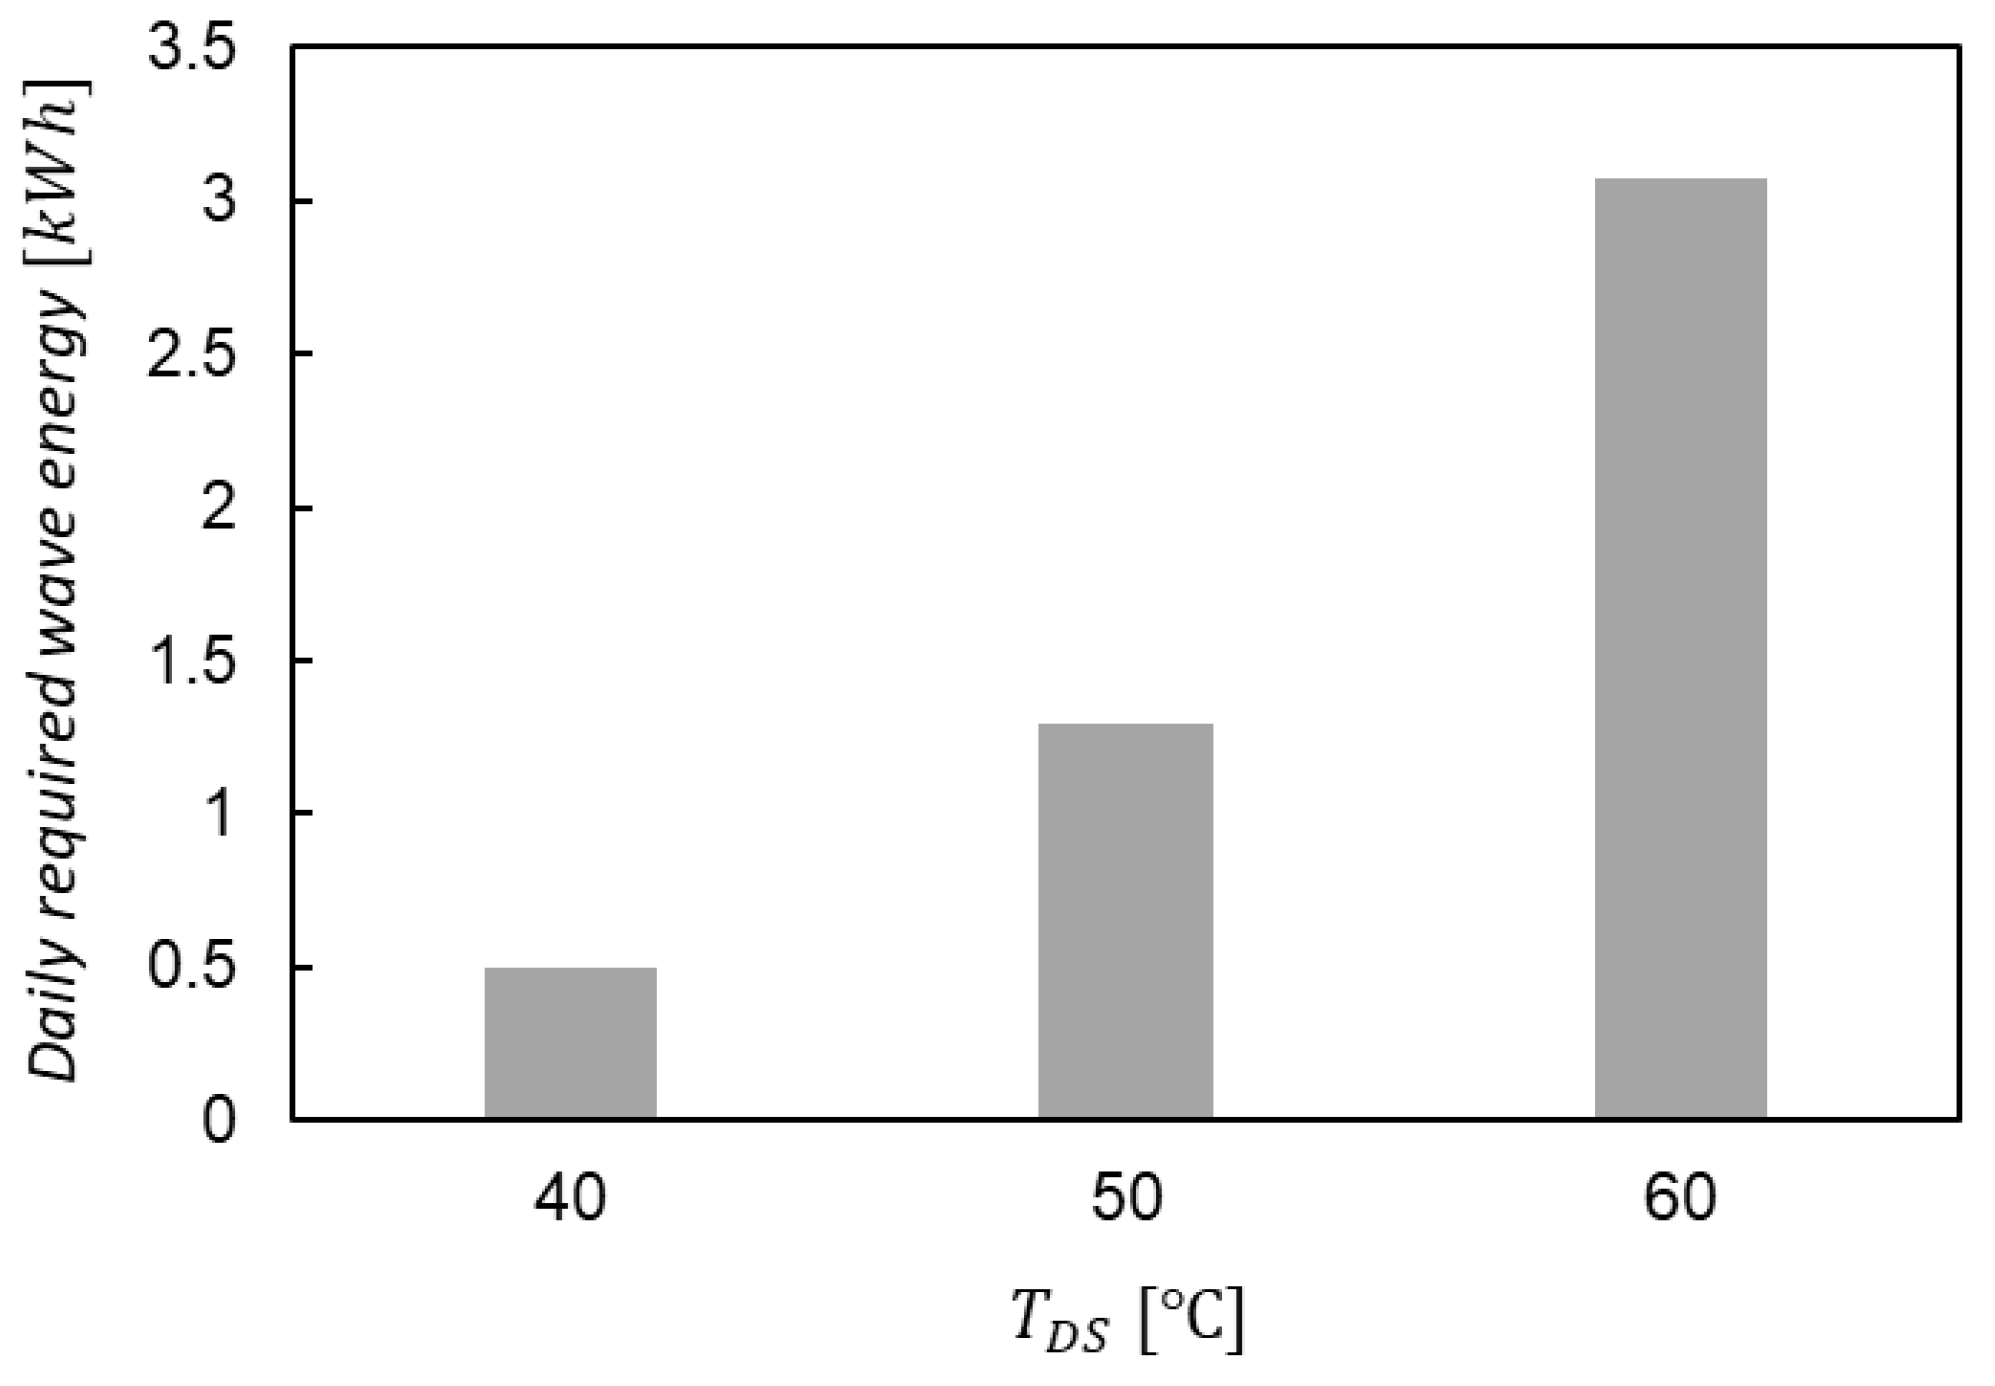
4. Water Production Estimation
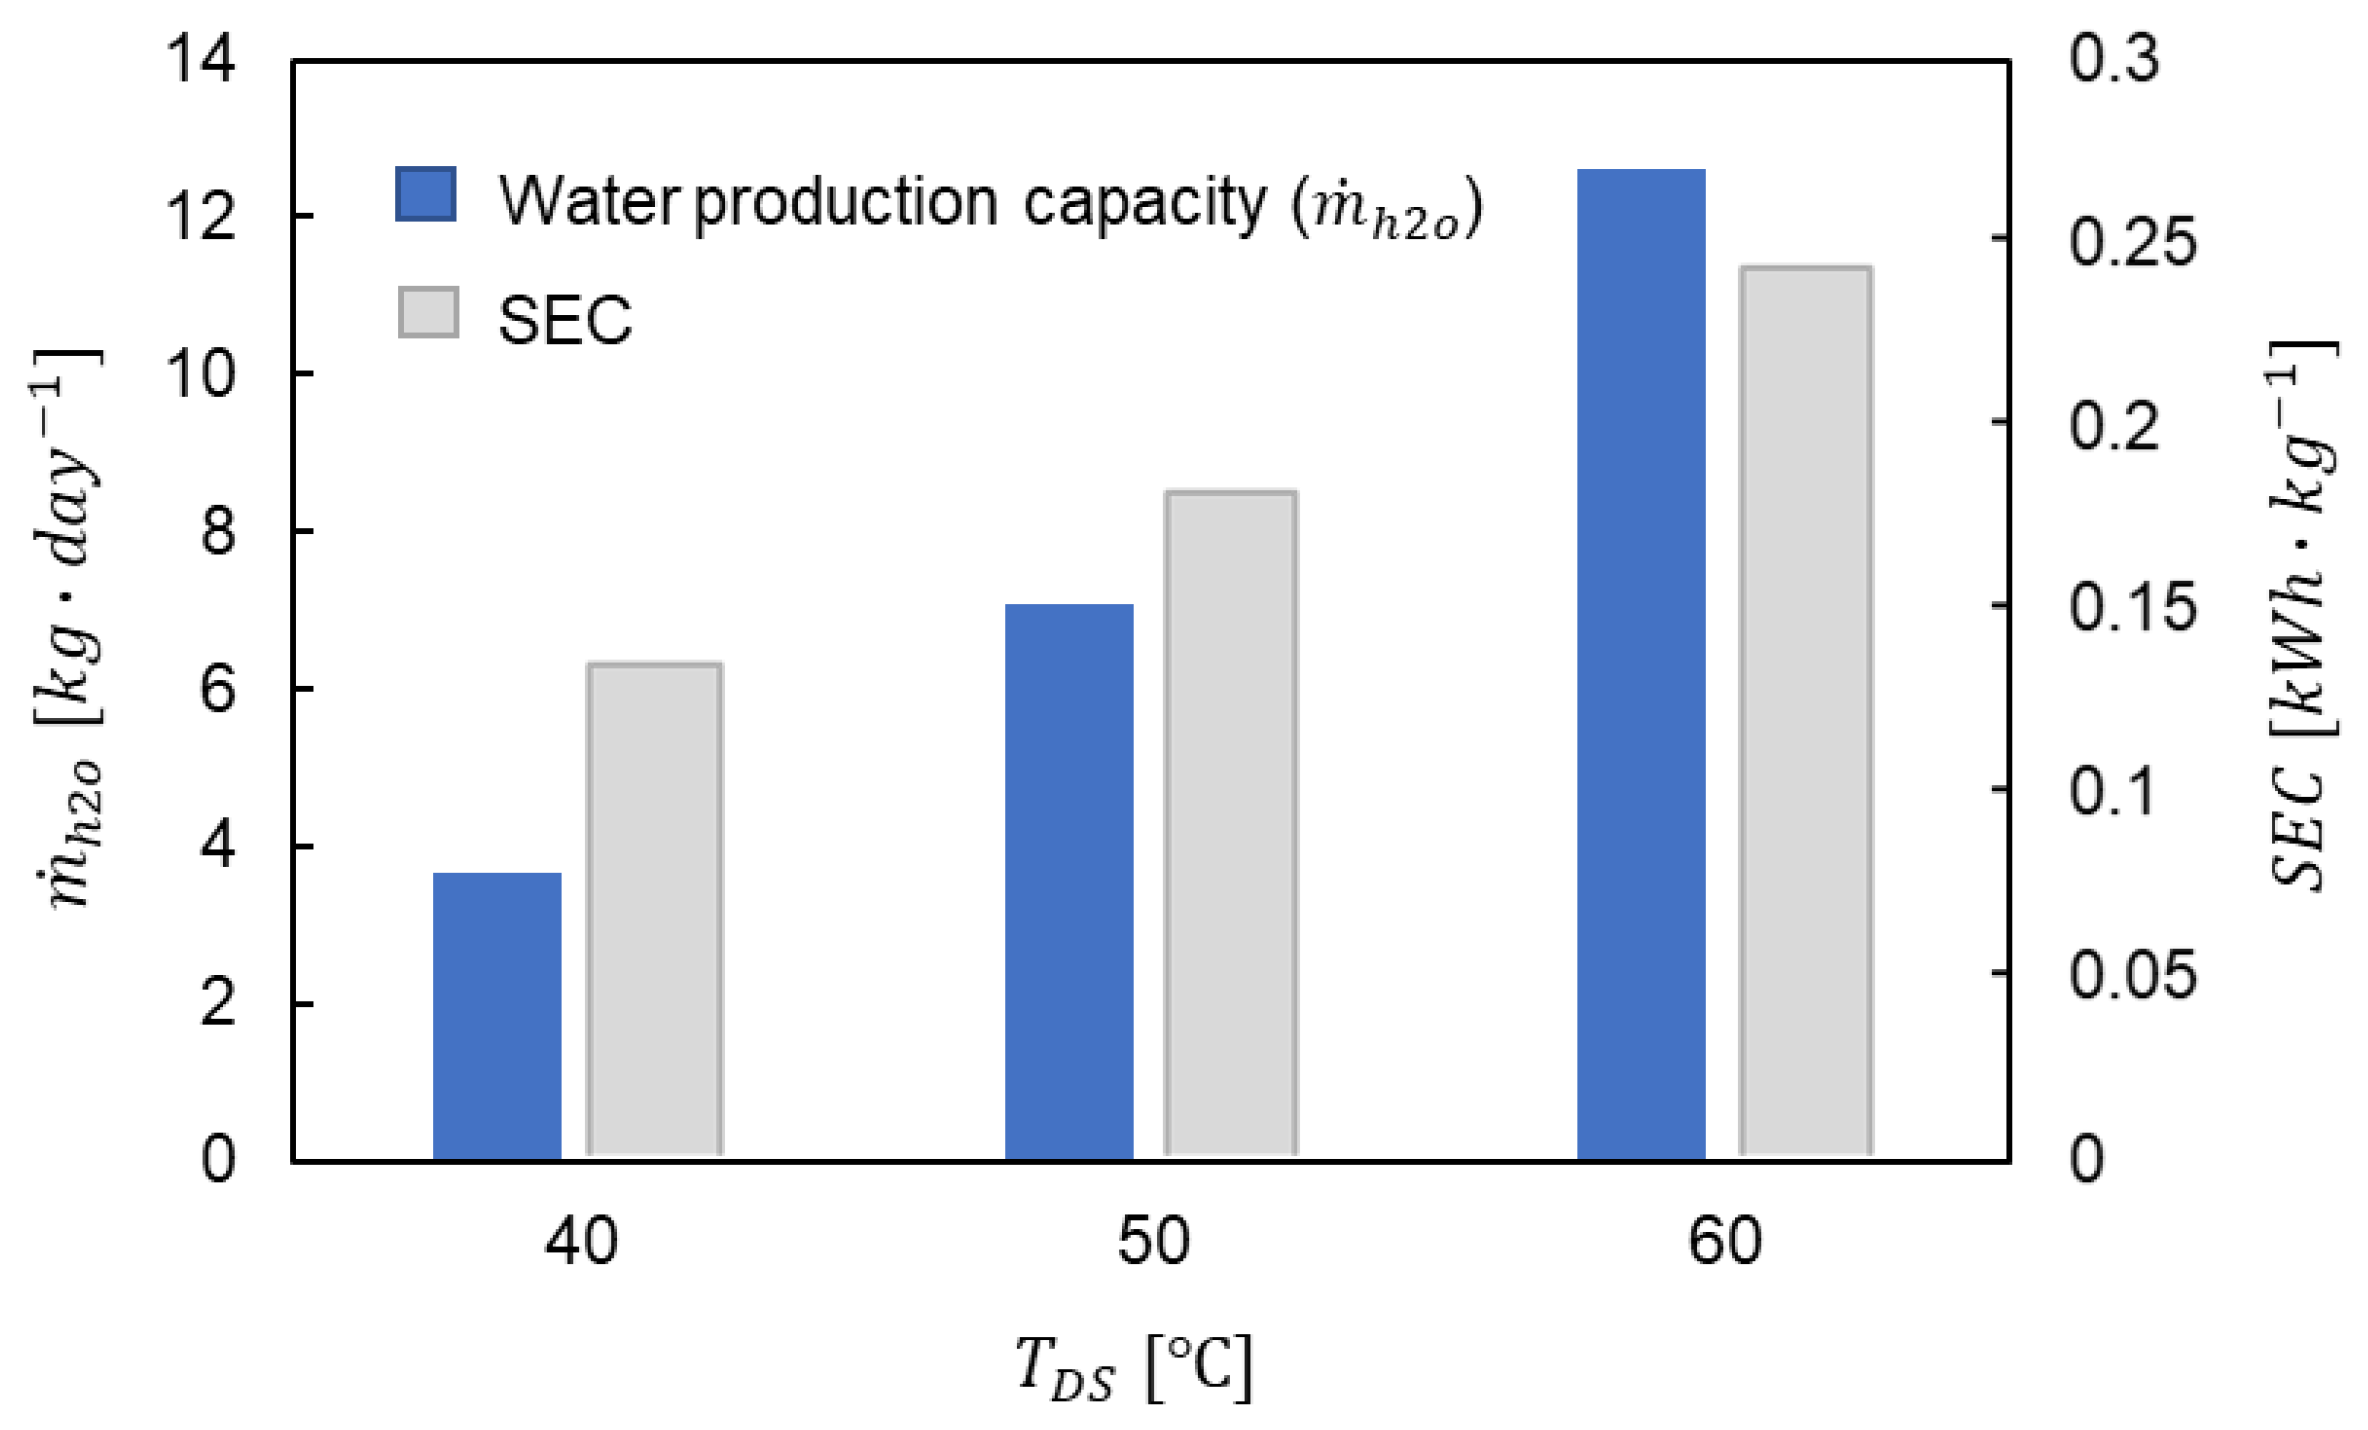
5. Results and Discussion
6. Conclusions
- (1)
- WavoWater can produce freshwater as a desalination system without the discharge of high-concentration solutions.
- (2)
- WavoWater can supply drinking water to the areas that lack grid electricity by using wave power.
- (3)
- WavoWater can be demonstrated as a small-scale modular system. Consequently, it is easy to transport and deploy.
- (4)
- The desalination process of WavoWater is much simpler than any other desalination system by skipping pumping systems and a regular backwash process for filtration units. Thus, its maintenance costs can be low, and it may not require a high level of technical knowledge from a customer.
Author Contributions
Funding
Institutional Review Board Statement
Informed Consent Statement
Data Availability Statement
Conflicts of Interest
References
- Weber, E. Water in the Pacific Islands: Case studies from Fiji and Kiribati. In Water: A Source of Conflict or Cooperation? Science Publishers: Enfield, NH, USA, 2007; pp. 269–309. [Google Scholar]
- Dornan, M. Access to Electricity in Small Island Developing States of the Pacific: Issues and Challenges. Renew. Sustain. Energy Rev. 2014, 31, 726–735. [Google Scholar] [CrossRef]
- Bunker, K.; Doig, S.; Hawley, K.; Morris, J. Renewable Microgrids: Profiles from Islands and Remote Communities Across the Globe; Rocky Mountain Institute: Basalt, CO, USA, 2015. [Google Scholar]
- IRENA. Transforming Small-Island Power Systems: Technical Planning Studies for the Integration of Variable Renewables; International Renewable Energy Agency: Abu Dhabi, United Arab Emirates, 2018. [Google Scholar]
- Veron, S.; Mouchet, M.; Govaerts, R.; Haevermans, T.; Pellens, R. Vulnerability to climate change of islands worldwide and its impact on the tree of life. Sci. Rep. 2019, 9, 14471. [Google Scholar] [CrossRef] [PubMed] [Green Version]
- Ahmadi, E.; McLellan, B.; Mohammadi-Ivatloo, B.; Tezuka, T. The Role of Renewable Energy Resources in Sustainability ofWater Desalination as a Potential Fresh-Water Source: An Updated Review. Sustainability 2020, 12, 5233. [Google Scholar] [CrossRef]
- Hicks, D.; Mitcheson, G.; Pleass, C.; Salevan, J. Delbuoy: Ocean wave-powered seawater reverse osmosis desalination systems. Desalination 1989, 73, 81–94. [Google Scholar] [CrossRef]
- Magagna, D.; Muller, G. A wave energy driven RO stand-alone desalination system: Initial design and testing. Desalination Water Treat. 2009, 7, 47–52. [Google Scholar] [CrossRef]
- Crerar, A.; Low, R.; Pritchard, C. Wave powered desalination. Desalination 1987, 67, 127–137. [Google Scholar] [CrossRef] [Green Version]
- Cruz, J.M.B.P.; Salter, S.H. Numerical and experimental modelling of a modified version of the Edinburgh Duck wave energy device. Proc. Inst. Mech. Eng. Part M J. Eng. Marit. Environ. 2006, 220, 129–147. [Google Scholar] [CrossRef]
- Kimura, S.; Nakao, S.; Shimatani, S. Transport phenomena in membrane distillation. J. Membr. Sci. 1987, 33, 285–298. [Google Scholar] [CrossRef]
- Jönsson, A.-S.; Wimmerstedt, R.; Harrysson, A.-C. Membrane distillation—A theoritical study of evaporation through microporous membranes. Desalination 1985, 56, 237–249. [Google Scholar] [CrossRef]
- Lawson, K.W.; Lloyd, D.R. Membrane distillation. J. Membr. Sci. 1997, 124, 1–25. [Google Scholar] [CrossRef]
- Cai, J.; Guo, F. Study of mass transfer coefficient in membrane desalination. Desalination 2017, 407, 46–51. [Google Scholar] [CrossRef]
- Schwantes, R.; Cipollina, A.; Gross, F.; Koschikowski, J.; Pfeifle, D.; Rolletschek, M.; Subiela, V. Membrane distillation: Solar and waste heat driven demonstration plants for desalination. Desalination 2013, 323, 93–106. [Google Scholar] [CrossRef] [Green Version]
- Kim, G.S.; Cao, T.; Hwang, Y. Thermoeconomic investigation for a multi-stage solar-thermal vacuum membrane distillation system for coastal cities. Desalination 2021, 498, 114797. [Google Scholar] [CrossRef]
- Turchi, C.; Akar, S.; Cath, T.; Vanneste, J.; Geza, M. Use of Low-Temperature Geothermal Energy for Desalination in the Western United States; National Renewable Energy Laboratory: Golden, CO, USA, 2015.
- Francis, L.; Ghaffour, N.; Alsaadi, A.; Amy, G. Material gap membrane distillation: A new design for water vapor flux enhancement. J. Membr. Sci. 2013, 448, 240–247. [Google Scholar] [CrossRef] [Green Version]
- Ho, C.; Chen, L.; Huang, M.; Lai, J.; Chen, Y. Distillate flux enhancement in the air gap membrane distillation with inserting carbon-fiber spacers. Sep. Sci. Technol. 2017, 52, 2817–2828. [Google Scholar] [CrossRef]
- Liu, Z.; Gao, Q.; Lu, X.; Ma, Z.; Zhang, H.; Wu, C. Experimental study of the optimal vacuum pressure in vacuum assistedair gap membrane distillation process. Desalination 2017, 414, 63–72. [Google Scholar] [CrossRef]
- Alsaadi, A.S.; Francis, L.; Maab, H.; Amy, G.L.; Ghaffour, N. Evaluation of air gap membrane distillation process running under sub-atmospheric conditions: Experimental and simulation studies. J. Membr. Sci. 2015, 489, 73–80. [Google Scholar] [CrossRef] [Green Version]
- Ma, X.-H.; Zhou, X.-D.; Lan, Z.; Li, Y.-M.; Zhang, Y. Condensation heat transfer enhancement in the presence of non-condensable gas using the interfacial effect of dropwise condensation. Int. J. Heat Mass Transf. 2008, 51, 1728–1737. [Google Scholar] [CrossRef]
- Abu-Zeid, M.-R.; Zhang, L.; Jin, W.-Y.; Feng, T.; Wu, Y.; Chen, H.-L.; Hou, L. Improving the performance of the air gap membrane distillation process by using a supplementary vacuum pump. Desalination 2016, 384, 31–42. [Google Scholar] [CrossRef]
- Cath, T.; Childress, A.; Elimelech, M. Forward osmosis: Principles, applications, and recent developments. J. Membr. Sci. 2006, 281, 70–87. [Google Scholar] [CrossRef]
- McCutcheon, J.; McGinnis, R.; Elimelech, M. A novel ammonia-carbon dioxide forward (direct) osmosis desalination process. Desalination 2005, 174, 1–11. [Google Scholar] [CrossRef]
- Ryu, H.; Mushtaq, A.; Park, E.; Kim, K.; Chang, Y.; Han, J.-I. Dynamical modeling of wter flux in forward osmosis with multistage operation and sensitivity analysis of model parameters. Water 2020, 12, 31. [Google Scholar] [CrossRef] [Green Version]
- Arpagaus, C.; Bless, F.; Schiffmann, J.; Bertsch, S. Multi-temperature heat pumps: A literature review. Int. J. Refrig. 2016, 69, 437–465. [Google Scholar] [CrossRef] [Green Version]
- Arpagaus, C.; Bertsch, S.; Javed, A.; Schiffmann, J. Two-Stage Heat Pump Using Oil-Free Turbocompressors—System Design and Simulation. In Proceedings of the 16th International Refrigeration and Air Conditioning Conference at Purdue, West Lafayette, IN, USA, 11–14 July 2016. [Google Scholar]
- Bertsch, S.; Uhlmann, M.; Heldstab, A. Heat Pump with Two Heat Sources on Different Temperature Levels. In Proceedings of the 15th International Refrigeration and Air Conditioning Conference at Purdue, West Lafayette, IN, USA, 14–17 July 2014. [Google Scholar]
- Tello, F.; Núñez, V.; Navarro-Peris, E.; Corberán, J. Theoretical study of the heat pump performance for simultaneous production of space heating and domestic hot water. In Proceedings of the 18th International Refrigeration and Air Conditioning Conference at Purdue, West Lafayette, IN, USA, 24–28 May 2021. [Google Scholar]
- Zhao, A.; Zhang, Y.; Mi, H.; Zhou, Y.; Zhang, Y. Experimental Research of a Water-Source Heat Pump Water Heater System. Energies 2018, 11, 1205. [Google Scholar] [CrossRef] [Green Version]
- Lin, K.; Joo, Y.; Helkin, S.; Ham, C. A novel design of wave energy harvest device with flywheel energy storage system. In Proceedings of the 15th World Multi-Conference on Systemics, Cybernetics and Informatics, Orlando, FL, USA, 19–22 July 2011. [Google Scholar]
- Kaplan, R.; Mamrosh, D.; Salih, H.; Dastgheib, S. Assessment of desalination technologies for treatment of a highly saline brine from a potential CO2 storage site. Desalination 2017, 404, 87–101. [Google Scholar] [CrossRef] [Green Version]
- Ketabdari, M.; Ranginkaman, A. Simulation of Random Irregular Sea Waves for Numerical and Physical Models Using Digital Filters. Trans. B Mech. Eng. 2009, 16, 240–247. [Google Scholar]
- Aggarwal, A.; Chella, M.; Kamath, A.; Bihs, H.; Arntsen, Ø. Irregular Wave Forces on a Large Vertical Circular Cylinder. Energy Procedia 2016, 94, 504–516. [Google Scholar] [CrossRef] [Green Version]
- Dallman, A.; Neary, V. Characterization of U.S. Wave Energy Converter (WEC) Test Sites: A Catalogue of Met-Ocean Data, 2nd ed.; Sandia National Laboratories: Albuquerque, NM, USA, 2015.
- Helkin, S. Design and Optimization of a Wave Energy Harvester Utilizing a Flywheel Energy Storage System. Master’s Thesis, University of Central Florida, Orlando, FL, USA, 2011. [Google Scholar]
- Moran, M.; Shapiro, H. Fundamentals of Engineering Thermodynamics: SI Version, 5th ed.; John Wiley & Sons Ltd: Hoboken, NJ, USA, 2006. [Google Scholar]
- He, K.; Hwang, H.; Moon, I. Air gap membrane distillation on the different types of membrane. Korean J. Chem. Eng. 2011, 28, 770–777. [Google Scholar] [CrossRef]


| Parameter | Value | Description |
|---|---|---|
| Refrigerant (REF$) | R134a | Heat pump refrigerant |
| [°C] | Seawater temperature | |
| Superheating temperature of the evaporator | ||
| Superheating temperature of the condenser | ||
| Condenser temperature | ||
| Subcooling temperature of the condenser | ||
| [°C] | Setting inlet temperature of the evaporator | |
| [°C] | Draw solution temperature | |
| [°C] | Economizer surface temperature | |
| 0.95 [-] | Compressor motor efficiency | |
| 0.9 [-] | Isentropic efficiency of compressor | |
| 0.8 [-] | System efficiency including energy losses | |
| 10 [kPa] | Pressure drop at the evaporator | |
| 50 [kPa] | Pressure drop at the condenser | |
| 1.4 [kW] | Electric power input from the PTO |
| Symbol | Value | Symbol | Value |
|---|---|---|---|
| P1 | 101 [kPa] | ρsw | 1024.9 [kg∙m−3] |
| P2 | 60 [kPa] | ρ1 | 1500 [kg∙m−3] |
| 0.7 [-] | ρ2 | 200 [kg∙m−3] | |
| r | 0.3 [m] | m1 | 590.85 [kg] |
| R | 0.5 [m] | m2 | 194.13 [kg] |
| G | 9.81 [m∙s−2] | H1 | 1.39 [m] |
| H | 0.98 [m] | H2 | 1.74 [m] |
| Symbol | Value | Description | Data Source |
|---|---|---|---|
| Mean wave amplitude | [36] | ||
| Standard deviation of amplitude | |||
| Mean wave frequency | |||
| Standard deviation of frequency |
Publisher’s Note: MDPI stays neutral with regard to jurisdictional claims in published maps and institutional affiliations. |
© 2022 by the authors. Licensee MDPI, Basel, Switzerland. This article is an open access article distributed under the terms and conditions of the Creative Commons Attribution (CC BY) license (https://creativecommons.org/licenses/by/4.0/).
Share and Cite
Kim, G.S.; Hwang, Y. Wave-Powered and Zero-Discharging Membrane-Distillation Desalination System: Conceptual Design and Analysis. Water 2022, 14, 1897. https://doi.org/10.3390/w14121897
Kim GS, Hwang Y. Wave-Powered and Zero-Discharging Membrane-Distillation Desalination System: Conceptual Design and Analysis. Water. 2022; 14(12):1897. https://doi.org/10.3390/w14121897
Chicago/Turabian StyleKim, Gyeong Sung, and Yunho Hwang. 2022. "Wave-Powered and Zero-Discharging Membrane-Distillation Desalination System: Conceptual Design and Analysis" Water 14, no. 12: 1897. https://doi.org/10.3390/w14121897
APA StyleKim, G. S., & Hwang, Y. (2022). Wave-Powered and Zero-Discharging Membrane-Distillation Desalination System: Conceptual Design and Analysis. Water, 14(12), 1897. https://doi.org/10.3390/w14121897