Abstract
Despite advances in water resources management and planning, the São Francisco River Basin in Brazil has suffered from systematic drought problems in recent years, leading to severe human and environmental water security threats. This paper aims to track the water security for different periods and its relations with the changes in physical and natural asset conditions. The paper explores how investment planning to mitigate the water security threats and explore opportunities to increase the value of investments. The paper finds that grey infrastructure has regulated threats from increasing in the downstream of the river basin, however, continuous increase in water security threats in the upstream of the basin threatens water security downstream. This is evident from the spatial connectivity and unidirection externalities. As the capacity to further increase in grey investment is reaching its limit in the downstream, the increases in green infrastructure investment upstream, especially in the Grande River basin, could be one the way to reduce the externalities and minimise the water security risks.
1. Introduction
The water security issue is intertwined with the economic development of Brazil. Despite that Brazil encompasses 12% of total continental surface water of the world [1], the resources’ unequal spatial and temporal distribution contributes to water insecurity along with occurrences of frequent droughts and floods. Extreme events, for instance, account for 84% of the natural disasters during the period 1991 and 2012 and affected about 127 million people [1]. The economic impacts of these events accounted for USD 55 billion in terms of economic losses. The Brazilian Water Security Plan [2] is planning a massive investment of 5 billion USD until 2035 to mitigate such threats to water security. Such investment mainly includes building hard infrastructure, particularly water storage reservoirs and dams.
Water security can be achieved when the water availability in sufficient quantity and quality supports the human needs, the economic activities, and the conservation of the aquatic ecosystem, with a tolerable level of risk related to droughts and floods [2,3,4]. Dadson et al. [3] demonstrate that water security-related investments can contribute to different economic growth pathways, depending on the state of water security and economic development. According to the study, the initial investment in water-related assets allows growth in regions where initial water security is low. On the other hand, losses due to water-related hazards impede economic growth and may establish a poverty trap without such investment [3]. Currently, public and private investments in developing countries, such as Brazil, are insufficient to meet the demand for water [5].
In 2019, the National Water and Sanitation Agency from Brazil-ANA established a water security index to guide the investments of the Brazilian Water Security National Plan and prioritise the investment pathway. The study used a set of indicators grouped in 4 dimensions of the United Nations (Human; Economic; Resilience, and Ecosystem) to calculate the Water Security Index for all the Brazilian micro basins [2].
However, water security assessment is complex and involves multiple stressors, such as watershed disturbance, water pollution, water demand, and water resources development, in combination with the current state of natural assets (green infrastructure within the watersheds, as the total forested area, wetlands, and riparian buffers, for example) and physical assets (traditional grey infrastructure, as artificial reservoirs, and/or sewage treatment plants, for example) conditions. In addition, climate change, unplanned land-use changes, and volatile economic and social conditions add further layers of complexity and uncertainty in the river basin management.
A new, “blended engineering” combining traditional grey with green approaches is recommended as a cost-effective pathway to human water security by Brazil. ANA [2], for instance, recommends the adoption of green infrastructure complementary to structuring actions in Brazilian Metropolitan Regions. This approach can stimulate innovation in water provision systems that rely on the coupled use of traditional engineering and environmental services. It represents a critical opportunity space within the overall sustainable development agenda.
The Brazilian Water Resources Plan 2021 now has a clear agenda on green and grey infrastructure planning. Green infrastructure includes nature-based solutions which aim to protect, enhance, or restore components of a natural system to support producing higher-quality, more resilient, and lower-cost infrastructure services [6,7]. According to TNC [8], green infrastructure is a concept under development that includes investment measures to protect, restore, and maintain natural landscapes such as reforestation, forest conservation, and other measures that contribute to protecting and restoring ecosystem functions. Studies developed by Lyu et al. [9,10] asserted that the adverse impacts of urbanisation and climate change on hydrology and water quality can be mitigated by applying green infrastructure practices.
Targeted investments guided by integrated water security assessment has the potential to reduce water security threats through change in asset conditions. However, a lack of understanding of the interactions between the natural and physical assets and drivers coupled with the complexity of climate change leads to unintended consequences and sub-optimal outcomes. The delay or inappropriate design of investment often increases the future cost of addressing the water security given the increasing marginal abatement cost. Haasnoot et al. [11], for instance, showed that the investments might not always be effective as environmental, climatic, and socioeconomic conditions change over time, resulting in “stranded” or unused assets which do not perform as intended, costly retrofitting of infrastructure, or higher costs for implementation of alternatives.
As a case study, the paper focuses on the São Francisco River Basin (SFRB) and provides a detailed analysis of the basin’s changes in water security threat conditions. The São Francisco is the third largest river in Brazil, with a basin that encompasses 8% of the national territory. The river has historical importance for the country and plays an important role in the occupation and development of the Northeast Region, especially in the use of its waters for irrigation and generation of energy [2].
São Francisco River flows through the states of Alagoas, Bahia, Goiás, Minas Gerais, Pernambuco, Sergipe and the Federal District. According to the Water Plan [12] the river has around 2860 km of extension and the total drainage area covers a total of 639,219 km2 (Figure 1).
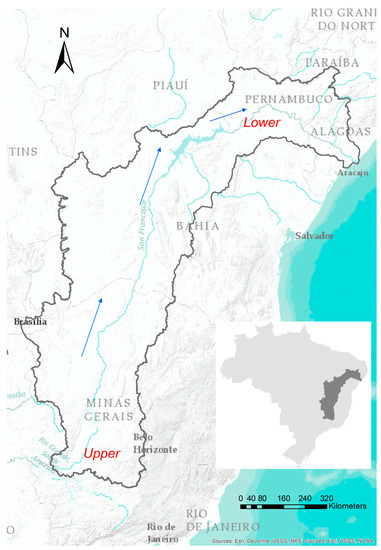
Figure 1.
São Francisco Hydrographic Region, states and water flow.
The land use and land cover (LULC) in the region has been changed significantly over the years based on the Mapbiomas database. MapBiomas is an open-source raster database which presents the evolution of the land use and land cover in Brazil, from 1985 until now. Mapbiomas classification comprises 33 classes, grouped in the following themes: native vegetation, non-forest natural formation, farming, non-vegetated area, and water. LULC data used in this article is obtained from “Project MapBiomas-Collection 5 of the Annual Series of Land Coverage and Use Maps of Brazil”, through the link: https://mapbiomas.org/ (accessed on 10 June 2021). In the beginning of the time series, forest and non-forest natural formation accounted for almost 67% of the total area of the basin, and this value reduced to 58% in 2019. On the other hand, pasture, agriculture, and urbanisation have increased in the last decades. Agriculture activities have increased substantially in the west of Bahia state, Preto river basin, and other irrigation public centres. The urbanisation is more significant in the Belo Horizonte Metropolitan Region, which is the third most populous metropolitan region in Brazil.
ANA [13] reveals that the São Francisco basin has been going through a process of change, be it climatic or in the water use pattern, and these changes are already impacting water availability in the basin. ANA [13] also showed increasing rate of change in the river basin precipitation and natural flows pattern since 1993. These modifications impact the water security conditions in the catchment area.
The integration of natural assets into mainstream infrastructure systems can lower cost and increase the resilience of the services. Solutions that are cost-effective to enhance infrastructure service provisions demonstrate resilience in a changing climate and contribute to the achievement of environmental goal [6]. Natural based solutions, combined with traditional grey infrastructure, can contribute to a sound water security investment in a river basin. The study developed by Feltran-Barbieri et al. [14] demonstrates, for example, the economic benefits to implementing green infrastructure in order to decrease the financial resources spent with water treatment in Brazil. The analysis concludes that restoring more forests in the Guandu river basin could save up to USD 79 million in water treatment costs. Preserving natural capital for threat suppression represents a potential cost avoided in traditional grey infrastructure [15].
The objective of this article is to analyse the change in the water security for different periods (1988 and 2019) in São Francisco basin and its relations with the changes in physical and natural asset conditions. The paper explores how targeted investment planning could mitigate the targeted water security threats. The scientific goal is to evaluate the long-term water security threats changes during the last decades, understanding the impacts of these changes in the water resources.
The paper followed a methodology for an integrated water security assessment and evaluates the change in the water security condition in the São Francisco River and detects key drivers that influence water security in the basin. The methodology t involves assembling and harmonising different spatial databases, including biophysical, socioeconomic data, to quantify various stressors while accounting for the externality effects. A principal component analysis (PCA) has been implemented to identify the most representative drivers in the water security framework. In addition, a hotspot analysis was applied to demonstrate areas with the most significative changes in the water security threats from 1988 to 2019.
2. Materials and Methods
The spatial distribution of the land use and the changes have direct impact on the water demand in the river basin. In the São Francisco River basin, irrigation is the major component of water demand and accounting for 67% of the total demand. Figure 2 demonstrates the spatial distribution of higher demand for irrigation and other uses (data obtained from the Handbook of Consumptive Water Use in Brazil [16]). It demonstrates major demand for irrigation water is generated from the west of the Bahia state.
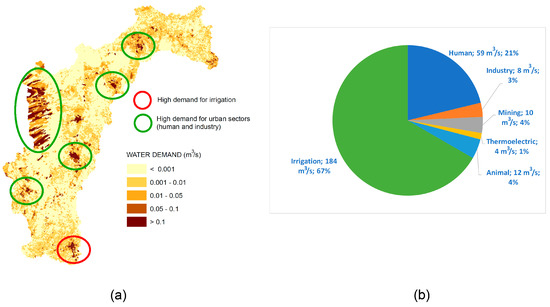
Figure 2.
Water demand spatial distribution in São Francisco River basin in 2018 (a); and sectorial water demand (b).
Domestic and industrial water consumption is the region’s second most relevant component in water demand [16] and is mainly concentrated in the Belo Horizonte Metropolitan Region.
The distribution of the artificial reservoirs constitutes a significant factor influencing water security in the region. There are 241 dams in São Francisco Hydrographic Region, accounting for 74.8 billion cubic meters (109 m3) water stored capacity. It impacts the water availability in the river stream, increasing the average values and reducing the fluctuation of the river flow, contributing to the water supply for the different sector uses. Despite these positive impacts, the dam construction in the river basin influences negatively biotic aspects, as the fish migration, for example.
The Figure 3 illustrates the river network and main artificial reservoirs in the São Francisco catchment area. The higher precipitation is observed in upper São Francisco, which mainly contributes to the water flow in the basin. Four important hydropower Dams regulate the water flow in the São Francisco River: Três Marias, Sobradinho, Luiz Gonzaga and Xingó, as indicated on the map. These Dams regulate the water availability and the operational rules of the dams attempts to guarantee uninterrupted access of water for various purposes, including, agriculture, energy and industrial. The water availability along river reaches was estimated by the Brazilian National Water and Sanitation Agency as the natural flow at some river location occurred at least 95% of the time (Q95). In reaches under the influence of reservoirs, the availability was estimated specifically: for areas downstream from the dam was adopted the minimum outflow from the reservoir summed to Q95 streamflow incremental contributions from tributaries and for the flooded area of the reservoir, the flow guaranteed for 95% of the time less the reservoir outflow was adopted. In the flooded areas of the hydropower dams managed by the National Electrical System Operator (ONS) the regularization capacity was ignored, using only the Q95 for the dam location. However, climate change and other biophysical conditions including the soil water retention capacity limits the actual water availability and demand [1,2,12,13].
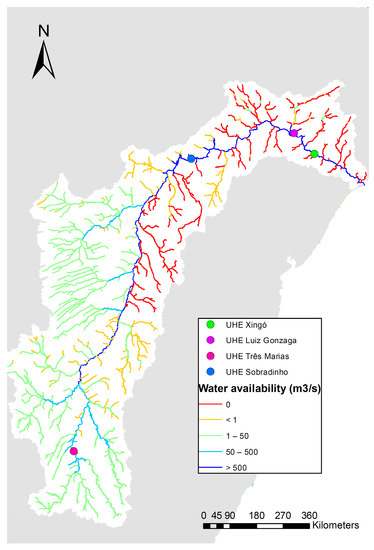
Figure 3.
Water availability for the main rivers in the catchment area (shapefile to generate the map was downloaded from ANA [17] on 17 June 2021).
The dams and reservoirs are vulnerable to extreme drought events in the basin. The recurrence of low rainfall patterns has contributed to water scarcity problems in the catchment area, and as a consequence, the water level at the reservoirs dropped to 10% of the capacity. Data collected from the Brazilian Drought Monitor and the Brazilian Reservoir Monitoring System demonstrate such effects of the lower rainfall values in Sobradinho and Três Marias hydropower plants located in the São Francisco River. The Drought Monitor is a systematic monitoring process of the drought severity in Brazil. All the data are available in a spatial platform and the classification of the severity of the drought is adapted from the categorization of the National Drought Mitigation Center, Lincoln, NE, USA. Figure 4 shows reduced values of water stored in these two dams, especially during 2015, 2016 and 2017, when the region suffered from problems related to drought, as demonstrated by the drought severity maps of the Drought Monitor.
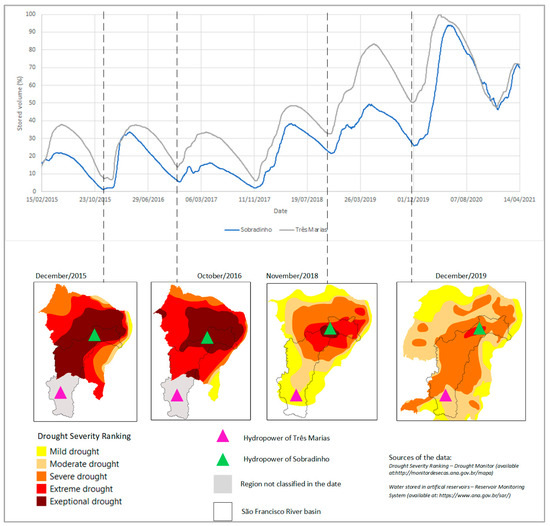
Figure 4.
Drought severity and impacts in water stored in Sobradinho and Três Marias dams.
The National Water and Sanitation Agency implemented stricter water allocation rules to ensure water availability among the essential uses along the main river, even if it involves forgoing benefits from hydropower. However, these actions are more effective in the short run but may not be enough to ensure water security in the long term. The effects of water related investments thus can contribute to enhancing the resilience and decreasing the vulnerabilities of the water resources systems.
2.1. Methodology
The paper assesses the change in the water security situation in the São Francisco River. Following the approach of Vörösmarty et al. [4], the paper identifies key drivers that influence water security in the basin. The paper’s methodology for an integrated water security assessment involves assembling and harmonising different spatial databases, including biophysical, socioeconomic data, to quantify various stressors while accounting for the externality effects.
The Figure 5 demonstrates the workflow of the methodology. Based on the Hydrographic dataset which comprises the hydrographic network in stretches between the confluence points of the water courses, water security condition for each grid cell is categorised by 16 drivers, grouped under different themes. The themes include catchment disturbance, pollution, water resources development, and biotic factors. Some drivers consider the cumulative effect of the water flow and are standardised, as in Vörösmarty et al. [4].
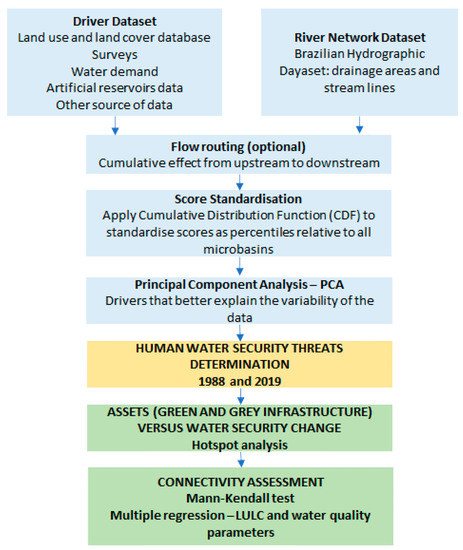
Figure 5.
Workflow of the methodology.
A PCA analysis selects the most representative drivers. Subsequently, the water security threats are determined for 1988 and 2019, and a hotspot analysis has been applied to identify the spatial clusters with the most significant changes in the water security threats during this period. This result is evaluated with the green and grey infrastructure variation in the same period to identify the causes of the water security changes and to support near future investments from a connectivity evaluation approach.
Table 1 shows the drivers and themes which comprise the water security threats framework. As mentioned, 16 drivers were selected to support the water security threats determination. They were grouped into four main themes, and each driver is represented by an indicator. The water flow (flow routing) is applied for some drivers, as detailed below:

Table 1.
Drivers and themes which comprise the water security threats framework.
- Drivers—nitrogen loading, phosphorus loading and organic loading: the concentration of the contaminants was determined by the cumulative estimated load of contaminants divided by the water flow;
- Driver—water balance: rate between the cumulative water demand and the water availability;
- Driver—water flow: difference between the mean flow and the water availability;
- Driver—water flow for natural resources: difference between natural minimum flow and the cumulative water demand.
The Drivers are calculated according to the following equation:
where is the standardised driver of the microbasin i, is the driver score, is a cumulative probability, is the rank of the driver relative to all micro basins sorted in ascending order, and is the total number of micro basins. The scores of the drivers are standardised on a scale from 0 to 1, where values closer to 0 represent lower water security threats and nearer to 1 higher water security threats. The upstream to downstream effects are simulated for some drivers, where applicable, with weights for the Drivers and Themes.
A Principal Component Analysis (PCA) is then used to select the most representative drivers in the catchment area. It helps reduce the dimensionality of the data set and determine the variables that better explain the variability of the data with a lesser number of variables
The principal components are determined as a linear combination of the original variables. Thus, are calculated new orthogonal axis, which are the eigenvectors of the original covariance matrix. The components are extracted in a way that the first component, denoted as 〖PC〗_1 contributes for a greater variability of the original data. 〖PC〗_1 is obtained from the linear combination of the variables Xj, where j = 1, 2, …, p [18].
where w_(1)p are the loadings of the component 1.
〖PC〗_1 = w_(1)1 X_1 + w_(1)2 X_2 + ⋯ + w_(1)p X_p
The relevant variables are selected given the higher eigenvalues as well as the correlation between the drivers. The variables with highest weight in terms of the main components are selected.
The Human Water Security threats are then calculated using the selected drivers for each microbasin using the following equation, as calculated by Vörösmarty et al. [4]:
where is the weight of theme j, is the weight of driver k within the theme j, is the number of drivers within theme j, and is the standardised driver k within theme j for micro basin i.
The difference of the water security threats between 2019 and 1988 is calculated for each microbasin using the equation:
where:
- is the water security threats change over the years
- is the water security threats in 2019
- is the water security threats in 1988
Subsequently, a hotspot analysis using the ESRI ArcGis hotpost tool (RedLands, CA, USA) is applied to identify spatial clusters of the HWS changes () based on the Z-score. The intensity of the clustering (hot spot) is identified from the statistically significant positive z-scores.
The Mann–Kendal test is a non-parametric test and, according to Peng et al. [19], the original hypothesis H0 is the time series data, which are independent, and the alternative hypothesis H1 is a two-sided test. p value > 0.05 indicates no trend, away from monotonic trend. On the other hand, p value < 0.05 demonstrates that there is a trend, rejecting hypothesis H0. Kendall-tau positive values indicate the increasing trend and negative values a decreasing trend pattern. Mann–Kendall test evaluates whether y values tend to increase or decrease over time through what is essentially a nonparametric form of monotonic trend regression analysis [20]. The Mann–Kendall test was applied in studies [1,19,21,22,23] to detect the trends in water quality time series data. The Mann–Kendall test is applied in this article to support the connectivity evaluation to identify the correlation between water security threats development and the impacts in downstream areas during the last years. Initially, specific points in the river basin area were selected and the Mann–Kendall test was applied to identify the trend of change in these monitoring points for three different parameters (mean annual phosphorus concentration, BOD concentration and dissolved oxygen concentration). Finally, a multiple regression between land use and land cover modification and water quality parameters as the dependent variable is employed. The following regression model is constructed to explore the relationship decadal change (2009 to 2020) in LULC (forest, pasture and agriculture), obtained and the increasing trend in BOD at the confluence between São Francisco and Grande Rivers:
where:
- is the BOD in the year i
- is the total forested area in Grande River basin in the year i
- is the total agricultural area in Grande River basin in the year i
- is the total area with pasture in Grande River basin in the year i
- A, B, C and Constant are parameters determined by the model.
2.2. Data
Several data sources have been used to derive the drivers. The Brazilian Ottocodified Hydrographic Dataset 5k (BHO5k) is used as the reference spatial database. This dataset is derived from the multi-scale BHO 2017 and comprised of watercourses with an area greater than or equal to 5 km. Each stretch receives a code and is associated with a drainage area, in a one-to-one relationship. An essential characteristic of this representation is to be topologically consistent, that is, to correctly represent the hydrological flow of rivers, through connected stretches and with a flow direction [17]. In the São Francisco catchment area, there are micro basins. All the drivers were calculated for 2019. The drivers selected from PCA analysis were calculated also for 1988 to estimate the water security threats in 1988. The Table 2 describes the source of data and a summary of each driver.
Table 2.
Drivers and source of data applied in the water security threats analysis.
Water quality data used in the connectivity evaluation was obtained from the Brazilian National Water Resources Information System and complemented with more recent data provided by the Water Resources Information System of the Bahia State (Table 3).
Table 3.
Water quality parameters source of data of the connectivity analysis.
3. Results and Analysis
The results of the Principal Component Analysis (PCA), presented in the Appendix A, show the relevant drivers in the river basin region. The correlation matrix was applied to decrease the number of drivers with high correlation and higher component scores (in this situation one driver was select).
Table 4 illustrates the drivers selected after PCA and the weight adopted. It includes: cropland area, livestock density, annual precipitation variability, sediment production, organic loading, water stored, water balance, agricultural water stress, and flow regulation.
Table 4.
Themes, drivers and weights for water security threats.
The results of the water security threats demonstrate a considerable number of micro basins with higher value of water security threat (see Figure 6). Figure 6 illustrates the result of the water security threats for 1988 and 2019. Water insecure micro basins are mostly concentrated in upstream areas due to lower water availability and higher water demand for irrigation. The Semiarid Region and the Belo Horizonte Metropolitan Region also face higher water security threats. The water-secure grid cells are located along the main river (São Francisco) and in the catchment vicinity of the artificial reservoirs, where the water availability is higher.
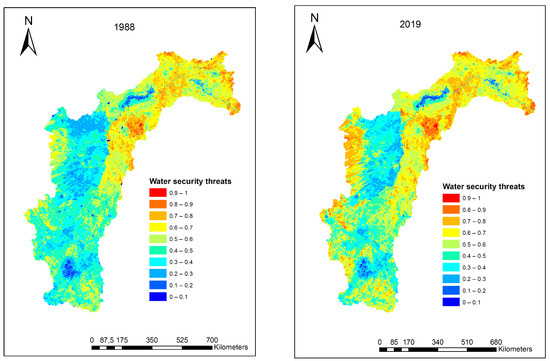
Figure 6.
Water Security State: 1988 and 2019.
According to Figure 7, there is no significant difference in overall water security threats in the current situation compared to 1988. However, in the west of the river basin (west of the Bahia State), there are significant increase in water threats; whereas in some grid cells of the semi-arid region, there is more significant decrease in the water security threats. The increased threats in the western Bahia can be explained by the growth of the agriculture activity in the last decades with heavy dependence on irrigation.
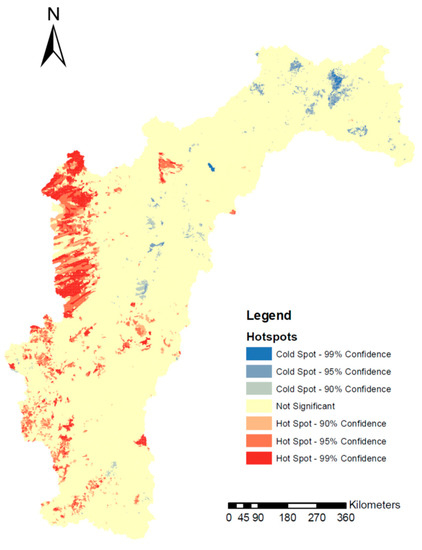
Figure 7.
Water security threats variation between 1988 and 2019 (current situation).
3.1. Analysis of Green and Grey Investments from 1988 and 2019
Green infrastructure represents natural systems, as forests, wetlands and green corridors, for example. On the other hand, grey infrastructure refers to traditional water security civil works such as dams, wastewater treatment plants, canals and water treatment plants. In the São Francisco River basin, currently, there is an increased reliance on traditional infrastructure (Grey Infrastructure) to mitigate water threats which have yielded benefits in regulating the threats so far.
Here, the paper considers forest (natural forest and forest plantation), wetland and grassland as green capital stock whereas the capacity of water reservation in artificial reservoirs as the grey infrastructure and attempt to identify the most suitable application of green investment.
The Figure 8 demonstrates the growth of the water stored capacity between 1988 and 2019. It illustrates the concentration of new built grey infrastructure in the north of the river basin, as well as in upstream of the Preto River basin, a tributary of Paracatu River, in Minas Gerais State. The added grey infrastructure, especially in the semiarid region, played an important role in reducing the water security threats from increasing. This is evident from the Figure 9, that shows the reduction of the threats in river basins that expanded the grey infrastructure during the last decades.
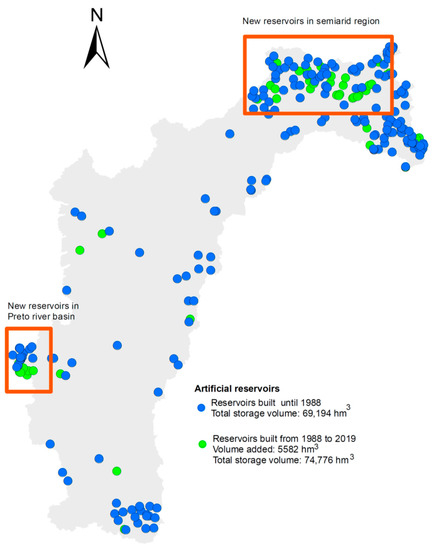
Figure 8.
Dams constructed within the São Francisco River basin until 1988 and the reservoirs added from 1988 until 2019.
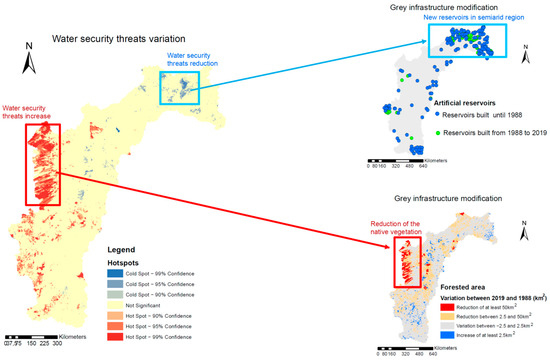
Figure 9.
Water security threats variation and green and grey infrastructure investments between 1988 and 2019.
The Figure 10 depicts the spatial distribution of the green infrastructure variation. In terms of green infrastructure, there is a net loss during the period between 1988 and 2019. The alteration of the land use and land cover reveals an overall decreasing of the forested area, with a reduction around 5.5 million kilometres square of the green infrastructure from 1988 until 2019. Aggressive land conversion, intensive agricultural practices, and grazing explains the increase in the water security threats, particularly in the western part of the basin.
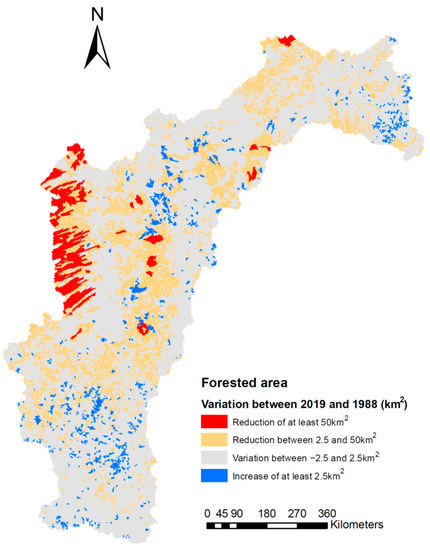
Figure 10.
Green infrastructure change between 1988 and 2019.
3.2. Connectivity Analysis to Support near Future Investments
The paper analysed the spatial externality through the connectivity assessment of the drivers in the river basin. In São Francisco River basin, upstream positive externalities, like water flow, water availability and precipitation, generate benefits for downstream. On the other hand, negative impacts related with point and non-point pollution, sediment production and water demand increase, impact not only locally but can probably produce negative externalities in the downstream (Figure 11).
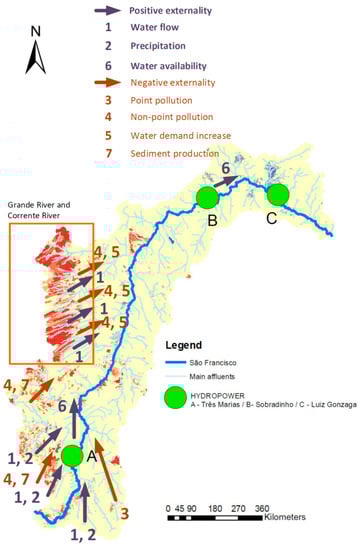
Figure 11.
Connectivity analysis in São Francisco River basin.
As can be noted in Figure 11, the water security threat has increased in upper Grande and Corrente river basins related with the land use modification during the last decades. A Mann–Kendall test is applied to identify the possible impacts of these changes in the water quality conditions in 2 regions (A and B), and 3 monitoring points were selected for each region, as shown in the Figure 12.
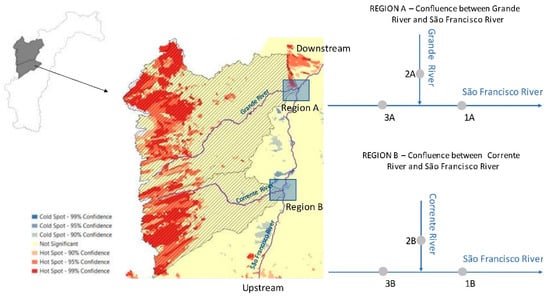
Figure 12.
Regions selected to implement the trend analysis (location of monitoring points selected: 1A, 2A, 3A, 1B, 2B and 3B).
Appendix B presents the results of the Mann–Kendall non-parametric test for the monitoring water quality gauges selected (Region A: 1A, 2A, 3A; Region B: 1B, 2B, 3B). As mentioned, the test is associated with the p-value and suggest the rejection of the hypothesis H0 is identified for BOD in the points 1A and 2A. So, according to the results, is possible to assert the trend of BOD increasing in these 2 points examined (1A and 2A) during the last years.
The trend of growth of the BOD at the confluence between São Francisco and Grande Rivers) the points 1A and 2A (see Figure 12) can be explained by the increasing of the water security threats in the Grande River basin. The land use and land cover modification, with the decreasing of the green infrastructure in this region during the last years, is a factor that can be impacting the water quality conditions in downstream areas in São Francisco River.
Table 5 illustrates the results for the multiple regression from both points: 1A and 2A. The correlation coefficient R2 for both locations demonstrates that the land use as a factor that contributes largely to the increase in BOD downstream.
Table 5.
Results of the multiple regression analysis.
It is evident that the water security threats are increasing in the west of the basin, especially from the Grande River basin (Figure 12), induced by the land-use modification over the last 32 years, and influences the water quantitative and qualitative conditions in São Francisco River.
The economic effects of such negative externality are explained using a conceptual diagram (see Figure 13) using cost and benefit curves. The marginal abatement cost curve is upward sloping and implies the additional costs involved from grey infrastructure in mitigating the threats Assuming that the additional deployment of grey infrastructure costs more in reducing the threats, the marginal abatement cost in reducing the threat increases with more threats. The marginal benefit curve, on the other hand, is downward sloping as and implies the benefits from agricultural productivity in the region which will decline at the marginal level with increase in water security threats. Figure 13 explains that the equilibrium condition is met with regards to current threats to water security downstream (T0) where the marginal abatement cost is equal to the marginal benefit of reducing the threats downstream. This is the point where the level of water security threat should have been balanced without any effects of negative externalities. However, negative externalities (point and non-point source of pollution) from Grande increases the social costs. The actual equilibrium condition is established at a higher level of threats (T1) where marginal abatement costs equal the marginal social cost inclusive of the effects of negative externalities. Additional costs to the extent of AB will be incurred to reduce the threats to To level. The policy questions is how to reduce the additional costs in mitigating the water security threats. A clear upstream -downstream trade-off is evident between the increase in intensity of agricultural production and land conversion in the Grande region and the increase in grey infrastructure downstream.
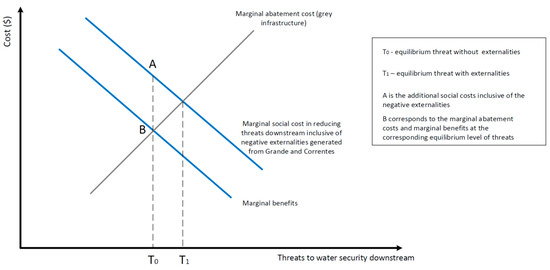
Figure 13.
Marginal abatement and benefits and threats to water security.
So far, due to increased grey investment, the water security threats have been regulated. However, with a further increase in land-use change in the Grande and Correntes region and intensive agriculture, the magnitude of the negative externalities will increase. As the capacity to further increase in grey investment is reaching its limit, it will increase threats the downstream. The increases in green infrastructure investment in the Grande and region could be the only solution to reduce the externalities and minimise the water security risks. It needs evaluation of the marginal benefits and costs of reducing the threats in the region and evaluation of the external costs in terms of effects of the diffused pollution. This is beyond the scope of the current study. Future research may focus on how a blended green and grey infrastructure investment can resolve such a trade-off.
4. Conclusions
Despite the advances in water related investments, São Francisco River basin has suffered with systematically water problems. An integrated water security assessment approach has been used to evaluate the change in the water security condition in the São Francisco River and detects key drivers that influence water security in the basin. Over a time, gap of 32 years (1988 and 2019). The grey and green infrastructure change in the period were determined and compared with the water security threats modification.
Results indicate that changes in the water security threats are probably associated with the modification in the green and grey infrastructure in São Francisco River basin. The increasing of the total water storage capacity in artificial reservoirs, especially in the driest region of the catchment area, contributed to the reduction of the threats in the region. On the other hand, the decrease in the green infrastructure, particularly in the west of the case study area, and the growth of water use led to the increase of the water security threats.
The factors contributing to the increase in water security threats in the west of the river basin can reduce the benefits and increase the cost in reducing the threats in the downstream of the basin. The increases in green infrastructure investment in the Grande and region could be the only solution to reduce the downstream externalities and minimise the water security risks. This could be well aligned to the water plan of the São Francisco River [7], which aim to define a “green net” within the catchment area, including conservation areas and ecological corridors.
Future works may involve a detailed trade off assessment to evaluate the better choice of investments by decision makers in a river basin scale. This approach can support, for example, the implementation of the actions proposed in the Brazilian Water Security Plan. Future work may also include stakeholder analysis to derive the weight of the different drivers.
Author Contributions
Conceptualization, A.L.d.F.T., A.B., S.E.B. and S.R.A.; methodology, A.L.d.F.T. and A.B.; validation, A.L.d.F.T., A.B. and S.R.A.; investigation, A.L.d.F.T., A.B., S.E.B. and S.R.A.; data curation, A.L.d.F.T.; writing—original draft preparation, A.L.d.F.T. and A.B.; writing—review and editing, A.L.d.F.T., A.B., S.E.B. and S.R.A. All authors have read and agreed to the published version of the manuscript.
Funding
This study was done as part of the PhD dissertation of the first author with the funding support of the Griffith University and the Brazilian Water and Sanitation Agency.
Institutional Review Board Statement
Not applicable.
Informed Consent Statement
Not applicable.
Data Availability Statement
The spatial microbasin dataset used in this study is openly available at https://www.snirh.gov.br/ (accessed on 3 June 2021), and the Lan Use Land Cover raster database is openly available at https://mapbiomas.org/ (accessed on 10 June 2021).
Acknowledgments
We would like to thank the Australian Rivers Institute from Griffith University and the Brazilian National Water and Sanitation Agency for the research support.
Conflicts of Interest
The authors declare no conflict of interest. The funders had no role in the design of the study; in the collection, analyses, or interpretation of data; in the writing of the manuscript, or in the decision to publish the results.
Appendix A. Driver Correlation Matrix and Component Matrix of the PCA
Table A1.
Driver correlation matrix.
Table A1.
Driver correlation matrix.
| DRIVERS | Cropland | Impervious Surface | Livestock Density | Wetland Disconnectivity | Nitrogen Loading | Phosphorus Loading | Sediment Loading | Organic Loading | Water Stored | Water Balance | Human Water Stress | Agriculture Water Stress | Water Flow | Aquaculture Pressure | Annual Precipitation Variation | Water for Natural Resources |
|---|---|---|---|---|---|---|---|---|---|---|---|---|---|---|---|---|
| Cropland | 1 | 0.051 | 0.18 | 0.113 | 0.142 | 0.186 | 0.074 | 0.145 | −0.125 | 0.251 | 0.008 | 0.468 | 0.036 | 0.036 | −0.037 | 0.115 |
| Impervious surface | 0.051 | 1 | 0.047 | 0.023 | 0.021 | 0.033 | 0.072 | 0.038 | −0.058 | 0.08 | 0.175 | 0.001 | −0.044 | 0.018 | −0.056 | 0.018 |
| Livestock density | 0.18 | 0.047 | 1 | −0.004 | −0.229 | −0.206 | 0.215 | −0.205 | 0.098 | −0.191 | 0.009 | 0.04 | −0.378 | −0.002 | −0.38 | −0.257 |
| Wetland disconnectivity | 0.113 | 0.023 | −0.004 | 1 | −0.035 | −0.048 | −0.055 | −0.119 | −0.015 | 0.036 | −0.002 | 0.06 | −0.071 | 0.132 | 0.055 | −0.1 |
| Nitrogen loading | 0.142 | 0.021 | −0.229 | −0.035 | 1 | 0.965 | −0.328 | 0.92 | −0.157 | 0.813 | 0.028 | 0.174 | 0.869 | −0.006 | 0.596 | 0.748 |
| Phosphorus loading | 0.186 | 0.033 | −0.206 | −0.048 | 0.965 | 1 | −0.314 | 0.947 | −0.149 | 0.827 | 0.032 | 0.198 | 0.835 | −0.01 | 0.592 | 0.744 |
| Sediment_loading | 0.074 | 0.072 | 0.215 | −0.055 | −0.328 | −0.314 | 1 | −0.286 | 0.149 | −0.289 | 0.013 | −0.078 | −0.249 | −0.012 | −0.51 | −0.306 |
| Organic loading | 0.145 | 0.038 | −0.205 | −0.119 | 0.92 | 0.947 | −0.286 | 1 | −0.129 | 0.771 | 0.03 | 0.182 | 0.825 | −0.024 | 0.569 | 0.783 |
| Water stored | −0.125 | −0.058 | 0.098 | −0.015 | −0.157 | −0.149 | 0.149 | −0.129 | 1 | −0.219 | −0.004 | −0.118 | −0.156 | −0.03 | −0.227 | −0.155 |
| Water Balance | 0.251 | 0.08 | −0.191 | 0.036 | 0.813 | 0.827 | −0.289 | 0.771 | −0.219 | 1 | 0.046 | 0.413 | 0.719 | 0.014 | 0.564 | 0.751 |
| Human water stress | 0.008 | 0.175 | 0.009 | −0.002 | 0.028 | 0.032 | 0.013 | 0.03 | −0.004 | 0.046 | 1 | 0.008 | 0.027 | −0.001 | 0.01 | 0.041 |
| Agriculture water stress | 0.468 | 0.001 | 0.04 | 0.06 | 0.174 | 0.198 | −0.078 | 0.182 | −0.118 | 0.413 | 0.008 | 1 | 0.102 | 0.032 | 0.145 | 0.248 |
| Water flow | 0.036 | −0.044 | −0.378 | −0.071 | 0.869 | 0.835 | −0.249 | 0.825 | −0.156 | 0.719 | 0.027 | 0.102 | 1 | −0.014 | 0.577 | 0.767 |
| Aquaculture pressure | 0.036 | 0.018 | −0.002 | 0.132 | −0.006 | −0.01 | −0.012 | −0.024 | −0.03 | 0.014 | −0.001 | 0.032 | −0.014 | 1 | 0.013 | −0.019 |
| Annual precipitation variation | −0.037 | −0.056 | −0.38 | 0.055 | 0.596 | 0.592 | −0.51 | 0.569 | −0.227 | 0.564 | 0.01 | 0.145 | 0.577 | 0.013 | 1 | 0.602 |
| Water for natural resources | 0.115 | 0.018 | −0.257 | −0.1 | 0.748 | 0.744 | −0.306 | 0.783 | −0.155 | 0.751 | 0.041 | 0.248 | 0.767 | −0.019 | 0.602 | 1 |
Table A2.
Component matrix of the PCA.
Table A2.
Component matrix of the PCA.
| Drivers | Components | ||||
|---|---|---|---|---|---|
| 1 | 2 | 3 | 4 | 5 | |
| Agriculture water stress | 0.287 | 0.674 | −0.210 | −0.179 | −0.193 |
| Annual precipitation variation | 0.730 | −0.241 | −0.320 | 0.065 | −0.113 |
| Aquaculture pressure | −0.004 | 0.124 | −0.385 | 0.240 | 0.621 |
| Cropland | 0.170 | 0.805 | −0.061 | −0.152 | −0.062 |
| Human water stress | 0.038 | 0.095 | 0.242 | 0.678 | −0.109 |
| Impervious surface | 0.015 | 0.228 | 0.258 | 0.695 | −0.072 |
| Livestock density | −0.339 | 0.483 | 0.280 | −0.123 | 0.109 |
| Nitrogen loading | 0.943 | −0.005 | 0.129 | −0.016 | 0.125 |
| Organic loading | 0.924 | 0.004 | 0.211 | −0.039 | 0.103 |
| Phosphorus loading | 0.943 | 0.041 | 0.148 | −0.024 | 0.119 |
| Sediment loading | −0.424 | 0.267 | 0.472 | −0.050 | 0.218 |
| Water balance | 0.882 | 0.225 | 0.004 | 0.014 | 0.018 |
| Water flow | 0.889 | −0.154 | 0.124 | −0.025 | 0.107 |
| Water for natural resources | 0.863 | −0.007 | 0.089 | −0.023 | 0.000 |
| Water stored | −0.241 | −0.131 | 0.357 | −0.187 | 0.570 |
| Wetland disconnectivity | −0.041 | 0.210 | −0.578 | 0.230 | 0.350 |
Appendix B. Mann–Kendall Test Results
Table A3.
Mann–Kendall test results (values in red–trend identified).
Table A3.
Mann–Kendall test results (values in red–trend identified).
| Parameter | Region | River | Point Identification | State Monitoring Code | Upstream Area (km2) | Period of Data | Number of Years with Data | Variables | Kendall-tau | p-Value | Trends |
|---|---|---|---|---|---|---|---|---|---|---|---|
| Biochemical oxygen demand (BOD) | A | São Francisco | 1A | PMIRSF450 | 425,338 | 2009–2019 | 11 | BOD | 0.7035 | 0.0052 | Increase |
| São Francisco | 3A | GRDRSF420 | 345,271 | 2013–2020 | 8 | BOD | 0.6236 | 0.0624 | Not trend | ||
| Grande | 2A | GRDGRD800 | 76,304 | 2009–2010 2013–2020 | 10 | BOD | 0.7307 | 0.0071 | Increase | ||
| B | São Francisco | 1B | CRBRSF250 | 305,915 | 2014–2020 | 7 | BOD | 0.7237 | 0.0573 | Not trend | |
| São Francisco | 3B | CRBRSF220 | 34,273 | 2014–2020 | 7 | BOD | 0.2182 | 0.6295 | Not trend | ||
| Correntes | 2B | CRBCRT800 | 270,695 | 2014–2020 | 7 | BOD | 0.7237 | 0.0573 | Not trend | ||
| Phosphorus (P) | A | São Francisco | 1A | PMIRSF450 | 425,338 | 2008–2011 2013–2020 | 12 | P | −0.2896 | 0.1968 | Not trend |
| São Francisco | 3A | GRDRSF420 | 345,271 | 2013–2021 | 9 | P | −0.1111 | 0.7545 | Not trend | ||
| Grande | 2A | GRDGRD800 | 76,304 | 2008–2010 2013–2021 | 12 | P | −0.1407 | 0.6223 | Not trend | ||
| B | São Francisco | 1B | CRBRSF250 | 305,915 | 2014–2021 | 8 | P | 0.6071 | 0.0478 | Increase | |
| São Francisco | 3B | CRBRSF220 | 34,273 | 2014–2021 | 8 | P | −0.0364 | 1 | Not trend | ||
| Correntes | 2B | CRBCRT800 | 270,695 | 2014–2021 | 8 | P | 0.4629 | 0.1579 | Not trend | ||
| Dissolved oxygen (DO) | A | São Francisco | 1A | PMIRSF450 | 425,338 | 2008–2011 2013–2020 | 12 | DO | −0.0387 | 0.9027 | Not trend |
| São Francisco | 3A | GRDRSF420 | 345,271 | 2013–2021 | 9 | DO | −0.2222 | 0.4655 | Not trend | ||
| Grande | 2A | GRDGRD800 | 76,304 | 2008–2010 2013–2021 | 12 | DO | 0.0303 | 0.9453 | Not trend | ||
| B | São Francisco | 1B | CRBRSF250 | 305,915 | 2014–2021 | 8 | DO | −0.1429 | 0.7105 | Not trend |
References
- National Water and Sanitation Agency—ANA. Brazilian Water Resources Report—2017: Full Report; ANA: Brasília, Brazil, 2017; 169p. [Google Scholar]
- National Water and Sanitation Agency—ANA. National Water Security Plan; ANA: Brasília, Brazil, 2019; 112p. [Google Scholar]
- Dadson, S.; Hall, J.W.; Garrick, D.; Sadoff, C.; Grey, D.; Whittington, D. Water security, risk, and economic growth: Insights from a dynamical systems model. Water Resour. Res. 2017, 53, 6425–6438. [Google Scholar] [CrossRef]
- Vörösmarty, C.J.; McIntyre, P.B.; Gessner, M.O.; Dudgeon, D.; Prusevich, A.; Green, P.; Glidden, S.; Bunn, S.E.; Sullivan, C.A.; Liermann, C.R.; et al. Global Threats to Human Water Security and River Biodiversity. Nature 2010, 467, 555–561. [Google Scholar] [CrossRef] [PubMed]
- Rodriguez, D.J.; van den Berg, C.; McMahon, A. Investing in Water Infrastructure: Capital, Operations and Maintenance; Water Partnership Program; World Bank: Washington, DC, USA, 2012; 45p. [Google Scholar]
- Browder, G.; Ozment, S.; Bescos, I.R.; Gartner, T.; Lange, G.M. Integrating Green and Gray—Creating Next Generation Infrastructure; World Bank Group and World Research Institute: Washington, DC, USA, 2018. [Google Scholar]
- Cohen-Shacham, E.; Walters, G.; Janzen, C.; Maginnis, S. Nature-Based Solutions to Address Global Societal Challenges; IUCN: Gland, Switzerland, 2016; Volume Xiii, 97p. [Google Scholar]
- The Nature Conservancy—TNC. Investing in Nature for European Water Security; TNC: Arlington County, VA, USA, 2019; 204p. [Google Scholar]
- Liu, Y.; Theller, L.O.; Pijanowski, B.C.; Engel, B.A. Optimal selection and placement of green infrastructure to reduce impacts of land use change and climate change on hydrology and water quality: An application to the Trail Creek Watershed, Indiana. Sci. Total Environ. 2016, 553, 149–163. [Google Scholar] [CrossRef]
- Liu, Y.; Engel, B.A.; Collingsworth, P.D.; Pijanowski, B.C. Optimal implementation of green infrastructure practices to minimise influences of land use change and climate change on hydrology and water quality: Case study in Spy Run Creek watershed, Indiana. Sci. Total Environ. 2017, 601–602, 1400–1411. [Google Scholar] [CrossRef] [PubMed]
- Haasnoot, M.; van Aalst, M.; Rozenberg, J.; Dominique, K.; Matthews, J.; Bouwer, L.M.; Kind, J.; Poff, N.L. Investments under non-stationarity: Economic evaluation of adaptation pathways. Clim. Chang. 2019, 161, 451–463. [Google Scholar] [CrossRef] [Green Version]
- Committee of the São Francisco River Basin (CBHSF); Agência Peixe Vivo. Water Plan of the São Francisco River Basin: 2016–2025; CBHSF: Belo Horizonte, Brazil, 2016; 327p. [Google Scholar]
- National Water and Sanitation Agency—ANA. Stationatity Analysis of Hydrologic Series in São Francisco’s River Basin and Consumptive Uses UHE Sobradinho Upstream; ANA: Brasília, Brazil, 2013; 85p. [Google Scholar]
- Feltran-Barbieri, R.; Ozment, S.; Hamel, P.; Gray, E.; Mansur, H.L.; Valente, T.P.; Ribeiro, J.B.; Matsumoto, M.M. Natural Infrastructure to Guandu’s Water Supply System, Rio de Janeiro/Brazil; World Resources Institute: São Paulo, Brazil, 2018; 72p. [Google Scholar]
- Vörösmarty, C.J.; Stewart-Koster, B.; Green, P.A.; Boone, E.L.; Flörke, M.; Fischer, G.; Wiberg, D.A.; Bunn, S.E.; Bhaduri, A.; McIntyre, P.B.; et al. A green-gray path to global water security and sustainable infrastructure. Glob. Environ. Chang. 2021, 70, 102344. [Google Scholar] [CrossRef]
- National Water and Sanitation Agency—ANA. Handbook of Consumptive Water Use in Brazil; ANA: Brasília, Brazil, 2019; 75p. [Google Scholar]
- National Water and Sanitation Agency—ANA. National Water Resources Information System Portal—SNIRH; ANA: Brasília, Brazil, 2021. [Google Scholar]
- Teixeira, A.L.F. Spatial Analysis of Socio-Economic Variables Applied to Management in the Sanitation Sector—Case Study: Niterói City, RJ. Master’s Thesis, Federal University of Rio de Janeiro—COPPE/UFRJ, Rio de Janeiro, Brazil, 2001. [Google Scholar]
- Peng, Z.X.; Zhang, H.F.; Guo, Y.; Lang, C.; Wang, C.Y.; Dong, J.Z.; Gao, K.X.; Song, M.; Yang, Y.S. Analysis on Water Quality Change Trend of the Municipal Sewer Network Based on the Mann–Kendall method. IOP Conf. Ser. Earth Environ. Sci. 2018, 186, 012069. [Google Scholar] [CrossRef]
- Meals, D.W.; Spooner, J.; Dressing, S.A.; Harcum, J.B. Statistical Analysis for Monotonic Trends; Technical Note 6; Developed for U.S. Environmental Protection Agency, Tetra Tech, Inc.: San Bernardino, CA, USA, 2011. [Google Scholar]
- Naddeo, V.; Scannapieco, D.; Zarra, T.; Belgiorno, V. River water quality assessment: Implementation of non-parametric tests for sampling frequency optimization. Land Use Policy 2013, 30, 197–205. [Google Scholar] [CrossRef]
- Yenilmez, F.; Keskin, F.; Aksoy, A. Water quality trend analysis in Eymir Lake, Ankara. Physics and chemistry of the earth. Phys. Chem. Earth 2011, 36, 135–140. [Google Scholar] [CrossRef]
- Samsudin, M.S.; Khalit, S.I.; Juahir, H.; Nasir, M.F.M.; Kamarudin, M.K.A.; Lananan, F. Application of Mann–Kendall in Analyzing Water Quality Data Trend at Perlis River, Malaysia. Int. J. Adv. Sci. Eng. Inf. Technol. 2017, 7, 78. [Google Scholar] [CrossRef] [Green Version]
- Moruzzi, R.B.; Conceição, F.T.; Sardinha, D.S.; Honda, F.P.; Navarro, G.R.B. Evaluation of diffuse loads and simulation of self-purification in the Água Branca River, Itirapina (SP). UNESP Geociências 2012, 31, 447–458. [Google Scholar]
- Johnes, P.J. Evaluation and management of the impact of land use change on the nitrogen and phosphorus load delivered to surface waters: The export coefficient modelling approach. J. Hydrol. 1995, 183, 323–349. [Google Scholar] [CrossRef]
- National Water and Sanitation Agency—ANA. Sewage Atlas: River Basin Clean-Up; ANA: Brasília, Brazil, 2017; 88p. [Google Scholar]
- Cheng, X.; Chen, L.; Sun, R.; Jing, Y. An improved export coefficient model to estimate non-point source phosphorus pollution risks under complex precipitation and terrain conditions. Environ. Sci. Pollut. Res. 2018, 25, 20946–20955. [Google Scholar] [CrossRef] [PubMed]
- Campagnoli, F. The Production of the Sediment of the South America Continent: Propose of Mapping of the Erosion Rates Based on Geological and Geomorphological Aspects. Rev. Bras. Geomorfol. 2006, 7, 3–8. [Google Scholar] [CrossRef] [Green Version]
- National Water and Sanitation Agency—ANA. Paranapanema River Basin Plan; ANA: Brasília, Brazil, 2017; 108p. [Google Scholar]
- National Water and Sanitation Agency—ANA. Brazil Atlas: Urban Water Supplies; ANA: Brasília, Brazil, 2010; 72p. [Google Scholar]
Publisher’s Note: MDPI stays neutral with regard to jurisdictional claims in published maps and institutional affiliations. |
© 2021 by the authors. Licensee MDPI, Basel, Switzerland. This article is an open access article distributed under the terms and conditions of the Creative Commons Attribution (CC BY) license (https://creativecommons.org/licenses/by/4.0/).