Abstract
The global warming trends have accelerated snow and glacier melt in mountainous river basins, which has increased the probability of glacial outburst flooding. Recurrent flood events are a challenge for the developing economy of Pakistan in terms of damage to infrastructure and loss of lives. Flood hazard maps can be used for future flood damage assessment, preparedness, and mitigation. The current study focused on the assessment and mapping of flood-prone areas in small settlements of the major snow- and glacier-fed river basins situated in Hindukush–Karakoram–Himalaya (HKH) under future climate scenarios. The Hydrologic Engineering Center-River Analysis System (HEC-RAS) model was used for flood simulation and mapping. The ALOS 12.5 m Digital Elevation Model (DEM) was used to extract river geometry, and the flows generated in these river basins using RCP scenarios were used as the inflow boundary condition. Severe flooding would inundate an area of ~66%, ~86%, ~37% (under mid-21st century), and an area of ~72%, ~93%, ~59% (under late 21st century RCP 8.5 scenario) in the Chitral, Hunza, and Astore river basins, respectively. There is an urgent need to develop a robust flood mitigation plan for the frequent floods occurring in northern Pakistan.
1. Introduction
Floods are a recurrent and frequent natural disaster in Pakistan [1,2,3,4]. In Pakistan, over 60% of the land area is vulnerable to floods, 40% to earthquakes, and 6% to cyclones [1]. Indus, the longest river in Pakistan, originates from the Hindukush–Karakoram–Himalaya (HKH) region and, along with its tributaries Chenab, Ravi, Sutlej, and Jhelum, runs north to south through the country [5]. Due to snowmelt and heavy monsoon rainfalls, significant flows are generated during summer [6]. As a result, the rivers overflow and enter their floodplains. The flood peaks of the rivers usually do not overlap but when they do, massive flooding results.
The floods in the Upper Indus Basin (UIB) are different from those in the Lower Indus Basin. The geology, climate of the northern areas of Pakistan, weak geological formations, intense rainfall, erosion, steepness followed by erosion, sedimentation, and meandering rivers make the region prone to natural disasters [1]. Although Pakistan was hit by severe floods in 1973, 1992, and 2006, the flood of 2010 was significantly impactful. In the 2010 flood, an area of over 50,000 km2 was flooded, causing incalculable damage to the economy, standing crops, infrastructure, the lives of people and animals [1,3,7]. Additionally, it resulted in over 1500 deaths and made over 20 million people homeless [8]. In the mountainous areas, flash floods carry debris such as branches, logs, and uprooted trees and wash away houses, shops, and bridges along the way. Debris flow and deposits, undercutting of check dams, erosion and disintegration of riverbanks, displacement of channels, clogging of bridges, and inundations are some of the major impacts of flash floods [9].
Snow is one of the most significant climatic variables that need to be monitored for estimating and forecasting the runoff from high-altitude regions. One of the dominant causes of flash floods in the HKH belt is the rapid thawing of snow and glaciers during summer. Variability in snow melt due to the changing climate will affect the water flow, making it essential to simulate the magnitude of the change in runoff [10]. Several models (e.g., SSARR, HEC-1, NWSRFS, PRMS, SRM, and GAWSER, etc.) for forecasting snowmelt runoff are available for operational uses [11]. Similarly, owing to an unprecedented increase in global warming, glaciers in the UIB are retreating since the 20th century. The retreating terminus of glaciers has led to the creation of many glacial lakes and to an increase in the extension of old ones. More than 2000 glacial lakes have been located in the HKH region, among which 52 were categorized as potentially disastrous. UIB has been affected by various hydrological disasters such as landslides, flash and glacial floods, and debris flows and has been subjected to social and economic damages [12]. The outburst of these glacial lakes followed by flash floods is a common and most disastrous phenomenon in the Karakoram and Himalayas and is known as the Glacial Lake Outburst Flood (GLOF). In the last 200 years, approximately 35 massive GLOF events have occurred in Gilgit Baltistan. The main flash flood events in Chitral happened in 1973, 1984, 1997, 1998, 2004, and 2005, triggered the loss of hundreds of lives, and destroyed houses, agricultural production, infrastructure, and livestock. Recently, a GLOF event in the Golen Gol region of lower Chitral inundated many villages, washed away five bridges, overturned power poles, and submerged farmlands and roads [13]. The glacial lake burst occurred after the Jam Ashpar glacier exploded overnight [14]. An increase in temperature and precipitation, heat waves, and earthquakes are also associated with GLOF events. During the past three decades, 120 GLOF events have occurred in Hunza valley and Shyok due to a 10.1% decrease in glacier cover. It is startling that five disastrous GLOF events have occurred in Hunza valley during 2007–2008 [15]. Hunza valley was hit by a huge landslide in 2010, which caused massive flooding and damage to life, livelihood, and infrastructure. The flood resulted in the inundation of 15.5 km of the Karakoram Highway and 88 acres of agricultural land, which consequently affected crop yield. More than 150 residential houses were drowned due to flooding [16]. Similarly, the repeated formation and bursting of glacial lakes due to the surge of the Shispar glacier in Hunza valley since 2018 has been causing damages to infrastructure, livestock, and human lives. In 2003, a flash flood due to heavy rain swept away various houses and a mosque, followed by the disruption of the communication system in the village of Mushkin in the Astore valley. Similarly, flooding of the Astore river in 2005 destroyed hundreds of houses, washed away most of the shops, and blocked down the main road. As a result, thousands of people became homeless, and standing crops were badly affected. Increasing temperature followed by the melting of snow and glacial ice is reported to be a cause of flash floods in Astore [17].
The socio-economic vulnerability of people to natural disasters in this region poses a great challenge for the government [1,18,19,20]. Concurring disasters take the country back in development and demands recovery, reconstruction and rehabilitation. Due to the growing impact of damages caused by floods in the recent years, flood risk assessment has been studied globally [2,3,20,21,22,23,24,25]. Flood risk assessment is a flood mitigation strategy that can be implemented along with the construction of protective structures. The most challenging aspect of mountainous hydrology is hydrological simulation, since rugged topography, inaccessible terrain, harsh weather, security, logistics, and other constraints limit the field studies in the region [26,27,28,29,30,31]. For such regions, remote sensing is the best possible alternative to observe and evaluate flood risk. Remote sensing data (landcover, elevation, river width and depth, flood extent, water level, etc.) used as an input in flood simulation models have a great potential to improve the understanding and forecasting of flood events [32].
Various computational models (such as HEC-RAS, HEC-HMS, MIKE FLOOD, MIKE SWMM, MIKE11, and InfoWORKS) exist to simulate velocity, depth, and other flood characteristics [22,33,34]. The Hydrologic Engineering Center River Analysis System (HEC-RAS) is among the best hydrodynamic models for flood simulation studies [2,3,21,23,35,36,37,38,39,40,41,42,43,44,45]. HEC-RAS has been used for modeling flood inundation, management, and mitigation across the world [2,22,46,47]. The flood event of 2010 involving the Swat River was modeled [23] using the 2D application of the HEC-RAS model and reported an increase in the extent of the inundation area with increasing flood return periods. The HEC-RAS 1D-2D integrated model was reported to accurately display susceptible points in the representation of flooding in the coastal urban area of the UK for sea-level changes up to the year 2100. The study recommended considering the use of 1D–2D integrated flood modeling before decision making [48]. Similarly, ref [49] assessed the capability of the HEC-RAS model to simulate flood as a combined 1D and 2D model and compared it with Gerris and FLUMEN models. Modeling was performed for the 2011 Baeksan River flood in South Korea. It was concluded that HEC-RAS 1D-2D modeling is a robust method for the accurate simulation of flood events as compared to the other models. HEC-RAS was also applied in combination with the Watershed Modelling System and GIS to analyze the flood event in Ain Sefra city (Algeria) with or without built concrete walls for return periods of 10, 100, and 1000 years. It was concluded that retaining walls decrease the inundation extent but are not efficient for all return periods. Therefore, flood-retaining infrastructures were recommended so to ensure the safety during floods in the city in future [50]. Similarly, another study [51] used the HEC-RAS model to analyze the streamflow and develop a floodplain model for Carson River and reported an increase in the flood level 100 years into the future under climate change.
The Fifth Assessment Report (AR5) [52] of the Intergovernmental Panel on Climate Change (IPCC) established greenhouse gas concentration climate change projections recognized as Representative Concentration Pathways (RCPs). The projections’ near term is fixed in 2035, while the long term is established for 2100. Four scenarios have been developed, named after the level of radiative forcing and measured in Watts per square meter (W/m2) by the year 2100 [53]. These scenarios include a mitigation scenario (RCP 2.6), two medium-stabilization scenarios (RCP 4.5 and RCP 6), and a high-emission scenario (RCP 8.5). The RCP 8.5 appears to lessen greenhouse gases and to limit warming by 2100 through a little endeavor. Many researchers have used Representative Concentration Pathways (RCP) scenarios to evaluate the impact of climate change on river floods using HEC-RAS [45,54,55]. A study mapped flood hazard in the two municipalities of the Petite-Nation River basin in Quebec, Canada, under projected RCP 4.5 and RCP 8.5 climate scenarios (2050 and 2080) [56]. Flood hazard maps were generated using the GARI (Gestion et Analyse du Risque d’Inondation) tool to determine flood risk due to the changing climate. Flow hydrographs were derived for 25, 50, and 100 years from the flood event of 2007. Similarly, another work [45] employed HEC-RAS to simulate floods under future climate scenarios driven from three General Circulation Models (GCMs) in the 2020s, 2050s, and 2080s in the Yang River Basin of Thailand.
Therefore, owing to the need of predicting flood inundation extents in the rivers of snow- and glacier-fed catchments of HKH region Pakistan, this study aimed to develop flood maps of Chitral, Hunza, and Astore basins using the HEC-RAS model under RCP climate scenarios. Flood maps may be used for the implementation of a flood management program, which can significantly reduce damages in the study area. The results of this study can potentially assist policymakers and planners to establish and implement effective flood mitigation and management policies in the study area.
2. Materials and Methods
The objective of this study was to develop flood maps of a study area in Pakistan. HEC-RAS version 5 was used as a 2D model to map the flood area.
2.1. Study Area
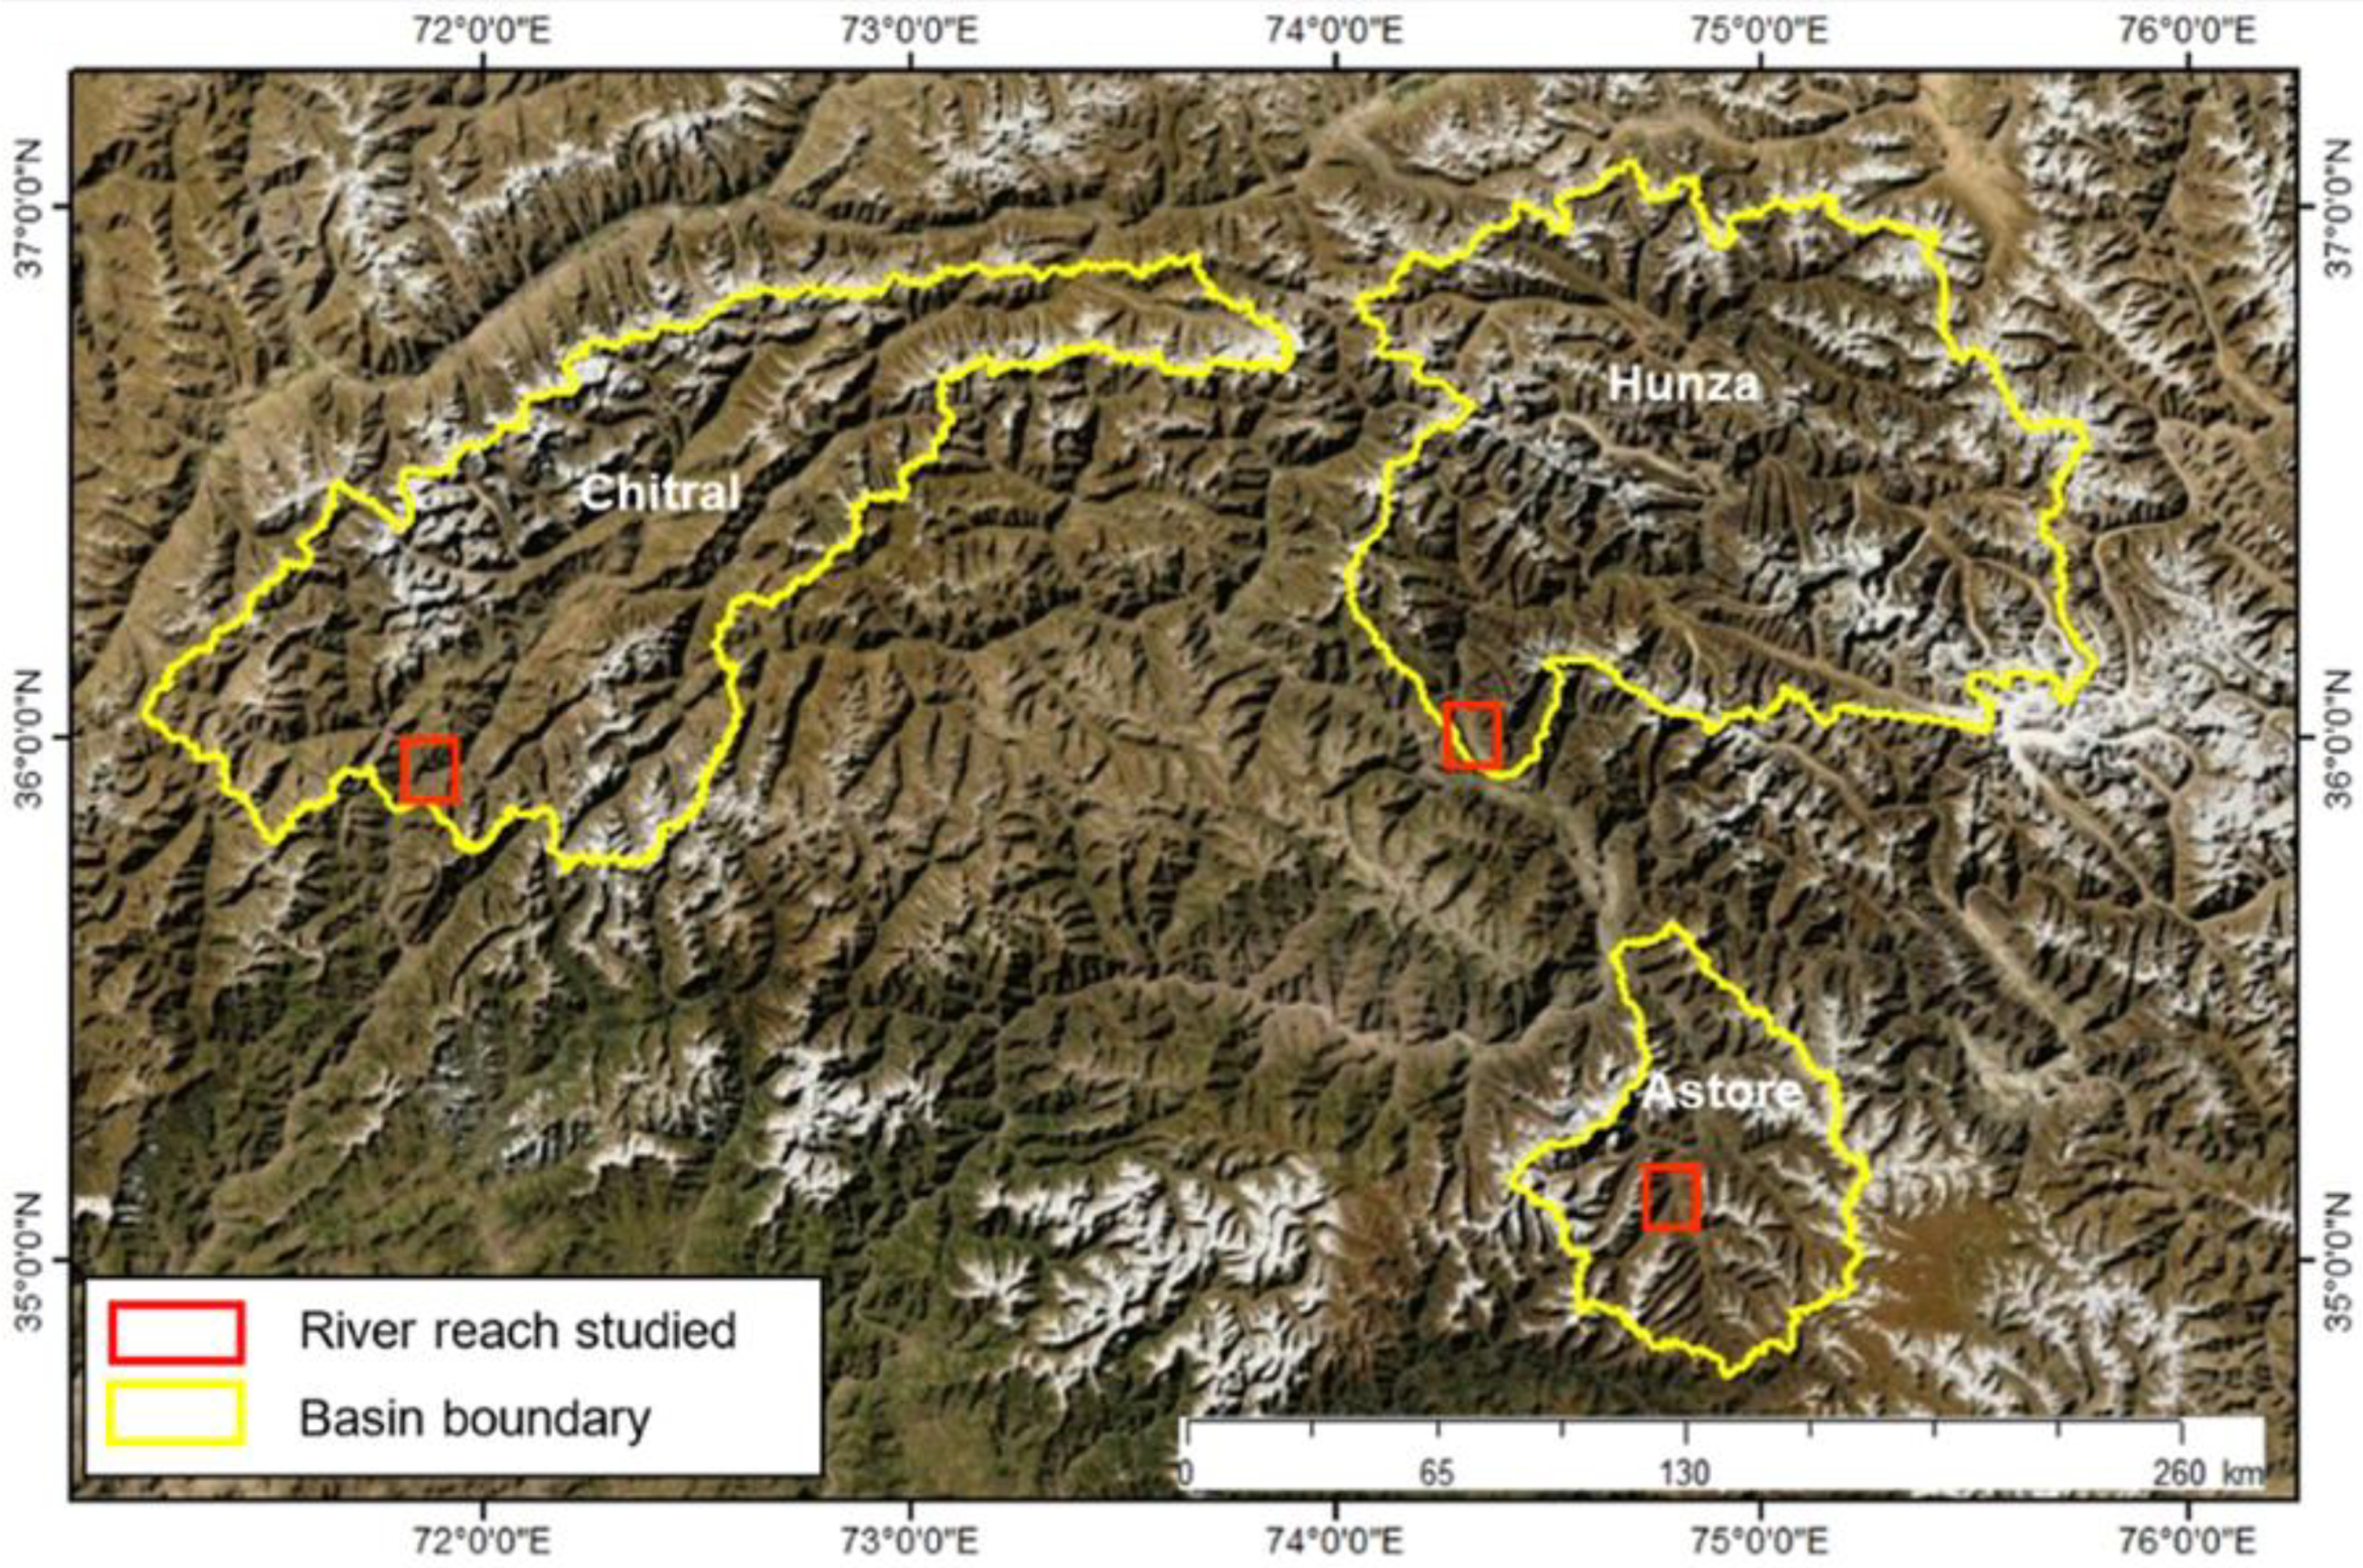
The study sites were chosen within Chitral (Hindukush range), Hunza (Karakoram range), and Astore (western Himalaya) in the UIB, as shown in Figure 1. These basins were selected because each one is influenced by a slightly different climate and is situated in different geographical portions of the UIB. Small regions, mostly containing settlements, within Chitral, Hunza, and Astore basins (Figure 1) were selected for the application of the model. The areas of these small regions within Chitral, Hunza, and Astore basins are 0.50, 0.96, and 0.83 km2, respectively. The basin boundaries and reach of the study areas mapped for flood are shown in Figure 1.
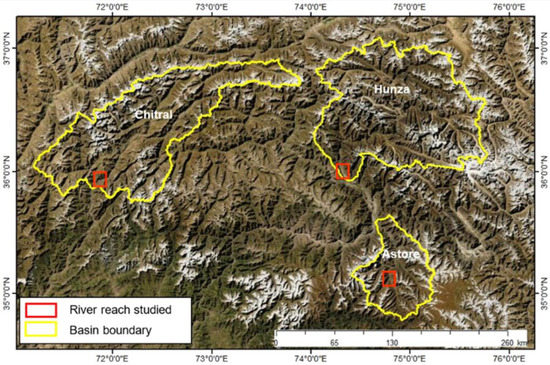
Figure 1.
Basin boundaries of three study basins fed into HEC-RAS. The mapped flood areas are shown in red boxes.
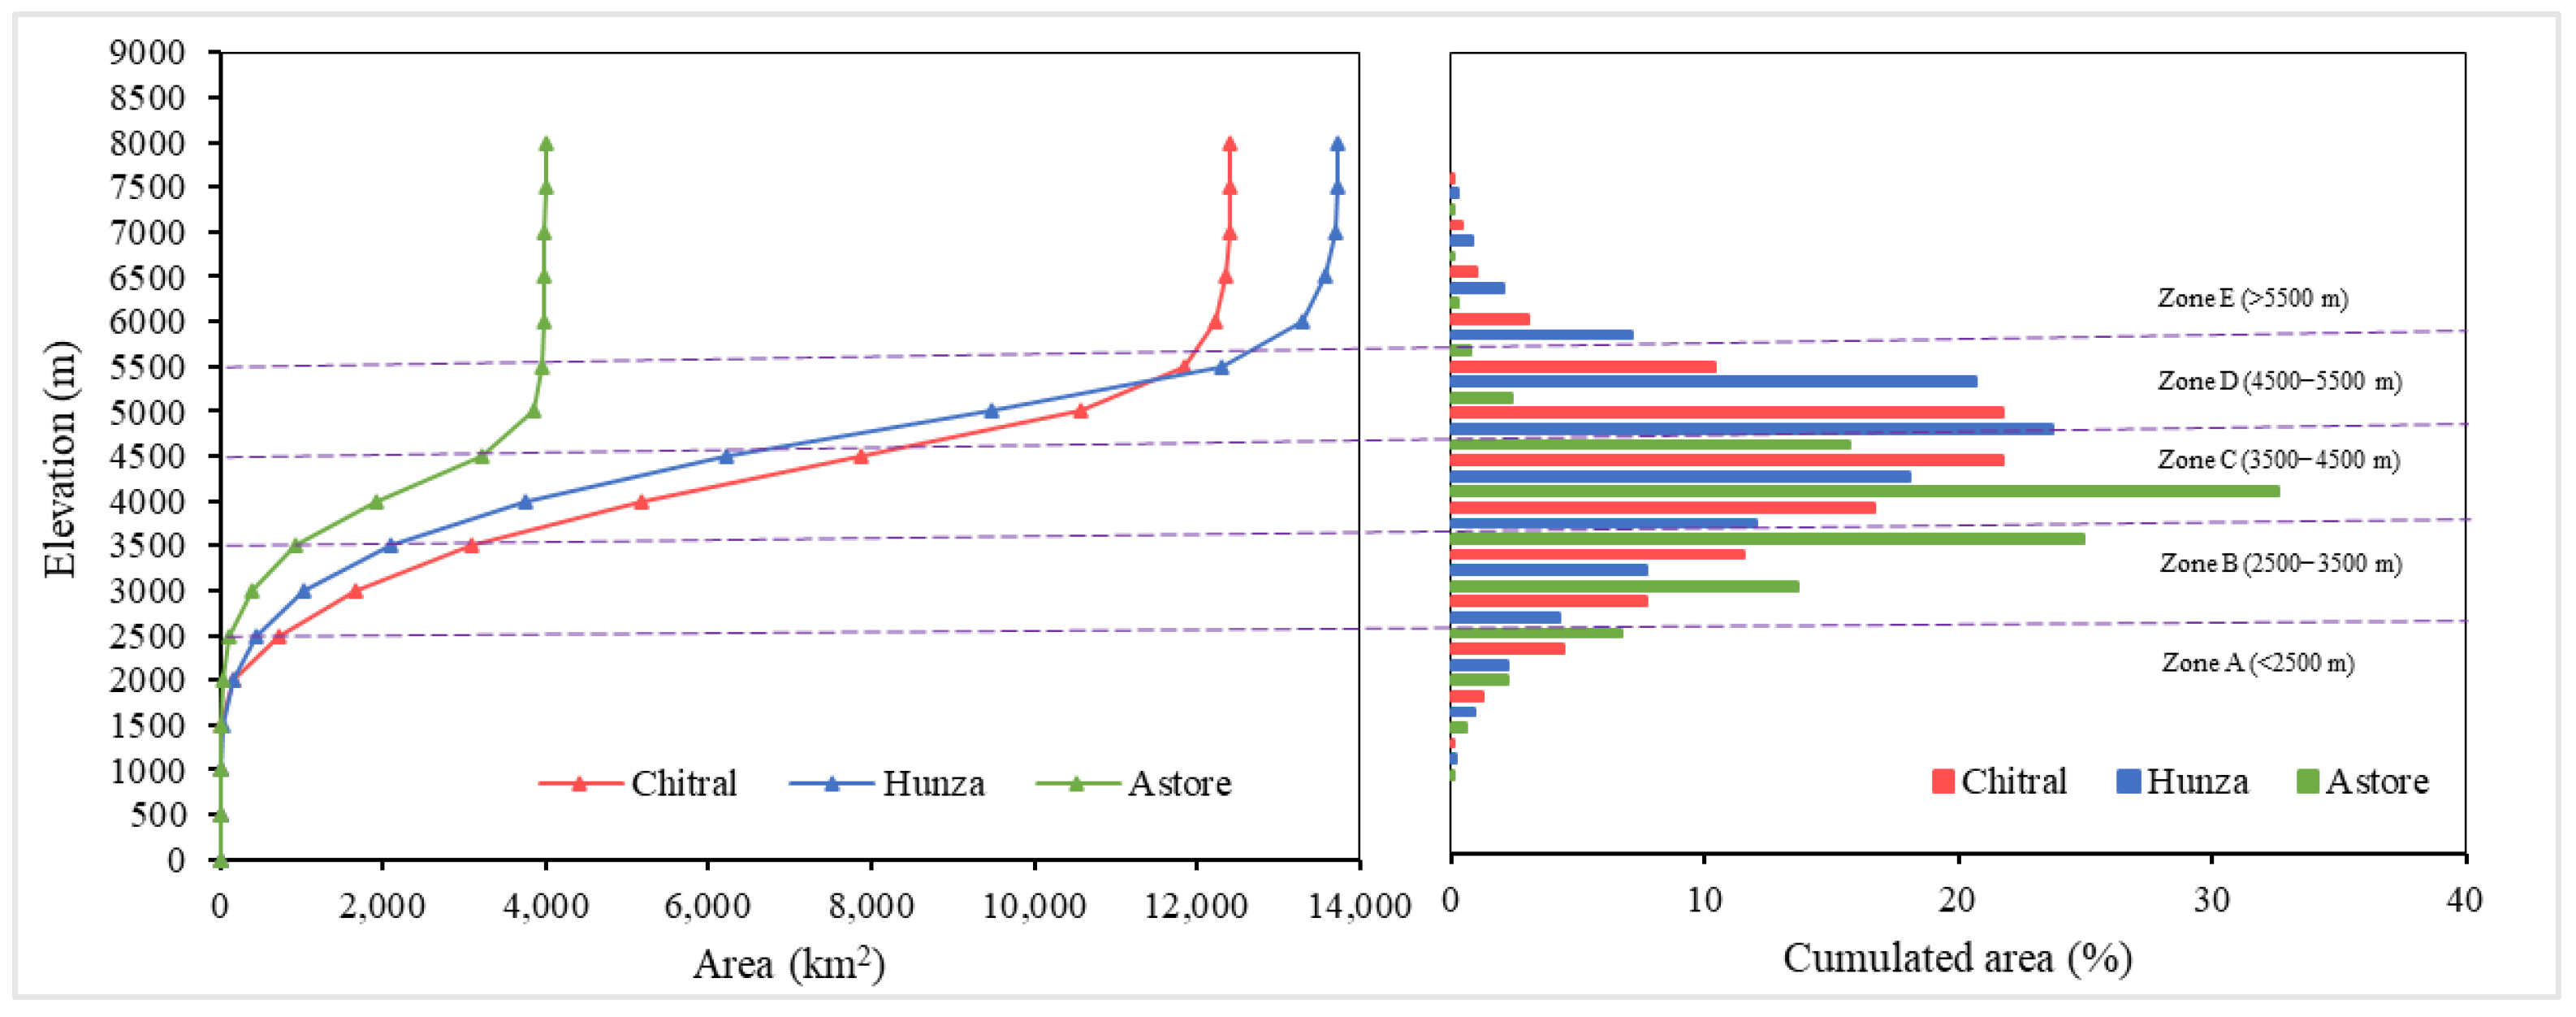
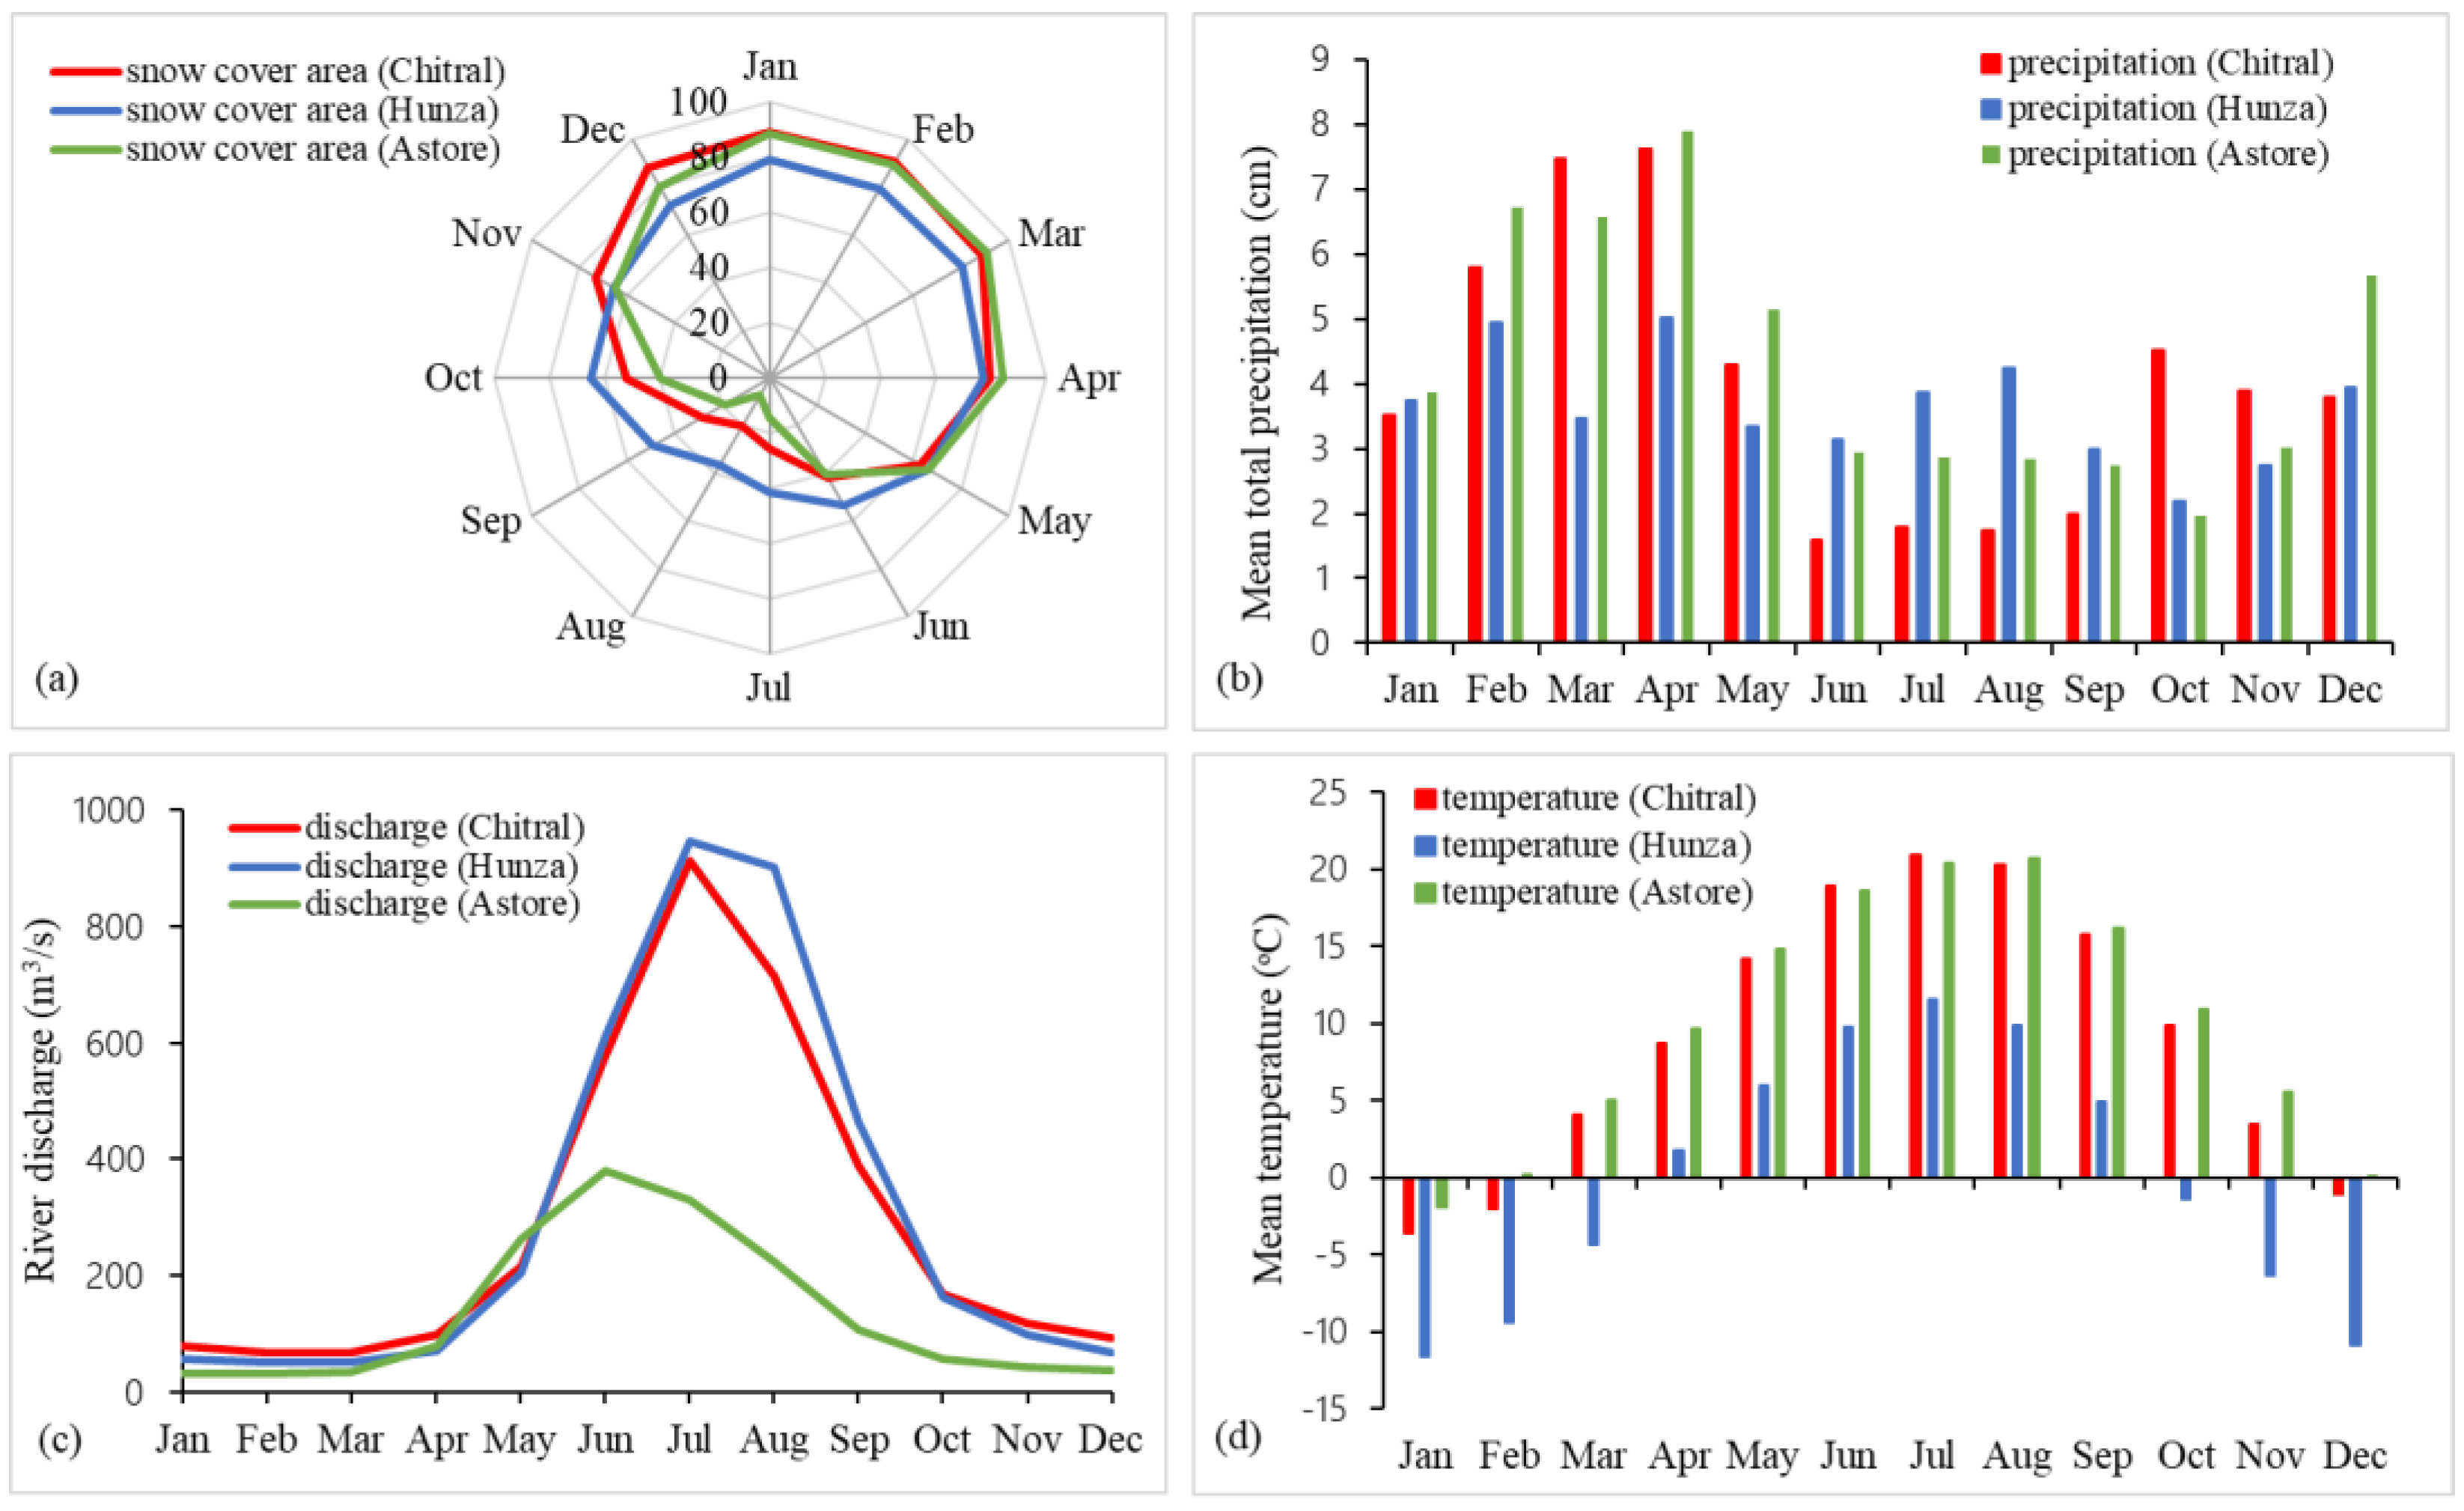
Chitral basin is located at latitude 35°50′ N and longitude 71°47′ E and covers an area of ~12390.48 km2 with a ~1988 km2 (16%) area above 5000 m A.S.L (Figure 2). Approximately 12.6% (~1563.025 km2) of this area is covered with glaciers. This region has a subtropical Mediterranean climate, influenced by the mid-latitudes westerly and the Southwest Asian summer monsoon. Its mean elevation is about ~4586 m ASL (estimated by DEM), and the highest gauging station is located at 1500 m A.S.L (Figure 2). The mean annual temperature of Chitral is 15.6 °C, and the total annual precipitation is 418 mm [57]. The mean annual flow of Chitral river is 291 m3/s (Figure 3).
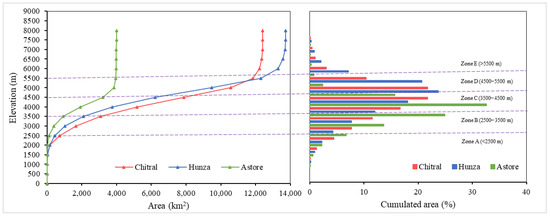
Figure 2.
Hypsometric curve and cumulated area at each elevation of Chitral, Hunza, and Astore estimated through the digital elevation model.
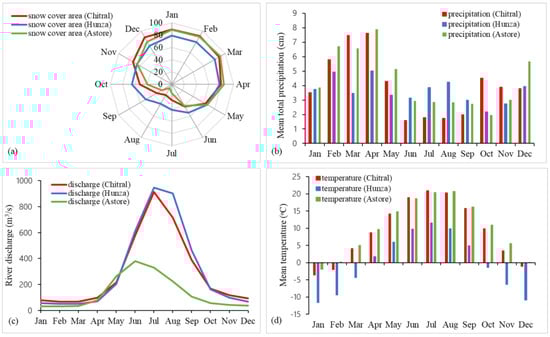
Figure 3.
(a) Mean snow cover area, (b) Mean total precipitation, (c) Mean monthly discharge, and (d) Mean monthly temperature of the study area.
The area of the Hunza basin is about 13,715 km2, and nearly its 25% (3433 km2) is covered with glaciers (Figure 2). Both Hunza and Astore basins are influenced by the westerlies and Indian summer monsoon [58,59,60]. In the Hunza basin, maximum precipitation is brought by westerlies in winter in the form of snow, with mean annual precipitation between 180 mm and 690 mm in the valleys. The mean annual discharge of Hunza river is 307 m3/s (Figure 3), while Astore is influenced by winter rainfall forced by westerlies [61], with a mean annual discharge of 135 m3/s.
The Astore basin is located at latitude 35°33′ N and longitude 74°42′ E and covers an area of 3990 km (Figure 1). The mean elevation is about 4100 m A.S.L., with maximum elevation reaching above 8000 m A.S.L (Figure 2). Approximately 15% (607 km2) of this area is covered with snow and glaciers [61]. The mean snow cover area, mean total precipitation, mean monthly discharge, and mean monthly temperature of the study area are shown in Figure 3.
The soils in this region are made of the accumulated colluvial material on lower parts of mountain slopes and alluvial deposits in valleys. The foothills of the mountains are used for growing wheat and maize under rainfed cultivation, while fruit orchards are present near streams where water for irrigation is available [62]. Hindukush, Karakoram, and Himalaya are young mountain ranges and are vulnerable to erosion and disintegration by chemical, physical, and biological processes. Continuous tectonic activity and high altitude combined with seasonal effects of the climatic conditions such as heavy snowfall, freezing and thawing, and action of glaciers produce high sediment in these mountain ranges [63,64]. Sediments are carried away and deposited in the major rivers with meltwater from snow and glacial ice, by debris flow, channel erosion during flash floods, and outburst floods from landslides and glacial lakes. The lower part of the mountain ranges receives heavy rainfall, and rivers in these ranges carry large amounts of sediments in flash floods. Among the tributaries of the Indus River, the Hunza river has the highest, while Chitral and Astore rivers have comparatively lower sediment flows [63,65]. A study reported the predominance of physical weathering in the release and dispersion of sediments in the Chitral basin due to the scarcity of moisture [66].
2.2. Data Sets
The Digital Elevation Model (DEM) is the most essential input data required for 2D models. Generally, the efficacy of 2D hydraulic models depends on the DEM used, because the correct topographical data influence the flood simulation results. Even though the basic input data ensures the accuracy of the model, such data are not freely available in high resolution. For accessing the topographical data required by the Digital Elevation Model, Advanced Land Observation Satellite (ALOS) 12.5 m data were used. Daily river flow data under RCP scenarios of the study area for 2000 (base year) were taken from our previous study on the simulation of river flow under the RCP scenarios published by IPCC for the HKH region [28,29]. Land use land cover (LULC) data were taken from the land cover atlas of Pakistan.
2.3. Flood Mapping Using the Hydrologic Engineering Centre-River Analysis System (HEC-RAS)
The HEC-RAS model was used for assessing and mapping the flood-prone areas within the study region under future river flows. HEC-RAS can perform 1D and 2D flood simulations using the St. Venant’s equation of Conservation of Mass and Conservation of Momentum along one and two dimensions, respectively [67]. In the case of flood, water starts to overflow and becomes a 2D phenomenon; therefore, 2D modeling becomes more suitable. It is more convenient to use it in urban settings, dam breaks, and wide floodplains. A 2D HEC-RAS model lays off a mesh on the terrain data provided. Then, 2D computations and terrain representation compute where the water will move and to what extent. Therefore, unlike 1D hydraulic models, all 2D models are run in unsteady flow conditions [68].
This study used the 2D capacity of HEC-RAS for developing floodplain maps of the study area. A flowchart of the methodology used is presented in Figure 4. The Digital Elevation Model (DEM) of the study area is a topographical map that includes terrain properties. The 12.5 m ALOS DEM was used to delineate the hydrographic network in the HEC-RAS version 5.0 for each basin. The geometry of the river reaches and the flow data are important parameters for flood mapping in HEC-RAS. The next step was the representation of the terrain, using RAS Mapper to view maps and data spatially. To create the geometry of the basin, a 2D flow area tool was used to draw a polygon, near the outlet of the basin, which defined the area selected for the simulation. The first boundary condition was drawn upstream, whereas second one was drawn downstream of the river. After defining the boundary conditions upstream and downstream of the river, computational points were generated with a grid size of 20 for both horizontal and vertical spacing. While low resolution yield faster simulations, smaller grid sizes represent the terrain better, but require a longer calculation time. Normal Depth was used for the downstream boundary condition, whereas Manning’s Roughness coefficients for the river reaches were assigned according to the HEC-RAS Hydraulic Reference Manual. A Flow Hydrograph was used for the upstream boundary. The Flow hydrograph window was filled using a fixed start time and introducing flow values for 2 months (June–July), as these months show the highest flow peaks. Unsteady flow was simulated using unsteady flow analysis. The results were accessed using RAS Mapper and visualized by activating velocity, WSE (Water Surface Elevation), geometry, and depth. The Google Earth image was added from Map layers of HEC-RAS to visualize the flood-prone and -affected areas around the river’s mapped area.
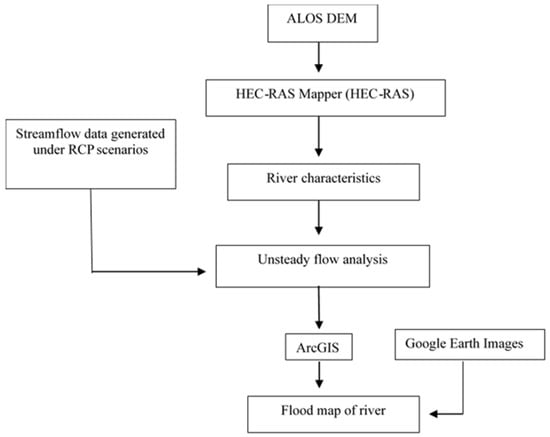
Figure 4.
Methodology flowchart for HEC-RAS mapping.
3. Results
HEC-RAS was used for generating floodplain maps for Chitral, Hunza, and Astore basins under RCP scenarios.
3.1. Flood Assessment and Mapping under Mid- and Late-21st Century RCP Scenarios
The flow simulated under RCP scenarios from all three basins [28,29] was used as input in flow conditions of the HEC-RAS model. A summary of the results is presented in Table 1.

Table 1.
Area flooded (%) within the studied portions of the three basins under RCP mid- and late-21st century scenarios.
The RCP mid- and late-21st century scenarios were applied to the simulated flow to compare it with the flow of the base year and create an inundation map of flood-prone areas. The results showed some overflow, when compared to the base year. The yellow color in the flood maps represents the areas affected due to flood, with depth ranging from 0 to 15 ft; light blue represents the minimum depth, and dark blue the maximum depth.
3.1.1. Flood Assessment and Mapping in Chitral Basin
The maximum runoff in the Chitral river was observed on 14 July and was 1123.30, 1154.60, and 1194.70 m3/s for RCP mid- (2.5, 4.5, and 8.5) and 1181.80, 1180.60, and 1309.50 m3/s for RCP late- (2.5, 4.5, and 8.5) 21st century scenarios. The underlying area of the Chitral river simulation is shown in Figure 5a. The results of RCP late 21st century showed greater flow depth and extent as compared to the flow simulated under mid-21st century scenarios (Figure 5).
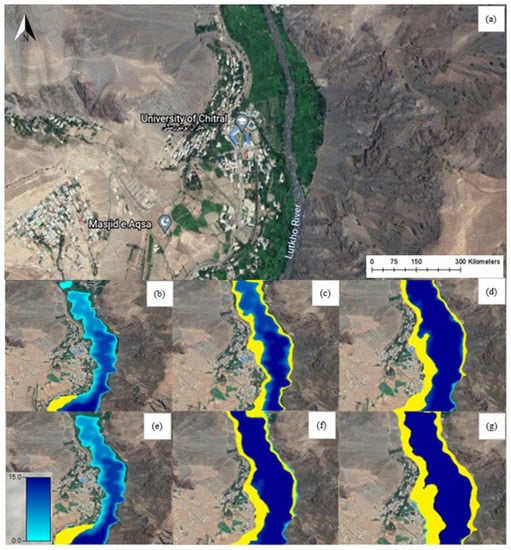
Figure 5.
(a) Chitral river reach showing the study area before mapping. Flood mapping of Chitral river under (b) mid-century 2.6, (c) mid-century 4.5, (d) mid-century 8.5, and (e) late-century 2.6, (f) late-century 4.5, (g) late-century 8.5, RCP scenarios. The yellow color in the Figures represents the regions/settlements affected by the flood.
The late RCP 8.5 generated a flood covering an area of 0.36 km2 (72%), which was largest compared to the inundated area under all other mid- and late-21st century scenarios; almost all nearby populated areas appeared vulnerable to it, as shown in Figure 5g. An approximate area of 0.04 (8%), 0.30 (60%), and 0.33 km2 (66%) was flooded under RCP mid-21st century scenarios (2.5, 4.5, and 8.5), while an area of 0.05 (10%), 0.32 (64%), and 0.36 km2 (72%) was flooded under RCP late- (2.5, 4.5 and 8.5) 21st century scenarios.
3.1.2. Flood Assessment and Mapping in Hunza Basin
In Hunza river, the maximum runoff was observed on 3 August and was 1606.30, 1681.3, 1771.80 m3/s for RCP mid- (2.5, 4.5, and 8.5) and 1585.60, 1745.90, 2058.20 m3/s for RCP late- (2.5, 4.5, and 8.5) 21st century scenarios. The affected area of the Hunza river simulation is shown in Figure 6a. The late RCP 8.5 generated a flood covering an area of 3.67 km2 (93%), which was the largest compared to inundated areas under all other mid- and late-21st century scenarios (Figure 6).
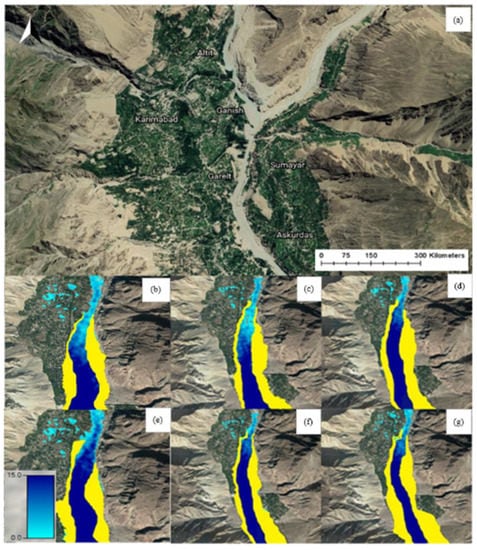
Figure 6.
(a) Hunza river reach showing the affected area before mapping. Flood mapping of Hunza river under (b) mid-century 2.6, (c) mid-century 4.5, (d) mid-century 8.5, and (e) late-century 2.6, (f) late-century 4.5, (g) late-century 8.5, RCP scenarios. The yellow color in the Figures represents the regions/settlements affected by the flood.
Approximate areas of 0.86 (4%), 2.50 (22%), and 3.39 km2 (86%) were flooded under RCP mid-21st century scenarios (2.5, 4.5, and 8.5) and areas of 2.13 (54%), 3.14 (79%), and 3.67 km2 (93%) were flooded under RCP late- (2.5, 4.5 and 8.5) 21st century scenarios in Hunza basin.
3.1.3. Flood Assessment and Mapping in Astore Basin
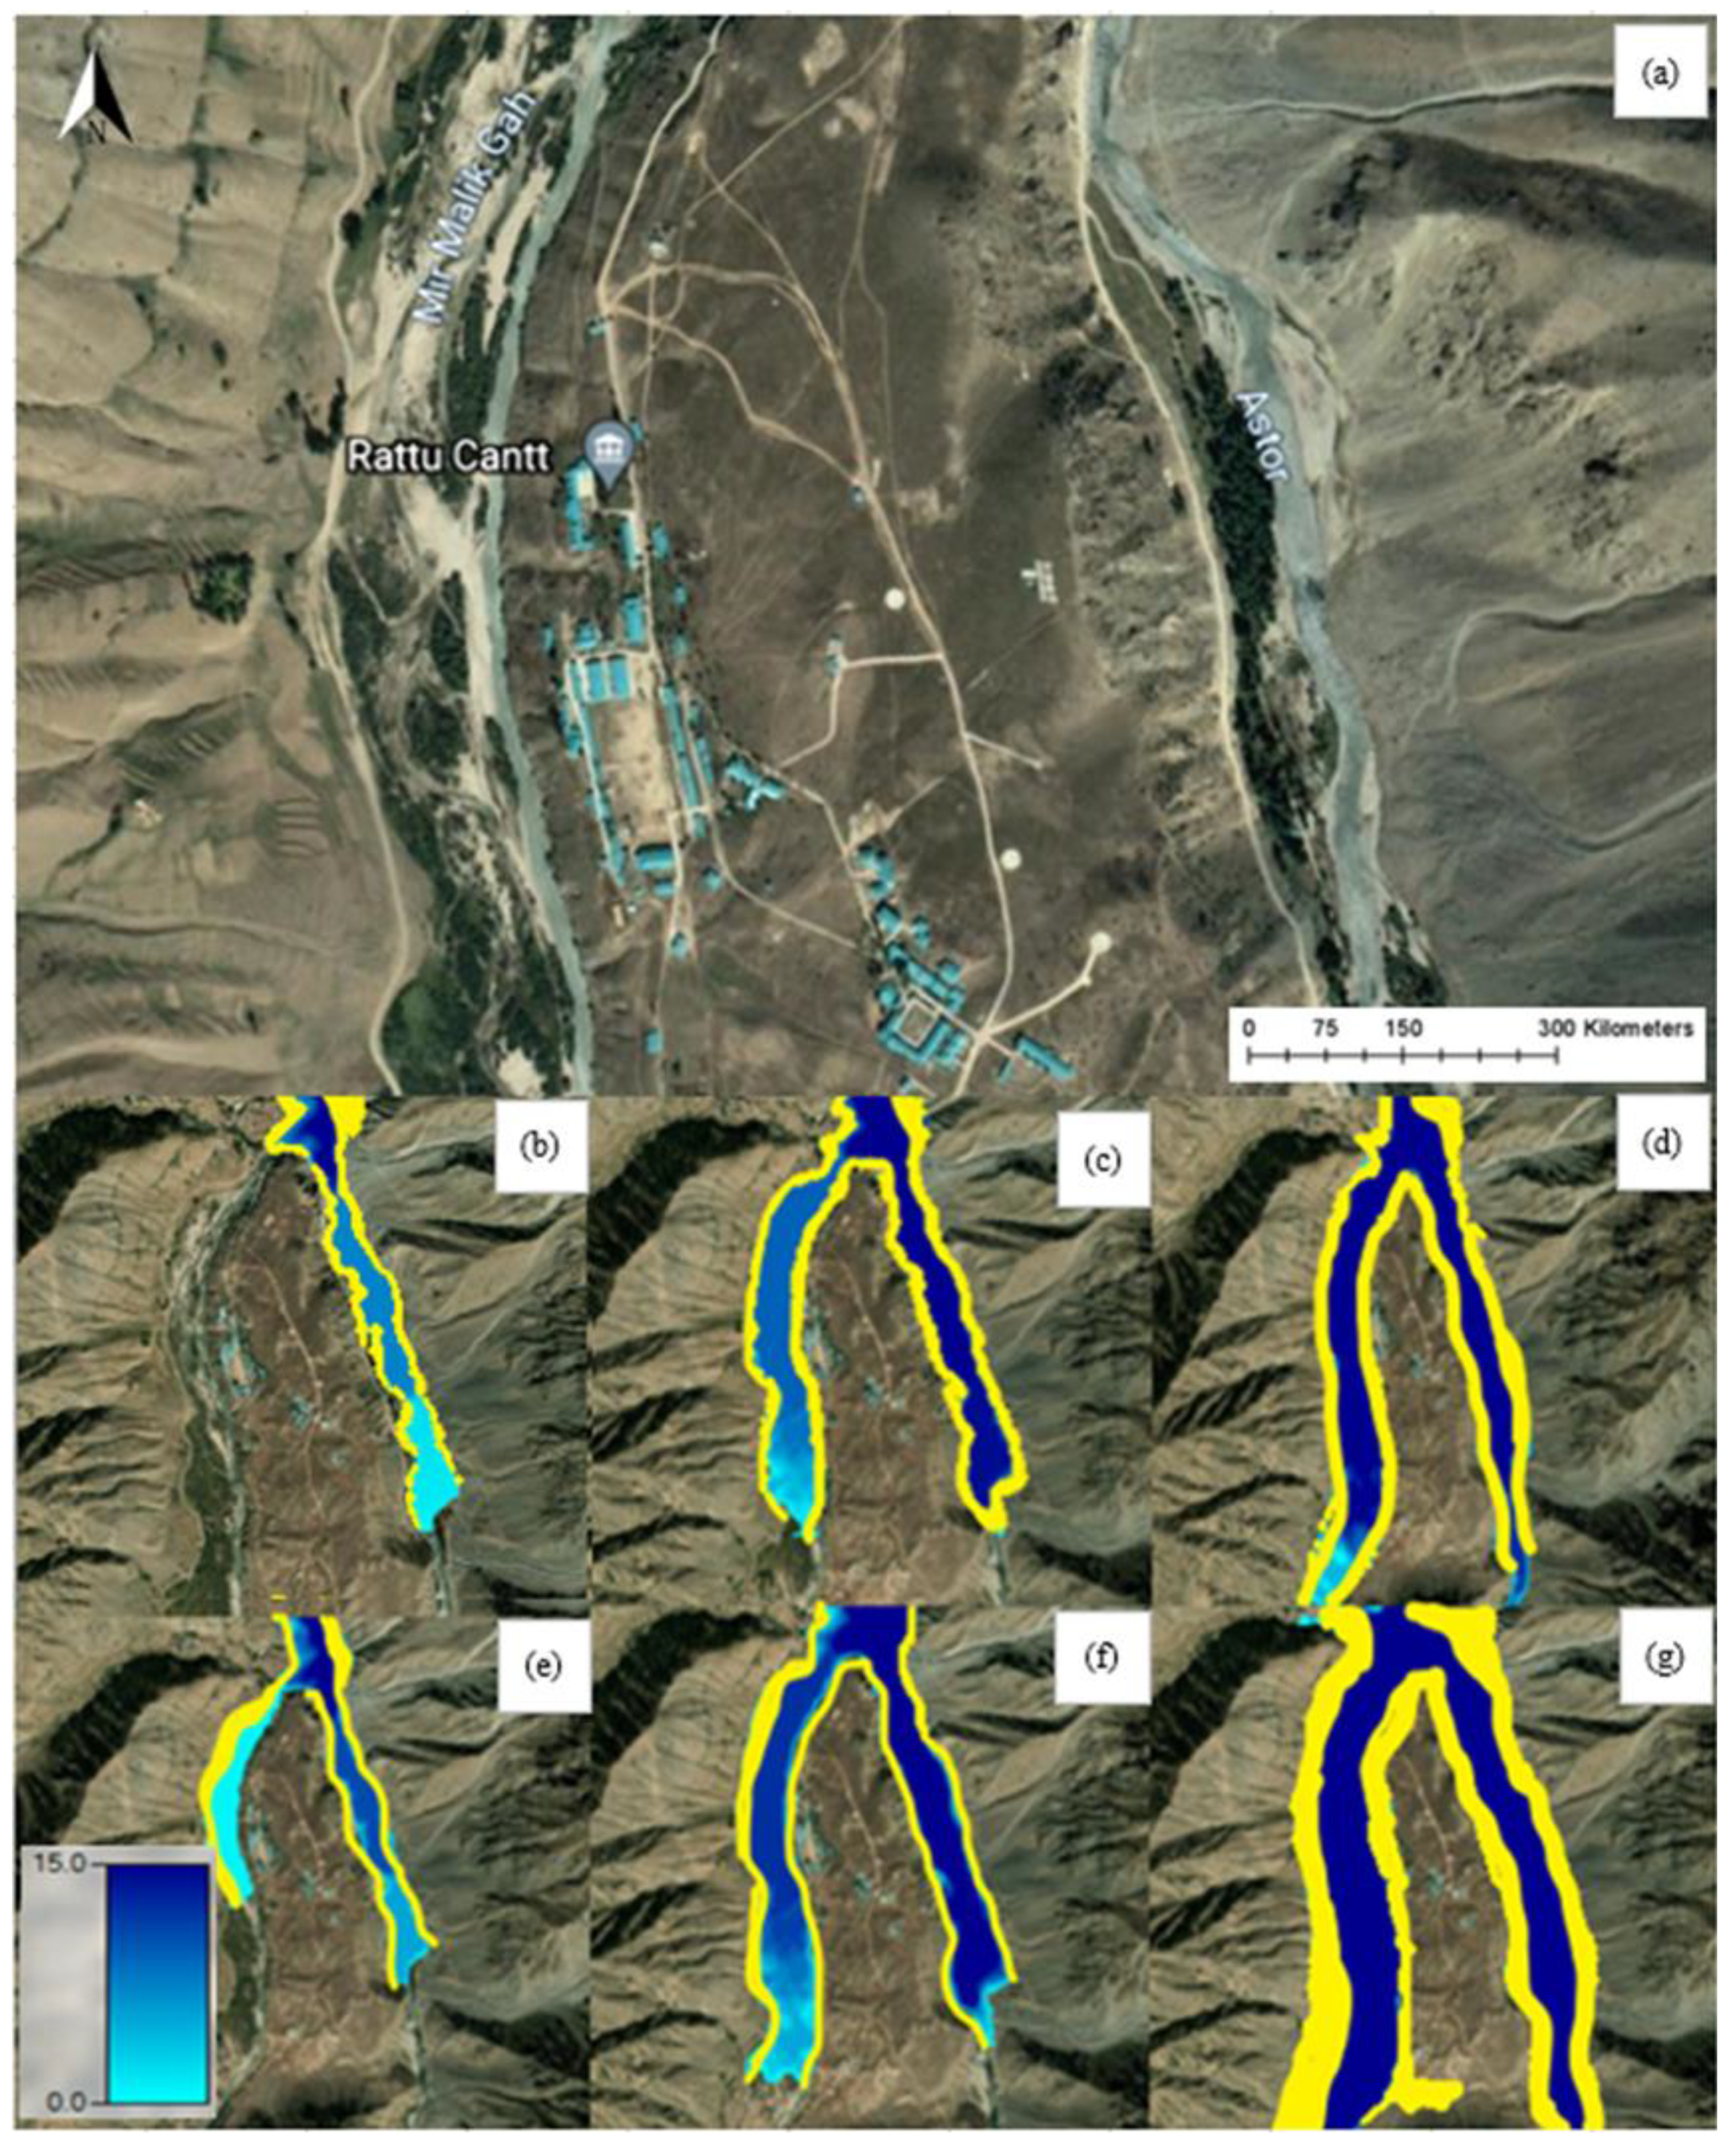
Maximum runoff was observed on 7 August in the Astore river and was 513.20, 538.8, and 1099.50, m3/s for RCP mid- (2.5, 4.5, and 8.5) and 509.30, 558.80, and 1288.20 m3/s for RCP late- (2.5, 4.5, and 8.5) 21st century scenarios. The affected area of the Astore river simulation is shown in Figure 7a. The highest flow was recorded under the late 8.5 scenario with respect to all other scenarios (Figure 7).

Figure 7.
(a) Astore river reach showing the affected area before mapping. Flood mapping of Astore river under (b) mid-century 2.6, (c) mid-century 4.5, (d) mid-century 8.5, and (e) late-century 2.6, (f) late-century 4.5, (g) late-century 8.5, RCP scenarios. The yellow color in the Figures represents the regions/settlements affected by the flood.
With the increase in temperature and precipitation in the different scenarios, the depth of the flood also increased. An area of 0.49 km2 (59%) appeared to be vulnerable to flood for late 8.5, as compared to other scenarios. In Astore, an approximate area of 0.05 (6%), 0.12 (14%), and 0.31 km2 (37%) was flooded under RCP mid-21st century scenarios (2.5, 4.5, and 8.5), and area of approximately 0.12 (14%), 0.18 (21%), and 0.49 km2 (59%) were flooded under RCP late- (2.5, 4.5, and 8.5) 21st century scenarios.
4. Discussion
Based on the results obtained, it was observed that an increase in river discharge under mid- and late-21st century RCPs would result from an increase in temperature and precipitation. Increasing precipitation augments snow and glacial ice, while increasing temperature increases snow and glacial melt, resulting in an increase in river discharge [45,69]. The flood generated by the RCP 2.6 was of less depth and extent as compared to that generated by RCP 4.5, which was less than that of RCP 8.5 for both mid as well as late 21st century. More structures (houses, hotels, institutions, and fields) appeared vulnerable to flood in the case of RCP 8.5, as compared to RCP 4.5, which involved more vulnerable structures than RCP 2.6. These findings can help policymakers to plan and prevent damages to the society and economy of Pakistan through effective natural disaster management practices. The Intergovernmental Panel on Climate Change (IPCC)’s report of 2013, reported a 0.85 °C increase in the global temperature from 1880 and projected an increase of 3.7 °C at the end of the 21st century [52]. A study [70] investigated the impact of climate change on precipitation and flood using 24 daily precipitation simulations from the Coupled Model Intercomparison Project Phase 5 (CMIP533) GCMs regarding the period of 1971–2000 and the future period of 2070–2099 under the Representative Concentration Pathway (RCP) 8.5 scenario. The results showed an increase in precipitation and frequency of floods in all climatic regions. RCP climate scenarios presented by IPCC for the Indus River Basin (IRB) are useful to assess the river flow [51,71,72].
In a similar study [73], the authors performed flood hydraulic modeling and floodplain mapping for the Chashma–Taunsa (252 km) reach of the Indus basin. HEC-RAS, ArcGIS, and its extension Hec-GeoRas were used for hydraulic modeling and mapping of floodplains. Flood maps show that the depth of the flooded area has increased from 7.1 m to 9.1 m over 25 years, with 500 floods over the return period. A study used HEC-RAS to develop floodplain maps for a certain reach of the Kabul River in Pakistan. SRTM DEM was used for preparing geometrical data of the river [2]. The highest flows from frequency analysis were used as input data into HEC-RAS to estimate the corresponding flood levels expected along river reaches. The interpretation of floodplain maps suggested that more than 400% of the area, predominantly agricultural, is susceptible floods, contrary to normal river discharge.
The China–Pakistan Economic Corridor (CPEC), a joint project of China and Pakistan, passes through the Hunza basin in Pakistan. Hunza has many surging glaciers which create glacial lakes [74]. Such glacial lakes are used for freshwater but are extremely dangerous when their dams are breached, resulting in glacier lake outburst floods and flash floods. Since the route passes through a flood- and other hazard-prone area, GLOFs and flash floods should be considered in the CPEC policy formulation. This would be helpful, as the Government may take concrete steps in the mitigation and prevention of floods. Another study stressed the usefulness of inundation maps for flood preparedness, immediate response to future floods, assessment of damage, mitigation, and flood risk analysis [75]. Tools like HEC-RAS along with experience and skills can provide important guidelines for policymakers, helping them to elaborate plans to respond, mitigate, and manage future floods.
5. Conclusions
Flood hazard mapping of snow and glacier melt mountainous basins is important for flood mitigation and preparedness to floods as it allows identifying the vulnerability of a place and its community. The HEC-RAS model was used in order to develop a flood map of the study area and assess flood risk under mid- and late-21st century RCP scenarios. The results of this study indicated that:
- Floods of mid- as well as late-21st century RCP 8.5 are predicted to have greatest depth and velocity, so will lead to more devastating inundations as compared to floods of mid- and late-21st century RCP 2.6 and 4.5.
- Under the RCP 8.5 late-21st century scenario, a peak flood was simulated covering an area of ~72, ~93, and ~59% of the studied reaches within Chitral, Hunza, and Astore river basins, respectively.
- Flood simulation and GIS can be used effectively to develop flood management strategies. The digitization of floods under RCP scenarios can help develop plans to minimize and prevent damage from annual flooding.
High-resolution satellite images incorporated with terrain information should be used effectively for continuous monitoring of flood-prone areas to mitigate the risk of floods in the future. Given the frequent nature of floods in Pakistan, there is a pressing demand to develop a robust flood mitigation plan. Other than structural flood mitigation measures, nonstructural measures such as awareness campaigns, natural disaster management, early warning systems, and flood forecasting are likely to be very productive for the mitigation of the direct and indirect impacts of floods.
Author Contributions
Conceptualization, A.A.T., H.H.; methodology, H.H.; investigation, H.H.; writing— H.H.; original draft preparation A.A.T., H.H.; writing—review and editing, A.A.T., H.H., M.S., M.A., S.L., S.M., R.K.; visualization, A.A.T., H.H.; supervision, A.A.T.; project administration, A.A.T., H.H.; funding acquisition, S.L. All authors have read and agreed to the published version of the manuscript.
Funding
This research was supported by a joint Research fund of the National Natural Science Foundation of China and the International Center for Integrated Mountain Development NSFC-ICIMOD (Grant No. 41761144075).
Institutional Review Board Statement
Not applicable.
Informed Consent Statement
Not applicable.
Acknowledgments
The authors extend their gratitude to the Water and Power Development Authority (WAPDA) for sharing the hydrological data.
Conflicts of Interest
The authors declare no conflict of interest.
References
- Ahmad, F.; Kazmi, S.; Pervez, T. Human response to hydro-meteorological disasters: A case study of the 2010 flash floods in Pakistan. J. Geogr. Reg. Plan. 2011, 4, 518–524. [Google Scholar]
- Khattak, M.S.; Anwar, F.; Saeed, T.U.; Sharif, M.; Sheraz, K.; Ahmed, A. Floodplain Mapping Using HEC-RAS and ArcGIS: A Case Study of Kabul River. Arab. J. Sci. Eng. 2016, 41, 1375–1390. [Google Scholar] [CrossRef]
- Rind, M.A.; Ansari, K.; Saher, R.; Shakya, S.; Ahmad, S. 2D Hydrodynamic Model for Flood Vulnerability Assessment of Lower Indus River Basin, Pakistan. In Proceedings of the World Environmental and Water Resources Congress, Minneapolis, MN, USA, 3–7 June 2018; pp. 468–482. [Google Scholar]
- Tariq, M.; van de Giesen, N. Floods and flood management in Pakistan. Phys. Chem. Earth 2012, 47–48, 11–20. [Google Scholar] [CrossRef]
- Hashmi, H.; Siddiqui, Q.; Ghumman, A.R.; Ahmed Kamal, M.; Mughal, H.-U.-R. A critical analysis of 2010 floods in Pakistan. Afr. J. Agric. Res. 2012, 7, 1054–1067. [Google Scholar]
- Iqbal, M.S.; Dahri, Z.H.; Querner, E.P.; Khan, A.; Hofstra, N. Impact of Climate Change on Flood Frequency and Intensity in the Kabul River Basin. Geosciences 2018, 8, 114. [Google Scholar] [CrossRef] [Green Version]
- Looney, R. Economic impacts of the floods in Pakistan. Contemp. South Asia 2012, 20, 225–241. [Google Scholar] [CrossRef]
- Schrier, G.M.; Rasmijn, L.; Barkmeijer, J.; Sterl, A.; Hazeleger, W. The 2010 Pakistan floods in a future climate. Clim. Chang. 2018, 148, 205–218. [Google Scholar] [CrossRef]
- Spreafico, M. Flash floods in mountain areas. In Proceedings of the Fifth FRIEND World Conference, Havana, Cuba, 27 November–1 December 2006; International Association of Hydrological Sciences: Havana, Cuba, 2006. [Google Scholar]
- Panagoulia, D.; Panagopoulos, Y. Snow cover distribution over elevation zones in a mountainous catchment. In Proceedings of the EGU General Assembly, Geophysical Research Abstracts, Vienna, Austria, 19–24 April 2009; Volume 11. [Google Scholar]
- Tekeli, A.E.; Akyürek, Z.; Sorman, A.U.; Sensoy, A. Using MODIS snow cover maps in modeling snowmelt runoff process in the eastern part of Turkey. Remote Sens. Environ. 2005, 97, 216–230. [Google Scholar] [CrossRef]
- Ashraf, A.; Roohi, R.; Naz, R.; Mustafa, N. Monitoring cryosphere and associated flood hazards in high mountain ranges of Pakistan using remote sensing technique. Nat. Hazards 2014, 73, 933–949. [Google Scholar] [CrossRef]
- PDMA. Chitral Floods 2015 Recovery needs Assessment and Action Framework; Provincial Disaster Management Authority: Peshawar, Pakistan, 2015.
- 70 People Rescued in Flood-Hit Chitral Area. Dawn. Available online: https://www.dawn.com/news/1493136(accessed on 10 July 2019).
- Ashraf, A.; Naz, R.; Roohi, R. Glacial lake outburst flood hazards in Hindukush, Karakoram and Himalayan Ranges of Pakistan: Implications and risk analysis. Geomat. Nat. Hazards Risk 2012, 3, 113–132. [Google Scholar] [CrossRef] [Green Version]
- Jilani, R.; Haq, M.; Rahman, S.; Munir, S.; Farooq, U.; Sidiqui, P.; Muhammad, S. A case study of river Hunza flooding in Hunza valley-Pakistan. In Proceedings of the 4th PI Symposium of JAXA, Kyoto, Japan, 15–17 November 2010. [Google Scholar]
- Floods Sweep away Mosque, Houses in Astore. Dawn. Available online: https://www.dawn.com/news/98339/floods-sweep-away-mosque-houses-in-astore(accessed on 25 April 2003).
- Abbas, S.; Khan, A. Socioeconomic impacts of natural disasters: Implication for flood risk measurement in Damas valley, District Ghizer, Gilgit-Baltistan, Pakistan. Pak. Geogr. Rev. 2020, 75, 71–83. [Google Scholar]
- Rana, I.A.; Routray, J.K. Socioeconomic Vulnerability Assessment: A Case Study of Flood Prone Urban Communities of Pakistan. Integr. Res. Disaster Risks 2020, 123–139. [Google Scholar] [CrossRef]
- Salman, A.M.; Li, Y. Flood Risk Assessment, Future Trend Modeling, and Risk Communication: A Review of Ongoing Research. Nat. Hazards Rev. 2018, 19, 04018011. [Google Scholar] [CrossRef]
- Ardıçlıoğlu, M.; Kuriqi, A. Calibration of channel roughness in intermittent rivers using HEC-RAS model: Case of Sarimsakli creek, Turkey. SN Appl. Sci. 2019, 1, 1080. [Google Scholar] [CrossRef] [Green Version]
- Bennett, T.H.; Walton, R.; Dickerson, P.D.; Howard, J.W. Comparison of HEC-RAS and MIKE11 Unsteady Flow Modeling for the Tillamook Valley. Crit. Transit. Water Environ. Resour. Manag. 2004, 1–8. [Google Scholar] [CrossRef]
- Farooq, M.; Shafique, M.; Khattak, M.S. Flood hazard assessment and mapping of River Swat using HEC-RAS 2D model and high-resolution 12-m TanDEM-X DEM (WorldDEM). Nat. Hazards 2019, 97, 477–492. [Google Scholar] [CrossRef]
- Quirogaa, V.M.; Kurea, S.; Udoa, K.; Manoa, A. Application of 2D numerical simulation for the analysis of the February 2014 Bolivian Amazonia flood: Application of the new HEC-RAS version 5. Ribagua 2016, 3, 25–33. [Google Scholar] [CrossRef] [Green Version]
- Vozinaki, A.-E.K.; Morianou, G.G.; Alexakis, D.; Tsanis, I.K. Comparing 1D and combined 1D/2D hydraulic simulations using high-resolution topographic data: A case study of the Koiliaris basin, Greece. Hydrol. Sci. J. 2016, 62, 642–656. [Google Scholar] [CrossRef]
- Panagoulia, D. Hydrological modelling of a medium-size mountainous catchment from incomplete meteorological data. J. Hydrol. 1992, 137, 279–310. [Google Scholar] [CrossRef]
- Gul, J.; Muhammad, S.; Liu, S.-y.; Ullah, S.; Ahmad, S.; Hayat, H.; Tahir, A.A. Spatio-temporal changes in the six major glaciers of the Chitral River basin (Hindukush Region of Pakistan) between 2001 and 2018. J. Mt. Sci. 2020, 17, 572–587. [Google Scholar] [CrossRef]
- Hayat, H.; Akbar, T.A.; Tahir, A.A.; Hassan, Q.K.; Dewan, A.; Irshad, M. Simulating Current and Future River-Flows in the Karakoram and Himalayan Regions of Pakistan Using Snowmelt-Runoff Model and RCP Scenarios. Water 2019, 11, 761. [Google Scholar] [CrossRef] [Green Version]
- Hayat, H.; Tahir, A.A.; Wajid, S.; Abbassi, A.M.; Zubair, F.; Hashmi, Z.U.R.; Khan, A.; Khan, A.J.; Irshad, M. Simulation of the meltwater under different climate change scenarios in a poorly gauged snow and glacier-fed Chitral River catchment (Hindukush region). Geocarto Int. 2019, 1–17. [Google Scholar] [CrossRef]
- Muhammad, S.; Tian, L.; Nüsser, M. No significant mass loss in the glaciers of Astore Basin (North-Western Himalaya), between 1999 and 2016. J. Glaciol. 2019, 65, 270–278. [Google Scholar] [CrossRef] [Green Version]
- Racoviteanu, A.; Rittger, K.; Armstrong, R. An Automated Approach for Estimating Snowline Altitudes in the Karakoram and Eastern Himalaya from Remote Sensing. Front. Earth Sci. 2019, 7. [Google Scholar] [CrossRef] [Green Version]
- Domeneghetti, A.; Schumann, G.J.-P.; Tarpanelli, A. Preface: Remote Sensing for Flood Mapping and Monitoring of Flood Dynamics. Remote Sens. 2019, 11, 943. [Google Scholar] [CrossRef] [Green Version]
- Alaghmand, S.; Bin Abdullah, R.; Abustan, I.; Eslamian, S. Comparison between capabilities of HEC-RAS and MIKE11 hydraulic models in river flood risk modelling (a case study of Sungai Kayu Ara River basin, Malaysia). Int. J. Hydrol. Sci. Technol. 2012, 2, 270. [Google Scholar] [CrossRef]
- Duan, Y.; Liu, T.; Meng, F.; Luo, M.; Frankl, A.; De Maeyer, P.; Bao, A.; Kurban, A.; Feng, X. Inclusion of Modified Snow Melting and Flood Processes in the SWAT Model. Water 2018, 10, 1715. [Google Scholar] [CrossRef] [Green Version]
- Carling, P.; Villanueva, I.; Herget, J.; Wright, N.; Borodavko, P.; Morvan, H. Unsteady 1D and 2D hydraulic models with ice dam break for Quaternary megaflood, Altai Mountains, southern Siberia. Glob. Planet. Chang. 2010, 70, 24–34. [Google Scholar] [CrossRef]
- Greenbaum, N.; Schwartz, U.; Bergman, N. Extreme floods and short-term hydroclimatological fluctuations in the hyper-arid Dead Sea region, Israel. Glob. Planet. Chang. 2010, 70, 125–137. [Google Scholar] [CrossRef]
- Horritt, M.; Bates, P. Evaluation of 1D and 2D numerical models for predicting river flood inundation. J. Hydrol. 2002, 268, 87–99. [Google Scholar] [CrossRef]
- Knebl, M.; Yang, Z.-L.; Hutchison, K.; Maidment, D. Regional scale flood modeling using NEXRAD rainfall, GIS, and HEC-HMS/RAS: A case study for the San Antonio River Basin Summer 2002 storm event. J. Environ. Manag. 2005, 75, 325–336. [Google Scholar] [CrossRef]
- Koutroulis, A.; Tsanis, I.K. A method for estimating flash flood peak discharge in a poorly gauged basin: Case study for the 13–14 January 1994 flood, Giofiros basin, Crete, Greece. J. Hydrol. 2010, 385, 150–164. [Google Scholar] [CrossRef]
- Pappenberger, F.; Beven, K.J.; Ratto, M.; Matgen, P. Multi-method global sensitivity analysis of flood inundation models. Adv. Water Resour. 2008, 31, 1–14. [Google Scholar] [CrossRef]
- Pinar, E.; Paydas, K.; Seckin, G.; Akilli, H.; Sahin, B.; Cobaner, M.; Kocaman, S.; Akar, M. Artificial neural network approaches for prediction of backwater through arched bridge constrictions. Adv. Eng. Softw. 2010, 41, 627–635. [Google Scholar] [CrossRef]
- Rivera, S.; Hernandez, A.; Ramsey, R.; Suarez, G.; Rodriguez, S.A. Predicting flood hazard areas: A SWAT and HEC-RAS simulations conducted in aguan river basin of Honduras, Central America. In Proceedings of the ASPRS 2007 Annual Conference; Tampa, FL, USA, 7–11 May 2007.
- Rodriguez, L.B.; Cello, P.A.; Vionnet, C.A.; Goodrich, D. Fully conservative coupling of HEC-RAS with MODFLOW to simulate stream–aquifer interactions in a drainage basin. J. Hydrol. 2008, 353, 129–142. [Google Scholar] [CrossRef]
- ShahiriParsa, A.; Heydari, M.; Sadeghian, M.S.; Moharrampour, M. Flood Zoning Simulation By Hec-Ras Model (Case Study: Johor River-Kota Tinggi Region). J. River Eng. 2015, 1. [Google Scholar] [CrossRef]
- Shrestha, S.; Lohpaisankrit, W. Flood hazard assessment under climate change scenarios in the Yang River Basin, Thailand. Int. J. Sustain. Built Environ. 2017, 6, 285–298. [Google Scholar] [CrossRef] [Green Version]
- Goodell, C.; Warren, C. Flood inundation mapping using HEC-RAS. Obras y Proyectos 2006. [Google Scholar] [CrossRef]
- Ullah, S.; Farooq, M.; Sarwar, T.; Tareen, M.J.; Wahid, M.A. Flood modeling and simulations using hydrodynamic model and ASTER DEM—A case study of Kalpani River. Arab. J. Geosci. 2016, 9, 1–11. [Google Scholar] [CrossRef]
- Pasquier, U.; He, Y.; Hooton, S.; Goulden, M.; Hiscock, K.M. An integrated 1D–2D hydraulic modelling approach to assess the sensitivity of a coastal region to compound flooding hazard under climate change. Nat. Hazards 2018, 98, 915–937. [Google Scholar] [CrossRef] [Green Version]
- Dasallas, L.; Kim, Y.; An, H. Case Study of HEC-RAS 1D–2D Coupling Simulation: 2002 Baeksan Flood Event in Korea. Water 2019, 11, 2048. [Google Scholar] [CrossRef] [Green Version]
- Abdessamed, D.; Bouanani, A. Coupling HEC-RAS and HEC-HMS in rainfall–runoff modeling and evaluating floodplain inundation maps in arid environments: Case study of Ain Sefra city, Ksour Mountain. SW of Algeria. Environ. Earth Sci. 2019, 78, 586. [Google Scholar] [CrossRef]
- Nyaupane, N.; Thakur, B.; Kalra, A.; Ahmad, S. Evaluating Future Flood Scenarios Using CMIP5 Climate Projections. Water 2018, 10, 1866. [Google Scholar] [CrossRef] [Green Version]
- IPCC. Climate Change 2013: The Physical Science Basis. Contribution of Working Group I to the Fifth Assessment Report of the Intergovernmental Panel on Climate Change; Stocker, T.F., Qin, D., Plattner, G.-K., Tignor, M., Allen, S.K., Boschung, J., Nauels, A., Xia, Y., Bex, V., Midgley, P.M., Eds.; IPCC: Geneva, Switzerland, 2013. [Google Scholar]
- Legesse, S. Hydrological Response to Climate Change of the Upper Blue Nile River Basin: Based on IPCC Fifth Assessment Report (AR5). J. Climatol. Weather. Forecast. 2015, 3. [Google Scholar] [CrossRef]
- Lamichhane, N.; Sharma, S.; Subedi, A.S. Effects of climate change in winter ice cover and ice thickness in flooding: A case study of Grand River, Ohio, USA. ISH J. Hydraul. Eng. 2020, 2020, 1–15. [Google Scholar] [CrossRef]
- Thuy, N.; Ky Phung, N.; Hoan, N.; Nguyen Khoi, D. Assessing the impacts of the changes in the upstream flow and sea level rise due to climate change on seawater intrusion in Ho Chi Minh city using the HEC-RAS 1D Model. Vietnam. J. Hydrometeorol. 2018, 1, 64–69. [Google Scholar]
- Oubennaceur, K.; Chokmani, K.; Gauthier, Y.; Ratte-Fortin, C.; Homayouni, S.; Toussaint, J.-P. Flood Risk Assessment under Climate Change: The Petite Nation River Watershed. Climate 2021, 9, 125. [Google Scholar] [CrossRef]
- Hasson, S.; Pascale, S.; Lucarini, V.; Böhner, J. Seasonal cycle of precipitation over major river basins in South and Southeast Asia: A review of the CMIP5 climate models data for present climate and future climate projections. Atmos. Res. 2016, 180, 42–63. [Google Scholar] [CrossRef] [Green Version]
- Bolch, T.; Pieczonka, T.; Mukherjee, K.; Shea, J. Brief communication: Glaciers in the Hunza catchment (Karakoram) have been nearly in balance since the 1970s. Cryosphere 2017, 11, 531–539. [Google Scholar] [CrossRef] [Green Version]
- Qureshi, M.; Yi, C.; Xu, X.; Li, Y. Glacier status during the period 1973–2014 in the Hunza Basin, Western Karakoram. Quat. Int. 2017, 444, 125–136. [Google Scholar] [CrossRef]
- Tahir, A.A.; Chevallier, P.; Arnaud, Y.; Ashraf, M.; Bhatti, M.T. Snow cover trend and hydrological characteristics of the Astore River basin (Western Himalayas) and its comparison to the Hunza basin (Karakoram region). Sci. Total Environ. 2015, 505, 748–761. [Google Scholar] [CrossRef] [PubMed]
- Naeem, U.; Hashmi, H.; Shamim, M.; Ejaz, N. Flow Variation in Astore River under Assumed Glaciated Extents due to Climate Change. Pak. J. Eng. Appl. Sci. 2012, 11, 73–81. [Google Scholar]
- Khan, S.; Hassan, M.; Khan, A. Environment, Agriculture, and Land Use Pattern. In Climate Change and Agriculture; Hussain, S., Ed.; Intechopen: London, UK, 2019. [Google Scholar] [CrossRef] [Green Version]
- Ali, K.; de Boer, D. Spatial patterns and variation of suspended sediment yield in the upper Indus River basin, northern Pakistan. J. Hydrol. 2007, 334, 368–387. [Google Scholar] [CrossRef]
- Collins, D. Sediment transport from glacierized basins in the Karakoram mountains. In Erosion and Sediment Yield: Global and Regional Perspectives (Proceedings of the Exeter Symposium, July 1996); IAHS Publ. No. 236; 1996; pp. 85–96. Available online: https://www.researchgate.net/publication/267771445_Sediment_transport_from_glacierized_basins_in_the_Karakoram_mountains (accessed on 16 September 2021).
- Khalid, S.; Rehman, S.U.; Shah, S.M.A.; Naz, A.; Saeed, B.; Alam, S.; Ali, F.; Gul, H. Hydro-meteorological characteristics of Chitral River basin at the peak of the Hindukush range. Nat. Sci. 2013, 5, 987–992. [Google Scholar] [CrossRef] [Green Version]
- Rehman, S.; Sabir, A. On the water and sediment yield of Chitral River, Pakistan. J. Sci. Technol. Univ. Peshawar 2003, 27, 53–61. [Google Scholar]
- Kowalczuk, Z.; Świergal, M.; Wróblewski, M. River Flow Simulation Based on the HEC-RAS System. Adv. Intell. Syst. Comput. 2018, 635, 253–266. [Google Scholar]
- Patel, D.P.; Ramirez, J.A.; Srivastava, P.K.; Bray, M.; Han, D. Assessment of flood inundation mapping of Surat city by coupled 1D/2D hydrodynamic modeling: A case application of the new HEC-RAS 5. Nat. Hazards 2017, 89, 93–130. [Google Scholar] [CrossRef]
- Ramachandran, A.; Palanivelu, K.; Mudgal, B.V.; Jeganathan, A.; Guganesh, S.; Abinaya, B.; Elangovan, A. Climate change impact on fluvial flooding in the Indian sub-basin: A case study on the Adyar sub-basin. PLoS ONE 2019, 14, e0216461. [Google Scholar] [CrossRef] [Green Version]
- Tabari, H. Climate change impact on flood and extreme precipitation increases with water availability. Sci. Rep. 2020, 10, 13768. [Google Scholar] [CrossRef]
- Anjum, M.N.; Ding, Y.; Shangguan, D. Simulation of the projected climate change impacts on the river flow regimes under CMIP5 RCP scenarios in the westerlies dominated belt, northern Pakistan. Atmos. Res. 2019, 227, 233–248. [Google Scholar] [CrossRef]
- Su, B.; Huang, J.; Gemmer, M.; Jian, D.; Tao, H.; Jiang, T.; Zhao, C. Statistical downscaling of CMIP5 multi-model ensemble for projected changes of climate in the Indus River Basin. Atmos. Res. 2016, 178-179, 138–149. [Google Scholar] [CrossRef]
- Khalil, U.; Khan, N.M.; Rehman, H. Floodplain mapping for Indus River: Chashma-Taunsa Reach. Pak. J. Eng. Appl. Sci. 2017, 20, 30–48. [Google Scholar]
- Saifullah, M.; Liu, S.; Adnan, M.; Ashraf, M.; Zaman, M.; Hashim, S.; Muhammad, S. Risks of Glaciers Lakes Outburst Flood along China Pakistan Economic Corridor. In Antarctica—A Window to Remote Knowledge; IntechOpen: London, UK, 2021; pp. 1–17. [Google Scholar]
- Khalfallah, B.; Saidi, S. Spatiotemporal floodplain mapping and prediction using HEC-RAS—GIS tools: Case of the Mejerda river, Tunisia. J. Afr. Earth Sci. 2018, 142, 44–51. [Google Scholar] [CrossRef]


Publisher’s Note: MDPI stays neutral with regard to jurisdictional claims in published maps and institutional affiliations. |
© 2021 by the authors. Licensee MDPI, Basel, Switzerland. This article is an open access article distributed under the terms and conditions of the Creative Commons Attribution (CC BY) license (https://creativecommons.org/licenses/by/4.0/).