Abstract
Limited water resources and low water productivity limit the sustainable development of agriculture in northwest China. In this study, drip irrigation under plastic film was used to achieve an optimal water deficit irrigation (WDI) scheme for the cultivation of indigowoad root (Isatis tinctoria L.). Field water control experiments were conducted in 2016 and 2017. Evaluation of WDI schemes was carried out by considering five indices: water consumption, yield, water use efficiency (WUE), indigo, and (R,S)-goitrin. To enhance the reliability of results, the analytic hierarchy process (AHP) and entropy weight method (EWM) were adopted to calculate the combined weight of the evaluation index. Finally, an improved technique for order of preference by similarity to ideal solution (TOPSIS) that integrated AHP–EWM weights was used to construct a unified, comprehensive evaluation model of indigowoad root under mulched drip irrigation that would produce high yield while saving water. The evaluation results indicated that mild WD (specifically, the V1G1 treatment) was continuously exerted during the vegetative and fleshy root growth periods, which enhanced the WUE and improved the quality of indigowoad root to a certain extent without significantly reducing the yield. These results provide a scientific basis for irrigation of indigowoad in northwest China and other areas with a similar environment.
1. Introduction
Water shortage is a common problem faced by global dryland agriculture [1]. Northwest China, located in the hinterland of Eurasia, is a typical dryland agricultural region with a dry climate, scanty rainfall, intense evaporation, and a shortage of surface water resources. Agricultural irrigation is primarily flood irrigation from wells, and the efficiency of irrigation water use is very low [2]. Groundwater levels have fallen sharply due to severe overexploitation, and regional agricultural and ecological water requirements cannot be met under existing water resources [3]. Hence, desertification is increasing every year, and the ecological environment continues to deteriorate. Gansu Province, one of the five northwestern provinces, is an important area for the production of Chinese medicinal materials. In 2015, the province’s planting area of Chinese medicinal materials was approximately 258,666.67 ha, with an output of 990,000 tons, making it the highest ranked province in the country in terms of area and total output [4]. Indigowoad root, which belongs to the Brassicaceae family, is a traditional Chinese herbal medicine and a characteristic medicinal crop of Minle County. The roots and leaves, which are used in medicines, have various effects, such as clearing heat, detoxification, cooling blood, and lowering pharyngeal secretions [5]. With the increasing depletion of wild Chinese medicinal materials and the gradual improvement in people’s awareness of prevention and health care, its market prospect is broad. However, Minle County is located in the middle of the Hexi Corridor of Gansu Province, where rainfall is unevenly distributed over time and space. There is often insufficient rainfall during the growing period, which affects the growth and yield of indigowoad root [6]. Irrigation is an important factor for indigowoad root production in the region. Water deficit irrigation (WDI) is an irrigation model based on the physiological characteristics of crops that can fully tap the potential of efficient utilization of crop water and maintain yield without decreasing or increasing on the basis of incomplete water requirements of crops [7]. Numerous studies have shown that WDI is effective for saving water and improving the quality of field crops [8,9]. Therefore, searching for a suitable high-efficiency irrigation model is of great significance for the sustainable development of the indigowoad root industry.
The technique for order of preference by similarity to ideal solution (TOPSIS) method, first proposed in 1981 by scholars C.L. Hwang and K. Yoon, is a commonly applied comprehensive evaluation method that makes full use of the original data, and the results can accurately reflect the gap between various evaluation schemes [10]. The determination of the weight of each index in the evaluation system is key to the quality of a comprehensive evaluation [11]. The weight determination methods are primarily divided into two categories: the subjective weighting method (expert investigation, analytic hierarchy process (AHP), binomial coefficient method, and others) and the objective weighting method (principal component analysis, entropy weight method (EWM), and multiobjective programming method) [12]. The subjective weight is based on the evaluator’s subjective judgment and is obtained after processing. Although this method can effectively avoid a situation where the attribute weight is contrary to the actual importance of the attribute, the result is subjective and arbitrary, and the result is also easily influenced by the level of knowledge and experience of the decision-makers. Hence, there are greater limitations in practical application. The objective weighting method is based on the original data, and the weights are confirmed using relatively complete mathematical theories and methods. Although the weighting is more objective, it ignores the importance of people of different attributes, and sometimes the determined weight is not in accordance with the actual importance of the attribute [13]. Zheng et al. [14] evaluated the comprehensive nutritional quality evaluation indices of tomatoes irrigated with biogas slurry, and the combined weighting method of game theory was adopted to obtain the weight of the individual nutritional quality of each tomato based on the AHP and the coefficient of variation method. Cui [15] and Zheng et al. [16] used the EWM to determine the objective weight of the evaluation indices when establishing a fuzzy evaluation model for the regulated deficit irrigation (RDI) of the jujube tree and greenhouse small watermelon. They obtained the comprehensive weight of the evaluation indices combined with expert prediction method, which improved the reliability of the model evaluation. According to the advantages and disadvantages of the subjective or objective weighting methods, AHP and EWM are selected to determine the subjective and objective weights of the evaluation indicators, respectively. This study adopts the combination weight (CW) method of the two methods for weighting, which unifies the subjective and objective weight and makes the decision reasonable and reliable.
The application of TOPSIS in agricultural soil and water primarily focuses on agricultural climate change [17,18], the assessment of soil and water resources in agriculture [19,20], the evaluation of the benefits of water and fertilizer integration [21,22], agricultural irrigation distribution [23,24], and irrigation network management [25,26]. The abovementioned large number of reports confirm the successful application of TOPSIS in various fields. The method improves the scientificity, accuracy, and operability of multiobjective decision analysis and ensures the evaluation effect is stable and reliable [27]. Similarly, some scholars have also used TOPSIS for evaluation of crop water regulated deficit irrigation. Jiang et al. [28] used the TOPSIS model to evaluate the fruit quality of tomatoes with water treatment during different growth stages, and the results showed that the moderate water deficit (WD) at the flowering and fruiting stages of tomatoes ranked higher in comprehensive fruit quality. Keabetswe et al. used the TOPSIS model for comprehensive analysis of tomato fruit quality under the combination of biochar and WDI and found that the highest-ranking fruit quality was obtained for two consecutive growing seasons under the design limit of 70% field water-holding capacity at ripening and 10% biochar by weight, which was confirmed using a combination evaluation method [29]. The TOPSIS model evaluation by Liu et al. on the yield, quality, and water use efficiency (WUE) of coffee under combinations of different shading or nitrogen levels and the degree of water deficit showed that the comprehensive evaluation of DI75Sh30 (75% of full irrigation amount and 30% of shading natural light intensity) under different shading conditions was optimal. However, the comprehensive benefit of DI80NH (80% of full irrigation amount and 140 gN·plant−1) under different nitrogen levels was the best [30,31]. Cheng et al. [7] adopted TOPSIS to evaluate the WD patterns under alternate partial root irrigation in maize. Overall, it can be seen that the TOPSIS method can be used to evaluate a crop WDI system, and its application in agricultural production practice has great room for development, especially for the cultivation of medicinal crops in arid areas. At the same time, the evaluation of crop irrigation schemes is still mostly based on measured data, such as yield, quality, and WUE, while evaluation of irrigation schemes based on mathematical models is relatively rare, especially for medicinal crops. Therefore, in this study, a comprehensive evaluation model of the WUE, yield, and quality of indigowoad root was established using the improved TOPSIS method. The hypothesis was that evaluation of the mathematical model of the WDI scheme for medical crops would be consistent with measured results and would be reasonable and reliable. The objective of this study was to (1) determine a suitable WDI scheme to ensure high WUE and quality of the medicinal material Isatis tinctoria and (2) provide useful guidelines for the optimization of water-saving irrigation schemes for the cultivation of medicinal crops in the arid region of northwest China.
2. Materials and Methods
2.1. Description of the Experimental Site
The irrigation experiment was conducted at the Yimin Irrigation Experiment Station in Minle County, Zhangye City, Gansu Province, located in northwest China. The experimental station was located in the middle reaches of the Hexi Corridor (100°43′ E, 38°39′ N), and the altitude was 1970 m. The experimental site has a continental desert grassland climate. The annual mean air temperature is 6 °C, the highest extreme temperature is 37.8 °C, and the lowest extreme temperature is 33.3 °C. According to the rainfall data from 1995 to 2015, the average annual rainfall in this region is 215 mm. The region has abundant light resources with annual sunshine hours of 3000 h and an average frost-free period of 125 days. The soil is light loam with a field water holding capacity (θf) of 24% (mass water content) and a soil bulk density of 1.4 t·m−3. The groundwater level is below 20 m, and the irrigation area is not affected by salinization.
2.2. Experimental Design and Field Management
The tested variety was self-produced large, full-bodied, and uniform seeds of indigowoad root that were selected from the Chinese Herbal Medicine Department of Gansu Agricultural University. The indigowoad root (Isatis tinctoria L.) was seeded on 3 May 2016 and 2 May 2017 and harvested on 13 October 2016 and 11 October 2017. The sowing rate was 30.0 kg·ha−2, and the planting density was 700,350 plants·ha−2. Prior to sowing, the test plot was tilled to 30 cm; weeds were removed manually; and 210 kg·ha−2 of urea (46% N), 340 kg·ha−2 of calcium superphosphate (12% P2O5, 10% S, and 16% Ca), and 270 kg·ha−2 of source potassium (25% K2O) were applied. All of the above fertilizers were applied as a base fertilizer at sowing. Three drip irrigation strips were laid manually in each plot with a distance of 1 m and a distance of 30 cm between the drip heads. The average flow rate of the drip head during irrigation was 2.5 L·h−1. The drip irrigation pipe adopted the branch control method, which consisted of a control valve that was installed in each community to control the irrigation volume of the community at any time. The pressure gauge and the water meter were located at the drip irrigation hub, and the system working pressure was 0.1 MPa. After the drip irrigation was laid, it was covered with a colorless plastic film with a film width of 120 cm. Each test plot was separated by a 60 cm wide film to prevent water from seeping underground.
The growth of indigowoad root was divided into four growth periods according to its growth characteristics: seedling stage, vegetative growth stage, fleshy root growth stage, and fleshy root maturity stage. Four gradients were set for the soil moisture: full irrigation (FI, 75–85% soil moisture content (SMC)), mild water deficit (65–75% SMC), moderate WD (55–65% SMC), and severe WD (45–55% SMC). There were 10 water control treatments in total, of which FI was the control treatment. The experiment was arranged in a single-factor randomized block design with three replications for a total of 30 plots during the two seasons. Each plot was 36 m2 (9 m × 4 m). The irrigation method was drip irrigation under the film, and when the actual measured value of the SMC was lower than the lower limit of the threshold of the experimental design (Table 1), the water was filled immediately. The specific test design is shown in Table 1.

Table 1.
The WDI scheme.
2.3. Measurements and Calculations
2.3.1. Soil Moisture Content
During the growth period, the SMC was measured using the traditional drying method every 7–10 days randomly at the midpoint of the line of two indigowoad root plants, with 3 measuring points in each plot. This was done using soil drills to sample six layers; one sample was taken in the first 10 cm of the soil. Then, samples were taken at intervals of 20 cm, from 20–80 cm in depth. Because the root system of the indigowoad root is primarily distributed in the 50 cm soil layer, the average value of water content in the 60 cm soil layer was used as the basis for irrigation.
The formulas for calculating the irrigation amount for the indigowoad root are as follows:
where is the soil mass water content (%); and are the weights of fresh soil and dry soil, respectively, (g); is the amount of irrigation water (mm); is the volume density of the planned wet layer (g·cm−3); is the depth of the planned wet layer (60 cm); is the design control upper limit moisture content (field water capacity multiplied by upper limit of design control relative moisture content,%); is the mass moisture content of the soil before irrigation (%); and is the design wet ratio of the drip irrigation (65%).
2.3.2. Plant Yield
The actual yields of each treatment were averaged over three replications when the indigowoad roots matured and were harvested separately by plot for the yield measurements.
2.3.3. Water Consumption and Water Use Efficiency
The stage water consumption was calculated using the water balance method:
where is the stage water consumption of the indigowoad root (mm); and are the soil layer number and total number, respectively; is the i-th layer soil bulk density; is the i-th layer soil layer thickness (cm); and are the moisture content of the i-th soil at the beginning and end of a certain period (%), respectively; and , , , and are the amount of irrigation, precipitation, supplement, and drainage of deep soil water, respectively, during this period (mm). The depth of the groundwater in the test region was greater than 20 m, so there was no need to consider deep water supplementation, and was 0. The test region was an arid area and drip irrigation failed to make the SMC reach the saturation value, and no leakage occurred. Hence, was taken to be 0.
where is the water use efficiency (kg·ha−2·mm−1); is the total root yield (kg·ha−2); and is the water consumption during the entire indigowoad root growing period (mm).
2.3.4. Root Quality
High-performance liquid chromatograph (LC−10ATVP, Shimazu Co., Kyoto, Japan) was used for the determination of the indigowoad root quality. The specific determination method is provided in [32].
2.3.5. Determination of Weights
The analytic hierarchy process (AHP) is a comprehensive evaluation method of systematic analysis and decision-making established by the American operations researcher T.L. Saaty in the 1970s [33,34]. It can also be used to determine the weight coefficient of the evaluation index [35]. The specific steps are as follows:
- (1)
- The relationship between various factors in the system are analyzed, and the hierarchical structure of the system is established.
- (2)
- Pair comparison is made of the relative importance of indicators at different levels and quantified on a scale from 1 to 9 in the definition of judgment matrix scale (Table 2). After that, the judgment matrix of pairwise comparison is formed by the quantization results.
Table 2. Judgment matrix scale definition.
- (3)
- The subjective weights from the judgment matrix ()are calculated. Then, the consistency of the judgment matrix is tested to ensure the scientificity and reliability of the calculation.
Among them, the method of calculating the weight includes the following:
- Arithmetic average method:
- Geometric average method:
- Eigenvector method: The maximum eigenvalue of the matrix and its corresponding eigenvector are found, and the obtained eigenvector is normalized to obtain the weight result.
Among them, the steps for consistency check of the judgment matrix are as follows:
- The consistency index (CI) is calculated as follows:where is the maximum eigenvalue of the judgment matrix , and is the number of valuation index.
- The corresponding average random consistency index (RI) is found (Table 3).
Table 3. Average random consistency index.
- The consistency ratio (CR) is calculated as follows:
When CR is less than 0.10, the consistency of the judgment matrix is considered acceptable; otherwise, the judgment matrix should be appropriately amended.
The basic idea of the entropy weight method (EWM) is to determine the objective weight according to the variability of the index [36,37]. The specific steps are as follows:
- (1)
- The data is standardized. According to the data of n evaluation processes and the data of m evaluation indices, a matrix is constructed, and the data is processed to standardize and eliminate the influence of the dimension and order of magnitude. The low optimal indices are standardized according to Equation (11) to ensure consistent direction of the evaluation index, and the other indices are standardized using Equation (10).
- (2)
- The ratio of each index in each scheme is calculated. The matrix Z is obtained after the previous standardization process, and the proportion of the i-th sample under the j-th index is then calculated using Equation (13). The result is regarded as the probability used in the calculation for the relative entropy:
- (3)
- Based on the definition of information entropy, the entropy of the j-th index is calculated according to Equation (14). Then, the information utility value is calculated according to Equation (15) and normalized to obtain the entropy weight of each index according to Equation (16).
The AHP method and EWM are used to give CW to the evaluation indices, and the weight calculation formula is as follows:
2.4. Statistical Analysis
The experiment data were analyzed using a one-way ANOVA using the SPSS software package (Version 20.0, Stanford University, Stanford, CA, USA). Duncan’s multiple comparison method was used to compare the significant differences between the means at a significance level of p < 0.05. EXCEL 2010 (Microsoft 365) and MATLAB R2017b (MathWorks, Natick, MA, USA) were used to make tables and solve each model, respectively.
3. Results
3.1. Selection of Evaluation Indicators
The relevant data of water consumption, yield, and quality indices of the indigowoad root under mulched drip irrigation were selected (Table 4) to comprehensively evaluate the water-saving and quality-adjusted irrigation scheme of the indigowoad root [38]. Table 4 shows the effects of different water treatments on the indigowoad root yield, WUE, water consumption, indigo, and (R,S)-goitrin in 2016 and 2017.
Table 4.
Experimental results of the indicators for a comprehensive evaluation system.
Differences in water consumption, yield, WUE, and quality could be seen between various moisture treatments in different years. The control FI consumed the most water at 374.04 and 381.75 mm in 2016 and 2017, respectively. The water consumption of each WD treatment (V1G0 to V3G2) decreased compared with the FI with significant differences (p < 0.05), and it decreased by 4.11–15.71% as WD increased in the following order: mild WD treatment (V1G1 and V1G2) > moderate WD treatment (V2G1 and V2G2) > severe WD treatment (V3G0, V3G1, and V3G2). However, the water consumption of V2G0 treatment was higher than that of V1G0 treatment in two consecutive growing seasons. The reason for this result may be because, on the one hand, rewatering after moderate WD in the early growth stage has certain compensatory or supercompensatory effect on crop growth, so the crop water consumption of the corresponding rewatering stage will increase [39], and on the other hand, the irrigation amount is calculated based on the 60 cm soil layer in the root cluster as the planned wet layer, which may be neglected due to the upward recharge and consumption of deep soil water. Moreover, field experiments are affected by a variety of complex factors, and the accuracy of the sampling process is relatively difficult to ensure [1].
The economic yield of the V1G0 treatment was the highest at 8329.56 and 8390.80 kg·ha−2 in 2016 and 2017, respectively, followed by V1G1, which was not significantly different from the control FI (p > 0.05). Compared with the FI, the output of the remaining WD treatments decreased by varying degrees, with declines ranging from 13.17% to 37.12% and 10.33% to 33.43%. The severe WD treatment (V3G1 and V3G2) decreased by more than 30%, which was the most significant decline. The WUE was the highest in the treatment of V1G0 and V1G1 for two consecutive years, which was significantly increased by 8.01% and 8.46% and 8.35% and 6.74% for 2016 and 2017, respectively, compared to the FI, and the remaining WD treatments were significantly reduced. Without considering the stage WD conditions, in the FI, V1G1, and V1G2 treatments, the content of indigo and (R,S)-goitrin in two consecutive growing seasons of the indigowoad root increased with decreasing water consumption. In addition, the quality index value of the V1G2 treatment was the largest, and the control FI was the smallest. The content of the active ingredients in V2G1 and V2G2 both increased significantly compared to CK and were also significantly different from the remaining treatments. Thus, it can be seen that the response law and degree of each evaluation index to the WDI were inconsistent. Additionally, any single index could not reasonably determine the irrigation scheme with high quality, high yield, and high efficiency. Hence, a comprehensive evaluation model was required.
The selection principle for the optimal WDI scheme for indigowoad root with mulched drip irrigation was to reduce the amount of irrigation water and improve the water productivity and herb quality with no or a small decrease in yield. In this study, the important active ingredients (indigo and (R,S)-goitrin) of indigowoad root were chosen as indicators of herbal quality, the yield and WUE of indigowoad root were chosen as the yield indicators, and water consumption during the entire growth period was chosen as the water consumption indicator. By comprehensively considering the above five indices, a statistical method was used to make a reasonable evaluation of the irrigation scheme with high quality, high yield, and high efficiency of indigowoad root using a plastic mulched drip irrigation scheme.
3.2. Determination of the Weight of Indices in the Evaluation System
3.2.1. The Analytic Hierarchy Process
The AHP is a subjective empowering method that combines quantitative and qualitative analyses to determine the weighting of index based on knowledge and experience of the decision-maker in determining the importance of each index to the goal. As such, it is subjective. The primary steps of AHP for calculating the subjective weights are as follows:
- (1)
- Establishment of a hierarchy of steps
Because this method was primarily used in this study to determine the weight coefficient of each evaluation index, the hierarchical structure of the system only involved the target and index layers and not the scheme layer (Figure 1). The upper layer was the target layer O, which was the evaluation of the WDI scheme for the indigowoad root with the plastic mulched drip irrigation. The lower layer was the index layer C, which included five indices: yield (C1), WUE (C2), water consumption (C3), indigo (C4), and (R,S)-goitrin (C5).
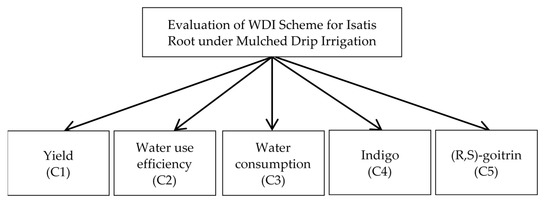
Figure 1.
Hierarchical structure diagram.
- (2)
- Construction of a judgment matrix
The indices in the index layer do not necessarily have the same proportion in the target measurement. They each occupy a certain proportion. The numbers 1 to 9 and their reciprocal were used as the scale (Table 2) to define the judgment matrix (Table 5) [40]. A one-time determination of the relationship between the criteria layer of each index was often not well considered, so it was necessary to compare two evaluation indices and construct a pairwise comparison matrix, namely the judgment matrix , to calculate the weight.
Table 5.
Judgment matrix .
- (3)
- Calculation of the subjective weights from the judgment matrix ()
In order to ensure the robustness of the results, this study used the arithmetic average method, the geometric average method, and the eigenvector method to obtain the weights.
The calculation results using MATLAB software are shown in Table 6 and the CR = 0.0044 < 0.10. Hence, the judgment matrices had good consistency. The weighted coefficient results calculated by the arithmetic average method, geometric average method, and eigenvector method were basically the same. Finally, the eigenvector = [0.2784 0.4477 0.0733 0.1002 0.1002] was selected as the subjective weight coefficient of each evaluation index.
Table 6.
The weight coefficients of the judgment matrix .
3.2.2. Entropy Weight Method
The EWM is an objective weighting method that can avoid human interference. According to the principles of information theory, entropy reflects the disorder degree of information. The smaller the entropy value, the smaller the degree of disorder in the system, and the greater the utilization value, the greater the weight.
Based on the data in Table 4, the evaluation matrix was formed, and the objective weights of the evaluation indices were calculated using Equations (10)–(16). The calculation results were as follows: 2016, = [0.4900 0.2974 0.0482 0.0614 0.1031] and 2017, = [0.4684 0.2374 0.0482 0.0731 0.1369].
3.2.3. Combination Weights
The subjective weight calculated using the AHP and the objective weight calculated using the EWM were combined according to Equation (17) to obtain the CWs of each index, as shown in Table 7.
Table 7.
The weight of each indicator in the evaluation system.
3.3. Integrated Evaluation Model Based on the Improved TOPSIS Method
The comprehensive evaluation model of the WDI scheme for the indigowoad root was established according to the improved TOPSIS method. The calculation is shown below.
For the specific method of this study, there were 10 evaluation treatments and 5 evaluation indices. By referring to step (1) for EWM in Section 2.3.5, the data matrix of the original evaluation index was first normalized and then standardized. The standardized weighting matrix and the best and worst vector results of the maximum and minimum values of each column were obtained after the assignment using Equation (18), as shown in Table 8.
Table 8.
The weighted matrix of each standardized evaluation indicator.
The maximum value of each column was the optimal vector:
The minimum value of each column was the worst vector:
The distances between the evaluation object and the maximum and minimum values were calculated using Equations (19) and (20), respectively. The calculation results are shown in Table 9.
Table 9.
Sequencing and calculation of the progress of each test process.
The closeness (comprehensive evaluation value) of the evaluation object to the optimal scheme was calculated using Equation (21):
3.4. Analysis of the Evaluation Results
The greater the comprehensive evaluation value , the better the comprehensive benefit of the treatment. The normalized score of the comprehensive evaluation value was calculated according to Equation (21). Then, the different water treatments were sorted based on the size of the calculated values. The specific calculated values and ranking results for each treatment are shown in Table 9. The ranking of composite evaluation values was as follows: 2016: V1G1 > V1G0 > FI > V1G2 > V2G1 > V2G0 > V2G2 > V3G0 > V3G1 > V3G2; 2017: V1G0 > V1G1 > FI > V2G0 > V2G1 > V1G2 > V3G0 > V2G2 > V3G1 > V3G2. It can be seen that the decisions of the comprehensive evaluation system for the two growing seasons were different; however, mild water deficit treatments were ranked first and higher than adequate water supply treatments (CK). The best WDI scheme in 2016 was V1G1, followed by V1G0, with values of 0.9746 and 0.9741, respectively. In 2017, V1G0 was the best WDI scheme, followed by V1G1, with values of 0.9762 and 0.9458, respectively. The worst treatment in the two years was V3G2, with values of 0.0078 and 0.0081, respectively. Without considering the effects of the WD stage, the comprehensive benefits of indigowoad root with plastic mulched drip irrigation tended to decrease with an increase in the water consumption. However, under the WD stage, the comprehensive benefits of mild or continuous mild WD during the vegetative growth period of indigowoad root was better. Considering the comprehensive measured results, the treatment of V1G1 achieved an organic unity of high quality, high yield, and high efficiency, which can be used as the best irrigation strategy for indigowoad root with plastic mulched drip irrigation in the northwest arid region.
4. Discussion
4.1. CW of Evaluation Indicators
Weight refers to the degree of importance of a specific indicator in an indicator system. It is a numerical value used to measure the effect of each unit’s mark value in the overall population, which directly affects the final evaluation result [13]. Currently, there are many methods for determining attribute weights. This study first used the AHP and EWM to obtain the subjective and objective weights of the evaluation index, respectively, and then obtained the CW. By considering the preference of the decision-maker for the attributes, this method also aimed to reduce the subjective arbitrariness of empowerment so that the empowerment of the attributes achieved the unity of the subjective and objective and the decision-making results would be true and reliable. Wei [41] applied the above method to weight the relevant evaluation index of the regulated deficit irrigation (RDI) of watermelon and obtained a good evaluation effect. It can be seen that the subjective and objective comprehensive weight determination method has certain advantages in a comprehensive evaluation model, but it does have the limitation that the weight distribution of the two methods is difficult to determine. In addition, the mathematical derivation is too cumbersome, and the applicability and operability are relatively weak. Additionally, due to the difference in the geographical environment and the research object, the weight assignment becomes difficult. Therefore, in future research and applications, it will be necessary to combine computer programming technology to obtain a comprehensive weight considering the characteristics of crops and the environmental factors in cultivated areas. Moreover, a relatively objective evaluation of the indicators at all levels will need to be performed so as to further improve the rationality and reliability of the evaluation results.
4.2. Comprehensive Evaluation Results of WDI Scheme
A comprehensive evaluation is the comprehensive consideration of various factors or multiple indicators that affect the object or thing of study so that a reasonable evaluation can be made [42]. In this study, the comprehensive evaluation model of improved TOPSIS was applied to evaluate the growth, yield, quality, and stage water consumption of indigowoad root under the RDI in Minle County. According to the evaluation results of the indicators, the V1G1 treatment achieved an organic unity of high quality, high yield, and high efficiency, which was in good agreement with the measured results. Therefore, this model not only achieved a certain degree of optimized screening of RDI schemes but also provided possibility for a reasonable choice of RDI models for medical crops.
5. Conclusions
- (1)
- With the help of AHP and EWM, the CW of each evaluation index was finally determined, which stably reflected the degree of influence of each evaluation index on the comprehensive evaluation system of the WDI scheme for indigowoad root. Among the CWs obtained from the experimental data for two consecutive years, the largest weight of the indigowoad root yield was 0.4711 (2016) and 0.4702 (2017).
- (2)
- The comprehensive evaluation value was calculated by constructing the TOPSIS comprehensive evaluation model, and the value was used to rank the different WDI schemes. The results showed that V1G1 was the best water control treatment in 2016, followed by V1G0, with values of 0.9746 and 0.9741, respectively. Additionally, V1G0 was the best water control treatment in 2017, followed by V1G1, with values of 0.9762 and 0.9458, respectively. The V3G2 treatment was the worst for the two years, with values of 0.0078 and 0.0081.
A comprehensive analysis of the measured and evaluation results of the continuous two-year trial showed that the V1G1 treatment saved irrigation and improved water utilization without significantly reducing the yield. It also improved the quality of the herb to some extent, thereby increasing the commercial value of the indigowoad root and bringing more economic benefits to producers.
Author Contributions
Data curation, Z.W. and C.Z.; formal analysis, Z.W.; funding acquisition, H.Z.; supervision, H.Z. and Y.W.; writing—original draft, Z.W.; writing—review and editing, Z.W. All authors have read and agreed to the published version of the manuscript.
Funding
This work was supported by the Key Research and Planning Projects of Gansu Province (No. 18YF1NA073) and the National Natural Science Foundation of China (No. 51669001).
Institutional Review Board Statement
Not applicable.
Informed Consent Statement
Not applicable.
Data Availability Statement
Data is contained within the article.
Acknowledgments
The authors would like to thank the Key Research and Planning Projects of Gansu Province (No. 18YF1NA073) and the National Natural Science Foundation of China (No. 51669001) for the funding & lab facilities. We thank everyone who helped during the field trials. We also thank the reviewers for useful comments and suggestions. We thank LetPub (www.letpub.com (accessed on 9 March 2021)) for linguistic assistance during the preparation of this manuscript.
Conflicts of Interest
The authors declare no conflict of interest.
References
- Zheng, J.; Huang, G.; Wang, J.; Huang, Q.; Pereira, L.; Xu, X.; Liu, H. Effects of water deficits on growth, yield and water productivity of drip-irrigated onion (Allium cepa L.) in an arid region of Northwest China. Irrig. Sci. 2013, 31, 995–1008. [Google Scholar] [CrossRef]
- Kang, S.; Su, X.; Tong, L.; Shi, P.; Yang, X.; Yukuo, A. The impacts of human activities on the water-land environment of Shiyang River Basin, an arid region in Northwest China. Hydrol. Sci. J. 2004, 49, 413–427. [Google Scholar] [CrossRef]
- Kang, S.; Zhang, J. Controlled alternate partial root-zone irrigation: Its physiological consequences and impact on water use efficiency. J. Exp. Bot. 2004, 55, 2437–2446. [Google Scholar] [CrossRef] [PubMed]
- Zhu, T. Practical Cultivation Techniques of Authentic Chinese Medicinal Materials in Gansu, 1st ed.; Gansu Science and Technology Press: Lanzhou, China, 2016; pp. 2–8. [Google Scholar]
- Cui, S.; Xue, Y.; Yang, J.; Hao, J. Research progress of Isatis root. Chin. Herb. Med. 2001, 32, 96–97. [Google Scholar]
- Chai, W. Reflections on the development of Isatis root industry in Minle County. Gansu Agric. Sci. Technol. 2013, 44, 57–59. [Google Scholar]
- Cheng, M.; Wang, H.; Fan, J.; Zhang, F.; Wang, X. Effects of Soil Water Deficit at Different Growth Stages on Maize Growth, Yield, and Water Use Efficiency under Alternate Partial Root-Zone Irrigation. Water 2021, 13, 148. [Google Scholar] [CrossRef]
- Hooshmand, M.; Albaji, M.; Nasab, S.; Ansari, N. The effect of deficit irrigation on yield and yield components of greenhouse tomato (Solanum lycopersicum) in hydroponic culture in Ahvaz region, Iran. Sci. Hortic. Amst. 2019, 254, 84–90. [Google Scholar] [CrossRef]
- Trentacoste, E.; Calderon, F.; Contreras-Zanessi, O.; Galarza, W.; Banco, A.; Puertas, C. Effect of regulated deficit irrigation during the vegetative growth period on shoot elongation and oil yield components in olive hedgerows (cv. Arbosana) pruned annually on alternate sides in San Juan, Argentina. Irrig. Sci. 2019, 37, 533–546. [Google Scholar] [CrossRef]
- Yoon, K.; HWang, C. Multiple Attribute Decision Making: An Introduction; Sage Publications Inc.: Thousand Oaks, CA, USA, 1995; pp. 58–84. [Google Scholar]
- Pena, J.; Napoles, G.; Salgueiro, Y. Explicit methods for attribute weighting in multi-attribute decision-making: A review study. Artif. Intell. Rev. 2020, 53, 3127–3152. [Google Scholar] [CrossRef]
- Liu, H.; Duan, A.; Sun, J.; Ning, H.; Wang, F. Evaluation of irrigation scheme with high quality and efficiency for greenhouse grown tomato. J. Drain. Irrig. Mach. Eng. 2014, 32, 529–540. [Google Scholar]
- Guo, Y. Summary of weight determination methods. Rural Econ. Technol. 2018, 29, 252–253. [Google Scholar]
- Zheng, J.; Zhang, P.; Zhu, C.; Ma, J.; Wang, Y. Tomato nutritional quality indexes under various biogas slurry and irrigation schemes. Int. J. Agric. Biol. 2019, 22, 1271–1278. [Google Scholar] [CrossRef]
- Cui, N. Efficient Water Use Mechanism and Application Patterns of Optimized Regulated Deficit Irrigation of Pear-Jujube Trees in Semi-Arid Region of Northwest China. Ph.D. Thesis, Northwest Sci-Tech University of Agriculture and Forestry, Yangling, Shanxi, China, 2009. [Google Scholar]
- Zheng, J.; Cai, H.; Wang, J.; Wang, Y. Fuzzy evaluation to integration benefit of regulated deficit irrigation of mini-watermelon based on information entropy. Trans. Chin. Soc. Agric. Mach. 2011, 42, 124–129. [Google Scholar]
- Golfam, P.; Ashofteh, P.; Rajaee, T.; Chu, X. Prioritization of water allocation for adaptation to climate change using multi-criteria decision making (MCDM). Water Resour. Manag. 2019, 33, 3401–3416. [Google Scholar] [CrossRef]
- Li, J.; Liu, Z.; Yao, Z.; Wang, R. Comprehensive assessment of coupled model intercomparison project phase 5 global climate models using observed temperature and precipitation over mainland Southeast Asia. Int. J. Climatol. 2019, 39, 4139–4153. [Google Scholar] [CrossRef]
- Li, M.; Sun, H.; Singh, V.; Zhou, Y.; Ma, M. Agricultural water resources management using maximum entropy and entropy-weight-based TOPSIS methods. Entropy 2019, 21, 364. [Google Scholar] [CrossRef]
- Liu, D.; Qi, X.; Qiang, F.; Li, M.; Zhu, W.; Zhang, L.; Faiz, M.; Khan, M.; Li, T.; Cui, S. A resilience evaluation method for a combined regional agricultural water and soil resource system based on weighted mahalanobis distance and a Gray-TOPSIS model. J. Clean. Prod. 2019, 229, 667–679. [Google Scholar] [CrossRef]
- Wang, H.; Wang, X.; Bi, L.; Wang, Y.; Fan, J.; Zhang, F.; Hou, X.; Cheng, M.; Hu, W.; Wu, L.; et al. Multi-objective optimization of water and fertilizer management for potato production in sandy areas of northern China based on TOPSIS. Field Crops Res. 2019, 240, 55–68. [Google Scholar] [CrossRef]
- Luo, H.; Li, F. Tomato yield, quality and water use efficiency under different drip fertigation strategies. Sci. Hortic. Amst. 2018, 235, 181–188. [Google Scholar] [CrossRef]
- Zhang, Y.; Zhang, F.; Zhu, H.; Guo, P. An Optimization-Evaluation Agricultural Water Planning Approach Based on Interval Linear Fractional Bi-Level Programming and IAHP-TOPSIS. Water 2019, 11, 1094. [Google Scholar] [CrossRef]
- Saeidian, B.; Mesgari, M.; Pradhan, B.; Alamri, A. Irrigation Water Allocation at Farm Level Based on Temporal Cultivation-Related Data Using Meta-Heuristic Optimisation Algorithms. Water 2019, 11, 2611. [Google Scholar] [CrossRef]
- Aghajani, M.; Mostafazadeh-Fard, B.; Navabian, M. Assessing Criteria Affecting Performance of the Sefidroud Irrigation and Drainage Network Using TOPSIS-Entropy Theory. Irrig. Drain. 2017, 66, 626–635. [Google Scholar] [CrossRef]
- Hosseinzade, Z.; Pagsuyoin, S.; Ponnambalam, K.; Monem, M. Decision-making in irrigation networks: Selecting appropriate canal structures using multi-attribute decision analysis. Sci. Total Environ. 2017, 601, 177–185. [Google Scholar] [CrossRef] [PubMed]
- Chen, P. Effects of the entropy weight on TOPSIS. Expert Syst. Appl. 2021, 168, 13. [Google Scholar] [CrossRef]
- Jiang, X.; Zhao, Y.; Tong, L.; Wang, R.; Zhao, S. Quantitative Analysis of Tomato Yield and Comprehensive Fruit Quality in Response to Deficit Irrigation at Different Growth Stages. Hortscience 2019, 54, 1409–1417. [Google Scholar] [CrossRef]
- Keabetswe, L.; Shao, G.; Cui, J.; Lu, J.; Stimela, T. A combination of biochar and regulated deficit irrigation improves tomato fruit quality: A comprehensive quality analysis. Folia Hortic. 2019, 31, 181–193. [Google Scholar] [CrossRef]
- Liu, X.; Qi, Y.; Li, F.; Yang, Q.; Yu, L. Impacts of regulated deficit irrigation on yield, quality and water use efficiency of Arabica coffee under different shading levels in dry and hot regions of southwest China. Agric. Water Manag. 2018, 204, 292–300. [Google Scholar] [CrossRef]
- Liu, X.; Li, F.; Zhang, Y.; Yang, Q. Effects of deficit irrigation on yield and nutritional quality of Arabica coffee (Coffea arabica) under different N rates in dry and hot region of southwest China. Agric. Water Manag. 2016, 172, 1–8. [Google Scholar] [CrossRef]
- National Pharmacopoeia Committee. Pharmacopoeia of the People’s Republic of China, 1st ed.; China Medical Science and Technology Press: Beijing, China, 2010; pp. 20–21. [Google Scholar]
- Saaty, T. The Analytic Hierarchy Process; McGraw-Hill Company: New York, NY, USA, 1980; pp. 1–287. [Google Scholar]
- Saaty, T. Decision making with the analytic hierarchy process. Int. J. Serv. Sci. 2008, 1, 83–98. [Google Scholar] [CrossRef]
- Wang, F.; Kang, S.; Du, T.; Li, F.; Qiu, R. Determination of comprehensive quality index for tomato and its response to different irrigation treatments. Agr. Water Manag. 2011, 98, 1228–1238. [Google Scholar] [CrossRef]
- Chen, H.; Shang, Z.-H.; Cai, H.; Zhu, Y. An Optimum Irrigation Schedule with Aeration for Greenhouse Tomato Cultiva-tions Based on Entropy Evaluation Method. Sustainability 2019, 11, 4490. [Google Scholar] [CrossRef]
- Yang, H.; Cao, H.; Hao, X.; Guo, L.; Li, H.; Wu, X. Evaluation of tomato fruit quality response to water and nitrogen management under alternate partial root-zone irrigation. Int. J. Agric. Biol. Eng. 2017, 10, 85–94. [Google Scholar] [CrossRef]
- Wang, Y. Research on High Efficient Water Use and Regulated Deficit Irrigation Optimization of Isatis Indigotica in Hexi Oasis. Ph.D. Thesis, Gansu Agricultural University, Lanzhou, Gansu, China, 2018. [Google Scholar]
- Zhong, Y.; Fei, L.J.; Li, Y.B.; Zeng, J.; Dai, Z.G. Response of fruit yield, fruit quality, and water use efficiency to water deficits for apple trees under surge-root irrigation in the Loess Plateau of China. Agric. Water Manag. 2019, 222, 221–230. [Google Scholar] [CrossRef]
- Wang, Y. Systems Engineering, 2nd ed; Mechanical Industry Press: Beijing, China, 2003; pp. 130–140. [Google Scholar]
- Wei, G. Evaluation on comprehensive benefit of greenhouse watermelon regulated deficit irrigation based on combination weight TOPSIS model. Water Resour. Dev. Manag. 2018, 4, 23–27. Available online: https://kns.cnki.net/kns/brief/result.aspx?dbprefix=CJFQ (accessed on 30 November 2020).
- Xie, J.; Liu, C. Fuzzy Mathematics Method and Its Application, 2nd ed; Huazhong University of Science and Technology Press: Wuhan, Hubei, China, 2000. [Google Scholar]
Publisher’s Note: MDPI stays neutral with regard to jurisdictional claims in published maps and institutional affiliations. |
© 2021 by the authors. Licensee MDPI, Basel, Switzerland. This article is an open access article distributed under the terms and conditions of the Creative Commons Attribution (CC BY) license (https://creativecommons.org/licenses/by/4.0/).