Abstract
River valleys of the Central European Lowlands are the zones of the highest dynamics of morphogenic processes. In the case of areas affected by glacial processes, despite their lowland nature, often they also have a complex geological structure. Sub-alluvial bedrock, composed of erosion-resistant deposits, commonly forms morphological protrusions within them. Their presence significantly affects both the course of flood flows and the valley floor relief. Effective forecasting of fluvial processes in such valley reaches requires conducting research within the entire geomorphologically active zone, both in the channel and the floodplain. The effectiveness of such research should be enhanced by simultaneous use of several different remote sensing methods, including short-range remote sensing. The verification of this hypothesis was the aim of the presented works. Such methods were used in the study of morphodynamics of a Bug valley reach. This area is characterized by a complex geological structure. High-resolution multispectral satellite images (VHRs) and a digital elevation model (DEM) based on aerial laser scanning (ALS) were used to examine the terrain relief. The morphology of the river channel itself was determined based on a series of bathymetric measurements made by a research team. Due to induced climate change and increasing maximum flow values, it can be assumed that the effect of a geological structure in the Central European Lowlands will play an increasing role. The threat and losses associated with floods will also increase. Rational flood prevention requires improvement of remote sensing research methods in lowland river valleys, especially those with complex geological structures. The valley reach presented in this article is an example of such a landform.
1. Introduction
River valleys of lowland areas are the zones of the highest dynamics of morphogenic processes [1,2,3]. Disregarding the issue of activity of slope processes occurring along the edge zones of these landforms, the morphodynamics of the valleys are shaped by the dominant flows in the hydrological year and by the maximum flows. The nature of fluvial processes in river valleys is also rapidly changing in response to changes in the components of the hydrological regime of the drainage basin. In lowland areas, they most often result from climate evolution and increasing human impact [4,5,6,7]. River valleys also have unique natural and economic values [8], and therefore the management of these areas requires deep knowledge of processes and phenomena observed today and their natural constraints.
The morphodynamics of river valleys in lowland areas is usually the result of interrelated geomorphological, hydrological, and climatic factors [9,10]. Lowland river valleys are often recognized by geomorphologists, hydrologists, and hydrotechnicians as landforms with a simple geological structure and geomorphologically mature [11]. Their maturity should be manifested by the presence of a well-developed erosional base [12]. Their floodplains should be composed of a series of contemporary alluvia of significant thickness. However, many rivers of postglacial lowland areas covered in the Pleistocene past by ice sheets do not show a fully developed valley, despite their lowland landscapes [13]. The Polish Lowlands, which are part of a wide belt of Central European lowlands, is such an example. Along the course of river valleys, such as the Vistula or the Bug, the occurrence of morphological protrusions of rocks composing the direct basement of contemporary alluvia is commonly recorded within their floodplains. Their presence results from the resistance of the sub-alluvial bedrock to erosion and is very often associated with the glacial origin of the area and frequently with the presence of glaciotectonic deformation [14,15,16].
During low and medium flows, the bedrock protrusions are hidden under a layer of river-channel alluvial deposits. However, during flood flows, when the flow energy increases, their surface can be exposed at the channel bottom from under the alluvial layer. In such cases, the morphology of the top of sub-alluvial bedrock determines not only the constant pattern of thalweg lines in the river channel during subsequent floods, but also affects the location of places where the flood waters invade the floodplain [17]. Therefore, the specific river channel morphology and the very complex valley floor relief are also the effect of geological structures. The importance of diversity in the resistance of sediments located within the range of river erosion for the morphodynamics of individual sections of valleys is discussed in fluvial literature [18,19,20]. The characteristic floodplain relief landforms are therefore geospatially associated in many places with sub-alluvial bedrock protrusions [17,21]. Some types of the landforms indicate flood flow directions within the floodplain, and some, due to their lithology, are privileged paths of groundwater percolation through the alluvial layer [22,23]. As evidenced by research carried out in valleys of large rivers of the Polish Lowlands—the Vistula, Bug, and Narew rivers—repeated failures of hydrotechnical constructions and levees are associated with this morphodynamic specificity [24].
For managing river valleys properly and limiting the risk and effects of floods, it is important to analyze effectively the relief and morphodynamics of the entire geomorphologically active part of the valley, i.e., of the channel zone and floodplain. Widely understood remote sensing methods are very good tools for such analysis [24,25,26,27,28]. In recent years, close-range remote sensing has become increasingly important. In the case of analysis of floodplains and emerged channel landforms, methods based on LIDAR (Light Detection and Ranging) laser scanning (aerial laser scanning (ALS) and terrestrial laser scanning (TLS)) are useful. Echo sounders integrated with GNSS (Global Navigation Satellite Systems) receivers [29] and acoustic Doppler current profiler (ADCP) devices [30,31] enable examining the main channel and other landforms filled with water.
The paper presents the application of remote sensing methods, including close-range remote sensing, to study the relief of the Bug River valley that shows a complex geological structure, as well as complex floodplain morphodynamics. High-resolution multispectral satellite images (VHRs) and a digital elevation model (DEM) based on data from airborne laser scanning (ALS) were used to recognize the characteristic morphological features. The river channel morphology itself was determined based on a series of bathymetric measurements made by the author’s team.
The essence of the research hypothesis was the assumption that only a joint analysis of various remote sensing data enables the identification of the morphodynamic specificity of a section of a lowland river valley. Due to the climate change observed and the related increasing maximum flow values [32,33], it should be supposed that the role of the effect of geological structures within river valleys of the Central European Lowlands will increase. The threat and losses associated with the occurrence of the flood phenomenon will also increase [32,34,35,36]. Effective prevention of such phenomena requires improving the tools and methods of remote sensing research of river valley bottoms, many of which are characterized by a complex geological structure. An example of such a landform is presented in this article.
2. Materials and Methods
2.1. Study Area
A valley of a large river in the Polish Lowlands was selected for study. Cyclic overbank flows occur in this valley, which are associated mainly with ice-dam and snowmelt floods [37]. The works were carried out in reach of the Bug Valley, within a zone of its Podlasie Gorge (Eastern Poland), stretching from the Polish-Belarusian border to the village of Mierzwice (Figure 1). A review of archival materials indicated that the selected section is characterized by a complex geological structure. This is evidenced by its gorge-like nature and the occurrence of intense glaciotectonic deformation within the neighboring upland area [38]. The extent of complexity of the geological structure is also evidenced by the presence of Upper Cretaceous chalk rocks outcrops in the edge zone of the upland at Mielnik [39].
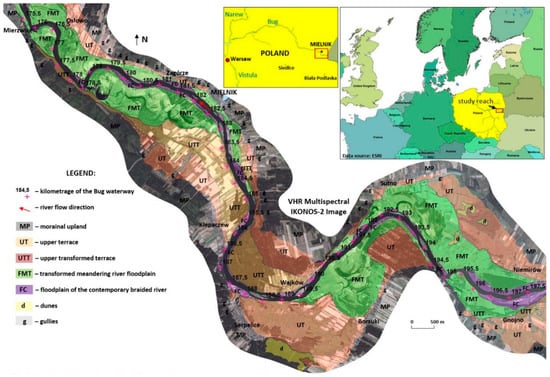
Figure 1.
Location of the study reach and its orthophotomap, with main landforms borders.
The peculiarity of the study area is the lack of significant factors that could disturb the natural morphogenic activity of flood waters, as the area is poorly developed. In the valley reach under study, the river channel was neither engineered nor leveed. There were no hydrotechnical constructions and bridges, and no flood protection facilities [40,41]. Therefore, the floodplain area was still active geomorphologically. Thus, this river valley sector could be considered as a reference for assessing the effectiveness of using remote sensing methods to study the relief and morphodynamics of lowland river valleys with a complex geological structure.
2.2. Field Studies
2.2.1. Geological Drillings
In order to identify the geological structure of the Bug River channel, 81 boreholes were drilled in the main river channel down to a depth of 11 m measured from the average water level. The average distance between the drillings, measured along the thalweg line, was about 300 m. On the basis of these drillings, the thickness and lithology of alluvial deposits, as well as the depth of occurrence and lithology of their immediate substrate, were determined.
2.2.2. Bathymetric Mapping
Bathymetric mapping covered the river channel sectors with a total length of 14.5 km, which was more than half the length of the section studied. Hydrographic measurements were made under conditions of mean water levels (118–118.5 m a.s.l. in the gauge station, Zabuże) and mean flows (90–100 m3·s−1) in the river channel. In order to verify the correctness and to determine the longevity of the components of the channel floor morphology, the measurements were repeated over a distance of 6.5 km after 2.5 months under similar hydrological conditions.
To complete the bathymetric measurements, a hydrographic set consisting of an echo sounder (Ohmex ‘SonarLite’, Ohmex Ltd., Hampshire, UK) integrated with a DGPS receiver (Magellan FX324 Map Color) was used. The DGPS receiver operated in the European Geostationary Navigation Overlay Service (EGNOS) system. The echo sounder worked in the frequency range of 190–210 KHz and the beamwidth was 100. For all measurements, the speed of generated pulses was 1470 m/s, and the minimum depth of the channel allowing for a reliable measurement was 0.5 m. The hydrographic sets were installed on a small shallow-draft pontoon, 4.2 m in length.
The integrated measuring set allowed for simultaneous recording of the water depth at a given point on the river and the corresponding rectangular coordinates, XY. Interpolation of point depth measurements was performed using the Surfer 10 program (using the kriging method) [29]. The measuring points obtained using the echo sounder were supplemented before interpolation, with additional points determined on the basis of field measurements and analysis of remote sensing materials. They were located on the banks of both the river and the channel mesoforms, as well as within submerged forms at a depth of less than 0.5 m. The hydrographic set and the method of post-processing of measurement data enabled the construction of bathymetric maps of the river channel. For the readability of the channel bottom morphology, the isobaths run every 0.25 m. Bathymetric maps in the form of vector information layers are included in the GIS database for a joint analysis with remote sensing materials and geological survey results.
2.2.3. Geomorphological Mapping
Geomorphological mapping of the valley floor was carried out using mobile GIS technology and GNSS receivers. During the mapping, performed in parallel with bathymetric measurements, the boundaries of both the main channel and the mesoforms—mainly islands stabilized by vegetation—were determined. In the next stage of field research, the correctness of the identification of the valley floor landforms was verified based on remote sensing materials. In addition, photographic documentation and morphometric measurements, mainly depth and relative height, of the most characteristic landforms were made.
2.3. Remote Sensing Studies
Remote sensing materials were represented by high-resolution multispectral satellite images and a digital terrain model based on airborne laser scanning (ALS).
The first stage of workflow was an initial identification of valley floor landforms on the basis of high-resolution multispectral satellite imaging (VHR) acquired by the IKONOS-2 satellite. The analysis included acquisition of images in July and August 2007 for the needs of research project No. 2P04E06929, carried out at the Hydrogeological Division of the Department of Geotechnical Engineering at Warsaw University of Life Sciences (SGGW). The data were sourced simultaneously from panchromatic images with a spatial resolution of 0.82 m and from multispectral images with a resolution of 4 m and 1 m in four ranges of radiation (blue, green, red, and near-infrared light). In order to identify the examined landforms, photointerpretation of the orthophotomap was carried out independently in two different color compositions; natural (RGB) and unnatural, including near-infrared (NRG). On this basis, the boundary of the Bug valley floor and the boundaries of individual terraces have been determined (Figure 1), and the characteristic relief types have been identified.
The second stage of workflow was the valley floor relief analysis based on a digital elevation model (DEM) derived from the State Geodetic and Cartographic Resource of the Head Office of Geodesy and Cartography. The source data were ASCII XYZ GRID files containing coordinates (X, Y, Z) of points in a regular 1-m mesh grid. These points have been interpolated based on a point cloud from airborne laser scanning (ALS), carried out as part of the ISOK project. The scanning density was between 4 and 6 points per square meter. The root mean square (RMS) errors were 0.5 m for the XY coordinates (XYRMS) and 0.15 m for the height measurement Z (ZRMS), respectively. In order to identify relief landforms and compare their image with the picture in satellite images, colors were assigned to individual elevation (DEM) classes. The color scale was chosen in such a way as to accentuate the differences in elevation within the range corresponding to the minimum and maximum values of the floodplain surface ordinates. Based on the DEM, morphometric measurements of selected relief landforms and terrain profiles in zones of their occurrence were made. The remote sensing operations were performed using ArcMap and 3DAnalyst programs, which are part of the Esri ArcGIS 10.2.1 package.
2.4. Data Analysis
Remote sensing materials and the results of remote sensing and field works were entered for joint analysis into the GIS database in the form of raster and vector information layers. The most important information layers were an orthophotomap prepared based on satellite images in natural (RGB) and unnatural (NRG) colors, a digital elevation model (DEM) based on airborne laser scanning, bathymetric maps, and a layer containing the location of the top of sub-alluvial bedrock in the channel. A simplified workflow diagram is presented in Figure 2.
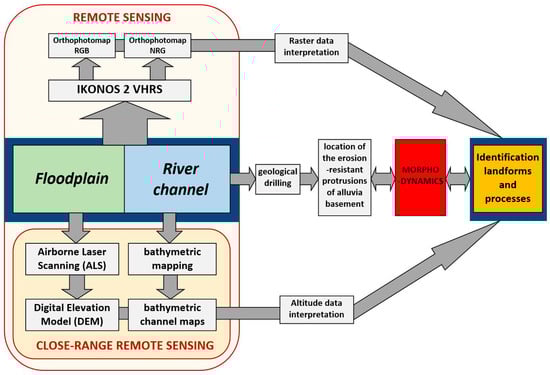
Figure 2.
Simplified scheme of works carried out.
The main part of geomorphological/geological/hydrological investigations were accomplished in the frame of the project mentioned above (2005–2008). ALS images were accomplished in 2012. During this time, the morphology of the floodplain haven’t been changed, which has been confirmed during field inspections curried out regularly till today.
3. Results
3.1. Results of Remote Sensing and Geological Research of the Channel Zone
The Bug in the study reach shows its nature to be that of a sinuous lowland river. The sinuosity index of the investigated section is 1.47, calculated based on Formula [42]:
where Si is the channel sinuosity, Ir is the total length of the river, following its meandering route, and Id is the valley length. The mean channel gradient is 0.14‰, calculated based on Formula [42]:
where Jsr is the mean channel gradient, Hmax is the water level elevation at the beginning of the study reach, Hmin is the water level elevation at the end of the study reach, and l is the channel length. The channel width varies from 50 to 260 m, ranging from 80 to about 200 m over most of the reach.
Si = Ir/Id
Jsr = [Hmax − Hmin]/l
The average channel depth along the entire reach covered by bathymetric measurements (calculated as an arithmetic mean from all 100,533 depth measurements) is 1.33 m. In the zones of sub-alluvial bedrock protrusions, the channel depth is small and usually does not exceed 2 m. The shallowest zones are located near islands stabilized by vegetation, namely at the village of Serpelice-Wajków (km 188.0–189.8) and between km 192.6 and km 194.2. Relatively short zones with the greatest channel depth (up to 6 m) are located at the channel’s three largest narrowings, where the river flows in the immediate vicinity of the upland edge (km 176.0, 178.5, 195.0). The channel does not form a typical arcuate meander there, but is positioned almost at a right angle to the edge (Figure 1, Figure 3, Figure 4 and Figure 5). The main thalweg path in the river reaches covered by bathymetric measurements was clearly visible and durable, which was confirmed by repeated echo-sounding surveys.
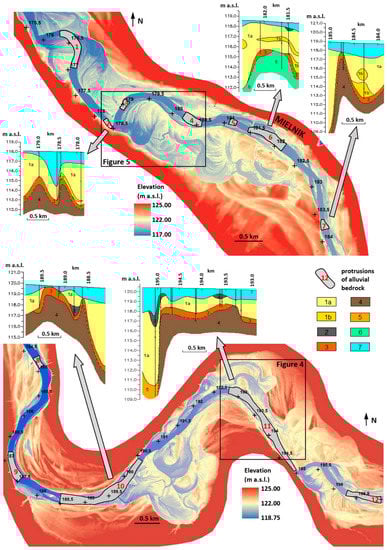
Figure 3.
Location of sub-alluvial bedrock protrusions on the background of valley morphology/ the digital elevation model (DEM). For the chosen protrusions geological cross-sections perpendicular to the channel axis are shown. Explanations: Contemporary Bug River alluvia: 1a—sands, 1b—gravels, 2—muds; sub-alluvial bedrock: 3—residual channel-lag deposits, 4—glacial tills, 5—gravels, 6—chalk; 7—water.
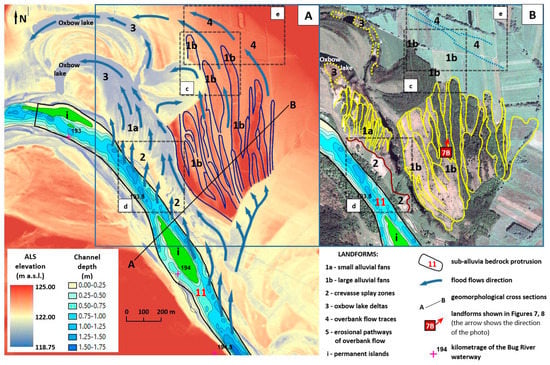
Figure 4.
The Bug valley morphology between km 193.5 and km 194.5 of the river course visible in the digital elevation model (DEM) from aerial laser scanning (ALS) (A) and high-resolution multispectral satellite images (B), as well as bathymetric maps. Arrows show flood flow directions.
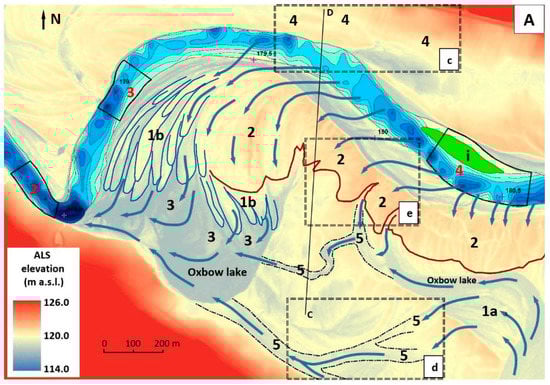
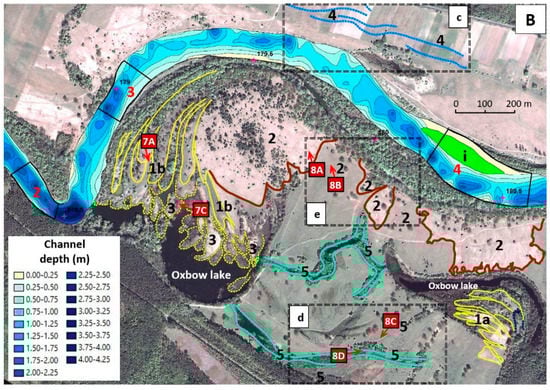
Figure 5.
The Bug valley morphology between km 178 and km 180.5 of the river course visible in the digital elevation model (DEM) from ALS (A) and high-resolution multispectral satellite images (B), as well as bathymetric maps. Arrows show flood flow directions. Further explanations in Figure 4.
Geological research conducted in the study reach of the Bug River channel has enabled the identification of 12 sub-alluvial bedrock protrusions composed of rocks highly resistant to erosion (Figure 3). The sub-alluvial bedrock was most often represented by moraine deposits—boulder clay covered by a residual lag. For the purposes of this research, it was assumed that the protrusion zone is a part of river channel, where the top of sub-alluvial bedrock is located at a depth of less than 3 m below the average water level. The basic data on the protrusions are presented in Table 1.

Table 1.
Basic data on the protrusions of alluvial bedrock in the channel.
3.2. Results of Floodplain Relief Analysis
The width of the Bug valley is variable in the study reach and ranges from 0.9 to 2.9 km. At its bottom, a Pleistocene upper (over-flood) terrace and a Holocene floodplain can be distinguished [38,43,44,45]. Based on the analysis of satellite images and field work, an upper terrace (UT) and an upper transformed terrace (UTT) have been identified within the Pleistocene terrace. The former occurs some 8–14 m above the mean water level, while the surface of the latter is about 7 m above the mean water level.
The floodplain has been subdivided into a transformed meandering river floodplain (FMT) and a floodplain of the contemporary braided river (FC) (Figure 1). The youngest component of the floodplain is the floodplain of the contemporary braided river (FC). It immediately adjoins the Bug River channel and occurs alongside it as a discontinuous narrow, 20–300 m wide strip (Figure 1). Much of it is represented by ancient large-sized channel mesoforms (fixed by island vegetation) that were included in the floodplain due to the disappearance of side channels. This terrace has a flat surface and its individual parts rise to an altitude of 0.5 to 4 m above the mean water level. The uppermost part of the FC is a natural levee occurring at its edge.
The floodplain’s most extensive and most important part for remote sensing surveys is the transformed meandering river floodplain (FMT). It occurs in the upper (km 189–197.5) and lower (km 175–185) parts of the study reach, where it either adjoins the main river channel or is separated from it by a narrow strip of FC (Figure 1). FMT rises 1.5–6 m above the mean water level and has a significant width, which exceeds 1 km in many places. Between km 190 and km 191, it is about 1.5 km wide and makes up almost the entire surface of the valley bottom.
Six specific very large-sized relief landforms have been identified in the valley floor, which developed as a result of very intense activity of flood waters. The depositional landforms are represented by small alluvial fans (1a), large alluvial fans (1b), crevasse splay zones (2), and deltas in oxbow lakes (3), and the erosional ones are represented by overbank flow traces (4) and erosional pathways of overbank flow (5).
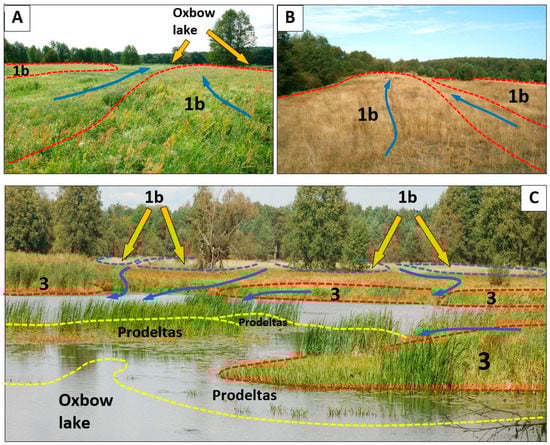
- The alluvial fans (1) are elongated, finger-like landforms consisting of sand bodies, the bases of which face up the river. They occur either on the FMT terrace or, less often, on UTT. Depending on the size, small alluvial fans (1a) and large alluvial fans (1b) have been identified (Figure 4, Figure 5, Figure 6 and Figure 7A,B). The former reach about 200 m in length and the width of single sand bodies is up to 30 m. The dimensions of the latter are 400 m and 50 m, respectively. However, the largest identified landform 1b is much greater in size—its length exceeds 1 km. Landforms 1a and 1b developed due to accumulative activity of flood waters and are probably the result of catastrophic flood flows.
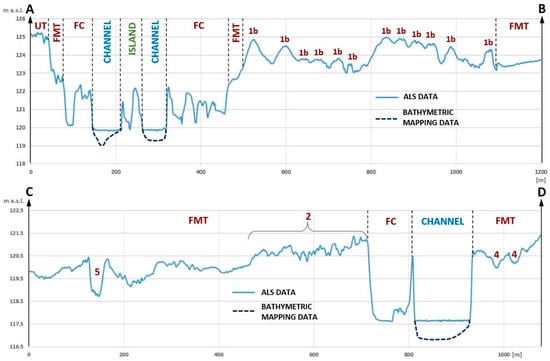 Figure 6. Geomorphological cross-sections drawn from the LIDAL (ALS) and bathymetric mapping data.
 - The crevasse splay zones (2) are sand body zones that occur in the proximal part of the floodplain, often in the immediate vicinity of the main channel on the FMT terrace (Figure 4, Figure 5, and Figure 8A,B). Their width frequently exceeds 200 m and the length can be even one kilometer (Figure 5). They developed as a result of deposition of material transported by flood water overflowing through natural levees. They are composed of mineral soils (mainly sands) (Figure 8A) and are therefore covered with poor vegetation, mainly with single pines. Therefore, these landforms are characterized by a bright phototone in satellite images in both color compositions (Figure 4B and Figure 5B).
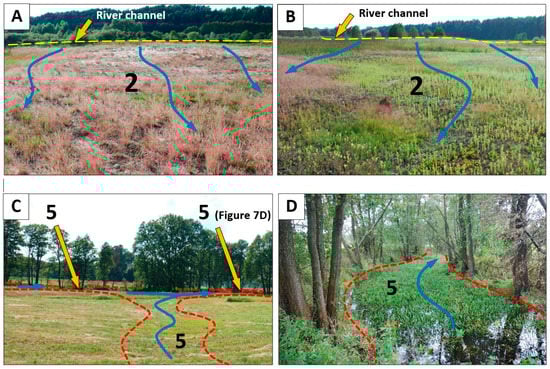 Figure 8. Pictures of selected landforms 2 and 5 (locations are shown in Figure 5; explanations in text).
 - The oxbow lake deltas (3) are flat fans deposited in oxbow lakes and composed of material transported by floodwaters that act as watercourses during cyclic floods. They occur in oxbow lakes located in both the distal and proximal parts of the FMT terrace (Figure 4, Figure 5, and Figure 7C). In the study reach, landforms at various stages of development have been identified, including those formed in their forefield of prodelta (Figure 4, Figure 5, and Figure 7C). The older landforms often exceed 50 m in size, while the prodeltas are much smaller, and some parts of them are hidden under the water surface (Figure 7C).
- The overbank flow traces (4) developed as a result of erosive activity of flood waters that adapted (for their flow routes) and reshaped various types of depressions occurring on the FMT or UTT terraces. They are characterized by an elongated, often slightly bent shape and occur in groups of landforms parallel to both each other and the main channel (Figure 4). The width of individual overbank flow traces (4) ranges from about 20 to 100 m, and the length from 50 to 950 m. Their depth usually does not exceed 1 m. Combined with large dimensions, it makes them difficult to identify in the field. These forms are not filled with water.
- The erosional pathways of overbank flow (5) developed as a result of intense and concentrated flow of flood waters. These are elongated, narrow, and usually branched depressions, often located in the proximal part of the floodplain (Figure 5 and Figure 8C,D). The width of individual erosional troughs of flood flows ranges from about 15 to 100 m and the length varies from about 100 to 800 m. They are characterized by a considerable depth, locally exceeding 2 m, and represent wetlands partly covered with water. Their edges are overgrown with bushes and trees, among which alders dominate.
4. Discussion
In the process of identifying the complex relief of contemporary alluvial plains, especially floodplain surfaces, remote sensing methods, mainly analysis of aerial images, have been used for many years [46,47,48]. Since 1999, when the first commercial high-resolution satellite imaging system was placed in orbit, a number of images with a spatial resolution of <1 m (very high resolution), which can be considered useful in this type of research, have been available [11,15,22]. The next milestone in remote sensing research of such areas was the emergence of LIDAR technology, allowing the creation of digital terrain models. In the case of vast valleys, aerial laser scanning (ALS) is particularly useful, while the use of terrestrial laser scanning (TLS), despite its higher spatial resolution and accuracy, still faces many limitations [49].
The valleys of major rivers in the Polish Lowlands are extensive areas, some of them 10 km wide. Despite slight relief variations, most of the landforms can be commonly considered to have a very complicated relief. This is the result of natural evolution of the river and its channel and of multiple contemporary overbank flows of variable nature, intensity, and course. The variety of hydrological conditions result from the genetic diversity of flood surges. These include ice-dam, snowmelt, and rainfall floods. Such phenomena occur cyclically in the areas of these valleys. An additional factor affecting the floodplain morphodynamics of river valley reaches is the geological structure of the channel zone [16,17,23,50].
The floodplain (FC, FMT, and UTT) in the study reach of the Bug valley is characterized by a complex relief. It comprises many types of landforms, which are readable on remote sensing materials. The landforms differ in their size, relative height/depth, and geological structure. This fact results from a significant degree of morphogenetic naturalness of this surface. The channel and overbank processes here run freely and are not constrained by hydrotechnical structures, in particular by levees (cf. [51,52]). This means that, apart from the nature of hydrological phenomena, the main factor affecting the floodplain morphodynamics is the geological structure of the Bug River channel. However, its impact intensity changes in line with the evolution of the Bug River system (see [46]), thus the transformed meandering river floodplain (FMT) is the most morphologically diverse part of the valley floor. Its surface has been almost completely changed as a result of the cyclic processes of erosion and accumulation associated with the activity of contemporary flood flows (cf. [4,53]).
In addition to factors related to the hydrological regime of the river, channel flows can be influenced by other factors, such as the presence of bedrock outcrops [9], vegetation growing on the banks of the riverbed [54], or large wood debris carried into the channel during intense surface runoff [55,56,57]. In the case of the Bug valley, the channel geology is such a factor.
Protrusions of the top of the bedrock of contemporary alluvial deposits, composed of highly erosion-resistant rocks, have been found along the entire reach of the Bug River channel under study. Their distribution is spatially related to the above-described relief landforms. Therefore, these protrusions significantly affect the morphology of both the river channel itself (the thalweg path course) and the flow of flood waters on the floodplain surface (cf. e.g., [58,59,60]). During flood surges, the patency of the river channel is limited not only due to the low thickness of alluvial deposits and the resulting low possibilities of its deepening, but also due to the presence of stable islands that formed on hardly erodible sediments. As a result of damming the flood waters in such zones, depositional forms of surprisingly large sizes develop (Figure 4, Figure 5 and Figure 6) [61,62]. An example are the alluvial fans composed of a number of finger-like bars located at km 193.5. The maximum length of landform 1b is 1100 m, and its width is 590 m (Figure 4). The maximum widths of individual sand bars that constitute this landform exceed 60 m, and their relative heights exceed 3 m (Figure 4 and Figure 6). Similar depositional forms, whose formation is related to the impact of alluvial bedrock, were found in the other Polish Lowlands rivers (e.g., [23,63,64]). In many cases, the influence of the components of the geological structure of the river channel has led to the formation of a whole set of related forms. An example of such a set is observed in the region of km 179. There is an extensive crevasse splay (2) gradually passing into finger-shaped alluvial fans (1b) (Figure 5 and Figure 7C). The material deposited on their foreland during high water levels was gradually filling an oxbow lake located in this zone, which resulted in the development of clearly visible deltas (3) and smaller prodeltas (Figure 5 and Figure 7C). The dimensions of this depositional zone, which consists of landform types 1b, 2, and 3, are almost 1 × 1 km.
Specific and constant directions of floodwater flows are also recorded as a series of depressions consisting of oxbow lakes and erosional troughs of flood waters (5), often connecting the proximal and distal parts of the floodplain (Figure 5 and Figure 7C).
The legibility of boundaries of the landforms identified in satellite images is different from that on the digital terrain model. The finger-shaped bars that are practically invisible on a satellite image are an example. The reason for this is the masking of the components of their relief by the plant cover (land use mode) (Figure 4Bc). The landform boundaries are very visible on the digital terrain model (Figure 4Ac). On the other hand, signs of flood flows (4), which are hardly visible in the DEM (Figure 4e and Figure 5c), can be identified in satellite images as darker streaks, due to the phototonal diversity of soils that differ in humidity.
To determine correctly the boundaries/range of sand deposition zones, such as crevasse splays (2), a simultaneous analysis of both types of remote sensing data (Figure 4d and Figure 5d) should be made. In a situation where landform 2 has been partially transformed by agrotechnical operations, in this case ploughing, satellite images are a more effective identification tool (Figure 4Bd). A brighter phototone of freshly exposed mineral soils is clearly visible in them. If the same landform has not been anthropogenically transformed, it is much more visible in the DEM due to its sharper morphological boundaries (Figure 5Ae). Its grass-covered parts are also difficult to identify correctly in satellite images (Figure 5Be and Figure 8B).
In the case of erosional troughs of flood flows (5), only deeper parts of these landforms, expressed by a clearly darker phototone, are visible in satellite images (Figure 5B). Their margins are usually covered with alder, which further facilitates correct identification of the boundaries. Proper identification of shallower and drier sections of erosional troughs of flood flows (5) requires a thorough analysis of DMT (Digital Elevation Model) within a very narrow elevation range of approx. 0.5 m (Figure 5Ad). In LIDAR images, oxbow lake deltas (3) are also very poorly visible, while prodeltas are invisible (Figure 4 and Figure 5). The reason for this is the very low relative height of these, often subtle, forms, which frequently rise only 0.2–0.4 m above the water surface at medium levels, with a significant part being under water (Figure 7C).
Identification of boundaries of very large landforms of floodplain relief requires a simultaneous analysis of raster and elevation data, i.e., aerial or satellite images and DEM. In the analysis, it is important for various remote sensing materials to have the same or similar spatial resolution. In the case of the studied satellite and DEM images, the spatial resolution (ground sampling distance) was 1 m and proved to be sufficient for correct interpretation of the valley floor relief. The location of landform boundaries was verified during field work and carried out using mobile GIS.
The proper identification of landforms is not possible by means of object classification and requires a more precise [65] manual classification due to the complex nature of valley floor relief.
The distribution of both erosional and depositional landforms, especially in the distal part of the floodplain, which is modelled only during the maximal flows, is closely related to riverbed morphology (Figure 4 and Figure 5). Currently, the riverbed relief can be identified only during direct bathymetric measurements, for example using an echo sounder. The main thalweg lines and the associated deepest zones, including plunge pools, are clearly visible on bathymetric maps. Their identification has allowed both defining correctly the origin of landforms identified on the floodplain surface and determining the main routes of flood waters. However, a thorough study of the relationship between the distribution of velocity of floodwater flow and the geological structure of the channel zone requires acoustic Doppler current profiler (ADCP) measurements. The authoring team is planning such measurements next year. The concentration of the floodwater stream, constrained by the geological structure, is probably the main reason for the formation of landforms whose size often exceeds five times the maximum width of the main river channel.
In order to correctly identify fluvial processes in a valley floor, it is necessary to analyze the morphology and geological structure of both the channel and the floodplain. This postulate imposes, at the final stage of work, the need for joint analysis of remote sensing data obtained by various, frequently very different methods. For technical and financial reasons, acquisition of such data at the same time is usually not possible. This is due to the time resolution of satellite systems and the cost of taking digital aerial images and ALS. In the case of satellite or aerial images, the sensitivity of remote sensors to atmospheric conditions, predominantly to cloud cover, is also a limitation. However, due to the specificity of the relief and geological structure of river valleys in the Polish Lowlands, it is crucial to obtain all data in the most similar hydrological and phenological situations.
5. Conclusions
Along the entire study reach of the Bug River valley, there are protrusions of the top of erosion-resistant sub-alluvial bedrock. During flood flows, they are exposed from under the alluvial cover and then their morphology affects both the riverbed morphology and the direction of floodwater flow on the floodplain. The effect of this interaction is a series of characteristic very large-sized landforms that can be identified in remote sensing materials with a spatial resolution of 1 m.
Proper identification of relief landforms and correct determination of their boundaries in a river valley with a complex geological structure require a joint analysis of high-resolution multispectral satellite images and DEM developed on the basis of airborne laser scanning (ALS). The use of only one type of these data does not provide the correct interpretation, which has been confirmed by the results of field studies.
Studies of the morphodynamics of a valley floor require a joint analysis of its entire geomorphologically active part, i.e., both the channel and the floodplain. In the case of the valley reach under study, it was necessary to compare orthophotomaps in two color compositions, DEM, and bathymetric maps. In order to properly analyze these materials, source data for their implementation should be obtained under similar hydrological and phenological conditions.
The research methods presented in this article can probably be applied to other large lowland rivers of Poland and maybe of Europe. In the case of reaches where the floodplain is bordered by levees, it is possible to predict places with increased probability of levee failure occurrence on the basis of such analysis.
The characteristic relief landforms, geospatially linked to the culminations of the top of sub-alluvial bedrock, can be treated as a remote sensing indicator of the occurrence of such zones. Their identification by means of short-range remote sensing, e.g., using an unmanned aerial vehicle (UAV), can reduce the costs of geological surveys and support the broadly defined actions to reduce the risk and effects of floods.
Author Contributions
Conceptualization, P.O. and T.F.; methodology, P.O. and T.F.; software, P.O. and T.F.; validation, T.F. and P.O.; formal analysis, T.F. and P.O.; investigation, P.O. and T.F.; r, P.O. and T.F.; data curation, P.O. and T.F.; writing—original draft preparation, P.O. and T.F.; writing—review and editing, P.O. and T.F.; visualization, P.O. and T.F.; supervision, T.F.; project administration, T.F. and P.O.; funding acquisition, T.F. All authors have read and agreed to the published version of the manuscript.
Funding
Grant No. 2P04E 069 29 by Scientific Research Committee (KBN)—geological drilling, bathymetric mapping, high-resolution multispectral satellite imaging (VHR) by the IKONOS-2.
Conflicts of Interest
The authors declare no conflict of interest.
References
- Woolman, M.G.; Miller, J.P. Magnitude and frequency of forces in geomorphic processes. J. Geol. 1960, 68, 54–74. [Google Scholar] [CrossRef]
- Twindale, C.R. River pattern and their meaning. Earth Sci. Rev. 2004, 67, 159–218. [Google Scholar] [CrossRef]
- Fryirs, K.; Brierley, G. Geomorphic Analysis of River Systems; Wiley-Blackwell: Chichester, UK, 2013; pp. 1–345. [Google Scholar]
- Falkowski, E. Variability of channel processes of lowland rivers in Poland and changes of the valley floors during the Holocene. Biul. Geol. 1975, 19, 45–78. [Google Scholar]
- Vandenberghe, J. Changing fluvial processes under changing periglacial conditions. Z. Fur. Geomorphol. NF 1993, 88, 17–28. [Google Scholar]
- Blum, M.D.; Tornqvist, T.E. Fluvial responses to climate and sea-level change: A review and look forward. Sedimentology 2000, 47, 2–48. [Google Scholar] [CrossRef]
- Gregory, K.J. The human role in changing river channels. Geomorphology 2006, 79, 172–191. [Google Scholar] [CrossRef]
- Macklin, M.G.; Lewin, J. The rivers of civilization. Q. Sci. Rev. 2015, 114, 228–244. [Google Scholar] [CrossRef]
- Gregory, K.J.; Benito, G.; Downs, P.W. Applying Fluvial geomorphology to river channel management: Background for progress towards a paleohydrology protocol. Geomorphology 2008, 98, 153–172. [Google Scholar] [CrossRef]
- Vanderberghe, J. The relation between climate and river processes, landforms and deposits during the Quaternary. Q. Int. 2002, 91, 17–23. [Google Scholar] [CrossRef]
- Church, M. Channel morphology and typology. In The River Handbook; Callow, P., Petts, G.E., Eds.; Blackwell: Oxford, UK, 1992; pp. 126–143. [Google Scholar]
- Mackin, J.H. Concept of graded river. Geol. Soc. Am. Bull. 1948, 59, 463–512. [Google Scholar] [CrossRef]
- Falkowska, E. Sorption of Pb and Cd by sediments of the polygenetic river valleys of the eastern part of the Polish Lowland. Geol. Q. 2003, 47, 169–186. [Google Scholar]
- Ber, A. Vertical stress of the Pleistocene continentals glaciers and its hypothetical evidence in present relief of Northern Europe. Pol. Geol. Inst. Spec. Pap. 2009, 25, 7–12. [Google Scholar]
- Falkowska, E. Glacial morphogenesis of uplands of the Warta Glaciation in Poland as a control on heavy metal distribution in deposits. Geol. Q. 2009, 53, 293–304. [Google Scholar]
- Falkowski, T.; Ostrowski, P.; Siwicki, P.; Brach, M. Channel morphology changes and their relationship to valley bottom geology and human interventions; a case study from the Vistula Valley in Warsaw, Poland. Geomorphology 2017, 297, 100–111. [Google Scholar] [CrossRef]
- Falkowski, T. Factors of Natural Stability of the Middle Vistula River Channel Zone; Wydawnictwo SGGW: Warszawa, Poland, 2006; (In Polish with English summary). [Google Scholar]
- Piègay, H.; Darby, S.E.; Mosselman, E.; Surian, N. A reviewof techniques available for delimiting the erodible river corridor: A sustainable approach to managing bank erosion. River Res. Appl. 2005, 21, 773–789. [Google Scholar] [CrossRef]
- Heitmuller, F.T.; Hudson, P.F.; Asquith, W.H. Lithologic and hydrologic controls of mixed alluvial-bedrock channels in flood-prone fluvial systems: Bankfull and mackrochannels in the Llano River watershed, central Texas, USA. Geomorphology 2015, 232, 1–19. [Google Scholar] [CrossRef]
- Keller, E.A.; Bean, G.; Best, D. Fluvial geomorphology of a boulder-bed, debris-flow—Dominated channel in an active tectonic environment. Geomorphology 2015, 243, 14–26. [Google Scholar] [CrossRef]
- Falkowski, T.; Ostrowski, P. Morphogenesis of the Vistula River Valley Floodplain in the Vicinity of Magnuszew (Middle Course) Estimation with Usage of Aero and Satellite Photographs; Infrastruktura i Ekologia Terenów Wiejskich, Polska Akademia Nauk, Oddział w Krakowie: Kraków, Polish, 2010; Volume 9, pp. 89–100. (In Polish) [Google Scholar]
- Sieczka, A.; Bujakowski, F.; Falkowski, T.; Koda, E. Morphogenesis of a Floodplain as a Criterion for Assessing the Susceptibility to Water Pollution in an Agriculturally Rich Valley of a Lowland River. Water 2018, 10, 399. [Google Scholar] [CrossRef]
- Bujakowski, F.; Falkowski, T. Hydrogeological Analysis Supported by Remote Sensing Methods as A Tool for Assessing the Safety of Embankments (Case Study from Vistula River Valley, Poland). Water 2019, 11, 266. [Google Scholar] [CrossRef]
- Wierzbicki, G.; Ostrowski, P.; Falkowski, T.; Mazgajski, M. Geological setting control of flood dynamics in lowland rivers (Poland). Sci. Total Environ. 2018, 636, 367–382. [Google Scholar] [CrossRef]
- Mertes, L.A.K.; Daniel, D.L.; Melack, J.M.; Nelson, B.; Martinelli, L.A.; Forsberg, B.R. Spatial patterns of hydrology, geomorphology, and vegetation on the floodplain of the Amazon river in Brazil from a remote sensing perspective. Geomorphology 1995, 1, 215–232. [Google Scholar] [CrossRef]
- Douglas, E.A. Water Storage of the Central Amazon Floodplain Measured with GIS and Remote Sensing Imagery. Ann. Assoc. Am. Geogr. 2003, 93, 55–66. [Google Scholar]
- Syvitski, J.P.M.; Overeem, I.; Brakenridge, G.R.; Hannon, M. Floods, floodplains, delta plains—A satellite imaging approach. Sediment. Geol. 2012, 267–268, 1–14. [Google Scholar] [CrossRef]
- Wierzbicki, G.; Ostrowski, P.; Mazgajski, M.; Bujakowski, F. Using VHR multispectral remote sensing and LIDAR data to determine the geomorphological effects of overbank flow on a floodplain (the Vistula River, Poland). Geomorphology 2013, 183, 73–81. [Google Scholar] [CrossRef]
- Ostrowski, P. GIS and GPS application of hydrographic research carried out for engineering-geological documentation purposes (in example of large lowland river channel and artificial pond). Zesz. Nauk. Politech. Białostockiej—Bud. 2006, 28, 239–247, (In Polish with English summary). [Google Scholar]
- Banasiak, R.; Krzyżanowski, M. Flood flows in the Odra River in 2010–Quantitative and qualitative assessment of ADCP data. Meteorol. Hydrol. Water Manag. 2015, 3, 11–20. [Google Scholar] [CrossRef]
- Gaurav, K.; Tandon, S.K.; Devauchelle, O.; Sinha, R.; Métivier, F. A single width–discharge regime relationship for individual threads of braided and meandering rivers from the Himalayan Foreland. Geomorphology 2017, 295, 126–133. [Google Scholar] [CrossRef]
- Blöschl, G.; Hall, J.; Parajka, J.; Perdigão, R.A.P.; Merz, B.; Arheimer, B.; Aronica, G.T.; Bilibashi, A.; Bonacci, O.; Borga, M.; et al. Changing climate shifts timing of European floods. Science 2017, 357, 588–590. [Google Scholar] [CrossRef]
- Hajdukiewicz, H.; Wyżga, B.; Amirowicz, A.; Oglęcki, P.; Radecki-Pawlik, A.; Zawiejska, J.; Mikuś, J. Ecological state of a mountain river before and after a large flood: Implications for river status assessment. Sci. Total Environ. 2018, 610–611, 244–257. [Google Scholar] [CrossRef]
- Alfieri, L.; Burek, P.; Feyen, L.; Forzieri, G. Global warming increases the frequency of river floods in Europe. Hydrol. Earth Syst. Sci. 2015, 19, 2247–2260. [Google Scholar] [CrossRef]
- Forzieri, G.; Feyen, L.; Russo, S.; Vousdoukas, M.; Alfieri, L.; Outten, S.; Migliavacca, M.; Bianchi, A.; Rojas, R.; Cid, A. Multi-hazard assessment in Europe under climate change. Clim. Chang. 2016, 137, 105–119. [Google Scholar] [CrossRef]
- O’Keeffe, J.; Marcinkowski, P.; Utratna, M.; Piniewski, M.; Kardel, I.; Kundzewicz, Z.W.; Okruszko, T. Modelling Climate Change’s Impact on the Hydrology of Natura 2000 Wetland Habitats in the Vistula and Odra River Basins in Poland. Water 2019, 11, 2191. [Google Scholar] [CrossRef]
- Mierkiewicz, M.; Sasim, M. Warunki formowania się odpływu—Powodzie i susze. In Rzeka Bug Zasoby Wodne i Przyrodnicze; Dojlido, J., Kowalczewski, W., Miłaszewski, R., Ostrowski, J., Eds.; IMGW & WSEiZ: Warszawa, Polish, 2001; pp. 56–71. (In Polish) [Google Scholar]
- Nitychoruk, J.; Dzierżek, J.; Stańczuk, D. Objaśnienia do Szczegółowej Mapy Geologicznej Polski w Skali 1: 50,000, Arkusz 532—Janów Podlaski; Państwowy Instytut Geologiczny: Warszawa, Polish, 2006. (In Polish) [Google Scholar]
- Bieda, E. Otwornice przewodnie i wiek kredy piszącej Mielnika. Biul. Inst. Geol. 1958, 121, 17–70. (In Polish) [Google Scholar]
- Kozłowski, S.; Wojciechowski, K. Międzynarodowa ochrona Doliny Bugu. In Proceedings of the VI Międzynarodowa Konferencja Naukowa zagospodarowanie zlewni Bugu i Narwi w ramach zrównoważonego Rozwoju, Warszawa–Popowo, Warszawa, Polish, 23–24 May 2003. (In Polish). [Google Scholar]
- Rąkowski, G. Transgraniczna ochrona przyrody w dolinie Bugu. Rzeka Bug zasoby wodne i przyrodnicze. Część IV—Środowisko Przyr. Atlasy Monogr. IMGW 2003, 368–389. (In Polish) [Google Scholar]
- Schumm, S.A. The Fluvial System; Wiley & Sons: Hoboken, NJ, USA, 1977. [Google Scholar]
- Janicki, T. Szczegółowa Mapa Geologiczna Polski w Skali 1:50,000, Arkusz 496-Stacja Nurzec; Państwowy Instytut Geologiczny: Warszawa, Polish, 1999. (In Polish) [Google Scholar]
- Albrycht, A. Szczegółowa Mapa Geologiczna Polski w Skali 1:50,000, Arkusz 531-Sarnaki; Państwowy Instytut Geologiczny: Warszawa, Polish, 2001. (In Polish) [Google Scholar]
- Nitychoruk, J.; Dzierżek, J.; Stańczuk, D. Szczegółowa Mapa Geologiczna Polski w Skali 1: 50,000, Arkusz 532—Janów Podlaski; Państwowy Instytut Geologiczny: Warszawa, Polish, 2003. (In Polish) [Google Scholar]
- Falkowski, E. Evolution of the Holocene Vistula from Zawichost to Solec with an engineering-geological prediction of further development. Biul. Inst. Geol. 1967, 198, 57–148, (In Polish with English summary). [Google Scholar]
- Ehlers, M.; Jankowsky, R.; Gähler, M. New Remote Sensing Concepts for Environmental Monitoring. Remote Sensing for Environmental Monitoring. GIS Applications and Geology. Proc. SPIE 2002, 4545, 1–12. [Google Scholar]
- Langat, P.K.; Kumar, L.; Koech, R. Monitoring river channel dynamics using remote sensing and GIS techniques. Geomorphology 2019, 325, 92–102. [Google Scholar] [CrossRef]
- Brach, M.; Choromański, J. Terrestrial Laser Scanning (TLS) as a detection method of the natural river valley microtopography-case study of the Upper Biebrza. Ann. Wars. Univ. Life Sci.-Sggw Land Reclam. 2014, 46, 267–278. [Google Scholar] [CrossRef]
- Falkowska, E.; Falkowski, T. Trace metals distribution pattern in floodplain sediments of a lowland river in relation to contemporary valley bottom morphodynamics. Earth Surf. Process. Landf. 2015, 40, 876–887. [Google Scholar] [CrossRef]
- Gendaszek, A.S.; Magirl, C.S.; Czuba, C.R. Geomorphic response to flow regulation and channel and floodplain alteration in the gravel-bedded Cedar River, Washington, USA. Geomorphology 2012, 179, 258–268. [Google Scholar] [CrossRef]
- Chin, A.; Gregory, K.J. Managing urban river channels adjustments. Geomorphology 2005, 69, 28–45. [Google Scholar] [CrossRef]
- Starkel, L. The reflection of hydrologic changes in fluvial environment of the temperate zone during the last 15.000 years. In Background to Paleohydrology; Gregory, J., Ed.; Wiley: Chichester, UK, 1983; pp. 213–234. [Google Scholar]
- Bejarano, M.D.; Sordo-Ward, A.; Marchamalo, M.; Del Tángo, M.G. Geomorphological controls on vegetation responses to flow alteration in a meditarenian stream (Central-Western Spain). River Res. Applic. 2013, 29, 1237–1252. [Google Scholar] [CrossRef]
- Brierley, G.J.; Fryirs, K.A. Geomorphology and River Management. Application of the River Styles Framework; Blackwell Publications: Oxford, UK, 2005; p. 416. [Google Scholar]
- Gurnell, A. State of science plants as river engineers. Earth Surf. Process. Landf. 2014, 39, 4–25. [Google Scholar] [CrossRef]
- Ruiz-Villanueva, V.; Wyżga, B.; Zawiejska, J.; Hajdukiewicz, M.; Stoffel, M. Factors controlling large-wood transport in a mountain river. Geomorphology 2016, 272, 21–31. [Google Scholar] [CrossRef]
- Tooth, S.; McCarthy, T.S.; Brandt, D.; Hancox, P.J.; Morris, R. Geological controls on the formation of alluvial meanders and floodplainwetlands: The example of The Klip River, Eastern Free State, South Africa. Earth Surf. Process. Landforms 2002, 27, 797–815. [Google Scholar] [CrossRef]
- Migiros, G.; Bathrellos, G.D.; Skilodimou, H.D.; Karamousalis, T. Pinios (Peneus) river (Central Greece): Hydrological-geomorphologic elements and changes during the Quaternary. Cent. Eur. J. Geosci. 2011, 3, 215–228. [Google Scholar] [CrossRef]
- Warner, R.F. A morphological study of Durance River Terraces from Tallard to Avignon, South-East France. Cent. Eur. J. Geosci. 2012, 4, 357–375. [Google Scholar] [CrossRef]
- Bristow, C.S.; Skelly, R.L.; Ethridge, F.G. Crevasse splays from the rapidly aggrading, sand-bed, braided Niobrara River, Nebraska: Effect of base level rise. Sedimentology 1999, 46, 1029–1047. [Google Scholar] [CrossRef]
- Pierce, A.R.; King, S.L. Spatial dynamics of overbank sedimentation in floodplain systems. Geomorphology 2008, 100, 256–268. [Google Scholar] [CrossRef]
- Ostrowski, P.; Falkowski, T. The application of the Very High Resolution multispectral satellite images (VHR) for the recognition of the chosen floodplain. Przegląd. Geol. 2016, 12, 810–817, (In Polish with English summary). [Google Scholar]
- Falkowski, T. Basement of the alluvia influence on the channel pattern in example of selected reach of the Pilica River. Ann. Wars. Univ. Life Sci.–Sggw Land Reclam. 2010, 42, 93–104. [Google Scholar] [CrossRef]
- Abburu, S.; Golla, S.B. Satellite Image Classification Methods and Techniques: A Review. Int. J. Comput. Appl. 2015, 119, 20–25. [Google Scholar] [CrossRef]
© 2020 by the authors. Licensee MDPI, Basel, Switzerland. This article is an open access article distributed under the terms and conditions of the Creative Commons Attribution (CC BY) license (http://creativecommons.org/licenses/by/4.0/).