Abstract
In this work, we examined spatial and temporal trends for light rain days based on daily precipitation measurements, obtained from 1960 to 2014, from 590 meteorological stations in China. For the analyzed time interval, light rain days over eastern China were determined to decrease by 0.23 days·year−1. In western China, they increased by 0.3 days·year−1. To detect underlying causes for changes in light rain days, lower-tropospheric relative humidity was set as a proxy for light rain days. We then calculated the respective impacts of lower-tropospheric temperature and specific humidity on changes in light rain days. A comparison of the contributions of temperature and specific humidity resulted in the identification of the main cause of changes. Our results indicated that increases in lower-tropospheric temperatures reduced light rain days over the entire country, while variations in specific humidity dominated regional differences for light rain day trends.
1. Introduction
Global warming has been estimated to increase the content of atmospheric water vapor and to accelerate the hydrological cycle [1,2,3]. Global mean annual precipitation has increased in recent decades and is thought to be related to global warming [4]. Such changes are based on the Clausius–Clapeyron equation, which roughly describes a 7% increase in atmospheric moisture storage potential per degree Kelvin [5,6,7].
Average precipitation has not displayed significant trends over China, although, in recent years, obvious regional changes have been documented [8,9,10,11]. Decreases in precipitation have been observed for northeast China [12], northern China [13], the Yangtze River Basin [14], and the Loess Plateau [15]. Increases have been documented for northwest China [12,16]. Many studies have focused on regional variations that can lead to the extreme precipitation that causes local flooding over a short period of time and that results in tremendous economic loss [12,17,18].
To date, only a few studies have explored changes in light precipitation. Light precipitation allows more time for water to soak into soils and results in little surface runoff and stream flow, leaving soils much wetter at the end of an event [19]. A reduction in light precipitation has also been stated to be partly responsible for recent droughts in arid and semi-arid regions within China [20,21]. From 1973 to 2009, decreasing trends for light rain events have been observed in North America, Europe, and Asia, especially in eastern Asia [22]. Previous studies have led researchers to conclude that light precipitation days have significantly decreased over eastern China (east of 100° E) [8,21,23,24,25,26].
In terms of causes for decreases in light precipitation, Qian et al. [23] indicated that it is currently more difficult for warmer air to reach the dew-point temperature, thereby reducing trace and light rain events under a warming environment. Fu et al. [24] attributed decreasing trends to warming and stated that higher temperatures could increase the condensation height of precipitable clouds and reduce cloud abundance such that trace or slight precipitation days were reduced. Based on observational evidence and simulation results, Yun et al. [21] suggested that significant increases in aerosol concentrations produced by air pollution were at least partly responsible for the decrease in light rain events observed in China over the past 50 years. According to a study by Liu et al. [8], declining solar irradiance and total cloud cover, as well as increased aerosol loading, may contribute to the abrupt decrease in light precipitation events over China. Research conducted based on the Weather Research and Forecasting (WRF) simulations model by Wu et al. [27] indicated that soil moisture-atmospheric coupling was important for explaining variations in summer light precipitation events over eastern Asia. Huang and Wen [25] argued that global warming weakens atmospheric stability such that upward motion strengthens while precipitation intensity increases and light rain events decrease.
Despite the research outlined above, no consensus currently exists for describing differences in the spatial and temporal patterns of light rain. The study by Wu et al. [26] introduced a new method for setting relative humidity as a proxy for light rain, and determined that both monthly lower-tropospheric warming and water vapor content during the warm season were responsible for annual light rain reduction over eastern China. To date, this method has only been used over eastern China where light rain decreased. Different from eastern China, in this manuscript, we found that over western China, light rain significantly increased. However, the method by Wu et al. [26] suitable for increased light rain was uncertain, and the effects of lower-tropospheric warming and water vapor content on the increase of light rain were still unclear.
To gain a deeper understanding of the physical mechanism responsible for changes in light rain, we applied the method introduced by Wu et al. [26] and determined influencing factors over the whole of China. The goals of this work were to (1) detect spatial and temporal trends in light rain days and regional differences in China; (2) analyze the relationship between relative humidity and light rain days; and (3) determine the primary cause for changes in light rain days.
2. Materials and Methods
2.1. Data
The data employed in this study consisted of observational data obtained from meteorological stations and reanalysis data obtained from the ERA-Interim dataset during the warm season from May to October. On average, rain during the warm season contributes approximately 76% of annual precipitation over China.
Daily precipitation data acquired from weather stations, from 1960 to 2014, were obtained from the China Meteorological Administration (CMA) (http://data.cma.cn/). Of the 752 meteorological stations within the network, 590 were selected by considering data integrity, consistency, and the time duration of measurements. Overall, the stations are well distributed. Exceptions include those located within the Taklimakan and Gurbantunggut Deserts (within Xinjiang) and the Tibetan Plateau (Figure 1a).
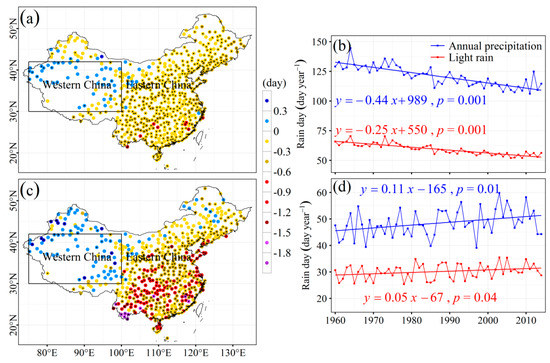
Figure 1.
Spatial and temporal trends in annual precipitation days and light rain days for the warm season from 1960 to 2014 over China and the sub-regions (western and eastern China). (a) The spatial distribution of trends for annual precipitation days; (b) temporal trends for annual precipitation days and light rain days over eastern China; (c) the spatial distribution of trends for light rain days; and (d) temporal trends for annual precipitation days and light rain days over western China. Black dots at stations represent significance at the 0.05 level.
ERA-Interim is the latest global atmospheric reanalysis produced by the European Centre for Medium-Range Weather Forecasts (ECMWF). The ERA-Interim project is an improved version and replaces ERA-40 [28,29]. Monthly data used in this study included relative humidity (RH), specific humidity (SH), temperature from 1000 to 500 hPa (16 pressure levels), and surface pressure with a spatial resolution of 0.75° × 0.75° from 1979 to 2014.
2.2. Methodology
Precipitation intensity is defined as the amount of precipitation that occurs within a 24-h period. In the process of this analysis, daily precipitation <0.1 mm·day−1 was discarded from the analysis according to Chinese standard precipitation gauge guidance. In previous studies, various types of methods have been used for classifying precipitation into different intensity events (light, moderate, heavy, and extreme). For example, according to widely used China Meteorological Administration standards, daily precipitation is classified into five groups: light (0.1–10 mm per day), moderate (10–25 mm), heavy (25–50 mm), storm (50–100 mm), and downpour (>100 mm). However, this fixed threshold approach may not be suitable for various regions because fixed threshold values can dramatically vary from arid to humid regions.
In this study, we employed the method introduced by Song, et al. [12] for defining light precipitation. In this method, daily precipitation at each station from 1960 to 2014 was first sorted from smallest to largest. Sums for precipitation amounts were then equally divided into three fractions and two threshold values were determined. Precipitation less than the first threshold was defined as light precipitation. Precipitation greater than the first threshold and less than the second threshold was defined as moderate precipitation. Precipitation greater than the second threshold was defined as heavy precipitation. This approach may be used to determine different thresholds for dissimilar regions.
All of the daily precipitation events (≥0.1 mm·day−1) at one station from 1960 to 2014 were first sorted from smallest to largest to form a series composed of X1, X2, ..., Xm, ..., Xn. Then, the threshold value of light rain is given by
The daily precipitation event Xm is the threshold value of light rain for this station. Daily precipitation events less than Xm were defined as light precipitation events.
Due to its robustness for non-normally distributed data, the nonparametric Mann–Kendall test [30], as proposed by the World Meteorological Organization, has been widely used for detecting trends in meteorological factors [31,32]. In this study, the Mann–Kendall test was employed in order to test the significance of trends (at 95% confidence). The nonparametric Sen’s method [33] is employed to calculate the trends for precipitation. Additionally, to match the ERA-Interim data, the IDW (Inverse Distance Weighted) method was utilized to interpolate station data into gridded data with a spatial resolution of 0.75° × 0.75°. IDW is a type of deterministic method for multivariate interpolation with a known scattered set of points. The assigned values to unknown points are calculated with a weighted average of the values available at the known points. The IDW method is suitable for our analysis, which intended to detect the regional differences of precipitation trend.
To understand the relationship and the physical mechanism for light rain, we used RH, temperature, and SH, as well as the Clausius–Clapeyron and RH equations. The Clausius–Clapeyron Tetens equation is:
where es is the saturation vapor pressure (hPa) over water and T is the temperature (K), and:
where esi is the saturation vapor pressure (hPa) over ice.
es (T) = 6.108 exp[17.269(T – 273.16)/(T – 38)]
esi (T) = 6.112 exp[17.67(T – 273.16)/(T – 29.66)]
Vapor pressure was determined using:
where e is the vapor pressure (hPa), q is the specific humidity (g/kg), and p is the atmospheric pressure (hPa).
e (q, p) = q p/(0.622 + 0.378q)
Relative humidity was calculated according to the following equation:
where RH is the relative humidity (%).
RH (T, q, p) = e (q, p)/es (T)
Lower-tropospheric elements (RH, temperature, and specific humidity) from the surface to 500 hPa were averaged according to the mass-weighted average equation:
where e indicates lower-tropospheric elements.
As Equation (4) indicates, RH is determined based on temperature and SH. An approach introduced by Karl and Knight (1998) and Song et al. (2015) was then used for calculating the respective effects of temperature and SH on changes in RH. The temperature component, RHtem, was calculated as follows:
where SHaverage is the average SH (g/kg) and Temperaturetrend is the trend in Temperature (K). The SH component, RHsh, was calculated using:
where RHtotal is the trend rate for RH.
RHtem = f (Temperaturetrend, SHaverage)
RHsh = RHtotal – RHtem
To determine the primary cause of changes in light rain, the contribution of temperature, Contributiontem, was calculated based on:
Contributiontem = RHtem/RHtotal * 100
The contribution of SH, Contributionsh, was calculated using:
Contributionsh = RHsh/RHtotal * 100
3. Results
3.1. Spatial and Temporal Trends for Light Rain Days
Spatial and temporal trends for light rain days during the warm season and annual precipitation days from 1960 to 2014 over China were determined using the Mann–Kendall test method and linear least squares fitting based on observations from the 590 stations. The two sub-regions (western and eastern China) were defined according to spatial trends in light rain days. The results revealed a significant reduction in light rain days over eastern China and a significant increase for western China.
As shown in Figure 1a, light rain days for the 534 stations exhibited a decreasing trend, with significance (p < 0.05) occurring at 418 stations. Most of the stations with decreasing trends were located within eastern China. A reduction in the trend decreased from the north (less than 0.3 day·year−1) to the south (more than 0.6 day·year−1), roughly corresponding to the distribution of mean annual precipitation. Light rain days for the 56 stations increased with a rate of approximately 0.3 day·year−1. Thirteen stations displayed a significant trend (p < 0.05). Most stations with increasing trends were located in western China (Figure 1a). As indicated in Figure 1c, the spatial distribution of trends for annual precipitation days was similar to that for light rain days.
In eastern China, annual precipitation days exhibited a significant decrease of 0.44 day·year−1 (p = 0.001) and light rain days exhibited a significant decrease of 0.23 day·year−1 (p = 0.001). Light rain days accounted for 53.3% of the trend in annual precipitation (Figure 1b). In western China, annual precipitation days significantly increased by 0.11 day·year−1 (p = 0.01) and light rain days significantly increased by 0.05 day·year−1 (p = 0.04). Light rain days accounted for 45.4% of the trend in annual precipitation (Figure 1d). The results revealed a significant decrease for light rain days over eastern China and an increase in western China.
3.2. Correlation between Lower-Tropospheric RH and Light Rain Days
Spatial and temporal trends in lower-tropospheric RH were detected over China using ERA-Interim data from 1960 to 2014. Our results indicated that RH significantly decreased over eastern China and significantly increased over western China. A correlation between lower-tropospheric RH and light rain days was also identified.
Similar to the spatial distribution of trends for light rain days (Figure 1a), RH over eastern China decreased with a regional averaged rate of −0.13%·year−1 (p < 0.05). An increase with a rate of 0.06% ·year−1 was determined for western China (p < 0.05) (Figure 2a).
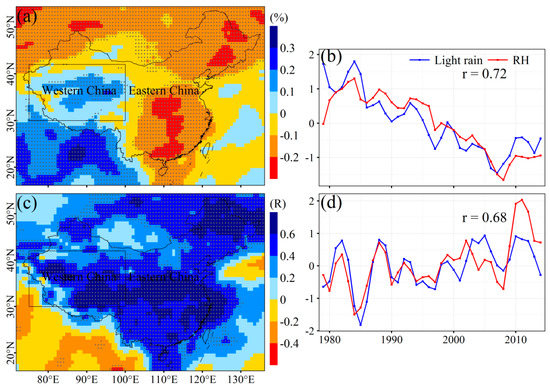
Figure 2.
Spatial and temporal trends in lower-tropospheric relative humidity (RH) and the correlation between RH and light rain days in the warm season from 1960 to 2014 over China and the sub-regions (western and eastern China). (a) The spatial distribution of RH trends; (b) a comparison of normalized RH with normalized light rain days over eastern China; (c) the spatial distribution of the correlation between RH and light rain days; and (d) a comparison of normalized RH to normalized light rain days over western China. Black dots in the pixels represent significance at the 0.05 level.
To compare ERA-Interim data, station data for light rain days were interpolated to match the grids of ERA-Interim data. A correlation analysis was then undertaken in order to examine the relationship between light rain days and RH. RH was determined to be positively correlated with light rain days in eastern China, with a correlation coefficient of 0.72 (p < 0.05). The correlation was 0.68 (p < 0.05) for western China. Furthermore, there were similar changes among RH and light rain days (Figure 2b,d). The analysis results indicated a close relationship between RH and light rain days.
3.3. Spatial and Temporal Trends for Lower-Tropospheric Temperature and Water Vapor Content (SH)
We investigated spatial and temporal trends for temperature and water vapor content (SH) using ERA-Interim data from 1979 to 2014 for China. Increased lower-tropospheric temperature occurred over the entire country, while trends in SH displayed obvious regional differences.
As indicated in Figure 3a,b, lower-tropospheric temperature significantly increased over the entire country, with a regional averaged rate of 0.02 K·year−1 (p < 0.001) for eastern China and 0.01 K·year−1 (p < 0.001) for western China. The spatial pattern of trends in SH displayed clear regional differences that were similar to light rain days and RH. The SH over eastern China decreased by 0.004 g/g·year−1. Over western China it increased at a rate of 0.01 g/g·year−1.
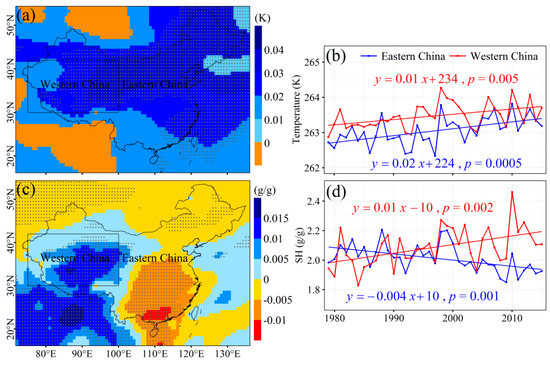
Figure 3.
Spatial and temporal trends in lower-tropospheric temperature and specific humidity (SH) from 1960 to 2014 over China and the two sub-regions (western and eastern China). (a) The spatial distribution for trends in temperature; (b) temporal trends in temperature over western and eastern China; (c) the spatial distribution for the trend in SH; and (d) temporal trends for SH over western and eastern China. Black dots in the pixels represent significance at the 0.05 level.
3.4. Effects of Temperature and Water Vapor Content to Changes in RH
By combining Equations (2)–(5), we determined that only two lower-tropospheric elements (temperature and SH) had an impact on RH variations. RH decreased when temperature increased and RH increased when SH increased, and vice versa. The approach introduced by Karl and Knight (1998) and Song et al. (2015) was employed for calculating the respective effect of SH and temperature to changes in light rain days over China. The main cause was identified by comparing the contributions of temperature and SH.
Along with increased lower-tropospheric temperatures, RH decreased over the entire country, with rates of up to −0.3%·year−1. RH decreased from northeast to west and southwest (Figure 4a). The pattern was similar to lower-tropospheric temperature (Figure 3a). The influence of lower-tropospheric SH to changes in RH over China is provided in Figure 4b. Due to variations in SH, the RH changed. Rates ranged from 0.3% to −0.26%·year−1. The spatial pattern (Figure 4b) was similar to lower-tropospheric SH (Figure 3b).
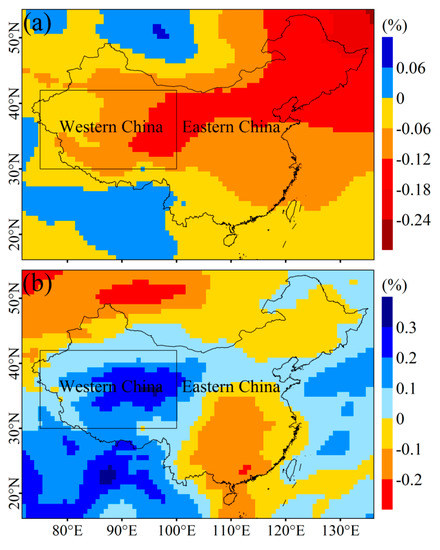
Figure 4.
Changes in lower-tropospheric RH induced by temperature and SH from 1960 to 2014 over China. (a) Changes in RH induced by temperature; and (b) changes in RH induced by SH.
A comparison of the contributions of temperature and SH to RH change was performed in order to determine the main factor responsible for trends. Contributions from temperature were calculated according to Equation (9). Contributions from SH were calculated according to Equation (10). If a contribution was determined to be more than 50%, the factor was considered to be a dominant one for changes in RH, while a value of less than 50% indicates a non-dominant factor. A negative value indicates that the contribution is the opposite of changes in RH.
According to the spatial distribution of the contribution, eastern China was divided into two regions: (1) a northern region (NEC), roughly north of 35° N; and (2) a southern region (SEC) (Figure 5). Figure 5 provides the distribution of contributions at the pixel scale. Figure 6 displays regional statistics regarding the effects, as well as the contribution from temperature and SH. Lower-tropospheric warming reduced RH across China (Figure 4a) and was considered to be a deterministic cause for the decline in RH over the entire country, eastern China, and NEC with contributions of 131%, 76%, and 105%, respectively (Figure 6).
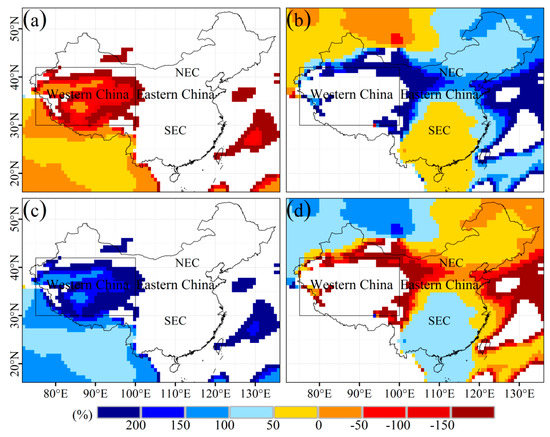
Figure 5.
The spatial distribution for proportions of lower-tropospheric temperature and SH contributing to changes in RH from 1960 to 2014 over China. (a) Proportions of temperature contributing to changes in RH over regions where RH exhibited an increasing trend; (b) proportions of temperature over regions where RH exhibited a decreasing trend; (c) proportions of SH over regions where RH exhibited an increasing trend; and (d) proportions of SH over regions where RH exhibited a decreasing trend.
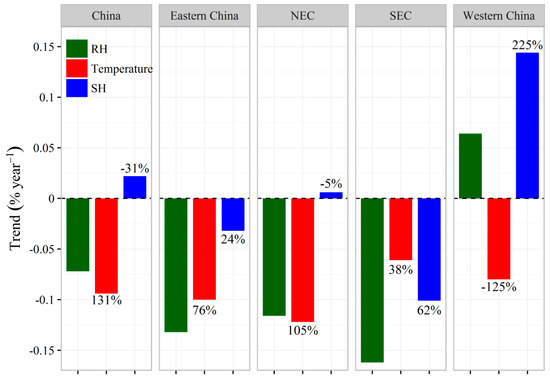
Figure 6.
The regional contributions of lower-tropospheric temperature and SH contributing to changes in RH from 1960 to 2014 over China and its sub-regions.
As shown in Figure 5c, an increase in RH largely occurred over western China. All of the contributions from SH over regions with an increase in RH were more than 50%. The mean contribution of temperature was −125%. The SH contribution was 225%. The SH contribution indicated that the increase in SH eliminated the counterproductive effect from increased lower-tropospheric temperature and resulted in a net increase in RH over western China (Figure 6). Over SEC, a decline in RH was primarily attributed to a decrease in SH with a contribution of 62%.
4. Discussion
Wu, et al. [26] determined a high correlation between lower-tropospheric RH and light rain days over eastern China where light rain days decreased and used lower-tropospheric RH as a proxy for understanding the underlying cause of changes in light rain days. In our work, lower-tropospheric RH was also determined to be highly correlated with light rain days over western China where light rain days increased. Our results suggest that increased lower-tropospheric temperature, with a contribution of 60%, was the main factor for light rain reduction over the northern region of eastern China. In general, this finding is consistent with the work of Wu, et al. [26] although SH, with a contribution of 60%, played a major role in the decrease of light rain days over southern regions of eastern China.
The work of Qian, et al. [23], Fu, et al. [34], Huang and Wen [25], and Liu, et al. [35] attributed the reduction of light rain days over eastern China to increases in lower-tropospheric temperatures that were capable of one or more of the following: (1) increasing the dew-point temperature; (2) causing a rise in the condensation height of precipitable clouds and reducing cloudage; and (3) weakening atmospheric stability and strengthening upward motion such that precipitation intensity increased and light rain events decreased. Nevertheless, universal increases in lower-tropospheric temperature cannot explain increasing trends in light rain events over western China. Some researchers have suggested that significant increases in aerosol concentrations due to air pollution are responsible for decreases in light rain events. Increases in aerosol concentrations can cause significant declines in raindrop concentrations and can delay raindrop formation because smaller cloud droplets are less efficient during collision and coalescence processes [8,21]. However, large uncertainties remain concerning the effect of aerosols on precipitation intensity [35]. Additionally, Liu, et al. [35] indicated that anthropogenic aerosols are not a major cause of light rain change over remote equatorial oceanic region where the effects of anthropogenic aerosols are lessened. In this work, lower-tropospheric temperature and SH were determined to have strong effects on light rain events. Increases in lower-tropospheric temperatures were determined to reduce light rain days over the entire country, while variations in SH resulted in regional trend differences for light rain days.
5. Conclusions
In this work, we detected spatial and temporal trends in light rain days over China from 1960 to 2014. To analyze the underlying causes of trends, lower-tropospheric RH was used as a proxy. The respective effects of lower-tropospheric SH and temperature on changes in light rain days were quantified and the main factor was detected by comparing the contributions of SH and temperature to changes in light rain days.
Light rain days over eastern China exhibited a significant decrease of 0.25 days·year−1. Over western China, they significantly increased with a rate of 0.05 days·year−1. Lower-tropospheric RH was highly correlated with light rain days and affected spatial and temporal trends over eastern and western China. Increases in lower-tropospheric temperatures were a deterministic cause for declines in light rain days over the entire country, with contributions of 131%. The contribution varied from 76% for eastern China and 105% for NEC. Increases in SH contributed 225% and resulted in increases in light rain days over western China. Over SEC, a decline in light rain days was largely determined by a decrease in SH, with a contribution of 62%. In conclusion, our results suggest that increases in lower-tropospheric temperatures reduced light rain days over the entire country of China. Variations in SH dominated regional trend differences for light rain days. Investigating light rain changes is helpful for understanding regional precipitation responses to regional climate change and global warming. Overall, the findings presented here may help the scientific community better understand changes in atmospheric precipitation.
Acknowledgments
Our research was supported by the National Natural Science Foundation of China (Grant No. 41561021) and Western Scholars of the Chinese Academy of Sciences (2015-XBQN-B-20). We also thank Qi Hu of the School of Natural Resources and the Department of Earth and Atmospheric Sciences, University of Nebraska-Lincoln, for valuable suggestions.
Author Contributions
Shikai Song provided datasets, performed the experiments, and wrote the paper; Zengyun Hu participated in revision; Changqing Jing designed the experiments.
Conflicts of Interest
The authors declare no conflict of interest in this manuscript. Sponsors had no role in the design of the study; in the collection, analyses, or interpretation of data; in the writing of the manuscript; or in the decision to publish results.
References
- Rahmstorf, S.; Coumou, D. Increase of extreme events in a warming world. Proc. Natl. Acad. Sci. USA 2011, 108, 17905–17909. [Google Scholar] [CrossRef] [PubMed]
- Kharin, V.V.; Zwiers, F.W.; Zhang, X.B.; Hegerl, G.C. Changes in temperature and precipitation extremes in the IPCC ensemble of global coupled model simulations. J. Clim. 2007, 20, 1419–1444. [Google Scholar] [CrossRef]
- Allan, R.P.; Soden, B.J. Atmospheric warming and the amplification of precipitation extremes. Science 2008, 321, 1481–1484. [Google Scholar] [CrossRef] [PubMed]
- Jones, P.; Trenberth, K.; Ambenje, P.; Bojariu, R.; Easterling, D.; Klein, T.; Parker, D.; Renwick, J.; Rusticucci, M.; Soden, B. Observations: Surface and atmospheric climate change. In Climate Change 2007: The Physical Science Basis. Contribution of Working Group I to the Fourth Assessment Report of the Intergovernmental Panel on Climate Change; Cambridge University Press: Cambridge, UK, 2007; pp. 235–336. [Google Scholar]
- Jones, R.H.; Westra, S.; Sharma, A. Observed relationships between extreme sub-daily precipitation, surface temperature, and relative humidity. Geophys. Res. Lett. 2010, 37, L22805–L22810. [Google Scholar]
- Lehmann, J.; Coumou, D.; Frieler, K. Increased record-breaking precipitation events under global warming. Clim. Chang. 2015, 132, 501–515. [Google Scholar] [CrossRef]
- Wasko, C.; Sharma, A. Steeper temporal distribution of rain intensity at higher temperatures within Australian storms. Nat. Geosci. 2015, 8, 527–530. [Google Scholar] [CrossRef]
- Liu, B.; Xu, M.; Henderson, M. Where have all the showers gone? Regional declines in light precipitation events in China, 1960–2000. Int. J. Climatol. 2011, 31, 1177–1191. [Google Scholar] [CrossRef]
- Song, Y.L.; Achberger, C.; Linderholm, H.W. Rain-season trends in precipitation and their effect in different climate regions of China during 1961–2008. Environ. Res. Lett. 2011, 6, 329–346. [Google Scholar] [CrossRef]
- You, Q.L.; Kang, S.C.; Aguilar, E.; Pepin, N.; Flügel, W.-A.; Yan, Y.P.; Xu, Y.W.; Zhang, Y.J.; Huang, J. Changes in daily climate extremes in China and their connection to the large scale atmospheric circulation during 1961–2003. Clim. Dyn. 2010, 36, 2399–2417. [Google Scholar] [CrossRef]
- Zhang, X.Y.; Cong, Z.T. Trends of precipitation intensity and frequency in hydrological regions of China from 1956 to 2005. Glob. Planet. Chang. 2014, 117, 40–51. [Google Scholar] [CrossRef]
- Song, S.K.; Li, L.H.; Chen, X.; Bai, J. The dominant role of heavy precipitation in precipitation change despite opposite trends in west and east of northern China. Int. J. Climatol. 2015, 35, 4329–4336. [Google Scholar] [CrossRef]
- Fan, L.; Lu, C.H.; Yang, B.; Chen, Z. Long-term trends of precipitation in the north China plain. J. Geograph. Sci. 2012, 22, 989–1001. [Google Scholar] [CrossRef]
- Zhang, Q.; Peng, J.T.; Xu, C.Y.; Singh, V.P. Spatiotemporal variations of precipitation regimes across Yangtze River Basin, China. Theor. Appl. Climatol. 2014, 115, 703–712. [Google Scholar] [CrossRef]
- Shen, C.; Qiang, H. Spatial and temporal variation of annual precipitation in a river of the loess plateau in China. J. Appl. Math. 2014, 2014, 1–11. [Google Scholar] [CrossRef]
- Wang, H.J.; Chen, Y.N.; Chen, Z.S. Spatial distribution and temporal trends of mean precipitation and extremes in the arid region, northwest of China, during 1960–2010. Hydrol. Process. 2013, 27, 1807–1818. [Google Scholar] [CrossRef]
- Zhang, Q.; Li, J.F.; Singh, V.P.; Xu, C.Y. Copula-based spatio-temporal patterns of precipitation extremes in China. Int. J. Climatol. 2013, 33, 1140–1152. [Google Scholar] [CrossRef]
- Wu, F.T.; Fu, C.B. Change of precipitation intensity spectra at different spatial scales under warming conditions. Chin. Sci. Bull. 2013, 58, 1385–1394. [Google Scholar] [CrossRef]
- Trenberth, K.E.; Dai, A.; Rasmussen, R.M.; Parsons, D.B. The changing character of precipitation. Bull. Am. Meteorol. Soc. 2003, 84, 1205–1217. [Google Scholar] [CrossRef]
- Yan, Z.; Yang, C. Geographic patterns of extreme climate changes in China during 1951–1997. Clim. Environ. Res. 2000, 5, 267–272. [Google Scholar]
- Yun, Q.; Gong, D.; Fan, J.; Ruby, L.L.; Ralf, B.; Chen, D.; Wang, W. Heavy pollution suppresses light rain in China: Observations and modeling. J. Geophys. Res. 2009, 114, 4427–4433. [Google Scholar]
- Qian, Y.; Gong, D.Y.; Leung, R. Light rain events change over North America, Europe, and Asia for 1973–2009. Atmos. Sci. Lett. 2010, 11, 301–306. [Google Scholar]
- Qian, W.H.; Fu, J.K.; Yan, Z.W. Decrease of light rain events in summer associated with a warming environment in China during 1961–2005. Geophys. Res. Lett. 2007, 34. [Google Scholar] [CrossRef]
- Fu, J.; Qian, W.; Lin, X.; Chen, D. Trends in graded precipitation in China from 1961 to 2000. Adv. Atmospheric Sci. 2008, 25, 267–278. [Google Scholar]
- Huang, G.; Wen, G. Spatial and temporal variations of light rain events over china and the mid-high latitudes of the northern hemisphere. Chin. Sci. Bull. 2013, 58, 1402–1411. [Google Scholar]
- Wu, J.; Zhang, L.; Zhao, D.; Tang, J. Impacts of warming and water vapor content on the decrease in light rain days during the warm season over eastern China. Clim. Dyn. 2014, 45, 1841–1857. [Google Scholar]
- Wu, L.Y.; Zhang, J.Y.; Huang, G. The role of soil moisture-atmosphere coupling in summer light precipitation variability over East Asia. Atmos. Sci. Lett. 2012, 13, 296–302. [Google Scholar]
- Dee, D.P.; Uppala, S.M.; Simmons, A.J.; Berrisford, P.; Poli, P.; Kobayashi, S.; Andrae, U.; Balmaseda, M.A.; Balsamo, G.; Bauer, P.; et al. The era-interim reanalysis: Configuration and performance of the data assimilation system. Q. J. R. Meteorol. Soc. 2011, 137, 553–597. [Google Scholar]
- Berrisford, P.; Dee, D.P.; Fielding, K.; Fuentes, M.; Kållberg, P.W.; Kobayashi, S.; Uppala, S.M. The ERA-Interim Archive; European Centre for Medium-Range Weather Forecasts: Reading, UK, 2009. [Google Scholar]
- Farlie, D.J.G. Rank correlation methods. J. R. Stat. Soc. Ser. A 1971, 134, 682. [Google Scholar]
- Shao, Y.H.; Wu, J.M.; Ye, J.Y.; Liu, Y.H. Frequency analysis and its spatiotemporal characteristics of precipitation extreme events in China during 1951–2010. Theor. Appl. Climatol. 2015, 121, 775–787. [Google Scholar]
- Liang, K.; Liu, S.; Bai, P.; Nie, R. The yellow river basin becomes wetter or drier? The case as indicated by mean precipitation and extremes during 1961–2012. Theor. Appl. Climatol. 2015, 119, 701–722. [Google Scholar]
- Sen, P.K. Estimates of the regression coefficient based on Kendall’s tau. J. Am. Stat. Assoc. 1968, 63, 1379–1389. [Google Scholar]
- Fu, X.Y.; Tang, C.J.; Zhang, X.X.; Fu, J.Y.; Jiang, D. An improved indicator of simulated grassland production based on MODIS NDVI and GPP data: A case study in the Sichuan province, china. Ecol. Indic. 2014, 40, 102–108. [Google Scholar] [CrossRef]
- Liu, R.; Liu, S.C.; Cicerone, R.J.; Shiu, C.J.; Li, J.; Wang, J.L.; Zhang, Y.H. Trends of extreme precipitation in eastern China and their possible causes. Adv. Atmos. Sci. 2015, 32, 1027–1037. [Google Scholar] [CrossRef]
© 2017 by the authors. Licensee MDPI, Basel, Switzerland. This article is an open access article distributed under the terms and conditions of the Creative Commons Attribution (CC BY) license ( http://creativecommons.org/licenses/by/4.0/).