Abstract
Open burning of crop residue is a major source of air pollutants in China. While a nationwide straw burning ban implemented in 2016 has proven effective in reducing primary emissions, its impact on ozone (O3), a key pollutant detrimental to human health, remain poorly quantified. This study aims to assess the impact of straw burning on downwind urban O3 pollution and to investigate the complex mechanisms governing O3 changes resulting from transported agricultural fire plumes. Here, using multi-satellite data and ground observations from 2013 to 2020, this study developed a method to identify smoke-affected days and estimate plume transport time over northern China. The results show that the straw burning ban effectively reduced peak concentrations of particulate matter (PM2.5) during harvest seasons. However, O3 responses on smoke-affected days were heterogeneous, showing both increases and decreases. The random forest model revealed the meteorological and chemical drivers of O3 variability. Elevated formaldehyde (HCHO) and temperatures promote O3 production, while higher NO2 and relative humidity enhance its titration. Trajectory analysis further decoupled the mechanisms that O3 and HCHO enhancements were primarily driven by local photochemistry, whereas NO2 increases were attributable to regional transport and mixing with anthropogenic pollution. This study underscores the necessity for integrated air quality management strategies that account for the complex trade-offs between PM2.5 and O3 to fully realize the public health benefits of emission control policies.
1. Introduction
Ozone (O3) plays a significant role in the atmosphere as an essential reactive compound that affects the Earth’s radiative balance [1]. Surface O3 is acknowledged as a gas pollutant posing a substantial risk to human health [2], including respiratory and cardiovascular diseases, and ecosystems [3,4]. Photochemical O3 is a secondary air pollutant whose formation is nonlinearly linked to O3 precursors like volatile organic compounds (VOCs) and nitrogen oxides (NOx = NO + NO2) when exposed to sunlight [5]. The non-linear response of O3 to its precursors is often characterized by two distinct photochemical regimes known as NOx-limited and VOC-limited (or NOx-saturated) [6,7], which complicates the formulation of effective control strategies [8]. Urban areas, with abundant NOx emissions from fossil fuel combustion, are often VOC-limited, where reducing NOx may inadvertently increase O3 levels [9,10], posing a significant challenge for public health protection.
In China, open burning of crop residues is a common post-harvest practice, as it aids in field clearance and preparation for the upcoming crop. Crop residue burning emits substantial amounts of fine particulate matter (PM2.5), carbon monoxide (CO), NOx, and VOCs [11,12,13,14]. These emissions contribute to severe haze pollution and elevated O3 levels [15], thereby exacerbating health risks. Recognizing this threat, the Chinese government issued the “Action Plan for Air Pollution Prevention and Control” in 2013, the primary goal of which was to reduce PM2.5 concentrations [16]. Following this, a ban was imposed in 2016 to further prohibit open straw burning. Subsequent studies have confirmed the ban’s remarkable success in reducing primary emissions, particularly PM2.5 [17].
However, because of the nonlinear nature of O3 chemistry, the treatment of O3 pollution is more challenging. The plumes from biomass burning represent a complex mixture of pollutants. When transported and mixed with urban air masses, they can perturb local photochemical equilibria, potentially triggering enhanced O3 production or, conversely, promoting its destruction via titration. For example, Jin [18] used satellite retrievals of NO2 and HCHO to analyze the influence of California wildfires on regional O3 production during 2018–2020. They reported a more significant rise in NOx in NOx-limited regime areas such as near a forest region, whereas a notable rise in HCHO was observed in VOC-limited typically urban areas, both enhancing O3 production efficiency [18]. Studies on wildfires in western United States have demonstrated that such interactions can profoundly alter regional O3 budgets [19], but systematic analyses focused on agricultural fires and, crucially, on the impact of policy interventions like the Chinese ban, are scarce [20,21]. The nonlinear and context-dependent response of O3 makes it imperative to understand how these transported plumes influence urban air quality and health risks under a changing emission landscape.
This study focuses on the summer harvest (April to July) and autumn harvest (September to October) seasons. This seasonal selection is based on the agricultural cycle in northern China, where the vast majority of open crop residue burning occurs immediately following the harvest of primary crops such as winter wheat and corn [22]. While biomass is burned for residential heating in winter, this involves different fuels (e.g., wood, coal) and combustion methods (enclosed stoves) and falls outside the scope of this study, which is specifically on open agricultural fire plumes. The main production areas in northern China include Heilongjiang, Jilin, Liaoning, Tianjin, Shandong, Hebei, Henan, and Anhui provinces. Since the Chinese government introduced the 13th Five-Year Plan (2016–2020), it has officially established the prohibition of open burning straw as a nationwide objective [23]. Local governments throughout the country implemented a range of compulsory measures to enforce the ban on straw burning. Therefore, this study has selected two specific time periods to analyze the effects of straw burning bans: Period I (2013–2015), representing the pre-ban baseline, and Period II (2016–2020), representing the post-ban period under the “13th Five-Year Plan”. The differing lengths of the periods are a direct result of this policy-centric design, aiming to compare the conditions before the ban’s implementation against its full five-year legislative term to assess sustained impacts. The specific objectives of this study are to (i) develop a robust satellite-based methodology to distinguish days affected by smoke (combustion days) and days unaffected by smoke (non-combustion days) in cities and to estimate the transport time of smoke, (ii) evaluate the change in urban O3 (including precursors), PM2.5, and CO before and after the implementation of the ban, and (iii) identify the key driving factors (meteorological and chemical) that determine the spatial variability in urban O3 response, with implications for population exposure and health risk management. The findings from this work will provide scientific evidence for refining air pollution control policies to maximize co-benefits for public health.
2. Materials and Methods
2.1. Satellite Data
The Ozone Monitoring Instrument (OMI), aboard the Aura satellite, which passes over the equator locally at 13:30, is a nadir-viewing spectrometer that measures aerosol parameters, cloud, and various trace gases with a spatial resolution of 13 km × 24 km at nadir [24]. The OMI absorbing aerosol index (AAI) is a semi-quantitative aerosol parameter that links perturbations in UV radiance, potentially induced by absorbing aerosols, to an assumed radiance from a purely Rayleigh atmosphere. It is capable of identifying UV-absorbing aerosols like smoke, volcanic aerosols and desert dust [25]. Guan et al. (2010) reported that OMI AAI values are affected by the height of the smoke, with elevated smoke altitudes leading to larger AAI values [26]. Kaskaoutis et al. (2014) found the maximum OMI AAI value approach 2.5 during post-monsoon over northern India, with some extremes of 3–5 [27]. Here, the OMI AAI daily level 2 product was used to identify potential smoke-affected regions.
In this study, OMI daily tropospheric NO2 column and HCHO column data, made available through the European Quality Assurance for Essential Climate Variables project (QA4ECV), were employed to serve as two indicators for O3 precursors on extensive spatial scales [28]. The selection of HCHO and NO2 as O3 precursor indicators is based on their established role in satellite remote sensing of photochemistry. Tropospheric NO2 columns provide a direct measure of nitrogen oxides (NOx). For volatile organic compounds (VOCs), which comprise hundreds of specific species, direct satellite quantification is challenging. HCHO is a central high-yield oxidation product in the degradation of many common VOCs (e.g., isoprene, alkenes, and aromatics) [29]. Consequently, satellite-observed HCHO columns have been robustly validated as a proxy for the total reactive carbon flux and the O3 production potential of the ambient VOC mixture [18,30].
This study selected daily observations of OMI NO2 and HCHO that met the recommended criteria outlined in the product specification documents [31,32]. It is important to note that satellite retrievals of NO2 and HCHO provide tropospheric column densities (‘burdens’). While these are not direct surface measurements, they have been demonstrated to be strongly correlated with near-surface concentrations in polluted regions, as the majority of these pollutants are often confined to the planetary boundary layer [33]. Therefore, they serve as a powerful tool for tracing the spatial extent and chemical evolution of pollution plumes on a regional scale [34].
The Himawari-8 satellite developed by the Japan Meteorological Agency (JMA) is an improved geosynchronous meteorological instrument from the Himawari mission, launched in October 2014. It orbits at an altitude of ~35,800 km above the equator and is positioned in a geostationary orbit at about 140.7° east longitude [35]. The Himawari-8 Advanced Himawari Imager (AHI) Wild Fire Level 3 (L3WLF) product provides the hourly Fire Radiative Power (FRP) and number of fire points at a spatial resolution of 2 km × 2 km at nadir [36]. Here, the L3WLF data were used to find the fire sources of crop residues burning.
The yearly Moderate-Resolution Imaging Spectroradiometer (MODIS), operated by the National Aeronautics and Space Administration (NASA, Washington, DC, USA) Goddard Space Flight Center, land cover type (MCD12Q1) product with a spatial resolution of 500 m from 2013 to 2020 was employed for extracting croplands according to the International Geosphere-Biosphere Program (IGBP) classification scheme. The land cover product was derived using a decision tree algorithm, and its general precision in classification was approximately 75% [37].
2.2. Ground-Based Observations
Hourly concentrations of O3, PM2.5 and CO in China over the years of 2013–2020 were provided by the China Ministry of Ecology and Environment (CMEE). The observed concentrations from the CMEE were measured under standard conditions of 273 K and 1013 hPa before 1 September 2018, and under new reference conditions of 298 K and 1013 hPa thereafter. This study converted the O3, PM2.5 and CO concentrations from standard conditions to reference conditions before 1 September 2018. The daily concentration was screened from valid hourly observations at OMI overpass time (14:00 local time).
Given that CO, produced by incomplete combustion, has a long atmospheric lifetime, it is commonly used as a tracer to assess the effects of biomass burning. As is widely known, PM2.5 can be emitted in large quantities by wildfires, and theoretically, the same analysis can be applied to the measurement of PM2.5. Most of the stations in the Chinese national air quality monitoring network are situated in densely populated regions, often in polluted urban centres. According to the National Ambient Air Quality Standard of China [38], if a 24 h average PM2.5 concentration exceeds 75 μg/m3 or a 24 h average CO concentration exceeds 4 mg/m3, it is considered to violate the national air quality standards.
2.3. Meteorological Data
ERA5, the fifth-generation reanalysis conducted by the European Centre for Medium-Range Weather Forecasts (ECMWF), improves upon ERA-Interim in various aspects [39]. The ERA5 dataset offers a comprehensive and consistent source of meteorological information.
Surface O3 levels can be affected by meteorological conditions. Both the temperature and relative humidity have been demonstrated to have a significant impact on O3 production [40]. Figure A1 and Figure A2 (in Appendix A.1) illustrate the correlation analysis between the monthly average data of air temperature and relative humidity from ground meteorological stations and the monthly average data of 2 m temperature and relative humidity at the 1000 hPa pressure level from ERA5. The results indicate that Pearson’s correlation coefficient (R value) for both temperature and relative humidity exceeds 0.9, indicating a remarkably strong relationship. While the strong correlation between ERA5 monthly averages and ground-based observations demonstrates its reliability at climatic timescales, this does not necessarily guarantee equivalent accuracy in ERA5 hourly data. However, in the absence of reliable ground-based measurements at hourly resolution, ERA5 hourly data serve as an acceptable alternative, as evidenced by their successful application in similar studies [41,42].
For the purpose of analyzing the meteorological factors that impact surface O3 levels, ERA5 hourly data were selected in this study, including 2 m temperature, relative humidity at pressure level 1000 hPa, 10 m u-component of wind, 10 m v-component of wind, total cloud cover and boundary layer height. These data were recorded at 06:00 UTC from 2016 to 2020.
2.4. HYSPLIT Model
HYbrid Single-Particle Lagrangian Integrated Trajectory (HYSPLIT v5.0.0) is a computational model used for calculating air parcel trajectories and predicting the dispersion or deposition of atmospheric pollutants [43]. Its extensive application includes simulating various types of pollutant events, such as volcanic ash eruptions, wildfire smoke, dispersion of radioactive nuclei, and emissions of anthropogenic pollutants. The simulations were initiated from the geolocation and time of each ground station, using meteorological data from the National Center for Atmospheric Research and National Center for Environmental Prediction (NCAR/NCEP). The time property of each particle in the HYSPLIT backward trajectory simulation can be used to estimate the transport time for smoke caused by crop residue burning.
2.5. Crop Residue Burning Data Screening
In this study, a series of screening criteria are adopted to analyze combustion observations and to estimate the transport time of smoke. Figure 1 shows the detailed data screening workflow.
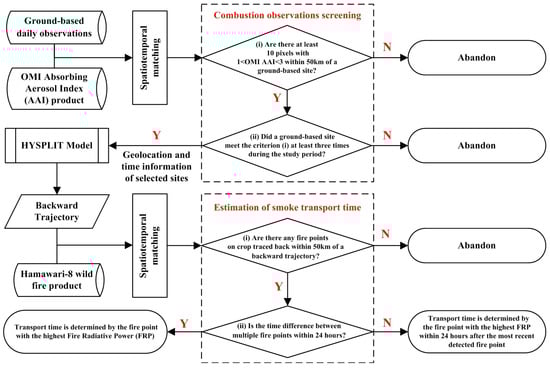
Figure 1.
Schematic flow chart of combustion observations screening and estimation of smoke transport time.
Firstly, potential smoke-affected ground-based sites are identified with the help of OMI AAI data. To ensure the reliability of the OMI AAI retrieval, the measured OMI AAI value is required to be in the range of 1 to 3. After performing temporal and spatial matching of daily OMI AAI data and ground-based sites, the following two criteria are considered to ensure the selected ground-based sites are most likely affected by smoke plumes: (i) At least 10 pixels within a 50 km radius of each ground-based site must meet the OMI AAI value requirements. (ii) Each ground-based site must meet criterion (i) at least three times.
Secondly, the HYSPLIT model, combined with the Himawari-8 wildfire data, is employed to estimate the transport time of smoke. The geolocation and time information of the selected smoke-affected ground-based sites are input to the HYSPLIT model as the initial position and time for a backward trajectory. The 48 h HYSPLIT backward trajectory simulations are calculated at three heights (100 m, 500 m, and 1000 m). This study performed spatiotemporal matching between the HYSPLIT backward trajectories and the Himawari-8 wildfire product, and used MODIS landcover data to determine whether the fire within a 50 km radius around each backward trajectory was located on croplands. If a fire is identified by a HYSPLIT backward trajectory, a search is conducted along the trajectory to determine the position closest to the identified fire. This identified position is then labelled as the “marked position”. Determining the time property of the “marked position” is a straightforward task since each position within the HYSPLIT backward trajectory inherently carries its own timestamp.
At a specific ground-based site and time, the presence of multiple marked fire points can cause interference in estimating the transport time of smoke. To tackle this issue, the following criteria are implemented: (i) If the time difference between “marked positions” is less than 24 h, the transport time is determined based on the “marked position” with the highest FRP. (ii) Otherwise, the transport time is determined by considering the “marked position” with the highest FRP within 24 h after the most recent detected fire point. By applying these criteria, the estimation of smoke transport time considers the variability in “marked positions” while prioritizing the most recent and significant fire points indicated by higher FRP values.
2.6. Study Area
This study focuses on the main agricultural regions in northern China, which are hotspots for crop residue burning and are downwind of significant urban centers. Our study area encompasses eight provinces: Heilongjiang, Jilin, Liaoning, Hebei, Henan, Shandong, Anhui, and Tianjin (Figure 2). This region is a key production area for staple crops like wheat and corn, where widespread open burning occurs post-harvest in summer and autumn. The selection of this area allows for the investigation of smoke transport from rural burning sources to densely populated and often polluted urban areas.
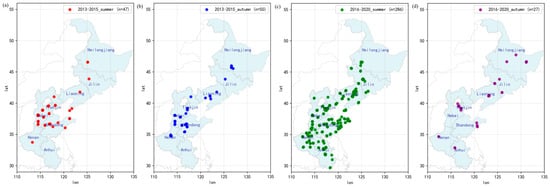
Figure 2.
Distribution of selected ground-based sites of (a) summer in 2013–2015, (b) autumn in 2013–2015, (c) summer in 2016–2020 and (d) autumn in 2016–2020.
The spatial distribution of the selected ground-based sites is shown in Figure 2, and detailed observational information is provided in Table 1. China’s pollutant monitoring network was established in 2013. In its early stages, the network suffered from incomplete coverage, and data gaps occurred due to equipment failure or maintenance. Subsequent expansion of stations and equipment upgrades improved data completeness. Since straw burning events occur randomly across locations, and due to the screening criteria for “combustion” and “non-combustion” days, the set of stations meeting the selection criteria varied across different periods.

Table 1.
Detailed information of the selected data.
In order to separate the influence of crop residue burning, the identification of “non-combustion days” at each monitoring site was based on the absence of significant biomass burning signals from the OMI satellite. Specifically, if there is no pixel meeting the OMI AAI value requirement within a 50 km radius of the ground-based site, the ground-based site is recognized as not affected by the smoke on this date. This method distinguished days affected by smoke (combustion days) and days unaffected by smoke (non-combustion days). As detailed in Figure A3, Figure A4, Figure A5 and Figure A6 (Appendix A.2), the intra-weekly variation patterns of pollutants on non-combustion days showed stronger agreement between observed concentrations and local emissions in autumn compared to summer, suggesting that meteorological influences (e.g., enhanced dispersion and precipitation) can modulate the emission–concentration relationship. Nonetheless, the overall coherent weekly patterns confirm that the selected non-combustion days are indeed suitable for analyzing the background pollution level that is primarily influenced by routine anthropogenic activities.
2.7. Statistical Analyses
In this study, variance decomposition analysis was conducted using the R 4.4.3 package “glmm.hp” [44,45]. This analysis aimed to quantify the relative significance of several factors in accounting for the urban O3 concentrations on combustion days. These factors included HCHO columns, NO2 columns, PM2.5 concentrations, CO concentrations, ground-based site meteorological conditions, and meteorological conditions at the fire. The meteorological conditions considered included the 2 m temperature, relative humidity at pressure level 1000 hPa, 10 m u-component of wind, 10 m v-component of wind, total cloud cover and boundary layer height.
Additionally, an independent random forest analysis was used to identify the key drivers of urban O3 concentrations on combustion days. The importance of each predictor was determined using the R package “spatialRF”, which reduces multicollinearity, identifies relevant variable interactions, and assesses model transferability via spatial cross-validation [46].
3. Results
3.1. Effects of the Straw Burning Bans
To quantify the impact of straw burning bans in northern China, this study compared the variations in PM2.5 and CO concentrations during the summer harvest (April to July) and autumn harvest (September to October) seasons between Period I (2013–2015) and Period II (2016–2020) under both combustion and non-combustion days in Figure 3.
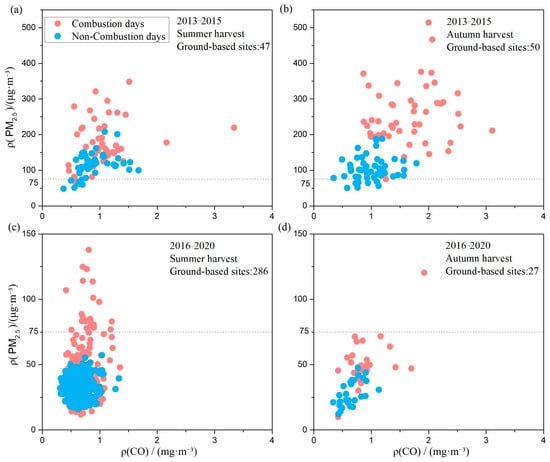
Figure 3.
Variations in average PM2.5 and CO concentration by stations across (a) summer in 2013–2015, (b) autumn in 2013–2015, (c) summer in 2016–2020 and (d) autumn in 2016–2020.
On non-combustion days, when PM2.5 levels are high but CO is not, it indicates that PM2.5 in cities mainly originates from secondary particulate matter formed by primary pollutants. PM2.5 concentrations at most ground-based sites did not meet the standard (75 μg/m3) in Period I. However, when it came to Period II, PM2.5 levels of all ground-based sites met the standard. It demonstrates the remarkable PM2.5 and CO reduction due to China’s rigorous air quality policy.
On combustion days, the average PM2.5 concentration in the summer and autumn harvest of Period I increased by 55% and 143%, respectively, and the CO concentration increased by 15% and 70%, respectively. During Period II, the average PM2.5 concentration in summer and autumn harvest increased by 26% and 85%, respectively, and the CO concentration increased by 11% and 37%, respectively. The frequency of high PM2.5 levels (exceeding 100 μg/m3) in Period II was significantly reduced compared to Period I. These results indicate that the straw burning ban has been effective in notably reducing peak pollutant concentrations during critical agricultural periods, thereby contributing to improved air quality.
In northern China, the burning of crop residues predominantly occurs during the summer and autumn harvest seasons, coinciding with times of high O3 concentrations. In response to the implementation of pollution control measures since 2013, it is estimated that the anthropogenic NOx emissions in China have declined by 21% from 2013 to 2017, whereas VOCs emissions changed slightly [47]. Therefore, it is significant to show the relative changes for background O3 precursors in northern China.
Figure 4a–d shows the spatial distribution of the relative difference (in percentage) in seasonal average OMI HCHO and NO2 columns between Period II (2016–2020) and Period I (2013–2015) across northern China. A marked reduction in NO2 levels is prominently observed in major urban agglomerations, including central Shandong, northern Henan, southern Hebei, Tianjin, and central Liaoning. Conversely, HCHO columns exhibit a relatively stable or slightly increasing trend. A further comparison of HCHO, NO2, and O3 levels on non-combustion days, representative of local background conditions, between the two periods is presented in Figure 4e. The results indicate that, compared to Period I, non-combustion days in Period II exhibited a 10% increase in HCHO columns, a 43% decrease in NO2 columns, and a 6% rise in O3 concentrations across the selected ground sites. This is due to a series of strict measures taken to reduce the emissions of NOx without imposing excessive restrictions on VOCs emissions. This finding is consistent with the conclusions of other studies evaluating the effectiveness of China’s pollution control measures [48,49].
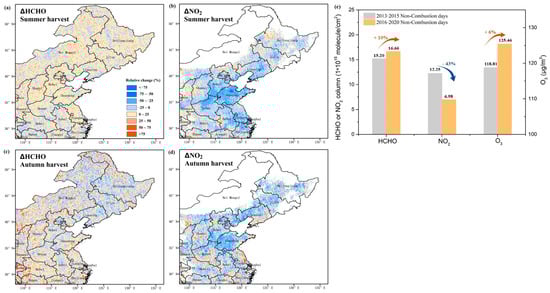
Figure 4.
Relative difference in seasonal average OMI HCHO column (a,b) and NO2 column (c,d) in northern China between two periods. Note that the grid cells without data (white) represent monthly HCHO columns less than 2 × 10¹⁵ molecule/cm2 or monthly NO2 columns less than 1.5 × 10¹⁵ molecule/cm2. (e) The average of OMI HCHO and NO2 columns (left axis) and ground-based O3 concentrations (right axis) in the selected ground-based sites on non-combustion days between Period I and II.
3.2. Changes in Urban O3 Levels
The impact of transported fire plumes on urban O3 is governed by a dynamic balance between two key processes: (1) the rapid titration of O3 by freshly emitted NO, which dominates in the early stages of a plume or under high-NOx conditions, leading to O3 depletion; and (2) the competing photochemical production of O3, which can become dominant as the plume ages and mixes with the urban background, provided sufficient VOCs and solar radiation are available. The heterogeneous O3 responses observed in this study, detailed below, reflect the varying dominance of these competing pathways under different meteorological and chemical regimes.
Figure 5a shows that the HCHO/NO2 ratio on non-combustion days fall in the range of 1 to 4 during the summer harvest of Period I. Figure 5b shows that the HCHO/NO2 ratio on combustion days shifts towards lower values, with the range being from 0.3 to 3. Compared to non-combustion days, the NO2 columns showed a significant (Student’s t-tests, p-value < 0.05) increase on combustion days. Figure 5c shows a statistically significant reduction in O3 concentration by an average of 36 μg/m3 observed on combustion days. This is consistent with high NOx conditions promoting O3 titration. Figure 5d,e shows simultaneous significant increases in both NO2 and HCHO columns on combustion days, coinciding with an average increase of 33 μg/m3 in O3 concentration measured at ground-based sites shown in Figure 5f.
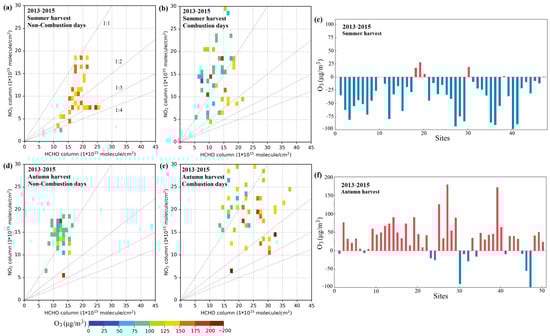
Figure 5.
The mean O3 concentrations versus mean OMI NO2 and HCHO columns during the summer and autumn harvest of 2013–2015 (a,b,d,e), and the absolute difference in the mean values of combustion and non-combustion observations for O3 (c,f). The O3 numerical value assigned to the grid cells in (a,b,d,e) is the average of all data points within each bin.
The lifetime of HCHO and NOx contained in fresh plumes from biomass burning is generally within several hours [50,51]. Xu [19] have found that the O3 formation sensitivity within fresh plumes (age of less than 3 h) emitted by biomass burning was typical of a NOx-limited regime. When this fresh plume mixes with NOx-rich urban areas, it leads to an increase in urban O3 levels, accompanied by an increase in HCHO and NO2 [19]. Before the implementation of the straw burning bans in northern China, there were often large amounts of straw piled up and burned in suburban farmland during the autumn harvest season, causing the cities to be shrouded in smoke. During the autumn harvest of Period I in this study, the observed enhancement in urban O3 and its precursors is consistent with the O3 chemistry triggered by the mixing of fresh smoke plumes and NOx-rich urban atmosphere.
Figure 6a,b illustrates that, during the summer harvest of Period II, the changes in O3 responses became more spatially varied. In Figure 6c, the observations reveal that nearly 30% of sites showed O3 increases, while others decreased, yielding a net average decline of 12 μg/m3. By the autumn harvest, combustion days were associated with markedly higher NO2 levels and an average O3 decrease of 36 μg/m3, consistent with the dominance of the initial O3 titration phase under these conditions.
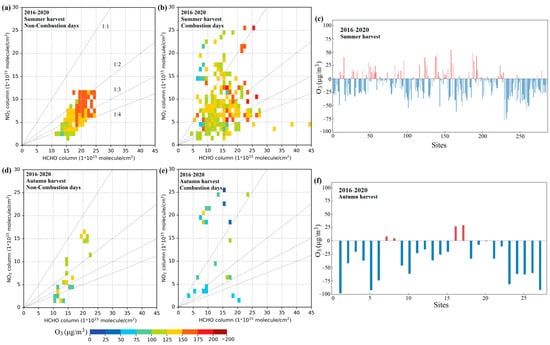
Figure 6.
The mean O3 concentrations versus mean OMI NO2 and HCHO columns during the summer and autumn harvest of 2016–2020 (a,b,d,e), and the absolute difference in the mean values of combustion and non-combustion observations for O3 (c,f). The O3 numerical value assigned to the grid cells in (a,b,d,e) is the average of all data points within each bin.
After the implementation of straw burning bans, it is noteworthy that during the summer harvest in Period II, the O3 levels on combustion days did not exhibit a consistent changing trend. In addition to variations in precursors emissions, urban O3 levels are also influenced by meteorological conditions. Therefore, it is necessary to further identify the key factors contributing to urban O3 changes during this period.
3.3. The Drivers of Urban O3 Responses to Burning
This study employed the method presented in Section 2.5 to estimate the transport time for 853 combustion days during the summer harvests from 2016 to 2020. Simultaneously, pollutant levels at the ground-based sites affected by each combustion day were acquired, including O3 concentrations, PM2.5 concentrations, CO concentrations, HCHO columns, and NO2 columns. Additionally, meteorological parameters from both the ground-based sites and corresponding fire locations were extracted, including 2 m temperature (T), relative humidity (RH) at pressure level 1000 hPa, 10 m u-component of wind (wind_u), 10 m v-component of wind (wind_v), total cloud cover (TCC) and boundary layer height (BLH).
The variance decomposition analysis presented in Figure 7a demonstrates that the temperature at ground-based sites accounts for 27.4% of the variations in the O3 concentrations, surpassing the individual contributions of all other factors under consideration. The key role of temperature (importance = 10%) at ground-based sites in driving the O3 concentrations is further confirmed by independent random forest analyses in Figure 7b, which identifies local temperature as the primary factor determining the observed spatial patterns of O3 concentrations.
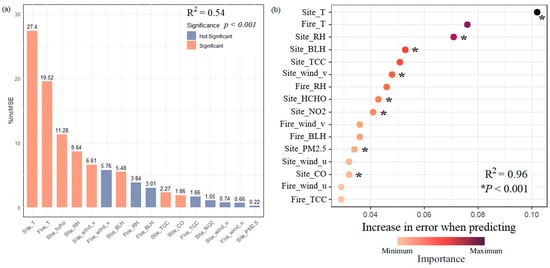
Figure 7.
(a) Variance decomposition analysis evaluates the proportion of variation in the urban O3 concentrations on combustion days explained by individual variables. (b) The results from random forest analysis display the relative importance of the individual variables in predicting the urban O3 concentrations on combustion days.
The random forest model quantified the combined roles of meteorology and precursors in driving extreme O3 changes (|ΔO3| > 50%). Figure 8 illustrates the specific environmental thresholds identified for these scenarios. The O3 increase regime is characterized by a synergy of conditions conducive to rapid photochemistry: high temperature (>25 °C) accelerating reaction rates, low relative humidity (<50%) typically associated with clear skies and strong solar radiation, and crucially, elevated HCHO columns (>20 × 1015 molecule/cm2). This HCHO threshold signifies a VOC-rich environment where the photochemical production of O3 can proceed efficiently. Conversely, the O3 decrease regime emerges under a contrasting set of conditions: low temperature (<15 °C) and high relative humidity (>60%), which collectively suppress photochemical activity. The high humidity is often linked to cloudier conditions that reduce actinic flux. More importantly, this meteorological suppression is compounded by the presence of high NO2 columns (>15 × 1015 molecule/cm2), which promotes the titration of O3 by NO. This triad of conditions of cool, humid, and NOx-rich robustly defines the scenarios where O3 depletion is most pronounced.
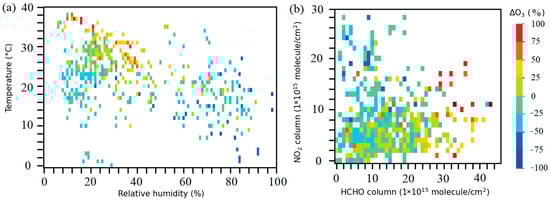
Figure 8.
The ΔO3 values at each ground-based site were compared with (a) relative humidity and temperature as well as (b) HCHO and NO2 columns for 853 combustion days. ΔO3 refers to the relative change between the O3 concentration on combustion days and the average O3 on non-combustion days for each site (which can be regarded as the baseline concentration).
As shown in Figure 9, the same driving factor analysis was applied to urban HCHO and NO2 columns during combustion episodes. Both methods confirmed the temperature (contribution = 22.64%, importance = 11.3%) at ground-based sites is the dominant meteorological factor affecting HCHO column variations. East–west wind components at both fire (contribution = 20.25%, importance = 7.2%) and ground-based site (contribution = 8.44%, importance = 6.5%) jointly serve as the key meteorological drivers for NO2 column changes. These findings highlight the distinct roles of thermal (temperature) and dynamic (wind) conditions in pollutant accumulation. To analyze the role of wind in smoke transport, this study calculated the transport direction by deriving the wind vector at the fire location and verified whether the ground-based sites fall within ±45° of the downwind sectors.
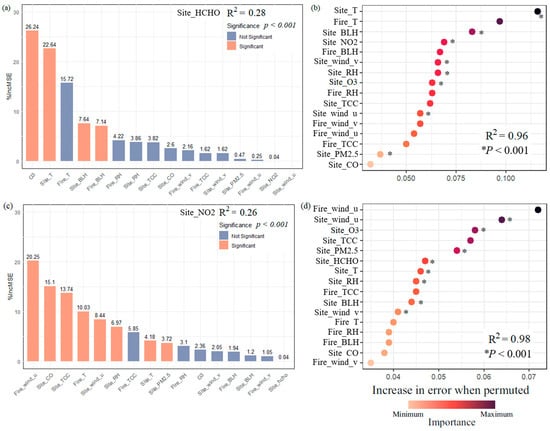
Figure 9.
Variance decomposition analysis evaluates the proportion of variation in (a) the urban HCHO columns and (c) the urban NO2 columns on combustion days explained by individual variables. The results from random forest analysis display the relative importance of the individual variables in predicting (b) the urban HCHO columns and (d) the urban NO2 columns on combustion days.
Figure 10 illustrates the relationships between plume transport time and urban O3, NO2, HCHO levels grouped by local air temperature and transport direction. Given that the lifetimes of NOx and VOCs in fresh plumes are only a few hours, the focus is on the observational results with a transport time of less than 24 h.
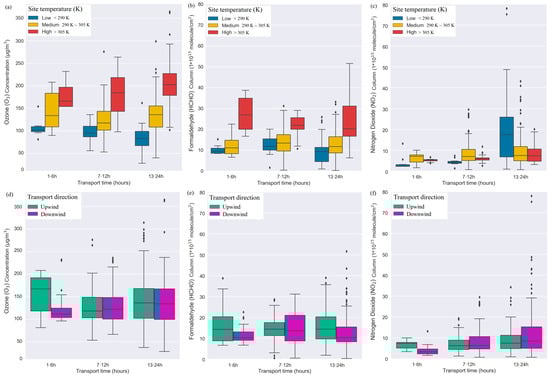
Figure 10.
Box plots of (a–c) O3 concentrations, HCHO columns, and NO2 columns grouped by transport time and categorized by different temperatures; (d–f) the same parameters grouped by transport time and categorized by different transport directions.
Both O3 and HCHO levels show a positive trend with local air temperature in Figure 10a,b. High temperatures and strong solar radiation accelerate the oxidation of VOCs by enhancing photolysis rates and radical production, thereby promoting O3 production via peroxyl radical pathways while simultaneously generating HCHO as a key intermediate oxidation product. Since HCHO is a major high-yield oxidation product of a wide range of VOCs, its satellite column serves as a well-established proxy for the overall reactivity of the VOC mixture and its involvement in photochemical processing. The observed temperature-dependent increase in HCHO strongly validates the crucial role of VOC oxidation in local O3 production. The temperature dependence of HCHO strongly suggests local secondary formation as the dominant source, though primary emissions cannot be fully ruled out without isotopic evidence. The relationship between NO2 and temperature shown in Figure 10c does not exhibit a significant trend, unlike that observed for O3 and HCHO with temperature. However, as evidenced by Figure 10f, the NO2 levels at downwind sites exhibit a pronounced rise (exceeding 20 × 1015 molecule/cm2) with increasing transport time. In contrast, the peaks of O3 and HCHO shown in Figure 10d,e do not have an obvious trend with the upwind/downwind directions. Based on the distinct observational evidence, the results indicate that the accumulation of NOx downwind is fundamentally driven by the physical transport and mixing of the fire plume with anthropogenic pollution sources. However, the concentration of NO2 observed by satellite is not merely a transported quantity but is dynamically regulated by the rapid photostationary state cycle (NO + O3 ⇌ NO2) along the transport pathway. Therefore, the pronounced downwind enhancement in the NO2 column represents the combined outcome of the physical supply of NOx and its continuous chemical partitioning into NO2, influenced by ambient O3 levels and photolysis rates during transport.
The most plausible mechanism is that as the biomass burning plume is transported from the combustion area downwind, it continually entrains intense anthropogenic NOx pollution from urban and industrial sources along its path. Longer transport times provide more opportunity for NO2 to be carried from source regions to the downwind monitoring sites. The wind field is the key controlling factor determining the plume’s path and its potential for mixing with these pollution sources. This process of mixing robustly explains the pronounced downwind enhancement in NO2 column concentrations, as the photo stationary state cycle, which is governed by the NO2 photolysis rate and the NO oxidation rate by O3, rapidly interconverts NO and NO2 but does not generate new NOx. In contrast, the positive correlation of O3 and HCHO with temperature confirms their local photochemical origin. This is driven by the oxidation of VOCs, a process powered by solar radiation that is enhanced under higher temperatures. Thus, it indicates that O3 is produced by local photochemistry fueled by both ample sunlight and heat, while the evolving NO2 distribution is shaped by physical transport and the mixing of the plume with anthropogenic sources. When smoke plumes transported over 13–24 h deliver substantial NOx (primarily emitted as NO) to downwind sites, the accumulated NO rapidly consumes O3 via the titration reaction (NO + O3 → NO2), leading to significantly reduced O3 levels. This process also alters the radical pool, potentially suppressing the oxidation of VOCs and thus leading to lower HCHO levels under these low-temperature, high-NOx conditions.
4. Discussion
4.1. Comparison with Studies from Other Regions and Global Implications
This study regarding the competing health risks from PM2.5 reduction and O3 increase in China, and the underlying photochemical mechanisms, agrees with and is contextualized by studies of wildfire impacts in other regions. For instance, research on California wildfires has similarly highlighted that O3 production is a significant far-field threat, where enhancements in O3 precursor emissions often outweigh the suppressive effects of smoke aerosols [52]. This aligns with the conclusion of this study that the health benefits from PM2.5 reduction could be offset by increased O3 exposure. However, a key distinction emerges in the spatial dynamics of the precursors. Studies in California observed that HCHO enhancements were far-reaching due to secondary production from long-lived VOCs, while NO2 was more concentrated near the fire sources [18]. In contrast, this study over China reveals a different pattern. It was observed that the enhancement in O3 and its key driver, HCHO, are primarily driven by local photochemical production in downwind urban areas, catalyzed by the incoming plume. Meanwhile, the increase in NO2 is attributed to regional transport and mixing with pre-existing urban pollution. This discrepancy underscores the critical influence of regional emission backgrounds, the heavily polluted and NOx-rich urban environment in China facilitates a different O3 production regime compared to the more variable conditions in the western United States. Furthermore, while machine learning has been employed in the U.S. to refine smoke PM2.5 exposure estimates [53], the application of random forest in this study to directly decipher the meteorological and chemical drivers of the O3 risk represents a novel approach to mechanistically understanding the formation of pollution compound events. These comparisons highlight that while the challenge of wildfire-related O3 pollution is a global concern, the dominant pathways and drivers are region-specific, necessitating tailored policy responses.
4.2. Implication for Air Quality Management
This study confirms that the atmospheric environment in China has witnessed significant improvements as a result of measures implemented to control open straw burning. However, the health benefits gained from reduced PM2.5 exposure could be partially offset or compounded by changes in O3 exposure. Applying a machine learning approach, this study quantified the relative importance of key meteorological and chemical drivers governing O3 changes during plume events. The model confirmed the dominant roles of high temperature and HCHO in promoting O3 increases, and of high humidity in suppressing them, but further revealed that NO2’s effect was context-dependent. More critically, this study decoupled the underlying mechanisms. O3 and HCHO enhancements are primarily driven by local photochemical production triggered by the incoming plume, while NO2 increases are due to regional transport and mixing with urban pollution. This indicates that downwind urban populations are exposed to locally generated O3, catalyzed by precursors from regional fires.
This study moves the discussion beyond the simple effectiveness of the ban and towards its optimization for integrated multi-pollutant control and public health protection. Air quality management strategies must transition from one-size-fits-all approaches to those tailored to local O3 formation sensitivities. Urban regions identified as VOC-limited should strengthen VOCs controls alongside the burning ban to mitigate the risk of O3 increase. Real-time air quality forecasting and health advisories should incorporate meteorological conditions. Days forecasted with high temperature and low humidity following burning events warrant heightened warnings due to the increased potential for O3 health risks. Considering the practical challenges of complete elimination, the concept of managed or prescribed burning under strictly controlled conditions (e.g., specific weather windows with high dispersion potential, avoiding periods conducive to O3 formation) could be explored to prevent the catastrophic pollution events of the past while minimizing health impacts.
4.3. Potential Uncertainties in the Datasets and Simulations
It should be noted that OMI AAI can be influenced by aerosol layer height, surface albedo (especially over bright surfaces), and cloud contamination. HCHO and NO2 retrievals share common uncertainties related to cloud shielding and the air mass factor (AMF), which is sensitive to the assumed vertical profile and surface conditions. For HCHO, its weak signal is vulnerable to spectral interferences; for NO2, the AMF is particularly sensitive to the a priori profile and aerosols [54]. Regarding HYSPLIT, trajectory errors accumulate over time due to the resolution of meteorological data and the simplified treatment of transport processes (e.g., turbulence, convection) [55].
While these uncertainties are inherent to the respective datasets and models, this study has mitigated their impact by focusing on prominent pollution events with high signal-to-noise ratios (for satellite data) and by using ensemble trajectories to represent a more robust transport pathway. The consistent co-location of anomalies from these independent datasets strengthens the credibility of the findings in this study.
4.4. Radiative vs. Chemical Effects of Smoke on O3
The relationship between PM2.5 and O3 concentration is shown in Figure 11. The influence of smoke PM2.5 on O3 is complex and involves competing effects. On one hand, smoke plumes provide copious amounts of O3 precursors (NOx and VOCs), which can promote photochemical production [56]. On the other hand, aerosols within the plume can absorb and scatter solar radiation, thereby reducing the photolysis rates of key reactions and suppressing O3 generation [57]. This radiative effect is typically most pronounced under thick, optically dense smoke clouds.
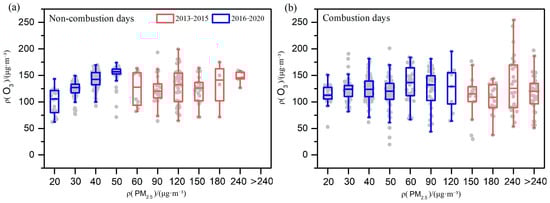
Figure 11.
The relationship between O3 and PM2.5 for (a) the selected non-combustion days and (b) combustion days from 2013 to 2020.
However, in our study of regulated agricultural fires, the chemical effect appears to dominate. As demonstrated in Figure 7, both variance decomposition analysis (contribution = 0.22%) and random forest model (importance < 4%) consistently indicate a minor net role of PM2.5 in driving O3 variability. This suggests that for the majority of smoke-affected days in this study, which are characterized by moderate aerosol optical depths due to the success of the burning ban, the promoting effect of co-emitted precursors (NOx and VOCs) largely offset or exceeded the suppressive radiative effect of the aerosols. This finding is consistent with studies of moderate-intensity fires where precursor enhancement is the primary O3 driver [52].
Nevertheless, we acknowledge that on days with exceptionally dense smoke plumes leading to significant cloudiness, the radiative effect could become non-negligible and potentially dominate, leading to O3 suppression. The evolution of straw-burning PM2.5 during transport (e.g., physicochemical transformations and mixing states) also remains poorly quantified, leading to uncertainties in establishing its precise mechanistic links with local O3 variations. Future research incorporating detailed radiative transfer modeling and plume-specific aerosol optical properties would be valuable to further disentangle these competing effects under varying smoke conditions.
4.5. Limitations and Future Research
This study acknowledges several limitations. As the OMI satellite only passes over once a day, the observations of HCHO and the NO2 column reflect the urban atmosphere mixed with smoke plumes at noon. The fact that fire-induced pollution is superimposed on regular anthropogenic pollution complicates the assessment of the respective contributions of local photochemical production and regional transport. Despite efforts to distinguish the various fire sources for estimating smoke age, mixtures of plumes from multiple fire sources or a blend of fresh and aged plumes may still exist. While this study quantified changes in pollutant concentrations, a direct health risk assessment incorporating population exposure and concentration-response functions is needed to fully quantify the ban’s net health benefit. It is worth noting that this study focused on the harvest seasons when open agricultural burning is most prevalent. Future research could investigate the role of other biomass combustion sources, such as residential heating in winter, on urban air quality. Future research should integrate chemical transport models and epidemiological data to directly attribute health outcomes to policy interventions, providing an even stronger evidence base for environmental decision-making.
The characterization of VOCs relies on HCHO as a proxy for total reactivity in this study. It did not account for variations in specific VOC species, such as the BTEX group (Benzene, Toluene, Ethylbenzene, and Xylenes), which have different O3 formation potentials and sources. Straw burning emits a complex mix of VOCs, and the speciation of this mix and its evolution during transport could influence local O3 chemistry in ways not fully resolved by HCHO alone. However, such detailed speciation requires comprehensive ground-based measurements or specialized airborne campaigns, which are beyond the scope of our current satellite-driven analysis. Future research integrating in situ VOC measurements with satellite data would be valuable to unravel the role of specific precursors and further refine our understanding of the mechanisms identified in this study.
5. Conclusions
Using multi-source satellite data and ground observations, this study investigated the impact of China’s straw burning ban on downwind urban O3 pollution. Our findings demonstrate that while the policy has been unequivocally successful in reducing primary PM2.5 emissions, it has also led to a complex and heterogeneous impact on O3, a secondary pollutant.
The random forest model quantitatively confirmed that higher temperature, lower humidity, and elevated HCHO levels promote O3 increases, whereas higher NO2 concentrations under certain conditions favor its decrease. More importantly, by analyzing the evolution of pollutants with smoke transport time, this study decoupled their driving mechanisms that the enhancements in O3 and HCHO in downwind cities are primarily driven by local photochemical production triggered by the incoming plume, while the increase in NO2 is largely due to regional transport and mixing with urban pollution. This finding underscores the combined pollution effects of biomass burning plumes and anthropogenic emissions in densely populated areas.
This study presents a novel, integrated framework that combines satellite fire tracking, trajectory modeling, and machine learning to evaluate the unintended consequences and trade-offs of a major environmental policy. This moves beyond traditional assessments that focus solely on targeted pollutants (like PM2.5) to reveal synergistic effects on others (like O3). This study also provides the detailed, observation-based mechanistic analysis of O3 formation from agricultural fires in northern China under a changing emission landscape. The decoupling of local chemical production of O3/HCHO from the physical transport of NO2 offers a critical new understanding that explains the spatial heterogeneity of the O3 response. This study delivers a crucial and timely message to policymakers that effective air quality management requires an integrated approach. It provides scientific evidence that strategies targeting a single pollutant (e.g., PM2.5 from open burning) may be undermined by increases in another (e.g., O3) if the complex nonlinear chemistry between co-emitted precursors is not considered. This highlights the imperative for control strategies that simultaneously address regional biomass burning and local anthropogenic VOC emissions.
Author Contributions
Conceptualization, W.W. and C.W.; methodology, W.W.; software, W.W.; validation, C.W.; formal analysis, C.W.; investigation, W.W.; resources, C.W.; data curation, C.W.; writing—original draft preparation, C.W.; writing—review and editing, W.W.; visualization, C.W.; supervision, W.W.; project administration, W.W.; funding acquisition, W.W. All authors have read and agreed to the published version of the manuscript.
Funding
This research was funded by the National Natural Science Foundation of China, grant number 42405197 and the Natural Science Foundation of Henan Province, grant number 232300420451.
Institutional Review Board Statement
Not applicable.
Informed Consent Statement
Not applicable.
Data Availability Statement
The satellite datasets presented in this study are openly available in FigShare at https://figshare.com/s/68c9de7664c8fc58a7b7 (accessed on 12 November 2025). The datasets of screened air pollutants in this study are available in FigShare at https://figshare.com/s/b6445f8f23c61af69483 (accessed on 12 November 2025).
Conflicts of Interest
The authors declare no conflicts of interest.
Appendix A
Appendix A.1. Validation of the ERA5 Data
It is important to note that in China, atmospheric pollutant monitoring stations and meteorological observation stations belong to two separate ground-based monitoring networks. For this study, we obtained monthly average data of air temperature and relative humidity from 48 meteorological stations spanning the period from 2019 to 2020. Figure A1 shows the geographical distribution of these 48 meteorological stations across northern China, specifically located in the provinces of Heilongjiang, Jilin, Liaoning, Hebei, Henan, Shandong, and Anhui, as well as the municipality of Tianjin.

Figure A1.
Map of 48 ground meteorological stations in northern China.
Furthermore, we utilized the global ERA5 reanalysis dataset, which provides gridded data with comprehensive coverage that effectively encompasses the atmospheric pollutant monitoring stations across China. Specifically, we selected monthly average data of 2 m temperature and relative humidity at the 1000 hPa pressure level from the ERA5 dataset.
Following spatiotemporal matching between these two datasets, we obtained a total of 1151 matched records for analysis. The results in Figure A2 demonstrate strong agreement between the datasets, with Pearson’s correlation coefficients (R) exceeding 0.9 for both temperature and relative humidity, indicating a remarkably strong relationship.

Figure A2.
Correlation diagram of monthly (a) air temperature from ground meteorological stations versus 2 m temperature from ERA5 and (b) relative humidity from ground meteorological stations versus relative humidity at the 1000 hPa pressure level from ERA5. The solid line represents the linear regression fit, while the dashed line denotes the 1:1 line.
Appendix A.2. Comparison of the Non-Combustion Ground-Based Observations and Local Emission Inventories
The identification of non-combustion days for surface pollutant monitoring sites in this study was based on the following criterion: if no pixel within a 50 km radius of a ground-based site met the requirement of the OMI Aerosol Absorption Index (AAI value between 1 and 3), that day was considered unaffected by biomass burning smoke.
Although ground-based stations provide hourly measurements of six atmospheric pollutants (PM2.5, SO2, NO2, CO, O3, and PM10), the OMI satellite passes only once per day. Therefore, the daily pollutant concentration was represented by the valid hourly observation at the time of the satellite overpass (14:00 local time). We assume that pollutant levels on non-combustion days primarily originate from local emissions and regional transport. To validate the reliability of the non-combustion day classification, we compared these data with local pollution source emission inventories.
The Multi-resolution Emission Inventory for China (MEIC) is a widely used and authoritative emission inventory in Chinese air pollution research. It provides high-resolution (0.25° × 0.25°) gridded monthly emission data for multiple pollutants, including SO2, NOx, CO, NMVOC, NH3, PM10, PM2.5, BC, and OC. To match monthly emission inventory data with daily station observations, MEIC monthly data were disaggregated to daily values under the simple and reasonable assumption that daily emission intensity remains constant within a month. This approach is justified as emission inventories primarily reflect long-term average activity levels (e.g., monthly coal consumption, traffic volume) rather than daily variations due to weather or temporary control measures.
Each surface monitoring site was matched to its corresponding MEIC grid cell based on longitude and latitude, and the emission value of that grid was used as the estimated local emission intensity for the site. It is important to note that MEIC provides monthly average estimates of total daily ground emissions, while ground observations are instantaneous concentrations at a specific time of day (14:00). Therefore, absolute values cannot be directly compared. Instead, we compared the consistency of their intra-week variation patterns, i.e., fluctuations between weekdays and weekends. We conducted this analysis for PM2.5, SO2, NO2 (represented by NOx in MEIC), and CO, with the results presented in Figure A3, Figure A4, Figure A5 and Figure A6.
The results for autumn showed that both PM2.5 observed concentrations and MEIC emissions displayed a “mid-week high, weekend low” pattern, with peaks around Thursday followed by a gradual decline and lower levels early in the week. The weekly variation was relatively consistent throughout the season. SO2 observed concentrations peaked mostly on Thursday and Saturday, and MEIC emissions also showed a similar multi-peak pattern, with peak timing generally consistent with observations. NO2 concentrations reached higher levels around Thursday, then declined with some fluctuations. MEIC NOx emissions also showed a weekly pattern peaking on Thursday, with good overall trend alignment. CO observed concentrations and MEIC emissions both peaked on Thursday, with lower levels early in the week and on weekends, showing a relatively uniform seasonal variation pattern.
However, differences were observed in summer. Overall trends in intra-week variation differed more substantially between PM2.5 concentrations and MEIC emissions, as well as between NO2 concentrations and MEIC NOx emissions. Peaks in SO2 observed concentrations were more dispersed, and MEIC emissions also showed a multi-peak pattern with frequent fluctuations, partially echoing the observed patterns. CO observed concentrations and MEIC emissions still showed a clear peak on Thursday, followed by a decrease, with good agreement in overall trend.
In summary, the stronger consistency observed in autumn between ground-level pollutant data on non-combustion days and emission inventory patterns supports the validity of the screening criterion. This suggests that during autumn, the selected non-combustion days more reliably reflect pollution dominated by local and regional anthropogenic emissions, with minimal interference from biomass burning. The greater discrepancy in summer does not necessarily invalidate the approach, but rather highlights the elevated role of meteorological influences—such as enhanced dispersion, precipitation scavenging, and photochemical activity—which complicate the relationship between emissions and concentrations.

Figure A3.
Autumn weekly variation in (a) PM2.5, (b) SO2, (c) NO2 and (d) CO during 2013–2015.

Figure A4.
Autumn weekly variation in (a) PM2.5, (b) SO2, (c) NO2 and (d) CO during 2016–2020.

Figure A5.
Summer weekly variation in (a) PM2.5, (b) SO2, (c) NO2 and (d) CO during 2013–2015.

Figure A6.
Summer weekly variation in (a) PM2.5, (b) SO2, (c) NO2 and (d) CO during 2016–2020.
References
- Intergovernmental Panel on Climate Change (IPCC). Climate Change 2021: The Physical Science Basis. In Contribution of Working Group I to the Sixth Assessment Report of the Intergovernmental Panel on Climate Change; Cambridge University Press: Cambridge, UK; New York, NY, USA, 2023. [Google Scholar] [CrossRef]
- Lu, X.; Zhang, L.; Wang, X.; Gao, M.; Li, K.; Zhang, Y.; Yue, X.; Zhang, Y. Rapid Increases in Warm-Season Surface Ozone and Resulting Health Impact in China Since 2013. Environ. Sci. Technol. Lett. 2020, 7, 240–247. [Google Scholar] [CrossRef]
- Monks, P.S.; Archibald, A.T.; Colette, A.; Cooper, O.; Coyle, M.; Derwent, R.; Fowler, D.; Granier, C.; Law, K.S.; Mills, G.E.; et al. Tropospheric ozone and its precursors from the urban to the global scale from air quality to short-lived climate forcer. Atmos. Chem. Phys. 2015, 15, 8889–8973. [Google Scholar] [CrossRef]
- Feng, Z.; De Marco, A.; Anav, A.; Gualtieri, M.; Sicard, P.; Tian, H.; Fornasier, F.; Tao, F.; Guo, A.; Paoletti, E. Economic losses due to ozone impacts on human health, forest productivity and crop yield across China. Environ. Int. 2019, 131, 104966. [Google Scholar] [CrossRef] [PubMed]
- Jacob, D.J. Heterogeneous chemistry and tropospheric ozone. Atmos. Environ. 2000, 34, 2131–2159. [Google Scholar] [CrossRef]
- Kleinman, L.I. Low and high NOx tropospheric photochemistry. J. Geophys. Res. Atmos. 1994, 99, 16831–16838. [Google Scholar] [CrossRef]
- Sillman, S.; Logan, J.A.; Wofsy, S.C. The sensitivity of ozone to nitrogen oxides and hydrocarbons in regional ozone episodes. J. Geophys. Res. Atmos. 1990, 95, 1837–1851. [Google Scholar] [CrossRef]
- Liu, C.; Xing, C.; Hu, Q.; Li, Q.; Liu, H.; Hong, Q.; Tan, W.; Ji, X.; Lin, H.; Lu, C.; et al. Ground-Based Hyperspectral Stereoscopic Remote Sensing Network: A Promising Strategy to Learn Coordinated Control of O3 and PM2.5 over China. Engineering 2022, 19, 71–83. [Google Scholar] [CrossRef]
- Chen, X.; Jiang, Z.; Shen, Y.; Li, R.; Fu, Y.; Liu, J.; Han, H.; Liao, H.; Cheng, X.; Jones, D.B.A.; et al. Chinese Regulations Are Working—Why Is Surface Ozone Over Industrialized Areas Still High? Applying Lessons from Northeast US Air Quality Evolution. Geophys. Res. Lett. 2021, 48, e2021GL092816. [Google Scholar] [CrossRef]
- Ma, X.; Huang, J.; Zhao, T.; Liu, C.; Zhao, K.; Xing, J.; Xiao, W. Rapid increase in summer surface ozone over the North China Plain during 2013–2019: A side effect of particulate matter reduction control? Atmos. Chem. Phys. 2021, 21, 1–16. [Google Scholar] [CrossRef]
- Yang, Y.; Zhao, Y. Quantification and evaluation of atmospheric pollutant emissions from open biomass burning with multiple methods: A case study for the Yangtze River Delta region, China. Atmos. Chem. Phys. 2019, 19, 327–348. [Google Scholar] [CrossRef]
- Cao, J.; Peng, X.; Xin, D. Feasibility study of prescribed burning for crop residues based on urban air quality assessment. J. Environ. Manag. 2022, 317, 115480. [Google Scholar] [CrossRef]
- Liu, Y.; Zhao, H.; Zhao, G.; Zhang, X.; Xiu, A. Carbonaceous gas and aerosol emissions from biomass burning in China from 2012 to 2021. J. Clean. Prod. 2022, 362, 132199. [Google Scholar] [CrossRef]
- Huang, X.; Li, M.; Li, J.; Song, Y. A high-resolution emission inventory of crop burning in fields in China based on MODIS Thermal Anomalies/Fire products. Atmos. Environ. 2012, 50, 9–15. [Google Scholar] [CrossRef]
- Stavrakou, T.; Müller, J.-F.; Bauwens, M.; De Smedt, I.; Lerot, C.; Van Roozendael, M.; Coheur, P.-F.; Clerbaux, C.; Boersma, K.F.; van der A, R.; et al. Substantial Underestimation of Post-Harvest Burning Emissions in the North China Plain Revealed by Multi-Species Space Observations. Sci. Rep. 2016, 6, 32307. [Google Scholar] [CrossRef]
- Yu, Y.; Dai, C.; Wei, Y.; Ren, H.; Zhou, J. Air pollution prevention and control action plan substantially reduced PM2.5 concentration in China. Energy Econ. 2022, 113, 106206. [Google Scholar] [CrossRef]
- Huang, L.; Zhu, Y.; Wang, Q.; Zhu, A.; Liu, Z.; Wang, Y.; Allen, D.T.; Li, L. Assessment of the effects of straw burning bans in China: Emissions, air quality, and health impacts. Sci. Total Environ. 2021, 789, 147935. [Google Scholar] [CrossRef]
- Jin, X.; Fiore, A.M.; Cohen, R.C. Space-Based Observations of Ozone Precursors within California Wildfire Plumes and the Impacts on Ozone-NOx-VOC Chemistry. Environ. Sci. Technol. 2023, 57, 14648–14660. [Google Scholar] [CrossRef] [PubMed]
- Xu, L.; Crounse, J.D.; Vasquez, K.T.; Allen, H.; Wennberg, P.O.; Bourgeois, I.; Brown, S.S.; Campuzano-Jost, P.; Coggon, M.M.; Crawford, J.H.; et al. Ozone chemistry in western U.S. wildfire plumes. Sci. Adv. 2021, 7, eabl3648. [Google Scholar] [CrossRef]
- Zhu, Y.; Yang, L.; Chen, J.; Wang, X.; Xue, L.; Sui, X.; Wen, L.; Xu, C.; Yao, L.; Zhang, J.; et al. Characteristics of ambient volatile organic compounds and the influence of biomass burning at a rural site in Northern China during summer 2013. Atmos. Environ. 2016, 124, 156–165. [Google Scholar] [CrossRef]
- Huang, L.; Zhu, Y.; Liu, H.; Wang, Y.; Allen, D.T.; Chel Gee Ooi, M.; Manomaiphiboon, K.; Talib Latif, M.; Chan, A.; Li, L. Assessing the contribution of open crop straw burning to ground-level ozone and associated health impacts in China and the effectiveness of straw burning bans. Environ. Int. 2023, 171, 107710. [Google Scholar] [CrossRef] [PubMed]
- Cao, J.; Wang, H.; Li, J.; Tian, Q.; Niyogi, D. Improving the Forecasting of Winter Wheat Yields in Northern China with Machine Learning–Dynamical Hybrid Subseasonal-to-Seasonal Ensemble Prediction. Remote Sens. 2022, 14, 1707. [Google Scholar] [CrossRef]
- Huang, H.-N.; Yang, Z.; Guo, Y.; Ma, J.-J.; Ming, B.-W.; Yang, J.; Guo, C.; Li, L.; Ou, C.-Q. Impact of agricultural straw open-field burning on concentrations of six criteria air pollutants in China. Environ. Pollut. 2025, 373, 126109. [Google Scholar] [CrossRef]
- Levelt, P.F.; Van Den Oord, G.H.J.; Dobber, M.R.; Malkki, A.; Visser, H.; De Vries, J.; Stammes, P.; Lundell, J.O.V.; Saari, H. The ozone monitoring instrument. IEEE Trans. Geosci. Remote Sens. 2006, 44, 1093–1101. [Google Scholar] [CrossRef]
- Torres, O.; Jethva, H.; Bhartia, P.K. Retrieval of Aerosol Optical Depth above Clouds from OMI Observations: Sensitivity Analysis and Case Studies. J. Atmos. Sci. 2012, 69, 1037–1053. [Google Scholar] [CrossRef]
- Guan, H.; Esswein, R.; Lopez, J.; Bergstrom, R.; Warnock, A.; Follette-Cook, M.; Fromm, M.; Iraci, L.T. A multi-decadal history of biomass burning plume heights identified using aerosol index measurements. Atmos. Chem. Phys. 2010, 10, 6461–6469. [Google Scholar] [CrossRef]
- Kaskaoutis, D.G.; Kumar, S.; Sharma, D.; Singh, R.P.; Kharol, S.K.; Sharma, M.; Singh, A.K.; Singh, S.; Singh, A.; Singh, D. Effects of crop residue burning on aerosol properties, plume characteristics, and long-range transport over northern India. J. Geophys. Res. Atmos. 2014, 119, 5424–5444. [Google Scholar] [CrossRef]
- Martin, R.V.; Fiore, A.M.; Van Donkelaar, A. Space-based diagnosis of surface ozone sensitivity to anthropogenic emissions. Geophys. Res. Lett. 2004, 31, L06120. [Google Scholar] [CrossRef]
- Hong, Q.; Liu, C.; Hu, Q.; Zhang, Y.; Xing, C.; Su, W.; Ji, X.; Xiao, S. Evaluating the feasibility of formaldehyde derived from hyperspectral remote sensing as a proxy for volatile organic compounds. Atmos. Res. 2021, 264, 105777. [Google Scholar] [CrossRef]
- Lee, H.J.; Kuwayama, T.; FitzGibbon, M. Trends of ambient O3 levels associated with O3 precursor gases and meteorology in California: Synergies from ground and satellite observations. Remote Sens. Environ. 2023, 284, 113358. [Google Scholar] [CrossRef]
- Boersma, K.F.; Eskes, H.J.; Richter, A.; De Smedt, I.; Lorente, A.; Beirle, S.; van Geffen, J.H.G.M.; Zara, M.; Peters, E.; Van Roozendael, M.; et al. Improving algorithms and uncertainty estimates for satellite NO2 retrievals: Results from the quality assurance for the essential climate variables (QA4ECV) project. Atmos. Meas. Tech. 2018, 11, 6651–6678. [Google Scholar] [CrossRef]
- De Smedt, I.; Stavrakou, T.; Hendrick, F.; Danckaert, T.; Vlemmix, T.; Pinardi, G.; Theys, N.; Lerot, C.; Gielen, C.; Vigouroux, C.; et al. Diurnal, seasonal and long-term variations of global formaldehyde columns inferred from combined OMI and GOME-2 observations. Atmos. Chem. Phys. 2015, 15, 12519–12545. [Google Scholar] [CrossRef]
- Tan, Y.; Wang, H.; Zhu, B.; Zhao, T.; Shi, S.; Liu, A.; Liu, D.; Pan, C.; Cao, L. The interaction between black carbon and planetary boundary layer in the Yangtze River Delta from 2015 to 2020: Why O3 didn’t decline so significantly as PM2.5. Environ. Res. 2022, 214, 114095. [Google Scholar] [CrossRef] [PubMed]
- Chang, K.-E.; Lin, T.-C.; Hsiao, T.-C.; Lin, J.-X.; Lin, T.-H. Refining satellite-based HCHO/NO2 diagnostics by isolating secondary HCHO: Enhanced mapping of ozone formation sensitivity. Sci. Total Environ. 2025, 983, 179704. [Google Scholar] [CrossRef]
- Bessho, K.; Date, K.; Hayashi, M.; Ikeda, A.; Imai, T.; Inoue, H.; Kumagai, Y.; Miyakawa, T.; Murata, H.; Ohno, T.; et al. An Introduction to Himawari-8/9: Japan’s New-Generation Geostationary Meteorological Satellites. J. Meteorol. Soc. Jpn. Ser. II 2016, 94, 151–183. [Google Scholar] [CrossRef]
- Kurihara, Y.; Tanada, K.; Murakami, H.; Kachi, M. Australian bushfire captured by AHI/Himawari-8 and SGLI/GCOM-C. In Proceedings of the JpGU-AGU Joint Meeting, Tokyo, Japan, 24–28 May 2020. [Google Scholar]
- Friedl, M.A.; Sulla-Menashe, D.; Tan, B.; Schneider, A.; Ramankutty, N.; Sibley, A.; Huang, X. MODIS Collection 5 global land cover: Algorithm refinements and characterization of new datasets. Remote Sens. Environ. 2010, 114, 168–182. [Google Scholar] [CrossRef]
- GB 3095-2012; Ambient Air Quality Standards. Environmental Development Center: Beijing, China, 2012. Available online: https://english.mee.gov.cn/Resources/standards/Air_Environment/quality_standard1/201605/t20160511_337502.shtml (accessed on 11 November 2025).
- Hersbach, H.; Bell, B.; Berrisford, P.; Hirahara, S.; Horányi, A.; Muñoz-Sabater, J.; Nicolas, J.; Peubey, C.; Radu, R.; Schepers, D.; et al. The ERA5 global reanalysis. Q. J. R. Meteorol. Soc. 2020, 146, 1999–2049. [Google Scholar] [CrossRef]
- Liu, J.; Wang, L.; Li, M.; Liao, Z.; Sun, Y.; Song, T.; Gao, W.; Wang, Y.; Li, Y.; Ji, D.; et al. Quantifying the impact of synoptic circulation patterns on ozone variability in northern China from April to October 2013–2017. Atmos. Chem. Phys. 2019, 19, 14477–14492. [Google Scholar] [CrossRef]
- Chen, T.-C.; Collet, F.; Di Luca, A. Evaluation of ERA5 precipitation and 10-m wind speed associated with extratropical cyclones using station data over North America. Int. J. Climatol. 2024, 44, 729–747. [Google Scholar] [CrossRef]
- Huang, L.; Fang, X.; Zhang, T.; Wang, H.; Cui, L.; Liu, L. Evaluation of surface temperature and pressure derived from MERRA-2 and ERA5 reanalysis datasets and their applications in hourly GNSS precipitable water vapor retrieval over China. Geod. Geodyn. 2023, 14, 111–120. [Google Scholar] [CrossRef]
- Stein, A.F.; Draxler, R.R.; Rolph, G.D.; Stunder, B.J.B.; Cohen, M.D.; Ngan, F. NOAA’s HYSPLIT Atmospheric Transport and Dispersion Modeling System. Bull. Am. Meteorol. Soc. 2015, 96, 2059–2077. [Google Scholar] [CrossRef]
- Lai, J.; Zhu, W.; Cui, D.; Mao, L. Extension of the glmm.hp package to zero-inflated generalized linear mixed models and multiple regression. J. Plant Ecol. 2023, 16, rtad038. [Google Scholar] [CrossRef]
- Lai, J.; Zou, Y.; Zhang, S.; Zhang, X.; Mao, L. glmm.hp: An R package for computing individual effect of predictors in generalized linear mixed models. J. Plant Ecol. 2022, 15, 1302–1307. [Google Scholar] [CrossRef]
- Wright, M.N.; Ziegler, A. ranger: A Fast Implementation of Random Forests for High Dimensional Data in C++ and R. J. Stat. Softw. 2017, 77, 1–17. [Google Scholar] [CrossRef]
- Li, K.; Jacob, D.J.; Liao, H.; Shen, L.; Zhang, Q.; Bates, K.H. Anthropogenic drivers of 2013–2017 trends in summer surface ozone in China. Proc. Natl. Acad. Sci. USA 2019, 116, 422–427. [Google Scholar] [CrossRef]
- Li, K.; Jacob, D.J.; Liao, H.; Zhu, J.; Shah, V.; Shen, L.; Bates, K.H.; Zhang, Q.; Zhai, S. A two-pollutant strategy for improving ozone and particulate air quality in China. Nat. Geosci. 2019, 12, 906–910. [Google Scholar] [CrossRef]
- Yang, Z.; Li, Z.; Cheng, F.; Lv, Q.; Li, K.; Zhang, T.; Zhou, Y.; Zhao, B.; Xue, W.; Wei, J. Two-decade surface ozone (O3) pollution in China: Enhanced fine-scale estimations and environmental health implications. Remote Sens. Environ. 2025, 317, 114459. [Google Scholar] [CrossRef]
- Koss, A.R.; Sekimoto, K.; Gilman, J.B.; Selimovic, V.; Coggon, M.M.; Zarzana, K.J.; Yuan, B.; Lerner, B.M.; Brown, S.S.; Jimenez, J.L.; et al. Non-methane organic gas emissions from biomass burning: Identification, quantification, and emission factors from PTR-ToF during the FIREX 2016 laboratory experiment. Atmos. Chem. Physics. 2018, 18, 3299–3319. [Google Scholar] [CrossRef]
- Hatch, L.E.; Jen, C.N.; Kreisberg, N.M.; Selimovic, V.; Yokelson, R.J.; Stamatis, C.; York, R.A.; Foster, D.; Stephens, S.L.; Goldstein, A.H.; et al. Highly Speciated Measurements of Terpenoids Emitted from Laboratory and Mixed-Conifer Forest Prescribed Fires. Environ. Sci. Technol. 2019, 53, 9418–9428. [Google Scholar] [CrossRef]
- Shen, J.; Cohen, R.C.; Wolfe, G.M.; Jin, X. Impacts of wildfire smoke aerosols on near-surface ozone photochemistry. Atmos. Chem. Phys. 2025, 25, 8701–8718. [Google Scholar] [CrossRef]
- Qiu, M.; Kelp, M.; Heft-Neal, S.; Jin, X.; Gould, C.F.; Tong, D.Q.; Burke, M. Evaluating Chemical Transport and Machine Learning Models for Wildfire Smoke PM2.5: Implications for Assessment of Health Impacts. Environ. Sci. Technol. 2024, 58, 22880–22893. [Google Scholar] [CrossRef]
- Chong, K.; Wang, Y.; Liu, C.; Gao, Y.; Boersma, K.F.; Tang, J.; Wang, X. Remote Sensing Measurements at a Rural Site in China: Implications for Satellite NO2 and HCHO Measurement Uncertainty and Emissions From Fires. J. Geophys. Res. Atmos. 2024, 129, e2023JD039310. [Google Scholar] [CrossRef]
- Lichiheb, N.; Ngan, F.; Cohen, M. Improving the atmospheric dispersion forecasts over Washington, D.C. using UrbanNet observations: A study with HYSPLIT model. Urban Clim. 2024, 55, 101948. [Google Scholar] [CrossRef]
- Ha, P.T.M.; Matsuda, R.; Kanaya, Y.; Taketani, F.; Sudo, K. Effects of heterogeneous reactions on tropospheric chemistry: A global simulation with the chemistry–climate model CHASER V4.0. Geosci. Model Dev. 2021, 14, 3813–3841. [Google Scholar] [CrossRef]
- He, S.; Carmichael, G.R. Sensitivity of photolysis rates and ozone production in the troposphere to aerosol properties. J. Geophys. Res. Atmos. 1999, 104, 26307–26324. [Google Scholar] [CrossRef]
Disclaimer/Publisher’s Note: The statements, opinions and data contained in all publications are solely those of the individual author(s) and contributor(s) and not of MDPI and/or the editor(s). MDPI and/or the editor(s) disclaim responsibility for any injury to people or property resulting from any ideas, methods, instructions or products referred to in the content. |
© 2025 by the authors. Licensee MDPI, Basel, Switzerland. This article is an open access article distributed under the terms and conditions of the Creative Commons Attribution (CC BY) license (https://creativecommons.org/licenses/by/4.0/).