Article

Assessment of Outdoor Thermal Comfort in a Hot Summer Region of Europe

by
José Luis Sánchez Jiménez
* and
Manuel Ruiz de Adana
Department of Chemical Physics and Applied Thermodynamics, Cordoba University, 14014 Córdoba, Spain
*
Author to whom correspondence should be addressed.
Atmosphere 2024, 15(2), 214; https://doi.org/10.3390/atmos15020214
Submission received: 14 December 2023 / Revised: 3 February 2024 / Accepted: 6 February 2024 / Published: 9 February 2024

Abstract

:
Heat waves are increasingly frequent in Europe, especially in South European countries during the summer season. The intensity and frequency of these heat waves have increased significantly in recent years. Spain, as one of the southern European countries most affected by these recurring heat waves, particularly experiences this phenomenon in touristic cities such as Cordoba. The aim of this study was to perform an experimental assessment of outdoor thermal comfort in a typical three-hour tourist walkable path of the historical center of Cordoba. The experimental study was carried out in the three-hour period of higher temperatures from 16:30 to 19:30 h CEST (UTC+2) on a normal summer day (6 July 2023), a day with a heat wave (28 June 2023) and a day with a higher heat intensity, called a super heat wave (10 August 2023). Environmental conditions such as a radiant temperature, ambient temperature, wet bulb temperature, air velocity and relative humidity were measured at three different heights corresponding to 0.1 (ankles), 0.7 (abdomen) and 1.7 (head) m. The results show extremely high levels of heat stress in all bioclimatic indices throughout the route. Cumulative heat stress ranged from “very hot” conditions at the beginning of the route to becoming “highly sweltering” at the end of the route. The average temperature excess over the thermal comfort threshold was very high and increased with the heat intensity. In addition, a correlation analysis was carried out between the bioclimatic indices studied, with the UTCI index standing out for its strong correlation with other thermal comfort indices. The findings emphasize the need for interventions to improve the urban environment and promote better outdoor thermal comfort for city dwellers through measures such as green infrastructure, UHI mitigation and increasing public awareness.

1. Introduction

Due to global warming, summer heat waves have intensified in urban areas, where they used to be common, and have started to appear in areas where they have not occurred before. This warming is amplified by population growth [1,2] and the well-known urban heat island effect (UHI). This is an atmospheric phenomenon that usually affects big cities. Its main symptom is a high temperature relative to the temperature in surrounding areas [3]. Ren [4] carried out a review where the impacts of UHI that exacerbate this effect are analyzed. One problem to be considered in the UHI is anthropological heat. This heat source is the heat emitted by cars, buildings or people. When this happens in summer, the UHI effect is increased by air conditioning [5,6,7]. Wang simulated different cases to evaluate the effect of some UHI mitigation techniques (cold pavement, cold roof and the addition of urban vegetation) in three locations in Toronto. It showed that urban shading significantly reduced the effect of UHI [8]. In this context of the increasing environmental threat, the need to understand the effects of thermal stress on the population becomes crucial.
A person should maintain a body temperature of 37 ± 1 °C. Therefore, if a person (whether a worker, tourist, athlete, etc.) is exposed to high temperatures in an area where there is a heat island effect, they start to suffer from thermal stress, as the ability to evaporate the heat received through sweat is reduced. High thermal stress at one point in time can lead to a variety of health problems, such as fatigue, muscle cramps, syncope and heat stroke [9]. The accumulation of this thermal stress is associated with cardiovascular disease [10,11,12]. If this accumulation becomes extreme, the impact can be significant, even leading to death [13,14,15]. According to the Mortality Attributable to Heat in Spain (MAHS) [16], during the summer season of 2023, 13,320 heat-attributable deaths were recorded in Spain, of which 6137 were attributed to moderate heat, 5028 to extreme heat and 2155 to excessive heat.
Considering the significant health risks associated with UHI, several authors conducted research on thermal comfort in outdoor environments. Lai carried out a literature review on thermal comfort in outdoor environments [17]. Abaas simulated thermal comfort in different parts of Baghdad with the reduction of the UHI effect through urban interventions, vegetation and high albedo building materials [18]. This model improved the local climate and promoted human activities in hot and arid environments. Subsequently, a thermal comfort reduction prototype was evaluated in different locations in the city of Baghdad. It concluded that this model could reduce the temperature and thus achieve an acceptable level of thermal comfort [19]. Also, López-Cabeza [20] analyzed the use of building materials with albedo in a building courtyard in Seville. He concluded that albedo has a lot of influence on the surface temperature and, consequently, on external thermal comfort. Zhang [21] investigated the influence of building configurations at Anhui Jianzhu University on thermal comfort. He concluded that semi-enclosed rooms had high thermal comfort. He also indicated that there is a high correlation between the radiant temperature and thermal comfort. In [22], Wallenberg investigated the thermal comfort of five-year-old children in a pre-school playground. Wallenberg concluded that on days of high solar incidence, children avoid going out in the playground for activities, and on days when they do go out, they avoid sunny areas. Therefore, the need to mitigate these effects with shaded areas is reaffirmed. According to several researchers, thermal comfort is influenced by the socio-cultural, physiological, psychological and thermophysical factors of individuals [23,24,25,26,27,28,29]. In addition, the type of activity a person is performing outdoors should be considered in the thermal comfort assessment [30,31].
A common method used by researchers to assess thermal comfort is by analyzing the indices of thermal stress experienced by people. In [4], Ren indicated that of the 100 manuscripts reviewed, the most commonly used thermal comfort indices were PET (43), UTCI (14), WBGT (12) and SET (7). Mayer [32] was one of the first researchers to use the PET index to assess thermal comfort in outdoor environments. He concluded that it is an accurate index, as it adapts to the characteristics of each person. Abaas [18], through a simulation, concluded that urban renewal in different areas of Baghdad would reduce the PET from 64.2 °C to 32.2 °C. In a similar study, Abaas [19] implemented a sustainable prototype in different locations in Baghdad, obtaining a reduction of PET at the most optimal location of up to 18.44 °C. In completely enclosed places, such as courtyards surrounded by buildings, the thermal comfort measured by PET is quite high as there is no airflow. However, if improvements are made to mitigate this effect, such as planting trees or shelters, the PET value decreases considerably [21]. Narimani [33] found PET values between 24.5 °C and 29.8 °C in the hot and dry climate of Isfahan in Iran. He found that the PET value could be decreased by up to 1.8 °C by planting trees with tall trunks and wide canopies. Błażejczyk [34] assessed the thermal stress experienced by workers in different workplaces using the WBGT index. He found values of 23 °C in canyon streets. However, this value decreased in rural areas, to 17 °C. In these same scenarios, but at night, values of 17 °C and 10 °C were achieved, respectively. Cheuvront evaluated the thermal stress suffered by an athlete in the 2021 Boston Marathon [35]. It was measured in three zones of the marathon and WBGT values between 17 °C and 20 °C were obtained. This resulted in a yellow flag warning athletes to exercise caution. A similar study was carried out in [36]. Inoue analyzed the thermal stress experienced by participants of the Tokyo 2020 Olympic and Paralympic Games. For 74% of the time during the Olympic Games, there was a temperature above 30 °C (sweltering), according to the WBGT index. In contrast, at the Paralympic Games, only 31% of the time the temperature exceeded 30 °C. Gao [37] evaluated the thermal comfort of a pedestrian moving from a high solar incidence area to a semi-open shelter with a spraying system using the SET index. The SET improved by 8.8 °C when the walker entered the semi-open shelter. However, it concluded that one should not stay for a long time in this space, as prolonged spraying can decrease thermal comfort. In [38], Yuan studied the application of retroreflective materials to the exterior walls of buildings to mitigate the UHI effect and thus mitigate thermal comfort in the summer season. The SET decreased by 0.5 °C due to these materials. Recently, the Universal Thermal Climate Index, UTCI, [39] was introduced. Several researchers have conducted experimental studies in outdoor environments and compared this new index with the indices used so far. Blazejczyk [40], Zare [41] and Asghari [42] concluded that UTCI is very sensitive to changes in ambient temperature, radiant temperature, relative humidity and wind speed. In addition, they indicated that it correlates to a high percentage with indices derived from human heat balance models. However, it does not correlate with single equation indices. Li considered a thermal comfort analysis by correlating different thermal comfort indices with Thermal Sensation Votes (TSV) [43]. UTCI obtained the highest correlation (29.8%), followed by SET (24.4%) and PET (16.5%). These results show that the detailed examination of thermal stress indices is required in addressing heat-related issues in outdoor city environments.
Other outdoor thermal studies were carried out in arid and dry climate cities [18] and in a slightly hot summer [22]. According to Peel [44], the city of Cordoba (Spain) is representative of many climatic zones in southern Europe, as in [20] and similar in [21,23,25,26]. It is classified as a Mediterranean climate (Csa). This indicates that the summer is hot and dry and the winter is cool and humid. In the year 2022, Spain was the third country in Europe with the highest Cooling Degrees Day, CDD, (384), with Cordoba being one of the cities with the highest CDD [45]. The Global Warming Index (GWI) shows the evolution of climate change. A recent report [46] of the Ministry of Sustainability, Environment and Blue Economy of the Andalusian Regional Government, Spain, shows that the GWI temperature in Cordoba increased to 23.5 °C in 2022, with the average temperature in Andalusia being 11.8 °C. At the national level, a study [47] on thermal stress has been elaborated analyzing the UTCI index in all cities in Spain. Cordoba had a UTCI of 38 °C in 2010 and is predicted to increase to 43.6 °C in 2090, with the average for Spain being 36.4. This indicates that Cordoba is one of the cities in Spain with the worst prognosis in terms of climate change. The data obtained from the AEMET database [47] show that heat waves are frequent from June to September, with temperature peaks of over 40 °C. In addition, the environment tends to be dry due to low relative humidity (31–48%) and low rainfall (0–3 days of rain).
Cordoba holds four inscriptions in the World Heritage List granted by the UNESCO: the Mosque–Cathedral, the historical quarter surrounding it, the Festival of the Patios (Courtyards) and Medina Azahara [48]. As a result, more than two million tourists visit Córdoba every year [49]. However, tourists visiting the city of Cordoba in summer could experience severe thermal stress. For all the above reasons, the city of Cordoba was chosen for the assessment of Outdoor Thermal Comfort.
Previous outdoor thermal comfort studies were carried out using a simulation through Envi-Met software [18] or using meteorological data measured by a stationary weather station [20,21,22,23,25,26] located far away from the city center. In contrast, in this experimental study, data were measured in situ on a tourist route using a mobile measurement pole to register a complete set of climatic variables, as in [23]. In [20,21,25,26], measurements were carried out in different seasons. In this study, experimental measurements were carried out on different days in the summer season in order to obtain the heat stress indices [4] such as UTCI [18,19,21,34,39,40,41,42,43], PET and mPET [32,33,40,41,42,43], SET [37,38,40,41,43] and WBGT [34,35,36,41] for the assessment of temporal and cumulative outdoor thermal comfort. Furthermore, the heat stress exposure (HSE) metric [50] was also evaluated using UTCI, as in [50], and using the other indices as well.
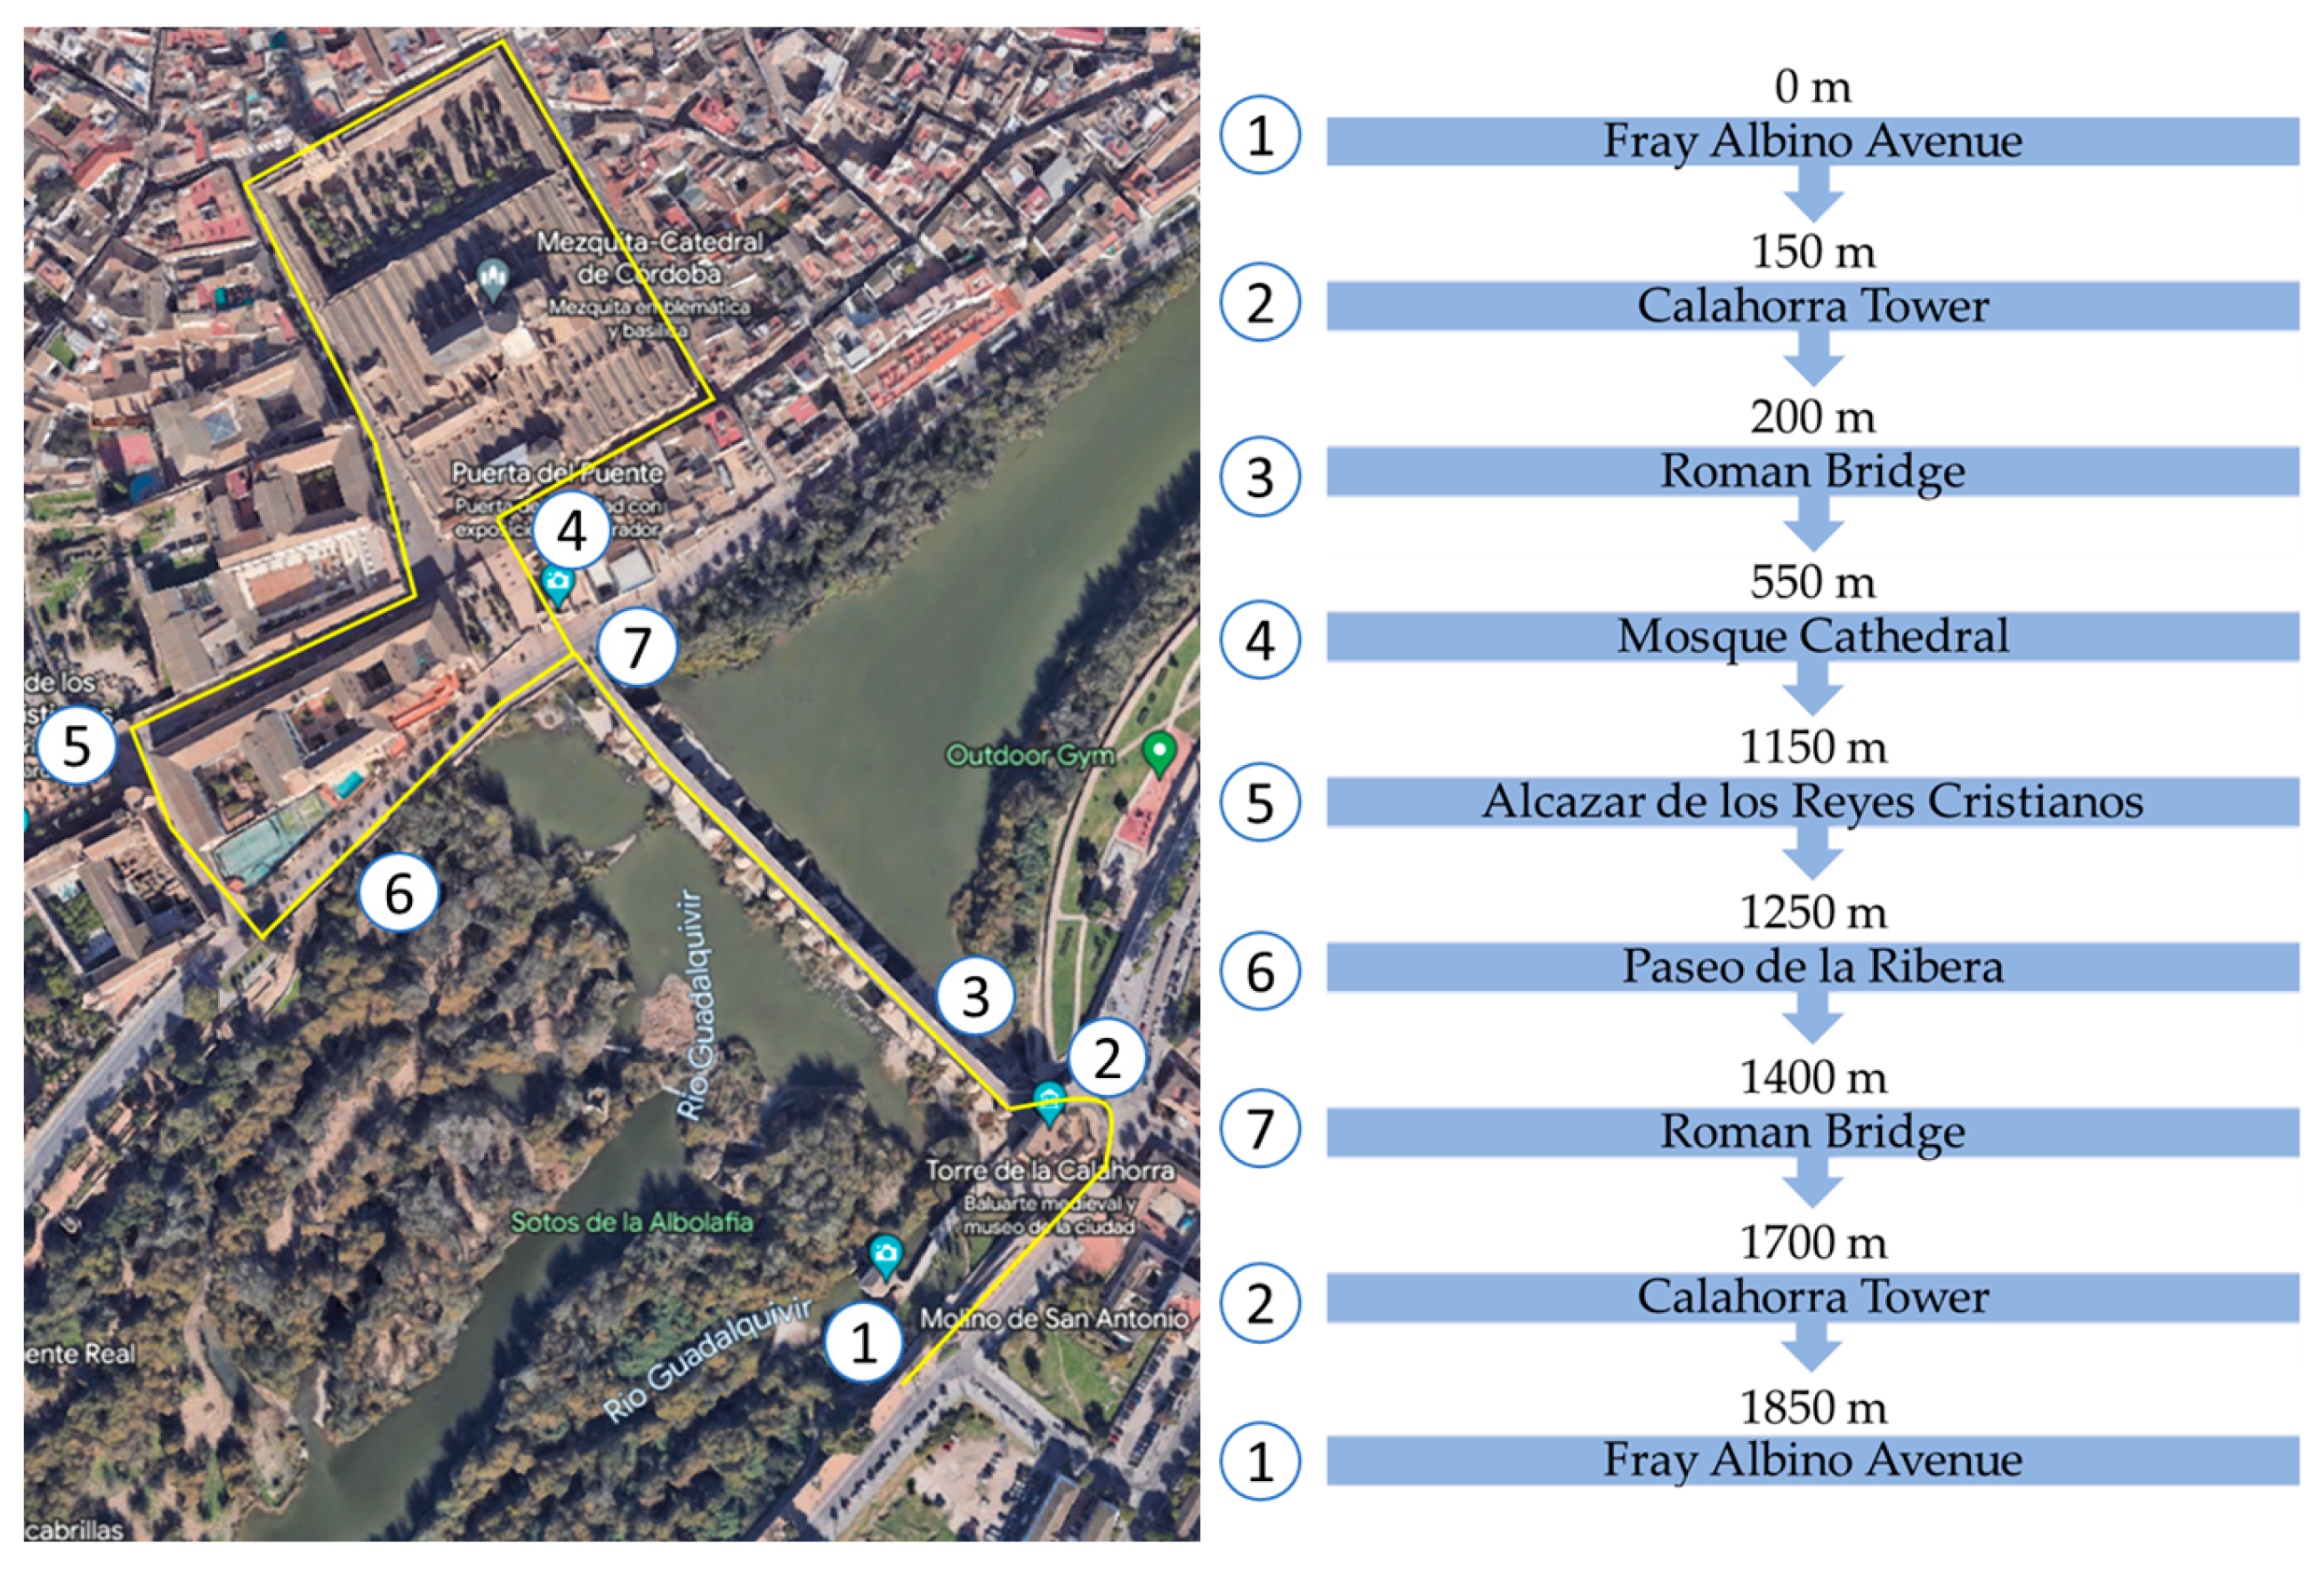
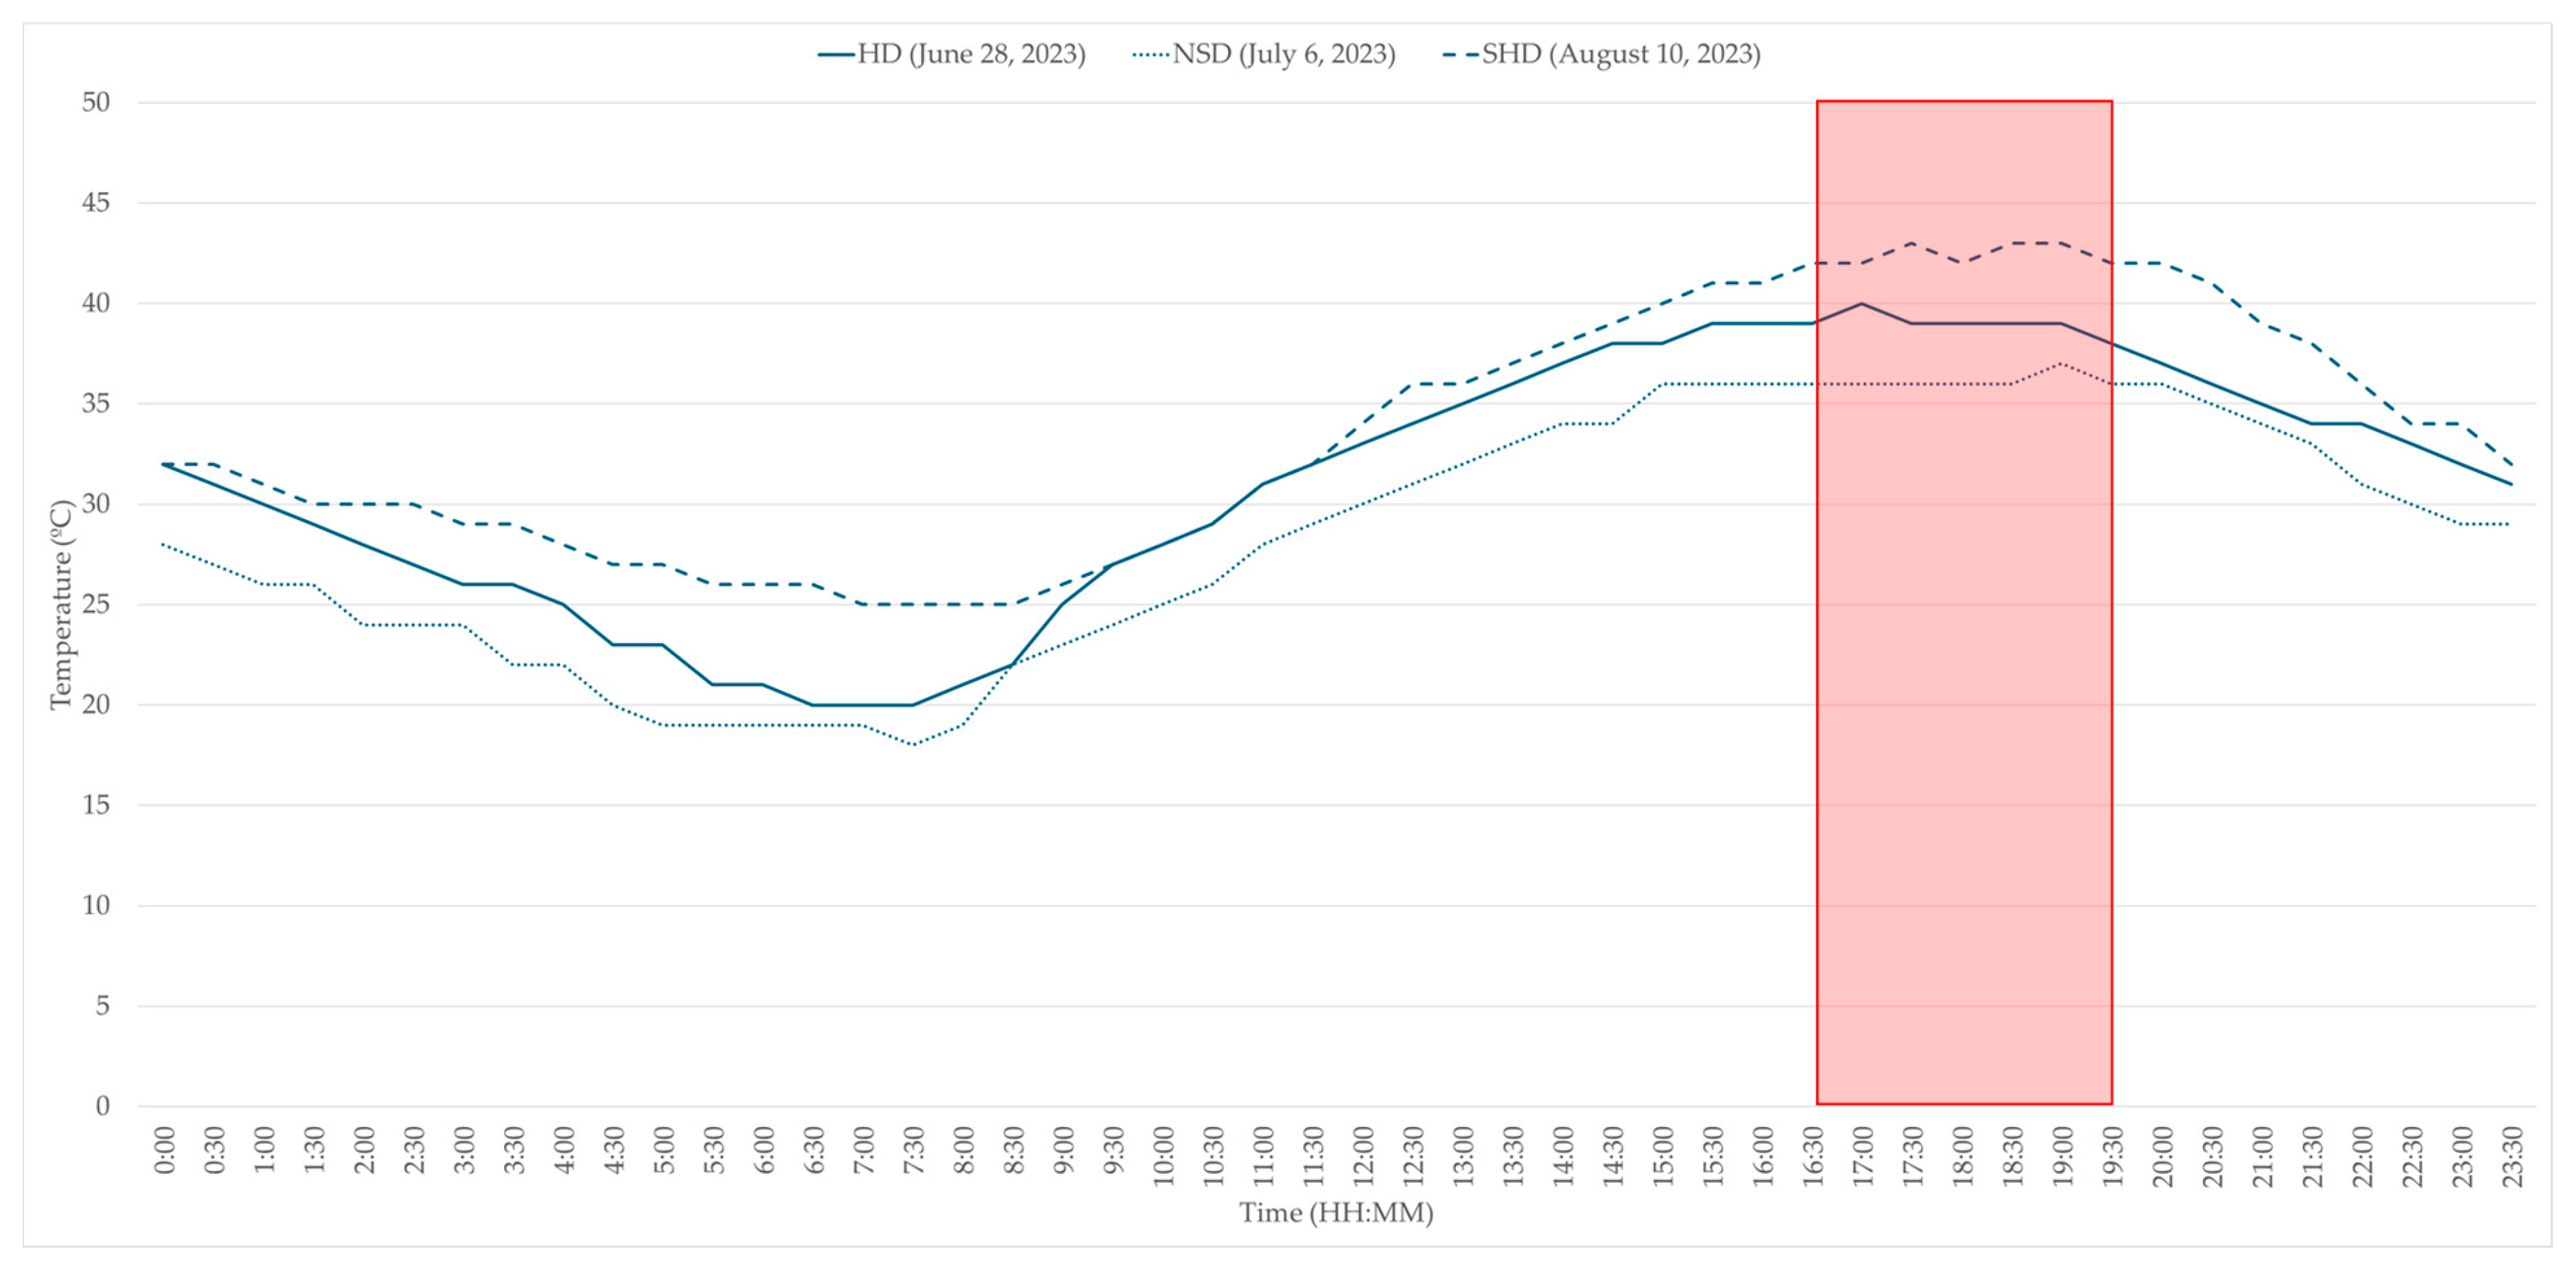
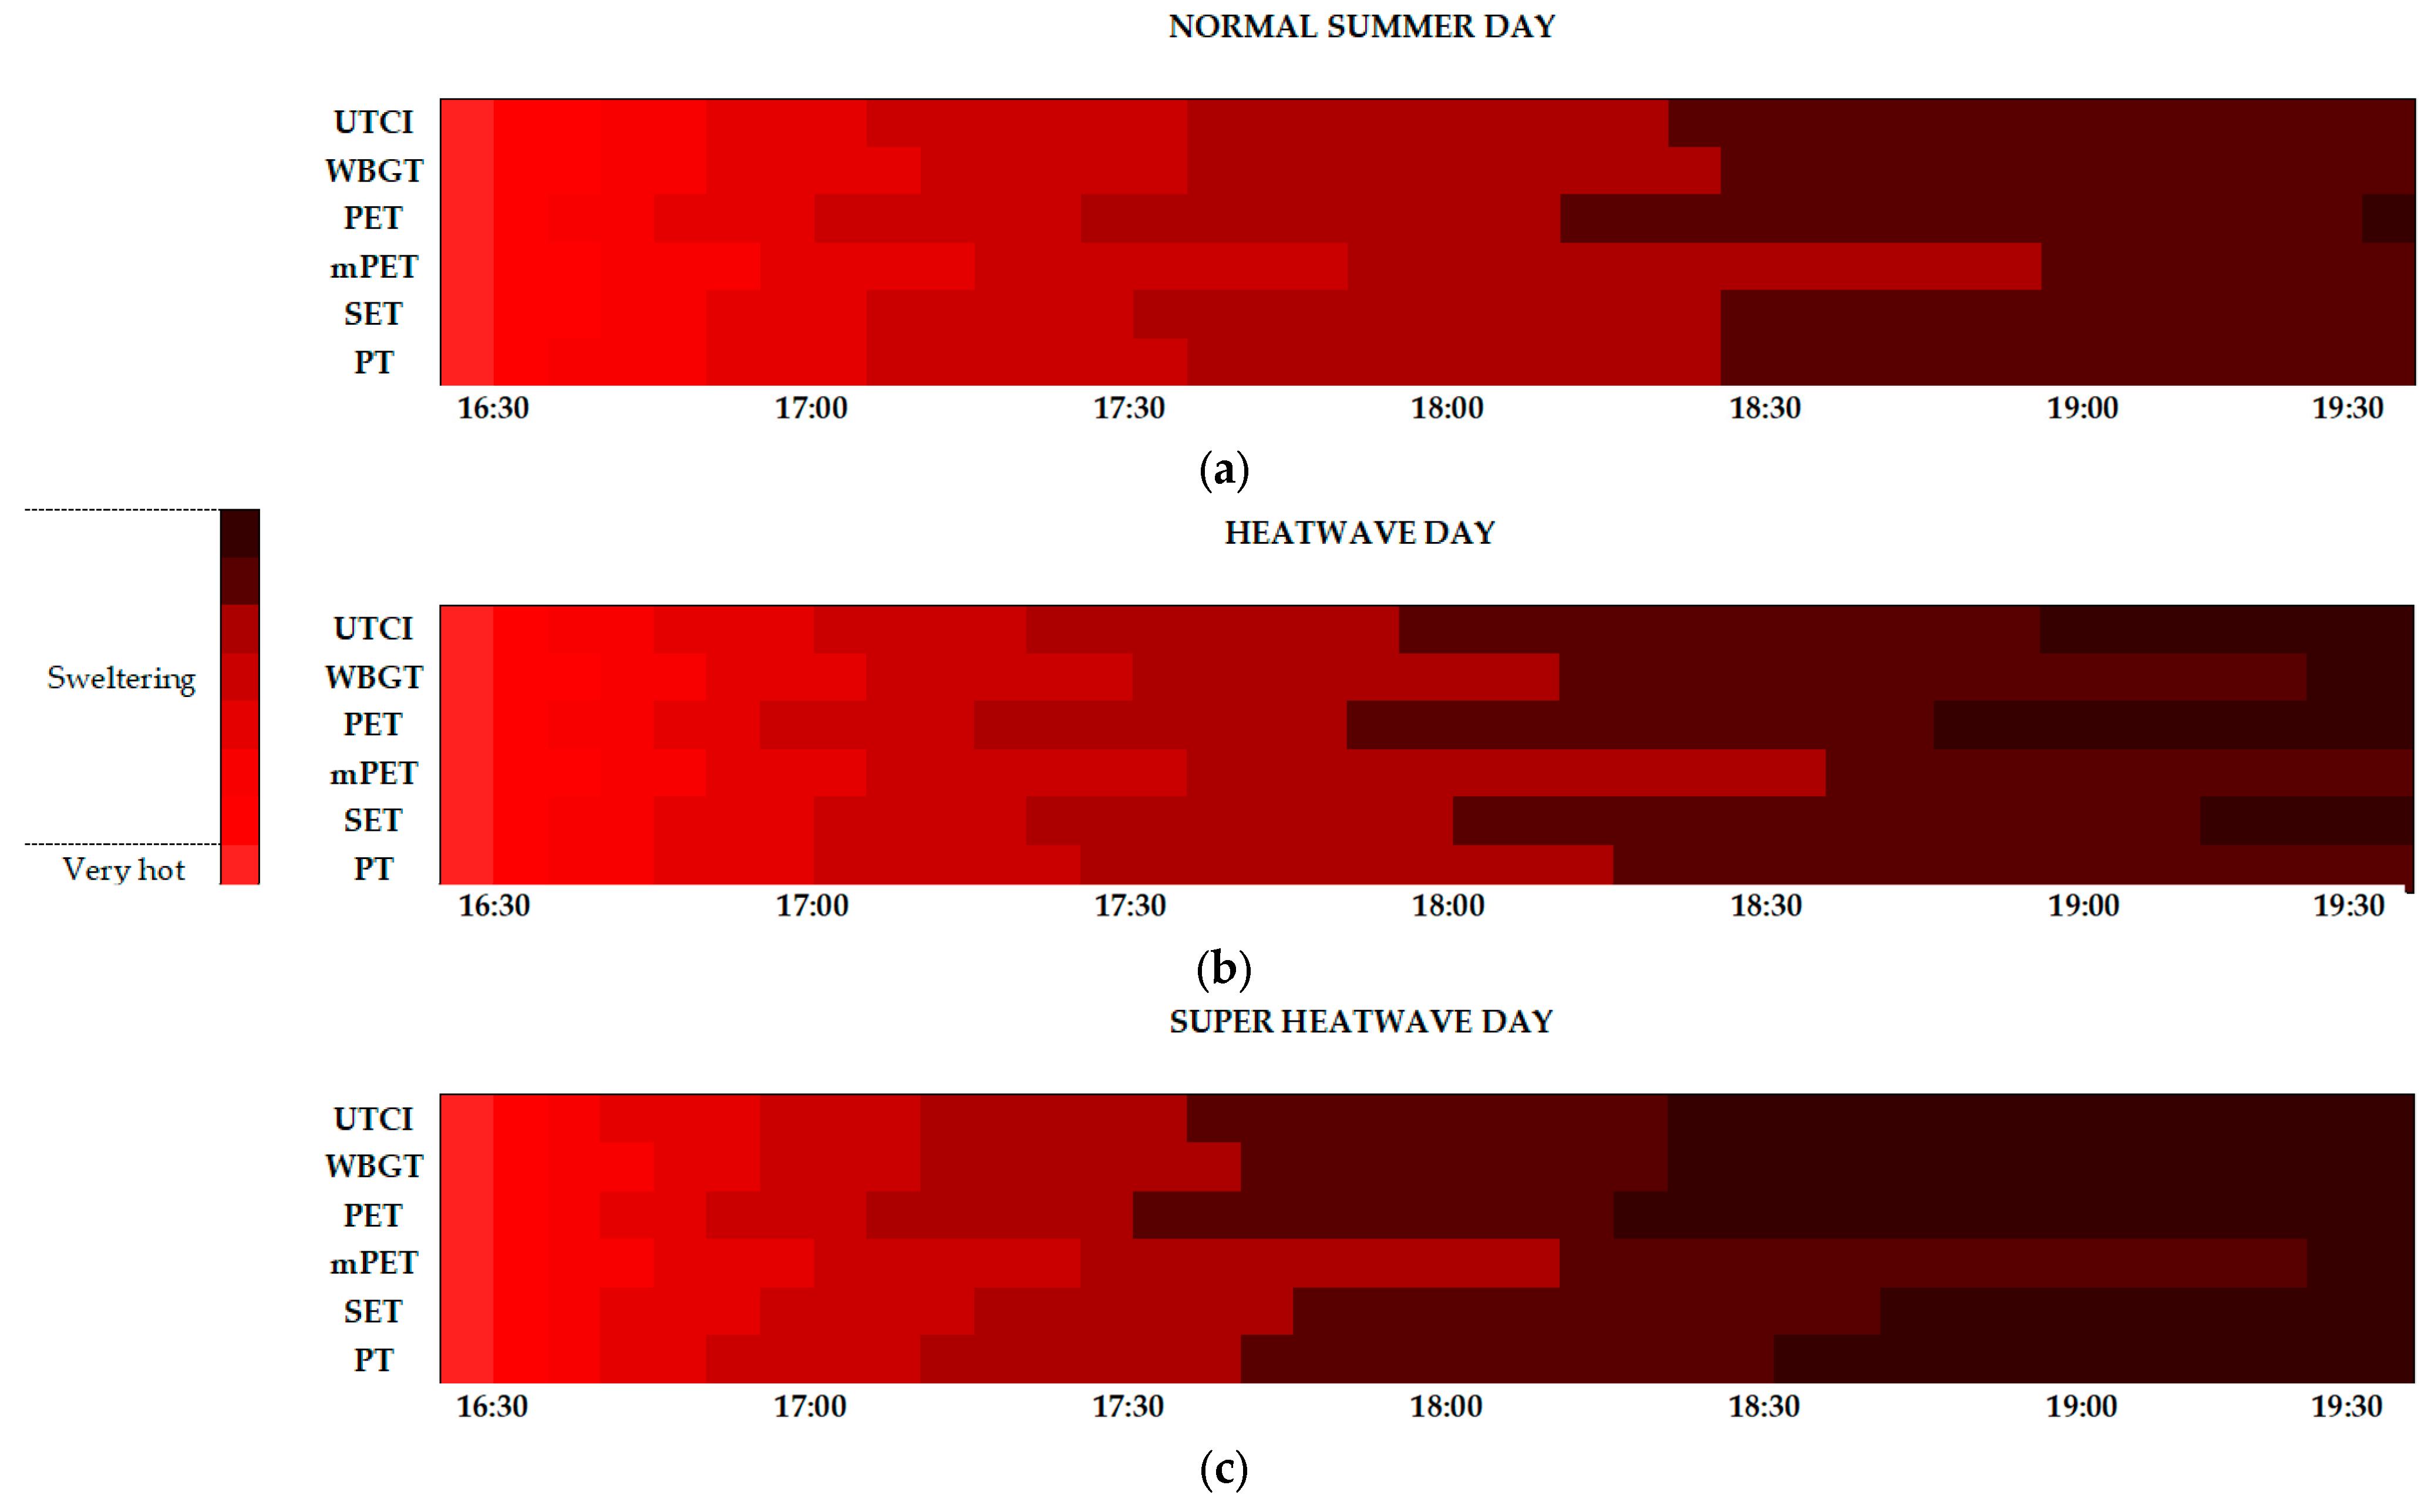
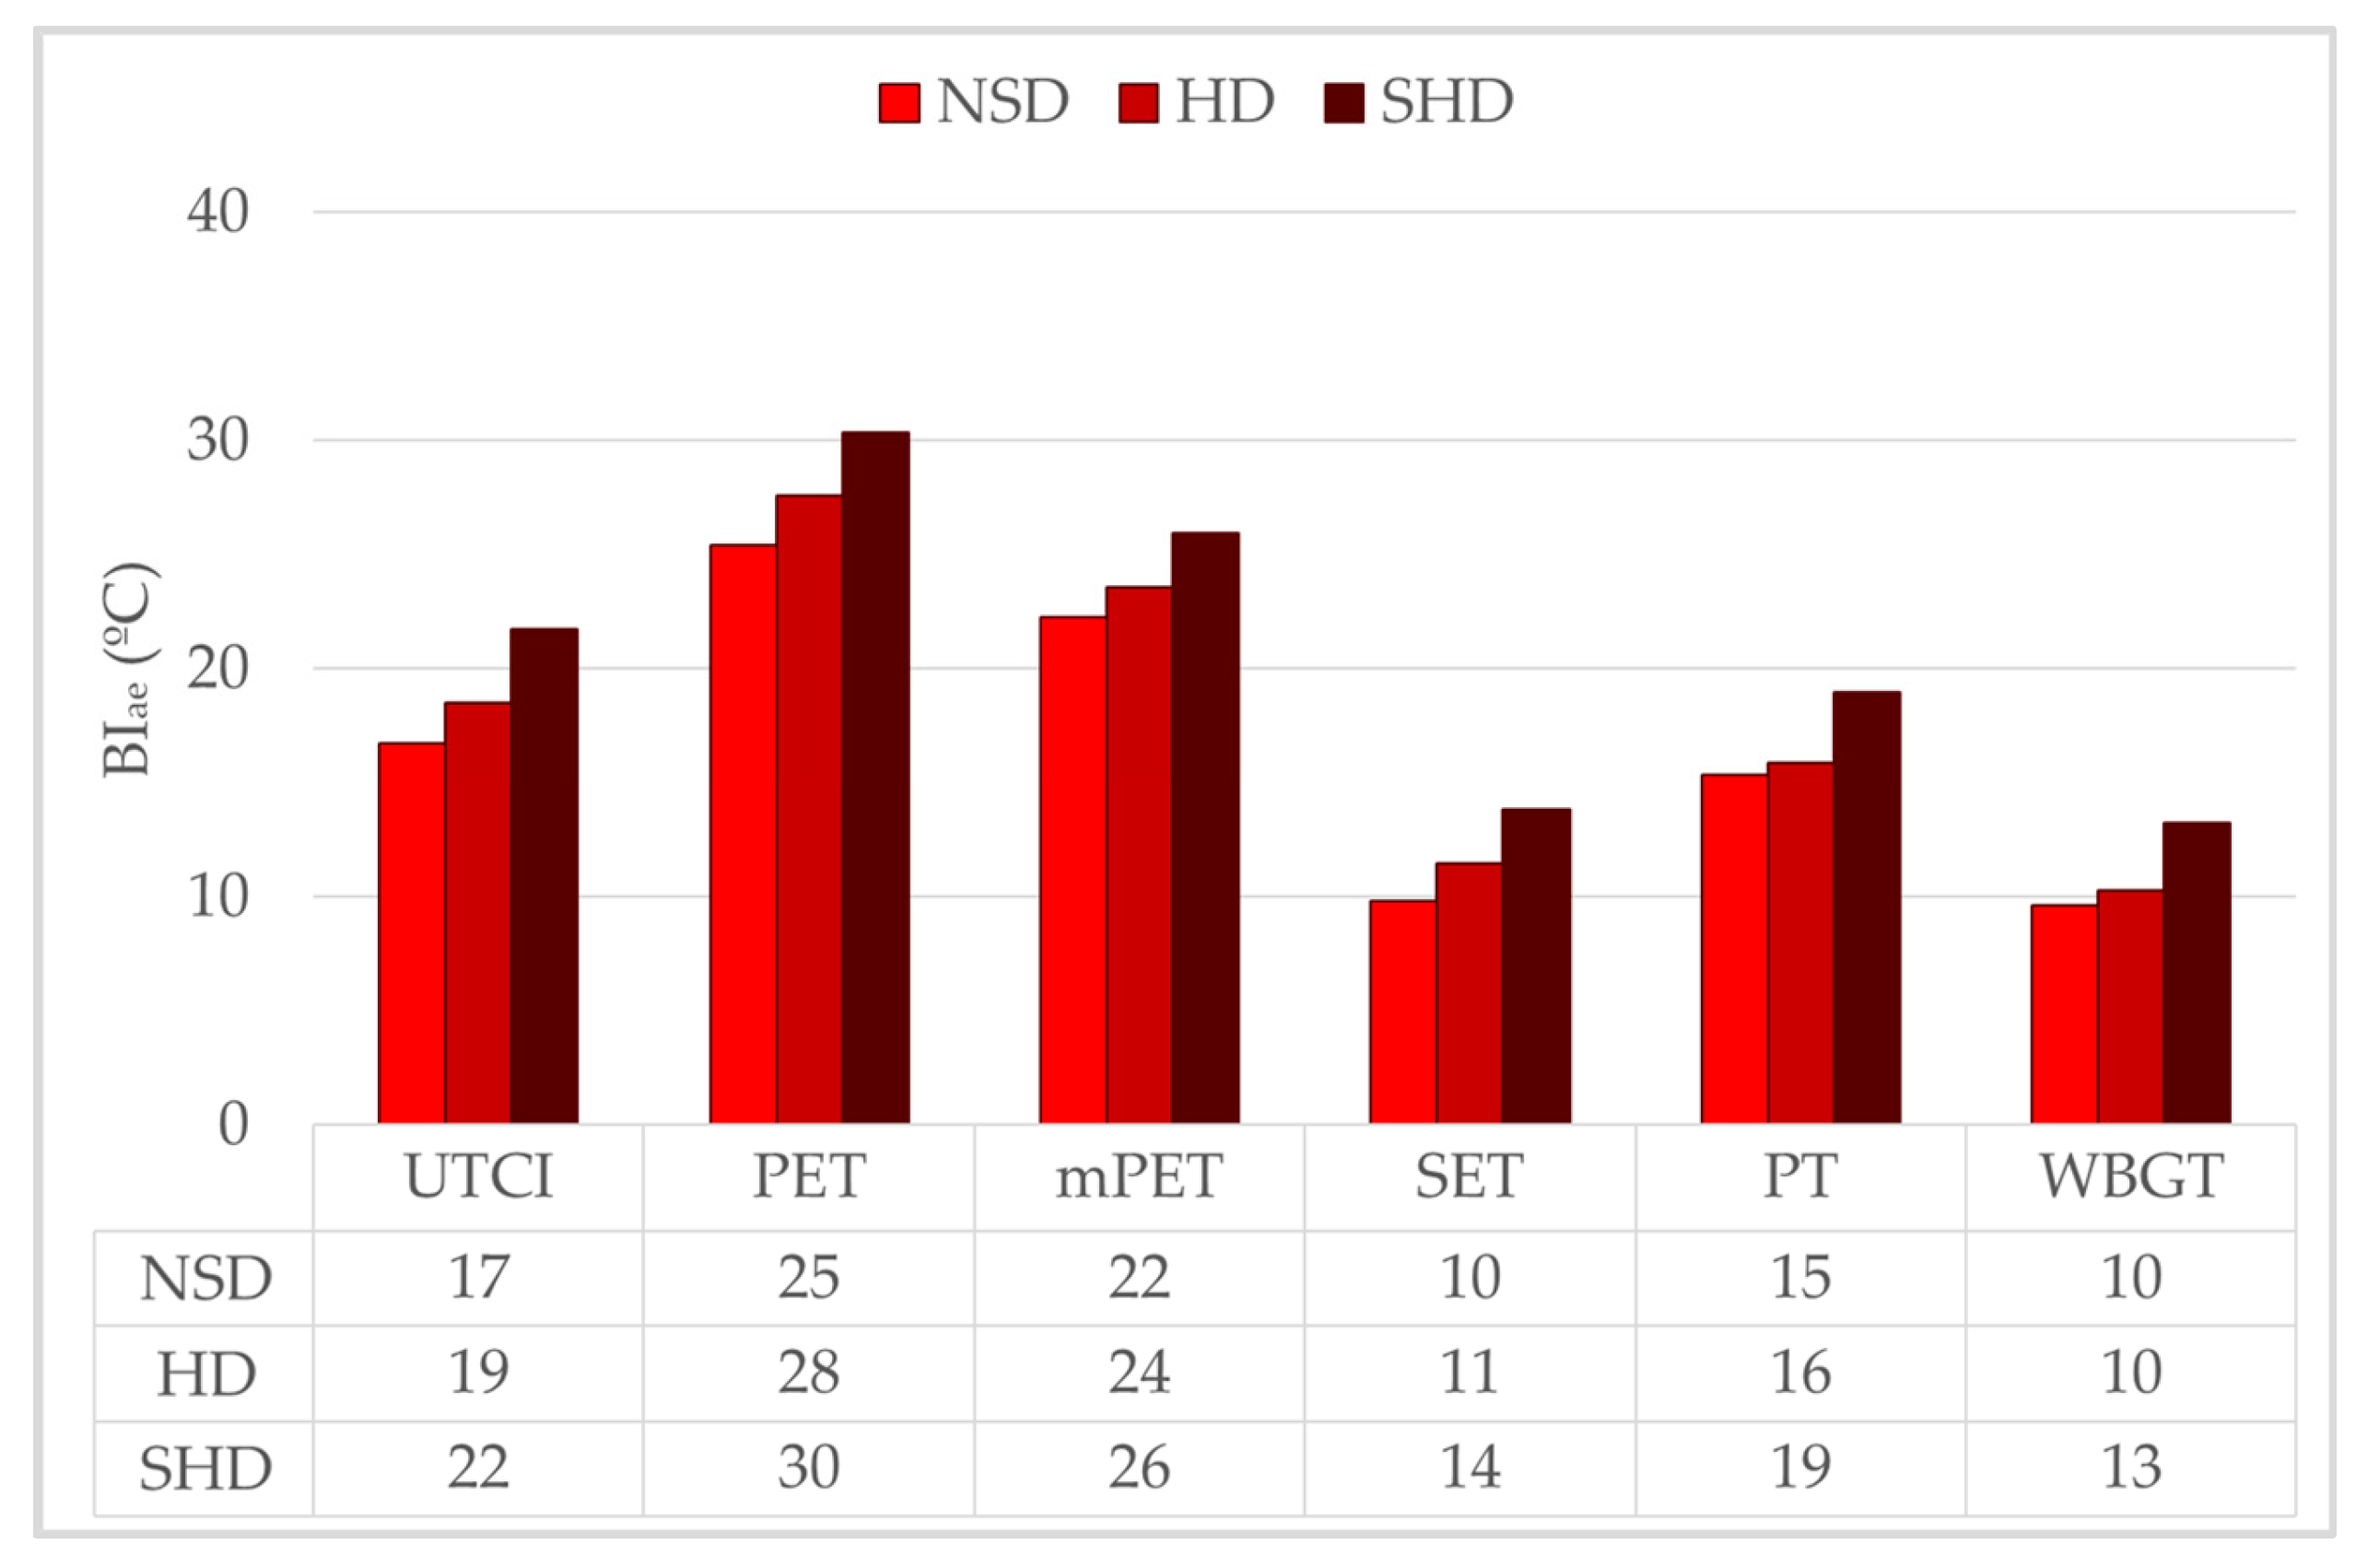
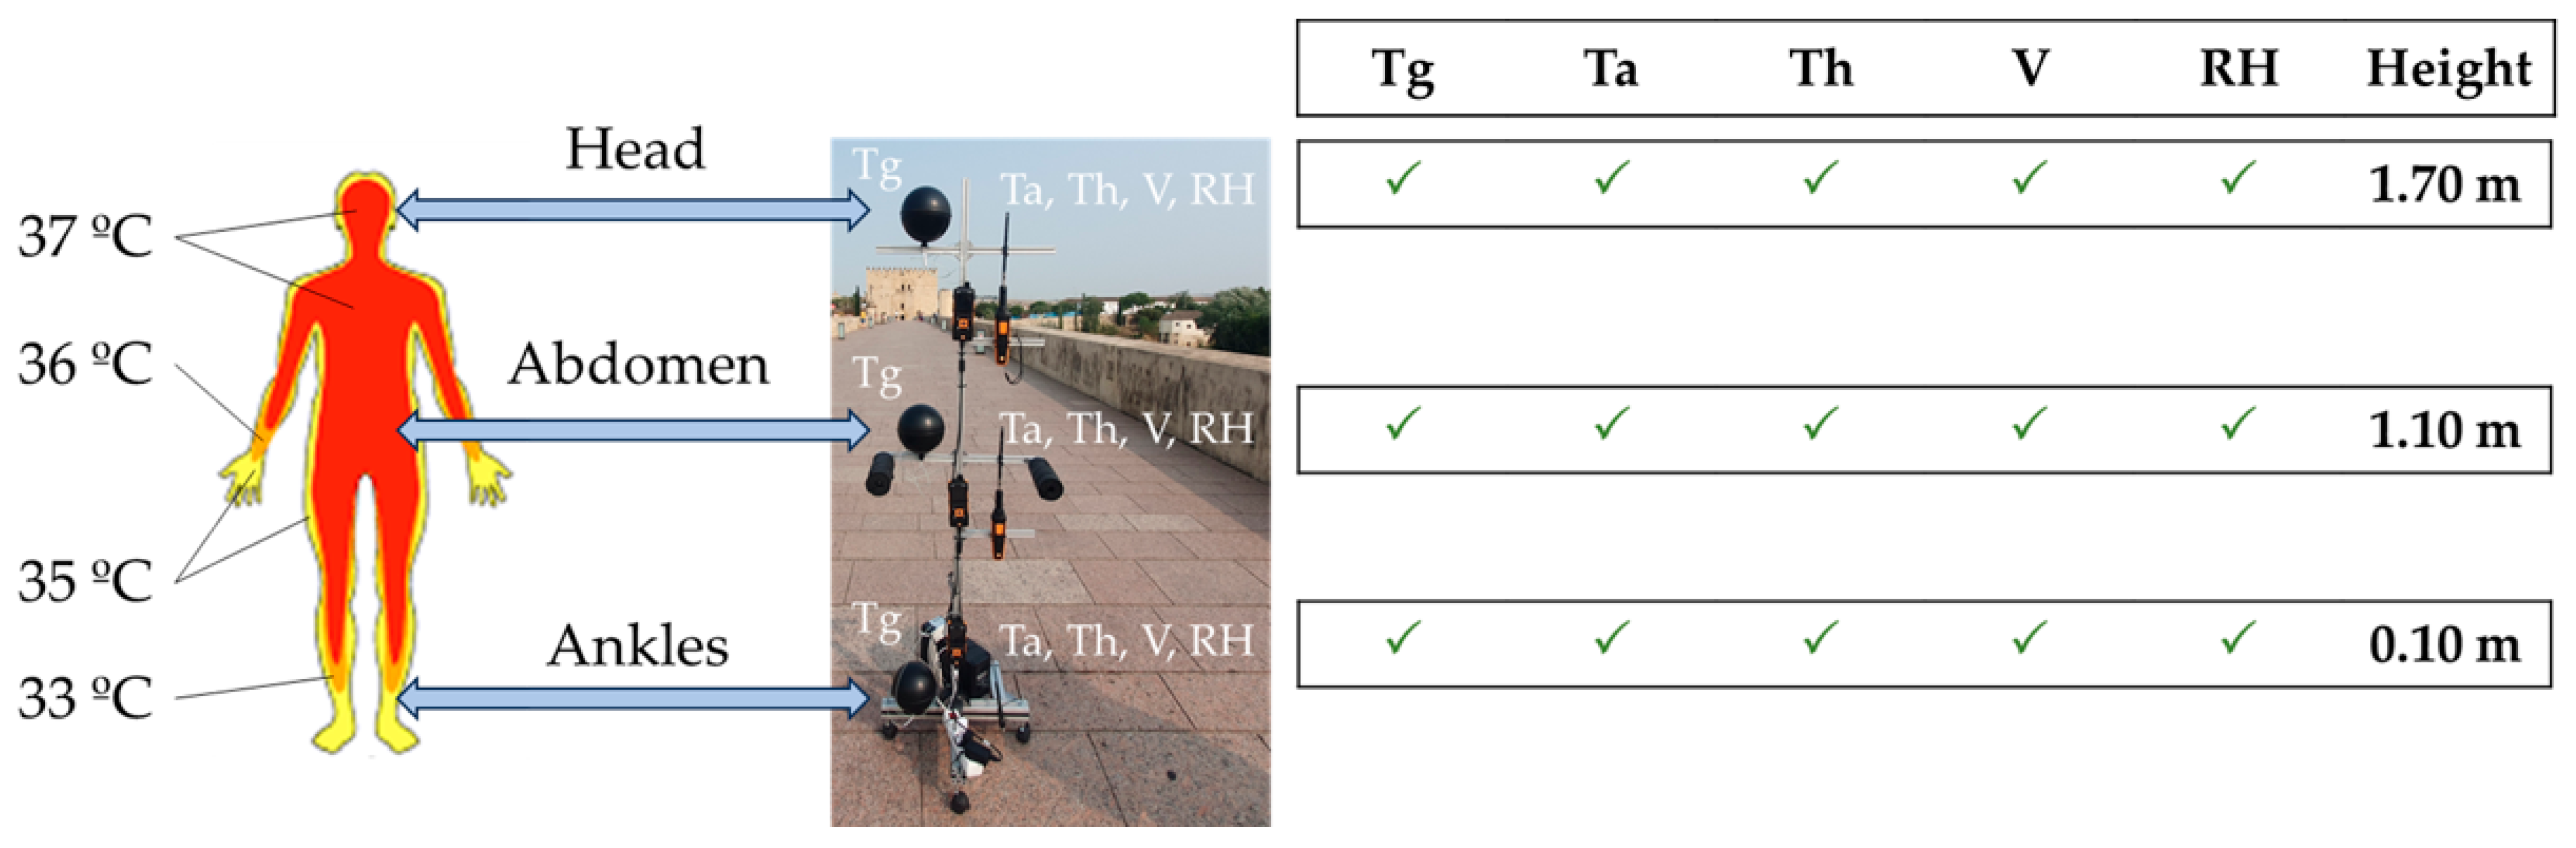
This paper aimed to conduct a comprehensive assessment of human heat stress, comparing various thermal stress indices under both normal summer days and heat wave conditions defined by meteorological parameters. Also, the objective involved evaluating the thermal comfort conditions of outdoor spaces and identifying the most suitable bioclimatic indices, deriving city comfort indices to represent thermal comfort in Cordoba as a case study for a medium-sized touristic city in Southern Europe. To assess outdoor thermal comfort along a typical three-hour walkable path in the city center, a heat stress metric that considers both the duration and intensity of urban heat exposure was employed, utilizing a multi-node numerical model of human thermal physiology. In situ monitoring was conducted using a measurement pole simulating a tourist, measuring different climatic values on a typical touristic route in the center of Cordoba during the three hours of higher temperatures (16:30–19:30) CEST (UTC+2) [51] on a normal summer day on 6 July 2023, a heat-wave day on 28 June 2023 and a super-heat-wave day on 10 August 2023.

2. Materials and Methods

2.1. Study Area

The experimental study was carried out in Córdoba, Spain. Cordoba is located at longitude 4° 46 min and latitude 37° 53 min with an elevation of 106 m above sea level. Cordoba is located in climate zone B4 according to the Technical Building Code (CTE) [52].
This study was conducted in one of the most important tourist areas of the city of Cordoba. Touristic route carried out was Fray Albino Avenue—Calahorra Tower—Roman Bridge—Mosque Cathedral—Alcazar de los Reyes Cristianos—Paseo de la Ribera—Roman Bridge—Calahorra Tower—Fray Albino Avenue, see Figure 1. This touristic route has a total length of 1850 m.
The measurements were carried out in this touristic route during the summer season of 2023. According to AEMET [53], the Spanish State Meteorological Agency, a heat wave is considered to be an episode of at least three consecutive days in which at least 10% of the weather stations considered record maximum temperatures above the 95% percentile of their daily maximum temperature series for the months of July and August in the period 1971–2000. AEMET declared up to five heat waves in Spain in 2023, with Cordoba being one of the worst affected cities. In the first heat wave declared by AEMET, a first experimental test was carried out on 6 July 2023, which was called heat-wave day (HD). During the period when the heat wave warning was not activated, a second experimental test was carried out on 28 June 2023, and was therefore called normal summer day (NSD). Finally, the AEMET issued a warning of a wave with greater intensity in the month of August. Here, the third experimental test was carried out on 10 August 2023 and it was called super-heat-wave day (SHD) due to its greater intensity [51].
To check that the environmental conditions obtained on three summer days in this study are representative of the summer season, the values of variables such as temperature, velocity and relative humidity obtained from the Cordoba-Airport weather station, WS2, from the year 2000 to the year 2023 have been analyzed, see Table 1. WS2 is the reference station in Cordoba, established by AEMET [51].
As shown in Table 1, average data for temperature, air velocity and relative humidity from year 2000 to year 2022 (27.5 °C, 2.8 m/s and 38%) are similar to those measured in year 2023 (28.7 °C, 3.0 m/s and 32%, respectively) for the summer period. Positive deviation of 1.2 °C is obtained for the average data of temperature, mainly due to several heat wave periods during the summer months of 2023. These trends for summer Cordoba’s outdoor conditions could be considered to be representative of similar outdoor summer conditions in other Southern Europe cities.
Analysis of registered temperatures from the WS2 [51] was carried out over several weeks during the summer season in order to select different days for the experimental tests. Three days were selected, 6 July 2023, 28 June 2023 and 10 August 2023, representing normal, heat-wave and super-heat-wave days. For each selected day, the period of three consecutive hours with the higher temperatures was identified between 16:30 and 19:30, see Figure 2.

2.2. Measurements Device

A measurement pole to simulate a tourist male, 32 years old, of 1.70 m height and 70 kg weight with walking shorts and a short-sleeve shirt, 0.36 clo. For walking speed of a tourist, 4 km/h was considered. This speed corresponded to a metabolic activity of 165 W [54].
Measurement pole was divided into three heights: ankles, 0.10 m, abdomen, 1.10 m, and head, 1.70 m. A hot wire sensor (06351570, Testo, Barcelona, Spain) and a black sphere of 150 mm diameter (SFT-SCB-10-6-100, KIMO, Lesquin, France), at the center of which was the temperature probe. A type-K thermocouple (06020645, Testo, Barcelona, Spain) was located at each height, see Figure 3, to measure the globe temperature, Tg. Hot wire sensor measured ambient temperature, Ta (with an accuracy of ±0.5 °C in the range of −20 to 70 °C), relative humidity (with an accuracy of ±3%RH in the range of 5 to 95%), air velocity (with an accuracy of ±0.03 m/s + 4% del v.m. in the range of 0 to 50 m/s) and wet bulb temperature, Th (with an accuracy of ±0.5 °C in the range of −20 C to 70 °C). Type-K thermocouple measured radiant temperature (with an accuracy of class 2 (−40 °C to 1200 °C) in the range −50 to 400 °C). These variables were registered on a portable analyzer (05604401, Testo, Barcelona, Spain). The measurement registered by the sensors in the pole was referenced as a local experimental weather station, WS1.

2.3. Experimental Indices

The assessment of thermal stress carried out in this study has been conducted through different experimental thermal indices. The thermal comfort indices evaluated in this study were the UTCI index, simple bioclimatic index and indexes derivative of heat budget models.

2.3.1. Universal Thermal Climate Index (UTCI)

Indices that consider air temperature and/or relative humidity have been considered by different authors for decades for the assessment of outdoor thermal comfort [14]. Therefore, Commission 6 of the International Society for Biometeorology (ISB) decided to develop a global index called Universal Thermal Climate Index (UTCI) of the latest generation. UTCI is derived from the multi-nodal model of human thermal equilibrium [55].
UTCI has been developed by ISB together with Cooperation in Science and Technology (COST Action 730) since 2005. The Universal Thermal Climate Index is a comprehensive biometeorological index which analyzes the four main physiologically significant and interacting environmental parameters of mean radiant temperature, air temperature, humidity and wind speed, combined with two personal parameters describing the subject (metabolic rate and clothing insulation) to realistically predict human thermal physiological stress [56].
The UTCI has certain limitations that must be considered when using it. Its complex mathematical equation complicates its interpretation for those unfamiliar with its parameters and its sensitivity to meteorological variables can impact the accuracy of the results. Also, the reliance on multiple meteorological variables implies a higher cost in the measurement equipment and an increase in the time required to process the data. Despite this, the UTCI is recognized by several authors as an integral index in the assessment of thermal comfort [40,50,57,58,59,60]. Due to its complexity, the calculation of UTCI has been carried out through Bioklima [61].
The thermal stress assessment based on UTCI is shown in Table 2.

2.3.2. Simple Bioclimatic Indices (WBGT)

This group includes indices that consider the collective impact of various meteorological factors on the human body, including air temperature, wind speed or relative humidity. The Wet Bulb Globe Temperature, WBGT, is considered the most accurate index for assessing thermal stress in both indoor and outdoor workers. It has been considered in this study, although the simulated person would not be carrying out any work. According to [62], WBGT is calculated through Equation (1):
W B G T = 0.7 · T h + 0.2 · T g + 0.1 · T a
where Th is the wet bulb temperature, Tg is the globe temperature and Ta is the ambient temperature.
The thermal stress assessment based on WBGT is shown in Table 3.

2.3.3. Heat Budget Models (SET, PT, PET and mPET)

Standard Effective Temperature, SET, is a rational and the most comprehensive comfort temperature index. SET is defined as the dry bulb temperature of a hypothetical isothermal environment at 50% RH in which a human subject, while wearing clothing standardized for activity concerned, would have the same skin wittedness and heat exchange at skin surface as he would have in the actual test environment. Previous studies have used the SET index to assess thermal stress [63,64].
The thermal stress assessment based on SET is shown in Table 4.
The Perceived Temperature (PT) is an equivalent temperature based on a complete heat budget model of the human body. PT [65] is designed for staying outdoors and is defined as the equivalent temperature of an isothermal reference environment with a wind reduced to light air and a relative humidity of 50%, where the same perception of warm or cold assessed by Predicted Mean Vote (PMV) would occur as under the actual environment.
The thermal stress assessment based on PT is shown in Table 5.
Physiological Equivalent Temperature, PET, is one of the most commonly used indices for measuring heat stress in outdoor spaces. PET [58,66] is defined as the physiological equivalent temperature at any given place (outdoors or indoors) and is equivalent to the air temperature at which, in a typical indoor setting, the heat balance of the human body is maintained with core and skin temperatures equal to those under the conditions being assessed. PET is an index derived from the Munich Energy-balance Model for individuals (MEMI). PET is affected by mean radiant temperature, dry temperature, relative humidity and wind speed.
The thermal stress assessment based on PET is shown in Table 6.
PET is an index that does not consider the vapor pressure in warm and humid regions, it minimally considers the influence of clothing. Furthermore, it is derived from an obsolete model. This led to the development of the modified Physiological Equivalent Temperature, mPET, which is more sensitive to vapor pressure and clothing insulation and has been proven to be more suitable for humid and hot climate regions. Calculating mPET [67] value requires six parameters: ambient temperature, humidity relative, wind speed, solar radiation, clothing and metabolic rate. The thermal stress assessment based on mPET is the same as in PET, Table 5.
The software Rayman Pro version 2.1 [68] was used to calculate SET, PT, PET and mPET.

2.3.4. Urban Heat Island Effect

The urban heat island effect (UHIE) in the city of Cordoba was analyzed comparing ambient conditions registered, at the same time, by two different weather stations, WS1 and WS2. WS1 is located on the city center, see Figure 3. WS2 is located at Cordoba-Airport, 9 km away from the city center. WS2 is surrounded by green areas on the outskirts of the city.
The urban heat island effect was defined using Equation (2):
U H I E = T w s 1 T w s 2
where T w s 1 and T w s 2 correspond to the dry air temperature registered at the same time by the weather station WS1 and the weather station WS2.

2.3.5. Correlation Coefficient

Equation (3) of Pearson correlation coefficient ( r ) was considered to carry out a correlation [69,70,71,72] of the WBGT, SET, PT, PET and mPET indices with the UTCI index:
r = i = 1 N x i x ¯ · y i y ¯ i = 1 N x i x ¯ 2 · i = 1 N y i y ¯ 2 1 γ 1
where x i and y i correspond to the independent and dependent variables, respectively; x ¯ and y ¯ are the average of the independent and dependent variables, respectively.

2.3.6. Cumulative Thermal Stress

Heat stress accumulates in the human body when a person is exposed to a thermal condition for a long time. Considering this fact, the cumulative thermal stress (CTS) is defined to quantify the strength of heat stress. CTS represents the heat stress accumulated in a time-period calculated. As in UNE-EN ISO 7243:2017 [62], a time-weighted function is defined to calculate the cumulative thermal stress (4):
C T S = i = 1 n T S i · t i i = 1 n t i
where T S i represents the thermal stress index measured at a location and at the time t i .

2.3.7. Heat Stress Exposure

Sadeghi [50] introduced an innovative bioclimatic metric based on the Universal Temperature Climatic Index (UTCI) for the purpose of measuring the thermal stress experienced by a human being, called the Heat Stress Exposure (HSE) Metric. The HSE incorporates both the duration and intensity of heat exposure. To quantify thermal stress, Sadeghi proposed to set the threshold of thermal comfort in UTCI at 26 °C, as shown in Table 2. In this study, the HSE was applied for the rest of the bioclimatic indices studied too. First, a threshold value of 23 °C for PET and mPET, 30 °C for SET, 20 °C for PT and 18 °C WBGT was set, see comfortable category from Table 3, Table 4, Table 5 and Table 6. Therefore, for all bioclimatic indices used in this study, Equation (5) was considered:
B I a e = i = 1 h B I h
where B I a e represents the average temperature excess above the thermal comfort threshold based on the employed bioclimatic index, i = 1 h B I signifies the cumulative temperature excess beyond the thermal comfort threshold according to the utilized bioclimatic index and h denotes the total hours of temperature surpassing the threshold of the thermal comfort zone.

3. Results

3.1. Heat Island Effect in City Center of Cordoba

The ambient conditions were measured using two different weather stations, WS. Local ambient conditions in the city center of Cordoba (Spain), WS1, were measured in different locations of the route between 16:30 and 19:30 CEST (UTC+2). A comparison between the ambient conditions registered in the reference meteorological station in Cordoba, WS2, and the local ambient conditions in the city center of Cordoba (Spain), WS1, was performed in the same period. Figure 4 shows the ambient dry temperature registered at WS1 and WS2 for a normal summer day, NSD, a heat-wave day, HD, and a super-heat-wave day, SHD.
As shown in Figure 4, the temperature measured by WS1 is higher than the one measured by WS2 independently of the day on which the measurements were carried out. Average values of 40.3 °C and 36.1 °C were measured by WS1 and WS2, respectively, for the NSD. For the HD, the average values increased to 42.3 °C and 39 °C at WS1 and WS2, respectively. The average values increased even more for the SHD, to 45.6 °C and 42.4 °C for WS1 and WS2, respectively. This indicates that the temperatures registered in the center of the city of Córdoba are 3.2 to 4.3 °C higher than the temperatures registered in WS2 in the same period of time. This difference corresponds to the UHIE between WS1 and WS2. Therefore, the temperature showed by WS2 is not representative of the temperature of the city, as WS2 is 9 km from the city, and it is surrounded by green areas. According to Imhoff [73], typical temperature difference values between an urban area and the outskirts area of a city are usually in the range of between 0.8 and 8 °C. Therefore, the temperature difference between WS1 and WS2 obtained in this study fits within the range proposed by Imhoff.

3.2. Temporal and Spatial Variation of Heat Stress Indices

Figure 5 shows the temporal register of UTCI, heat budget models, SET, PT, PET and mPET, and a simple bioclimatic index, WBGT, for an NSD, HD and SHD between 16:30 and 19:30 h in different locations of the city center of Cordoba (Spain). For each day, three periods were differentiated: a first stage (16:30–17:30) CEST (UTC+2), with no shadows; a second stage (17:30–18:30) CEST (UTC+2), with shadows; and a third stage, with no shadows (18:30–19:30) CEST (UTC+2).
In the Figure 5, it is shown that the spatio-temporal register of all indices increases slightly as the ambient temperature and radiant temperature increase. Variables such as relative humidity (17%) or wind speed (0.9 m/s) have remained stable during the days of measurement, so there are no major changes in the indices.
As shown in Figure 5, it can be seen how the radiant temperature was similar on all three days (NSD, HH and SHD) in the first measurement stage, where the temperature was at its maximum due to the time zone and the fact that there was no shade on this area of the route. However, the differences are visible in the shaded area. In this zone, the radiant temperature was higher in HD and SHD, although only slightly in SHD. Then, the radiant temperature increased again in the third stage due to the absence of shade, although slightly, as the temperature was not so strong due to the time zone. These three stages together with the spatio-temporal register of the radiant temperature can help to understand the results achieved in the assessment indices.
Figure 5 shows that indices such as the mPET index are very similar to the UTCI, independently of the day of measurement. This confirms the high correlation found in Table 6. Now, indices such as PET and SET are similar to UTCI, although they are slightly above and below, respectively. The PT index is significantly further away from UTCI. This demonstrates the low correlation found in Table 6. The WBGT index is well below the UTCI index, which shows that they are not comparable.
These results suggest that indices such as UTCI, SET, PT, PET and mPET are dependent on radiant and ambient temperature. However, this is not the case for WBGT, where no relationship can be observed.

3.3. Correlation Analysis

Table 7 shows the correlation coefficient, r, between UTCI and other thermal indices (PET, SET, PT and mPET) and simple indices with hot conditions (WBGT) for an NSD, HD and SHD.
In Table 7, the correlation between UTCI and a simple index with hot conditions as the WBGT was less than 95% independently of the day on which the measurements were carried out. The r coefficients 89.3%, 92.8% and 93.4% were achieved for the NSD, HD and SHD, respectively.
As can be seen in Table 7, a higher correlation was found with indices that consider UTCI variables such as PET, mPET and SET. γ coefficients higher than 95% were found for the NSD. r coefficients increased until they reached values close to 99% for the HD and above to 99% for the SHD. However, the r coefficient of PT was less than 95% for the NSD, although it exceeded this value for an HD and SHD.
These results indicate that indices such as PET, mPET, SET and PT that consider variables similar to UTCI can be used in the same way to calculate the heat stress suffered by a person. On the other hand, indices such as WBGT that partially consider these variables are not advised to be used.

3.4. Comparison of Scale Classes between UTCI and Other Indices

The frequency distribution of the scale classes for different temperature indices are represented in a bar chart for the NSD, HD and SHD in Figure 6.
As shown in the Figure 6, which pertains to the NSD, the PET and mPET indices predominantly fall within the “very hot” category. A similar pattern emerges in the SET index, where a significant portion of the data fall under the “very hot” scale. As for the PT index, the values vary across the “very hot”, “hot”, and “sweltering” scales, with the majority leaning toward “very hot”. Likewise, the UTCI index portrays its values with different classifications, where the majority was found to be “very hot”. The WBGT index displays an almost symmetrical distribution between the “sweltering” and “very hot” scales.
For the HD, Figure 6 shows that in the SET index, nearly all values now fell within the “very hot” range. Meanwhile, both the PET and mPET indices placed all values firmly within the “very hot” category. As for the PT and UTCI indices, they distributed their values across “very hot” and “sweltering”, with the majority leaning towards “very hot”. However, the WBGT index presented a more diverse pattern, spanning “hot”, “very hot”, and “sweltering”, with the majority positioned in the “hot” category.
As can be seen in Figure 6, for one SHD, the values found in the PET and mPET indices were again classified on the “very hot” scale. In addition, the SET index values were classified on the same scale. Now, the values obtained in the PT, UTCI and WBGT indices were distributed between “very hot” and “sweltering”, where most of them were classified on the “sweltering” scale.

3.5. Comparison of Cumulative Indices for the Route

A color map of the cumulative stress in the temperature indices during the run for the NSD, HD and SHD is depicted in Figure 7. The colors represent very hot stress and a wide range of sweltering stress.
Figure 7 shows how a person classifies heat stress as very hot from the first measurement point, irrespective of the index and the day of measurement. Furthermore, it can be seen how the PET index reaches very extreme stifling stress earlier than the other indices, regardless of the day of measurement.
For the NSD, see Figure 7a, according to the PET index, a tourist achieved extreme sweltering stress at about 18:15 h. Furthermore, at 19:30, the cumulative stress achieved a very extreme sweltering value. Now, indices such as UTCI, WBGT, SET and PT follow a similar behavior and found an extreme sweltering stress between 18:25 and 18:30. On the other hand, according to the mPET index, extreme sweltering stress was reached around 19:00 h.
In Figure 7b, for the HD, extreme sweltering stress conditions were achieved earlier in all indices. Around 18:00 h, this level of stress was evident in indices such as UTCI, PET, and SET. Subsequently, very extreme sweltering stress was found between 18:50 and 19:00 in the UTCI and PET indices, and approximately at 19:15 in the SET index. Conversely, the WBGT and PT indices indicated extreme sweltering stress at around 18:15. Notably, according to the WBGT index, very extreme sweltering stress conditions were achieved toward the end of the period. In contrast, the mPET index reflects that extreme sweltering stress was not achieved until around 18:40 h.
In the SHD, as shown in Figure 7c, extreme sweltering stress was achieved before reaching the midpoint of the route in all indices. Furthermore, levels of very extreme sweltering stress were observed in all indices at the midpoint of the route, except for the mPET index, where they were found at the end of the route. In the UTCI, WBGT, PET, SET and PT indices, extreme sweltering stress was achieved between 17:30 and 17:40 h. In these indices, very extreme sweltering stress was found between 18:20 and 18:40 h.
These results suggest that the proportion of time experiencing sweltering heat increases notably as outdoor conditions move from a normal day to an extreme heat-wave day.

3.6. Heat Stress Exposure

Figure 8 shows the average excess of temperature obtained for UTCI, PET, mPET, SET, PT and WBGT for the NSD, HD and SHD.
The highest average excess of temperature was found for PET, 30 °C, in the SHD. However, the lowest value was achieved for SET and WBGT, 10 °C, for the NSD.
In Figure 8, it can be seen how for the NSD, a higher average excess temperature was achieved for PET and mPET, 25 °C and 22 °C, respectively. Slightly lower excess temperature values of 17 °C and 15 °C were obtained for UTCI and PT. The lowest values of excess temperature were found for SET and WBGT, 10 °C.
In the HD, the average excess temperature increased in all indices except in WBGT, where 10 °C was maintained, see Figure 8. In PET, the average excess temperature increased by 3 °C to 28 °C. The increase was slightly lower in UTCI and mPET, 2 °C, until it achieved 19 °C and 24 °C, respectively. Even smaller was the increase in SET and PT, 1 °C, until it found 11 °C and 16 °C, respectively.
When the heat intensity is higher, SHD, the average excess temperature increased by 3 °C in UTCI, SET, PT and WBGT until it achieved 22 °C, 14 °C, 19 °C and 13 °C, respectively. However, the increase was slightly lower, 2 °C, in PET and mPET, 30 °C and 26 °C, respectively, as can be seen in Figure 8.
These results indicate that the thermal comfort threshold was exceeded for the total duration of the experimental tests, 3 h, independently of the bioclimatic index. This implies that the average excess temperature is quite high in all experimental tests, especially on a day with the highest heat intensity, SHD.
On the route analyzed, there were shaded sections, see Figure 5, provided by nearby buildings. Even so, the thermal comfort threshold was significantly exceeded because these buildings emitted the heat previously absorbed at times when they received direct solar radiation. Therefore, the shading provided by these buildings did not sufficiently reduce the thermal stress.

4. Conclusions

A comprehensive assessment of human heat stress was carried out in Cordoba (Spain) as a representative of other Mediterranean climatic zones in Southern Europe. A mobile measurement pole was used to register a complete set of climatic variables in situ along a three-hour typical walkable touristic path in the city center of Cordoba during the three-hour period of higher temperatures from 16:30 to 19:30 CEST (UTC+2). Temporal and cumulative bioclimatic indices, UTCI, WBGT, SET, PT, PET and mPET, were obtained under both normal summer days and heat wave condition days.
Furthermore, a heat stress metric that considers both the duration and intensity of urban heat exposure was used to predict the duration and intensity of Heat Stress Exposure (HSE) across a typical touristic route in the city center of Cordoba.
The main findings of this study are:
  • The thermal stress suffered by a tourist was very severe on a normal summer day. However, this thermal stress became very extreme on a heat-wave day and super-heat-wave day. In shaded areas, the thermal stress was significant reduced.
  • The indices derived from heat budget models, such as SET, PT, PET and mPET, show a high correlation with UTCI, independently of the day of measurement. However, a simple index such as WBGT has a low correlation with UTCI. Pearson correlation coefficient values increased for all indices as the outdoor conditions were more severe, from a normal summer day to a summer super-wave day.
  • The cumulative thermal stress obtained for each index was classified as “very hot” and mostly “sweltering”. The percentage of time under these conditions increased significantly as the outdoor conditions changed from a normal day to a super-heat-wave day.
  • The HSE reported that the average excess temperature was significantly high for all bioclimatic indices studied, especially on a day of maximum heat intensity, SHD.
Temporal, cumulative thermal stress and HSE analysis emphasize the need for interventions to improve the urban environment and promote better outdoor thermal comfort for city dwellers and tourists through measures such as green infrastructure, UHI mitigation and increasing public awareness.

Author Contributions

Conceptualization, M.R.d.A.; methodology, J.L.S.J. and M.R.d.A.; investigation, J.L.S.J.; resources, M.R.d.A.; writing—original draft, J.L.S.J. and M.R.d.A.; writing—review and editing, J.L.S.J. and M.R.d.A.; supervision, M.R.d.A.; funding acquisition, M.R.d.A. All authors have read and agreed to the published version of the manuscript.

Funding

The authors acknowledge the financial support of the Spanish Ministry of Science, Innovation and Universities to the National R&D project BIORISK with reference to RTI2018-094703-B-I00, entitled “Bioaerosols in hospital environments. Control and evaluation of the infection risk”. This project was co-financed by the European Regional Development Fund (ERDF).

Institutional Review Board Statement

Not applicable.

Informed Consent Statement

Not applicable.

Data Availability Statement

Data available in a publicly accessible repository. The data presented in this study are openly available in ZENODO at https://doi.org/10.5281/zenodo.10634192.

Conflicts of Interest

The authors declare no conflicts of interest.

References

  1. Hua, L.J.; Ma, Z.G.; Guo, W.D. The impact of urbanization on air temperature across China. Theor. Appl. Climatol. 2008, 93, 179–194. [Google Scholar] [CrossRef]
  2. Renc, A.; Łupikasza, E. Changes in the surface urban heat island between 1986 and 2021 in the polycentric Górnośląsko-Zagłębiowska Metropolis. southern Poland. Build. Environ. 2023, 247, 110997. [Google Scholar] [CrossRef]
  3. Bonafoni, S.; Baldinelli, G.; Verducci, P. Sustainable strategies for smart cities: Analysis of the town development effect on surface urban heat island through remote sensing methodologies. Sustain. Cities Soc. 2017, 29, 211–218. [Google Scholar] [CrossRef]
  4. Ren, J.; Shi, K.; Li, Z.; Kong, X.; Zhou, H. A Review on the Impacts of Urban Heat Islands on Outdoor Thermal Comfort. Buildings 2023, 13, 1368. [Google Scholar] [CrossRef]
  5. Ohashi, Y.; Genchi, Y.; Kondo, H.; Kikegawa, Y.; Yoshikado, H.; Hirano, Y. Influence of air-conditioning waste heat on air temperature in Tokyo during summer: Numerical experiments using an urban canopy model coupled with a building energy model. J. Appl. Meteorol. Climatol. 2007, 46, 66–81. [Google Scholar] [CrossRef]
  6. Salamanca, F.; Georgescu, M.; Mahalov, A.; Moustaoui, M.; Wang, M. Anthropogenic heating of the urban environment due to air conditioning. Nature 1955, 175, 238. [Google Scholar] [CrossRef]
  7. Salamanca, F.; Georgescu, M.; Mahalov, A.; Moustaoui, M.; Wang, M.; Svoma, B.M. Assessing summertime urban air conditioning consumption in a semiarid environment. Environ. Res. Lett. 2013, 8, 034022. [Google Scholar] [CrossRef]
  8. Wang, Y.; Berardi, U.; Akbari, H. Comparing the effects of urban heat island mitigation strategies for Toronto, Canada. Energy Build. 2016, 114, 2–19. [Google Scholar] [CrossRef]
  9. Bouchama, A.; Knochel, J.P. Heat Stroke. N. Engl. J. Med. 2002, 346, 1978–1988. [Google Scholar] [CrossRef]
  10. McGregor, G.R. Heatwaves and Health: Guidance on Warning-System Development; World Meteorological Organization: Geneva, Switzerland, 2015. [Google Scholar]
  11. Murphy, R.J. Heat illness. Am. J. Sports Med. 1973, 1, 26–29. [Google Scholar] [CrossRef]
  12. Guo, Y.; Gasparrini, A.; Armstrong, B.G.; Tawatsupa, B.; Tobias, A.; Lavigne, E.; De Sousa Zanotti Stagliorio Coelho, M.; Pan, X.; Kim, H.; Hashizume, M.; et al. Heat wave and mortality: A multicountry, multicommunity study. Environ. Health Perspect. 2017, 125, 087006. [Google Scholar] [CrossRef] [PubMed]
  13. Guo, Y.; Gasparrini, A.; Li, S.; Sera, F.; Vicedo-Cabrera, A.M.; de Sousa Zanotti Stagliorio Coelho, M.; Saldiva, P.H.N.; Lavigne, E.; Tawatsupa, B.; Punnasiri, K.; et al. Quantifying excess deaths related to heatwaves under climate change scenarios: A multicountry time series modelling study. PLoS Med. 2018, 15, e1002629. [Google Scholar] [CrossRef] [PubMed]
  14. WHO. Heat-waves: Risks and responses. Health Glob. Environ. Health Ser. 2004, 2, 124. [Google Scholar] [CrossRef]
  15. Kephart, J.L.; Sánchez, B.N.; Moore, J.; Schinasi, L.H.; Bakhtsiyarava, M.; Ju, Y.; Gouveia, N.; Caiaffa, W.T.; Dronova, I.; Arunachalam, S.; et al. City-level impact of extreme temperatures and mortality in Latin America. Nat. Med. 2022, 28, 1700–1705. [Google Scholar] [CrossRef] [PubMed]
  16. Mortalidad Atribuible por Calor en España (MACE). 2023. Available online: https://ficlima.shinyapps.io/mace/ (accessed on 25 January 2024).
  17. Lai, D.; Lian, Z.; Liu, W.; Guo, C.; Liu, W.; Liu, K.; Chen, Q. A comprehensive review of thermal comfort studies in urban open spaces. Sci. Total Environ. 2020, 742, 140092. [Google Scholar] [CrossRef] [PubMed]
  18. Abaas, Z.R. Impact of development on Baghdad’s urban microclimate and human thermal comfort. Alex. Eng. J. 2020, 59, 275–290. [Google Scholar] [CrossRef]
  19. Abaas, Z.R.; Khalid, Z. Towards local sustainability: A case study to evaluate outdoor urban spaces in Baghdad using physiological equivalent temperature index. City Environ. Interact. 2023, 20, 100115. [Google Scholar] [CrossRef]
  20. Lopez-Cabeza, V.P.; Alzate-Gaviria, S.; Diz-Mellado, E.; Rivera-Gomez, C.; Galan-Marin, C. Albedo influence on the microclimate and thermal comfort of courtyards under Mediterranean hot summer climate conditions. Sustain. Cities Soc. 2022, 81, 103872. [Google Scholar] [CrossRef]
  21. Zhang, S.; Li, S.; Shu, L.; Xiao, T.; Shui, T. Landscape Configuration Effects on Outdoor Thermal Comfort across Campus—A Case Study. Atmosphere 2023, 14, 270. [Google Scholar] [CrossRef]
  22. Wallenberg, N.; Lindberg, F.; Thorsson, S.; Jungmalm, J.; Fröberg, A.; Raustorp, A.; Rayner, D. The effects of warm weather on children’s outdoor heat stress and physical activity in a preschool yard in Gothenburg, Sweden. Int. J. Biometeorol. 2023, 67, 1927–1940. [Google Scholar] [CrossRef]
  23. Cheng, V.; Ng, E.; Chan, C.; Givoni, B. Outdoor thermal comfort study in a sub-tropical climate: A longitudinal study based in Hong Kong. Int. J. Biometeorol. 2012, 56, 43–56. [Google Scholar] [CrossRef] [PubMed]
  24. Lin, C.H.; Lin, T.P.; Hwang, R.L. Thermal comfort for urban parks in subtropics: Understanding visitor’s perceptions. behavior and attendance. Adv. Meteorol. 2013, 2013, 640473. [Google Scholar] [CrossRef]
  25. Lai, D.; Zhou, X.; Chen, Q. Measurements and predictions of the skin temperature of human subjects on outdoor environment. Energy Build. 2017, 151, 476–486. [Google Scholar] [CrossRef]
  26. Galindo, T.; Hermida, M.A. Effects of thermophysiological and non-thermal factors on outdoor thermal perceptions: The Tomebamba Riverbanks case. Build. Environ. 2018, 138, 235–249. [Google Scholar] [CrossRef]
  27. Chen, X.; Xue, P.; Liu, L.; Gao, L.; Liu, J. Outdoor thermal comfort and adaptation in severe cold area: A longitudinal survey in Harbin, China. Build. Environ. 2018, 143, 548–560. [Google Scholar] [CrossRef]
  28. Johansson, E.; Yahia, M.W.; Arroyo, I.; Bengs, C. Outdoor thermal comfort in public space in warm-humid Guayaquil, Ecuador. Int. J. Biometeorol. 2018, 62, 387–399. [Google Scholar] [CrossRef] [PubMed]
  29. Aljawabra, F.; Nikolopoulou, M. Thermal comfort in urban spaces: A cross-cultural study in the hot arid climate. Int. J. Biometeorol. 2018, 62, 1901–1909. [Google Scholar] [CrossRef] [PubMed]
  30. Tang, T.; Zhou, X.; Zhang, Y.; Feng, X.; Liu, W.; Fang, Z.; Zheng, Z. Investigation into the thermal comfort and physiological adaptability of outdoor physical training in college students. Sci. Total Environ. 2022, 839, 155979. [Google Scholar] [CrossRef]
  31. Niu, J.; Hong, B.; Geng, Y.; Mi, J.; He, J. Summertime physiological and thermal responses among activity levels in campus outdoor spaces in a humid subtropical city. Sci. Total Environ. 2020, 728, 138757. [Google Scholar] [CrossRef]
  32. Mayer, H.; Höppe, P. Thermal comfort of man in different urban environments. Theor. Appl. Climatol. 1987, 38, 43–49. [Google Scholar] [CrossRef]
  33. Narimani, N.; Karimi, A.; Brown, R.D. Effects of street orientation and tree species thermal comfort within urban canyons in a hot, dry climate. Ecol. Inform. 2022, 69, 101671. [Google Scholar] [CrossRef]
  34. Blazejczyk, K.; Baranowski, J.; Blazejczyk, A. Heat stress and occupational health and safety—Spatial and temporal differentiation. Misc. Geogr. 2014, 18, 61–67. [Google Scholar] [CrossRef]
  35. Cheuvront, S.N.; Kenefick, R.W.; Blazy, P.T.; Troyanos, C. Change of Seasons: Boston Marathon Wet Bulb Globe Temperature Index in October. Wilderness Environ. Med. 2023, 34, 509–512. [Google Scholar] [CrossRef] [PubMed]
  36. Inoue, H.; Tanaka, H.; Sakanashi, S.; Kinoshi, T.; Numata, H.; Yokota, H.; Otomo, Y.; Masuno, T.; Nakano, K.; Sugita, M.; et al. Incidence and factor analysis for the heat-related illness on the Tokyo 2020 Olympic and Paralympic Games. BMJ Open Sport Exerc. Med. 2023, 9, e001467. [Google Scholar] [CrossRef] [PubMed]
  37. Gao, Y.; Meng, L.; Li, C.; Ge, L.; Meng, X. An experimental study of thermal comfort zone extension in the semi-open spray space. Dev. Built Environ. 2023, 15, 100217. [Google Scholar] [CrossRef]
  38. Yuan, J.; Shimazaki, Y.; Zhang, R.; Masuko, S.; Cao, S.J. Can retro-reflective materials replace diffuse highly reflective materials for urban buildings’ wall to improve outdoor thermal comfort? Heliyon 2023, 9, e14872. [Google Scholar] [CrossRef] [PubMed]
  39. Błazejczyk, K.; Broede, P.; Fiala, D.; Havenith, G.; Holmér, I.; Jendritzky, G.; Kampmann, B.; Kunert, A. Principles of the new universal thermal climate index (UTCI) and its application to bioclimatic research in European scale. Misc. Geogr. 2010, 14, 91–102. [Google Scholar] [CrossRef]
  40. Blazejczyk, K.; Epstein, Y.; Jendritzky, G.; Staiger, H.; Tinz, B. Comparison of UTCI to selected thermal indices. Int. J. Biometeorol. 2012, 56, 515–535. [Google Scholar] [CrossRef]
  41. Zare, S.; Hasheminejad, N.; Shirvan, H.E.; Hemmatjo, R.; Sarebanzadeh, K.; Ahmadi, S. Comparing Universal Thermal Climate Index (UTCI) with selected thermal indices/environmental parameters during 12 months of the year. Weather Clim. Extrem. 2018, 19, 49–57. [Google Scholar] [CrossRef]
  42. Asghari, M.; Teimori, G.; Abbasinia, M.; Shakeri, F.; Tajik, R.; Ghannadzadeh, M.J.; Ghalhari, G.F. Thermal discomfort analysis using UTCI and MEMI (PET and PMV) in outdoor environments: Case study of two climates in Iran (Arak & Bandar Abbas). Weather 2019, 74, S57–S64. [Google Scholar] [CrossRef]
  43. Li, K.; Liu, X.; Bao, Y. Evaluating the performance of different thermal indices on quantifying outdoor thermal sensation in humid subtropical residential areas of China. Front. Environ. Sci. 2022, 10, 1071668. [Google Scholar] [CrossRef]
  44. Peel, M.C.; Finlayson, B.L.; McMahon, T.A. Updated world map of the Köppen-Geiger climate classification. Hydrol. Earth Syst. Sci. 2007, 11, 1633–1644. [Google Scholar] [CrossRef]
  45. Heating and Cooling Degree Days—Statistics, Explain. Eurostat Stat. 2023. Available online: https://ec.europa.eu/eurostat/statistics-explained/index.php?title=Heating_and_cooling_degree_days_-_statistics#Heating_and_cooling_degree_days_by_EU_Member_State (accessed on 8 January 2024).
  46. Junta de Andalucía, Informe anual Medio Ambiente en Andalucía. 2024. Available online: https://www.juntadeandalucia.es/medioambiente/portal/acceso-rediam/informe-medio-ambiente/informe-medio-ambiente-andalucia-edicion-2023 (accessed on 10 January 2024).
  47. Qué es el Estrés Térmico y Cómo va a Afectar a Las 30 Ciudades Españolas Más Pobladas en Los Próximos Años. 2023. Available online: https://elpais.com/clima-y-medio-ambiente/2023-08-11/que-es-el-estres-termico-y-como-va-a-afectar-a-las-30-ciudades-espanolas-mas-pobladas-en-los-proximos-anos.html (accessed on 15 August 2023).
  48. Córdoba, Patrimonio de la Humanidad, (n.d.). Available online: https://www.turismodecordoba.org/cordoba-patrimonio-de-la-humanidad (accessed on 8 January 2024).
  49. Cordopolis, Córdoba y Provincia Superaron Por Primera Vez Los Dos Millones de Turistas en 2023. 2024. Available online: https://cordopolis.eldiario.es/cordoba-hoy/sociedad/cordoba-provincia-superaron-primera-vez-millones-turistas-2023_1_10818806.html (accessed on 8 January 2024).
  50. Sadeghi, M.; de Dear, R.; Morgan, G.; Santamouris, M.; Jalaludin, B. Development of a heat stress exposure metric—Impact of intensity and duration of exposure to heat on physiological thermal regulation. Build. Environ. 2021, 200, 107947. [Google Scholar] [CrossRef]
  51. AEMET. Opendata AEMET, (n.d.). Available online: https://opendata.aemet.es/centrodedescargas/productosAEMET? (accessed on 10 January 2024).
  52. Código Técnico de la Edificación (CTE) Documento Básico de Ahorro de Energía (DB-HE) 2006. 2022. Available online: https://www.codigotecnico.org/pdf/Documentos/HE/DcmHE.pdf (accessed on 30 November 2023).
  53. AEMET. Olas de Calor en España Desde 1975; AEMET: Madrid, Spain, 2019. [Google Scholar]
  54. Silvia, N. NTP 323: Determinación del Metabolismo Energético; Instituto Nacional de Seguridad y Salud en el Trabajo: Madrid, Spain, 1991; pp. 1–11.
  55. Fiala, D.; Lomas, K.J.; Stohrer, M. A computer model of human thermoregulation for a wide range of environmental conditions: The passive system. J. Appl. Physiol. 1999, 87, 1957–1972. [Google Scholar] [CrossRef] [PubMed]
  56. Jendritzky, G.; de Dear, R.; Havenith, G. UTCI-Why another thermal index? Int. J. Biometeorol. 2012, 56, 421–428. [Google Scholar] [CrossRef] [PubMed]
  57. Błazejczyk, K.; Broede, P.; Fiala, D.; Havenith, G.; Holmér, I.; Jendritzky, G.; Kampmann, B. UTCI—New index for assessment of heat stress in man; [UTCI—Nowy wskaźnik oceny obciáżeń cieplnych człowieka]. Prz. Geogr. 2010, 82, 49–71. Available online: https://www.scopus.com/inward/record.uri?eid=2-s2.0-77952367101&partnerID=40&md5=042b7720990f7b0618c07ff9761af332 (accessed on 10 January 2024).
  58. Froehlich, D.; Matzarakis, A. Estimation of human-biometeorological conditions in south west Germany for the assessment of mitigation and adaptation potential. In Proceedings of the 9th International Conference on Urban Climate Jointly with 12th Symposium on the Urban Environment, Toulouse, France, 20–24 July 2015; Volume 2000, pp. 1–6. [Google Scholar]
  59. Farajzadeh, H.; Saligheh, M.; Alijani, B. Application of Universal Thermal Climate Index in Iran from tourism perspective. J. Nat. Environ. Hazards 2016, 5, 117–138. [Google Scholar] [CrossRef]
  60. Park, S.; Tuller, S.E.; Jo, M. Application of Universal Thermal Climate Index (UTCI) for microclimatic analysis in urban thermal environments. Landsc. Urban Plan. 2014, 125, 146–155. [Google Scholar] [CrossRef]
  61. Błażejczyk, K. BioKlima—Universal Tool for Bioclimatic and Thermophysiological Studies. 2011. Available online: https://www.igipz.pan.pl/bioklima-crd.html (accessed on 12 October 2023).
  62. UNE-EN ISO 7243:2017; Ergonomía del Ambiente térmico. Evaluación del Estrés al Calor Utilizando el Índice WBGT (Temperatura de Bulbo Húmedo y de Globo) (ISO 7243:2017) (Ratificada por la Asociación Española de Normalización en noviembre de 2017). ISO: Geneva, Switzerland, 2017.
  63. Wu, Y.; Jiang, A.; Liu, H.; Li, B.; Kosonen, R. Climate chamber investigation of the effect of indoor thermal histories on thermal adaptation in different seasons. Energy Built Environ. 2024, 5, 455–463. [Google Scholar] [CrossRef]
  64. Gagge, L.G.; Fobelets, A.P.; Berglund, L. A standard predictive Index of human reponse to thermal enviroment. Am. Soc. Heat. Refrig. Air-Cond. Eng. 1986, 92, 709–731. Available online: https://www.aivc.org/sites/default/files/airbase_2522.pdf%0Ahttp://oceanrep.geomar.de/42985/ (accessed on 21 November 2023).
  65. Staiger, H.; Laschewski, G.; Grätz, A. The perceived temperature—A versatile index for the assessment of the human thermal environment, Part A: Scientific basics. Int. J. Biometeorol. 2012, 56, 165–176. [Google Scholar] [CrossRef] [PubMed]
  66. Höppe, P. The physiological equivalent temperature—A universal index for the biometeorological assessment of the thermal environment. Int. J. Biometeorol. 1999, 43, 71–75. [Google Scholar] [CrossRef] [PubMed]
  67. Lin, T.P.; Yang, S.R.; Chen, Y.C.; Matzarakis, A. The potential of a modified physiologically equivalent temperature (mPET) based on local thermal comfort perception in hot and humid regions. Theor. Appl. Climatol. 2019, 135, 873–876. [Google Scholar] [CrossRef]
  68. Zezzo, L.V.; Coltri, P.P.; Dubreuil, V. Microscale models and urban heat island studies: A systematic review. Environ. Monit. Assess. 2023, 195, 1284. [Google Scholar] [CrossRef] [PubMed]
  69. Zhang, H.; Yao, R.; Deng, J.; Wang, W. A mathematical model for rapid estimation of solar radiation in urban canyons with trees and its applications. Sol. Energy 2024, 267, 112219. [Google Scholar] [CrossRef]
  70. Çağlak, S. Evaluation of the Effects of Thermal Comfort Conditions on Cardiovascular Diseases in Amasya City. Turkey. J. Public Health 2022, 31, 2011–2020. [Google Scholar] [CrossRef] [PubMed]
  71. Wu, R.; Fang, X.; Brown, R.; Liu, S.; Zhao, H. Establishing a link between complex courtyard spaces and thermal comfort: A major advancement in evidence-based design. Build. Environ. 2023, 245, 110852. [Google Scholar] [CrossRef]
  72. Patle, S.; Ghuge, V.V. Urban fragmentation approach for assessing thermal environment dynamics: A case study of semi-arid city from a comfort perspective. Urban Clim. 2024, 53, 101784. [Google Scholar] [CrossRef]
  73. Imhoff, M.L.; Zhang, P.; Wolfe, R.E.; Bounoua, L. Remote sensing of the urban heat island effect across biomes in the continental USA. Remote Sens. Environ. 2010, 114, 504–513. [Google Scholar] [CrossRef]
Figure 1. Touristic route conducted in the experimental study with a total length of 1850 m.
Atmosphere 15 00214 g001
Figure 2. Days and time-period selected according to ambient temperature measured by WS2.
Atmosphere 15 00214 g002
Figure 3. Tourist simulated by a measurement pole.
Atmosphere 15 00214 g003
Figure 4. Ambient dry temperature at WS1 and WS2.
Atmosphere 15 00214 g004
Figure 5. Temporal register of temperature indices for NSD, HD and SHD.
Atmosphere 15 00214 g005
Figure 6. Frequency of assessment classes of temperature indices.
Atmosphere 15 00214 g006
Figure 7. Color map of cumulative stress for: (a) NSD; (b) HD; (c) SHD.
Atmosphere 15 00214 g007
Figure 8. Heat stress exposure indices for different days.
Atmosphere 15 00214 g008
Table 1. Temperature, air velocity and relative humidity obtained from the Córdoba-Airport weather station, WS2.
YearTemperature (°C)Air Velocity (m/s)Relative Humidity
JuneJulyAugustJuneJulyAugustJuneJulyAugust
200025.627.627.92.82.82.843%41%39%
200125.626.228.02.53.12.543%45%47%
200224.727.326.53.12.83.150%46%48%
200326.927.929.63.12.52.548%41%41%
200426.728.328.02.22.52.847%43%45%
200527.028.428.52.83.12.545%45%39%
200625.829.528.72.82.82.549%39%47%
200723.828.427.53.12.82.844%29%35%
200825.227.628.12.52.82.835%30%30%
200926.128.429.23.33.12.239%27%29%
201023.929.329.43.32.52.246%31%35%
201125.427.528.22.23.33.136%34%37%
201226.928.229.53.13.32.831%28%28%
201324.028.028.52.52.82.237%35%34%
201424.527.027.53.13.32.541%37%33%
201526.130.528.43.13.12.835%28%40%
201728.428.929.42.82.81.932%32%32%
201824.626.630.03.13.12.544%37%33%
201924.428.128.83.63.62.535%39%33%
202024.730.828.43.92.82.839%31%36%
202124.928.728.93.33.33.140%30%34%
202225.930.429.03.32.83.135%27%37%
2000–202225.528.328.53.02.92.641%35%37%
Average27.52.838%
202326.429.729.92.83.32.843%28%25%
Average28.73.032%
Table 2. Thermal sensation and different groups of UTCI.
Range UTCI (°C)Stress Category
>46Very hot (Extreme heat stress/Danger)
38–46(Very strong heat stress)
32–38Hot (Strong heat stress/Extreme caution)
26–32Warm (Moderate heat stress/No danger)
9–26Comfortable (No thermal stress/No danger)
0–9Slightly cool (Slight cold stress)
Table 3. Temperature thresholds (°C) of particular thermal sensations used in WBGT.
Range WBGT (°C)Stress Category
>30Sweltering (Extreme danger)
28–30Very hot (Danger)
24–28Hot (Extreme caution)
18–24Warm (Caution)
<18Comfortable (No danger)
Table 4. Temperature thresholds (°C) of particular thermal sensations used in SET.
Range SET (°C)Stress Category
>37Very hot (Danger)
34–37Hot (Extreme caution)
30–34Warm (Caution)
17–30Comfortable (No danger)
<17Cool (Moderate hazard)
Table 5. Temperature thresholds (°C) of particular thermal sensations used in PT.
Range PT (°C)Stress Category
>38Very hot (Extreme heat stress)
32–38Hot (Strong heat stress)
26–32Warm (Moderate heat stress)
20–26Slightly warm (Slight heat stress)
0–20Comfortable (No thermal stress)
−13–0Slightly cool (Slight cold stress)
−26–−13Cool (Moderate cold stress)
−39–−26Cold (Great cold stress)
<−39Very cold (Extreme cold stress)
Table 6. Temperature thresholds (°C) of particular thermal sensations used in PET.
Range PET (°C)Stress Category
>41Very hot (Extreme heat stress)
35–41Hot (Strong heat stress)
29–35Warm (Moderate heat stress)
23–29Slightly warm (Slight heat stress)
18–23Comfortable (No thermal stress)
13–18Slightly cool (Slight cold stress)
8–13Cool (Moderate cold stress)
4–8Cold (Strong cold stress)
<4Very cold (Extreme cold stress)
Table 7. Correlation between UTCI and other heat stress indices.
Heat Stress IndexNSDHDSHD
PET95.9%98.9%99.4%
SET97.0%98.4%99.0%
PT93.1%96.8%95.8%
mPET96.5%99.2%99.7%
WBGT89.3%92.8%93.4%
Disclaimer/Publisher’s Note: The statements, opinions and data contained in all publications are solely those of the individual author(s) and contributor(s) and not of MDPI and/or the editor(s). MDPI and/or the editor(s) disclaim responsibility for any injury to people or property resulting from any ideas, methods, instructions or products referred to in the content.

