Article

Effects of Diesel Emissions on Black Carbon and Particle Number Concentrations in the Eastern U.S.

by
Laura N. Posner
1 and
Spyros N. Pandis
2,3,*
1
Department of Chemical Engineering, Carnegie Mellon University, Pittsburgh, PA 15213, USA
2
Department of Chemical Engineering, University of Patras, 26504 Patras, Greece
3
Institute of Chemical Engineering Sciences (ICE-HT), Foundation for Research and Technology Hellas (FORTH), 26504 Patras, Greece
*
Author to whom correspondence should be addressed.
Atmosphere 2024, 15(2), 199; https://doi.org/10.3390/atmos15020199
Submission received: 30 December 2023 / Revised: 27 January 2024 / Accepted: 3 February 2024 / Published: 5 February 2024
(This article belongs to the Special Issue Urban Air Quality Modelling)

Abstract

:
The effects of emissions of diesel engines on black carbon and particle number concentrations, as well as climate-relevant aerosol properties, are explored for a summertime period in the Eastern U.S. using the chemical transport model PMCAMx-UF. A 50% reduction in diesel particulate emissions results in lower (23%) black carbon mass concentrations, as expected, and similar changes both in magnitude (27–30%) and spatial pattern for the absorption coefficient. However, an average 2% increase in the total particle number concentrations is predicted due to a decrease in the coagulation and condensation sinks and, at the same time, a 2% decrease in N100 (particles larger than 100 nm) concentrations. The diesel reduction results suggest that mitigation of large diesel particles and/or particle mass emissions can reduce climate-relevant properties related to the absorption of black carbon and provide health benefits; however, the changes could also have the unintended effect of increased ultrafine particle number concentrations. Changes in cloud condensation nuclei are predicted to be significantly less than expected, assuming a proportional reduction during this photochemically active period. Doubling the diesel emissions results in a domain-averaged 3% decrease in total particle number concentrations and a 3% increase in N100 concentrations. PM2.5 BC concentrations increase on average by 46%, and similar changes (52–60%) are predicted for the absorption coefficient. Extinction coefficients for both perturbation simulations changed by only a few percent due to the dominance of scattering aerosols in the Eastern U.S. during this period characterized by high photochemical activity.

1. Introduction

PM2.5 (particulate matter less than 2.5 μm in diameter) has been linked to both negative health effects [1] and climate change [2]. Though black carbon (BC) represents only 5–10% of the PM2.5 mass on average in urban areas [3], its potential effects on climate and health are considerable. The direct absorption of sunlight by BC has a positive (warming) effect [4]. Black carbon’s short atmospheric lifetime (days), as compared to greenhouse gases such as CO2 (years), can make BC mitigation efforts more immediately beneficial to the climate. In addition, exposure to BC in the short and long term is associated with an increased risk of cardiopulmonary disease [5]. BC may even have a stronger correlation to increased blood pressure than exposure to total PM2.5 mass, most likely due to the toxicity of the combustion chemicals coating its surface [5].
The overall absorption or reflectance of sunlight off aerosols and the secondary effects of aerosol size and composition changes on clouds are significant factors in the global radiative balance [2]. Mitigation efforts must take into account that BC sources also co-emit considerable amounts of organic PM and other species, as well as aerosol precursors (e.g., sulfur dioxide) that have a cooling effect. This competition between the heating and the cooling components of BC source emissions determines the magnitude and sign of their effects on the overall radiative balance of the earth. Mitigation of major BC sources that have low emission rates of co-emitted species has the most potential for both health benefits as well as significant cooling effects on climate forcing [4].
In North America, on-road and non-road diesel engines contribute about 70% of BC emissions [4]. The use of low-sulfur diesel fuels and catalyzed diesel particulate filters (DPFs) in the U.S. has reduced the emissions of sulfur-containing compounds and NOx from diesel vehicles [6]. The ratio of (cooling) organic PM to (warming) BC emissions from diesel sources is about 0.5 [7], which is smaller than the 4:1 ratio of biomass-burning sources [8]. Since diesel sources have the smallest ratio of co-emitted aerosols and aerosol precursors to black carbon, they are promising candidates for mitigation efforts [4].
Previous studies in the laboratory [6] and near-road [9,10] have investigated the effects of stringent regulation of heavy-duty diesel (HDD) vehicle emissions. California’s 2010 HDD regulations require the oldest diesel vehicles to be replaced or to be retrofitted with DPFs and provide incentives for HDD vehicles to be replaced by new, cleaner vehicles [11]. DPFs are designed to reduce nitrogen oxides (NOx) and PM emissions, including BC. Dallmann et al. [9] measured the concentrations of BC and NOx in the diesel-dominated Port of Oakland before and after the 2010 regulation of HDD vehicles in California. The authors found that the fleet-averaged diesel BC emissions per mass of fuel burned decreased by about 50% after regulation. Kozawa et al. [10] measured the concentrations of NOx, BC, and ultrafine particles (less than 100 nm in diameter) number concentrations on a diesel-dominated highway in California from 2009 to 2011. They reported that the fleet-averaged BC emissions from diesel vehicles decreased by about 70% between 2009 and 2011.
The climate effects of BC source mitigation strategies on a global scale have been the topic of several studies. Bauer et al. [12] reported that reducing diesel emissions generally resulted in a decrease in the radiative fluxes, whereas reducing BC sources with a larger percentage of organic matter (OM) did not always lead to a reduction in radiative flux. Chen et al. [13] concluded that reducing fossil fuel BC, OM, and particle number emissions generally decreased global cloud radiative forcing and the number of cloud condensation nuclei (CCNs). The authors noted, however, that a reduction in particle mass emissions could result in an increase in particle number emissions, which in turn could increase the concentration of particles that grow to become CCNs. CCNs can grow further to become cloud droplets, changing the reflectance of sunlight off clouds and therefore affecting the global radiative balance [2]. Shindell et al. [14] investigated the radiative forcing, health, and crop yield effects of reducing all BC source emissions through technical measures. The authors found that the climate effects of BC mitigation were largely uncertain but that the health and crop yield effects were beneficial. Unlike most greenhouse gases, black carbon is not well-mixed in the atmosphere due to its short lifetime, so its effects vary regionally based on factors such as the locations of BC emission sources [4]. Our work focuses on regional-level effects due to changes in diesel source emissions.
A review of nanoparticle growth has been recently presented by Stolzenburg et al. [15]. Harrison [16] has synthesized information about the contributions of traffic to fine particle mass and number, and Rivas et al. [17] have quantified the source contributions to particle number in various European sites.
In this study, we use the regional chemical transport model (CTM) PMCAMx-UF [18] to simulate the atmosphere over the Eastern U.S. during the summer for two simple diesel perturbation scenarios: (a) a simplified mitigation effort that reduces diesel particulate emissions by one half and (b) a diesel particulate emissions increase to double the base values. We then quantify the effects of these two scenarios on BC concentrations, particle number concentrations, and climate-relevant aerosol properties: absorption, extinction, and aerosol optical depth (AOD). These are, by necessity, oversimplified in an effort to quantify the role of the various atmospheric processes in determining the final changes in concentrations and properties.

2. PMCAMx-UF Description

PMCAMx-UF simulates the aerosol size distribution using a 41-size bin sectional approach to track particles with diameters ranging from 0.0008 to 10 μm [18]. There are two additional size bins with diameters of 20 μm and 40 μm to represent small and large cloud droplets. A chemical transport model (CTM) is needed to simulate the aerosol dynamics (nucleation, coagulation, condensation/evaporation, and removal) as well as the gas-, aqueous-, and aerosol-phase chemistry that are all central in the simulation of the aerosol number distribution. The model in this application calculates nucleation rates based on the scaled (nucleation tuner 10−5) sulfuric acid–ammonia–water nucleation rate parameterization of Napari et al. [19], and for small ammonia concentrations (below 0.01 ppt), the binary nucleation parameterization of Vehkamäki et al. [20].
In this study, we use the same inputs as in Posner and Pandis [21]. PMCAMx-UF is used to simulate a 3492 × 3240 km area over the Eastern U.S. for 12–28 July 2001. The domain is gridded into 97 (east–west) by 90 (north–south) cells that are 36 × 36 km each. A total of 14 vertical layers above the surface up to 6 km are also simulated. BC and number concentrations reported in this study are the average output for the ground layer only; however, reported climate-relevant effects are calculated and reported based on all simulated layers. The major reasons for the choice of the simulation period are the availability of a source-resolved number emissions inventory and a model that has been evaluated and performed well for this period. The grid resolution used is sufficient to capture the various changes at the regional level, and this is sufficient for the purposes of the paper. If one is interested in the changes in specific city neighborhoods, a higher resolution is obviously needed.

3. Emission Scenarios

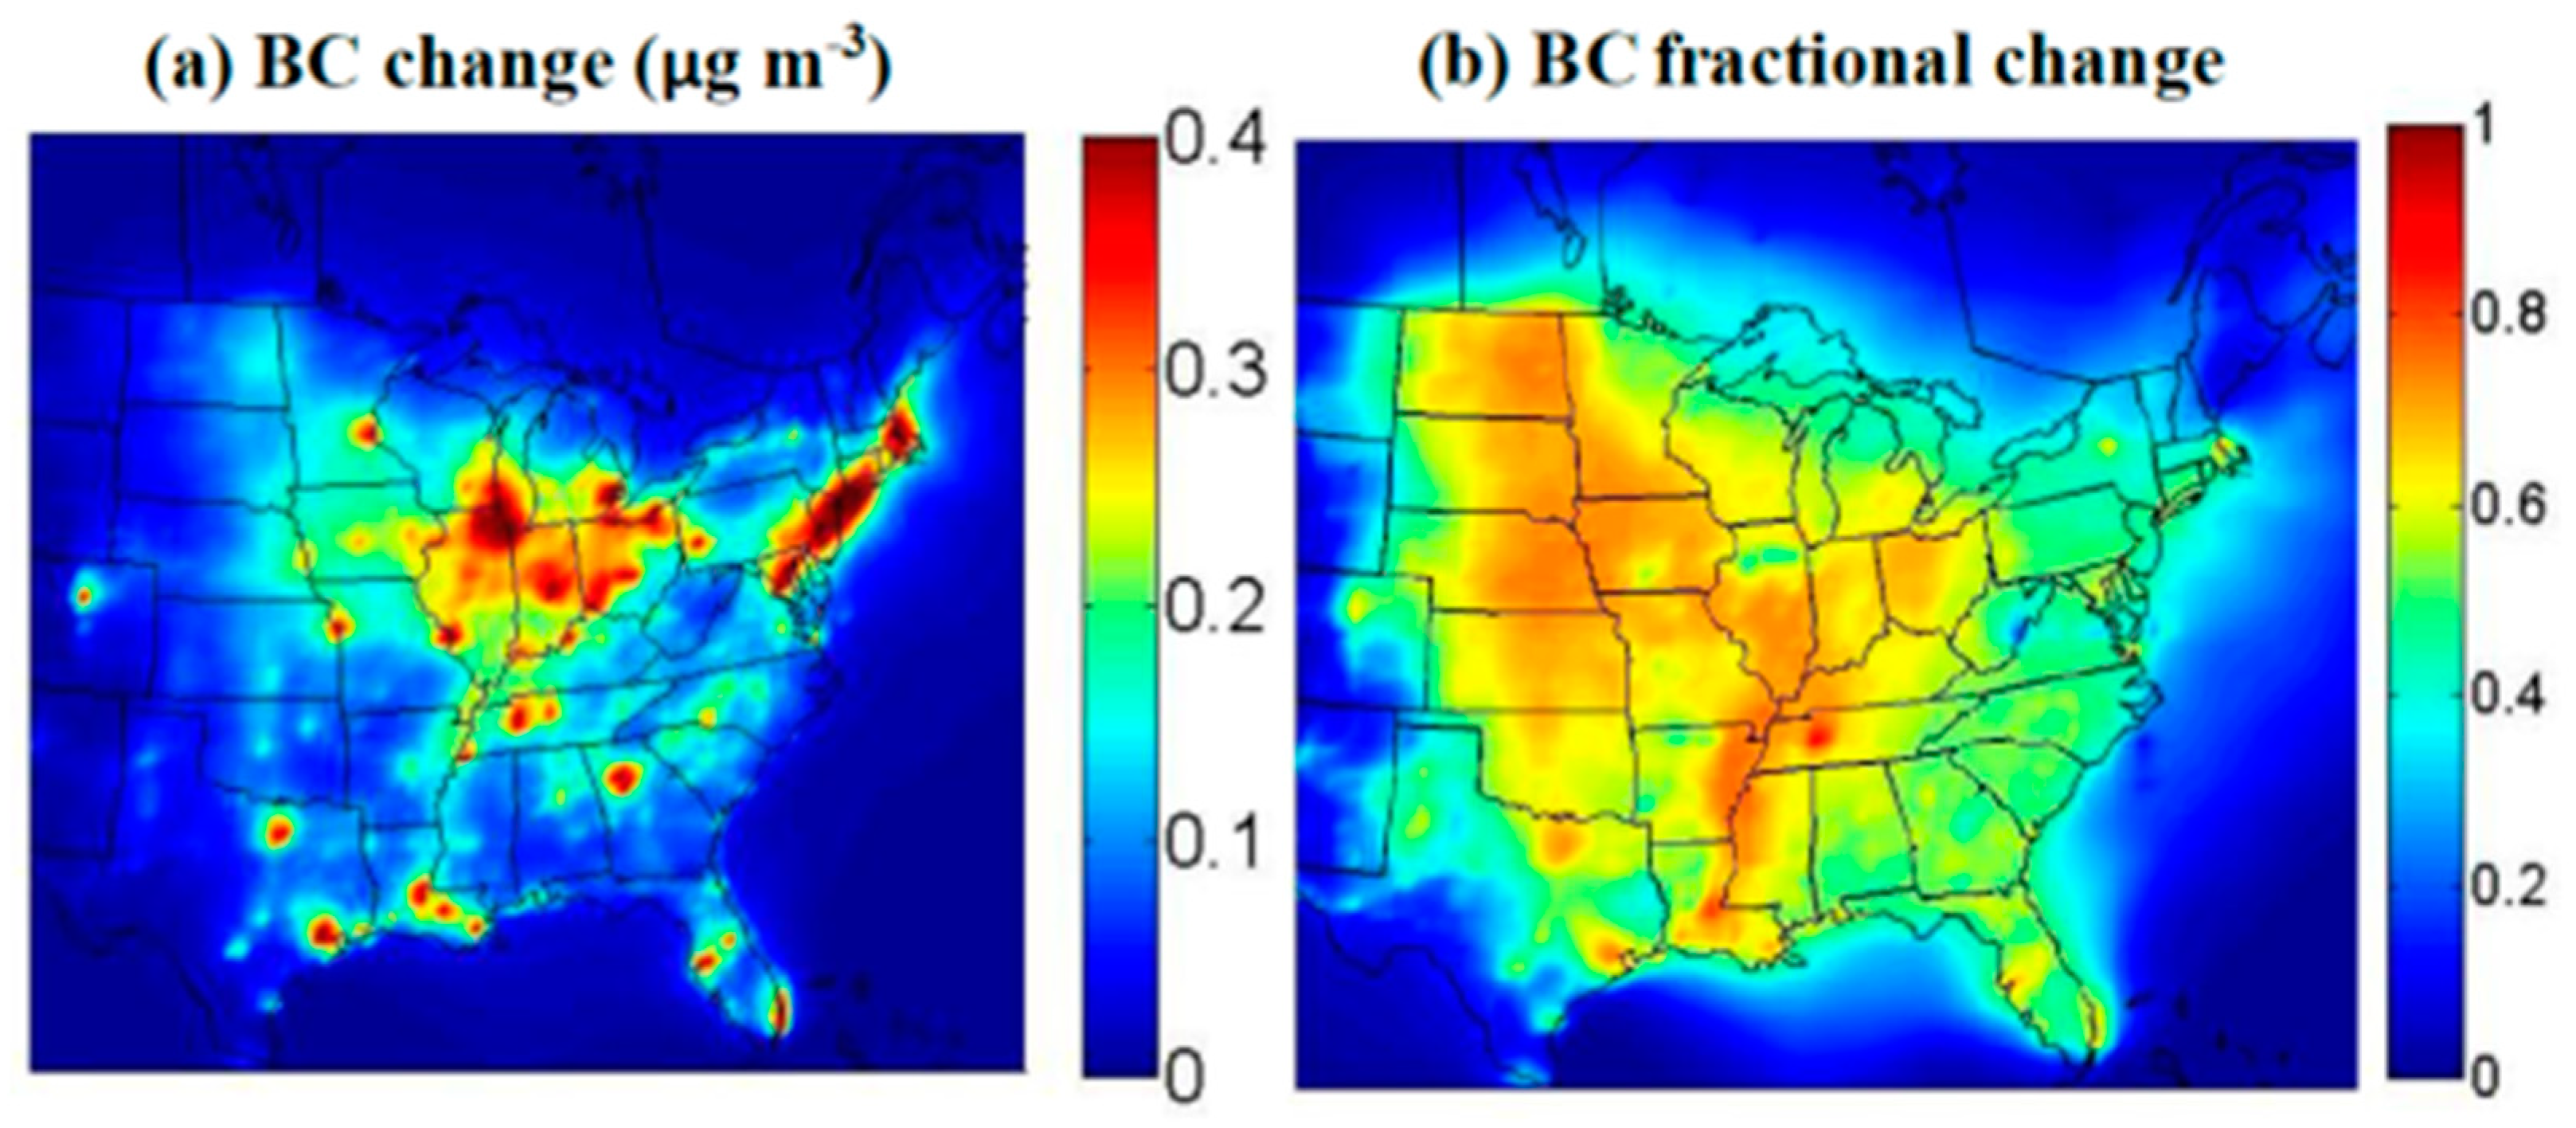
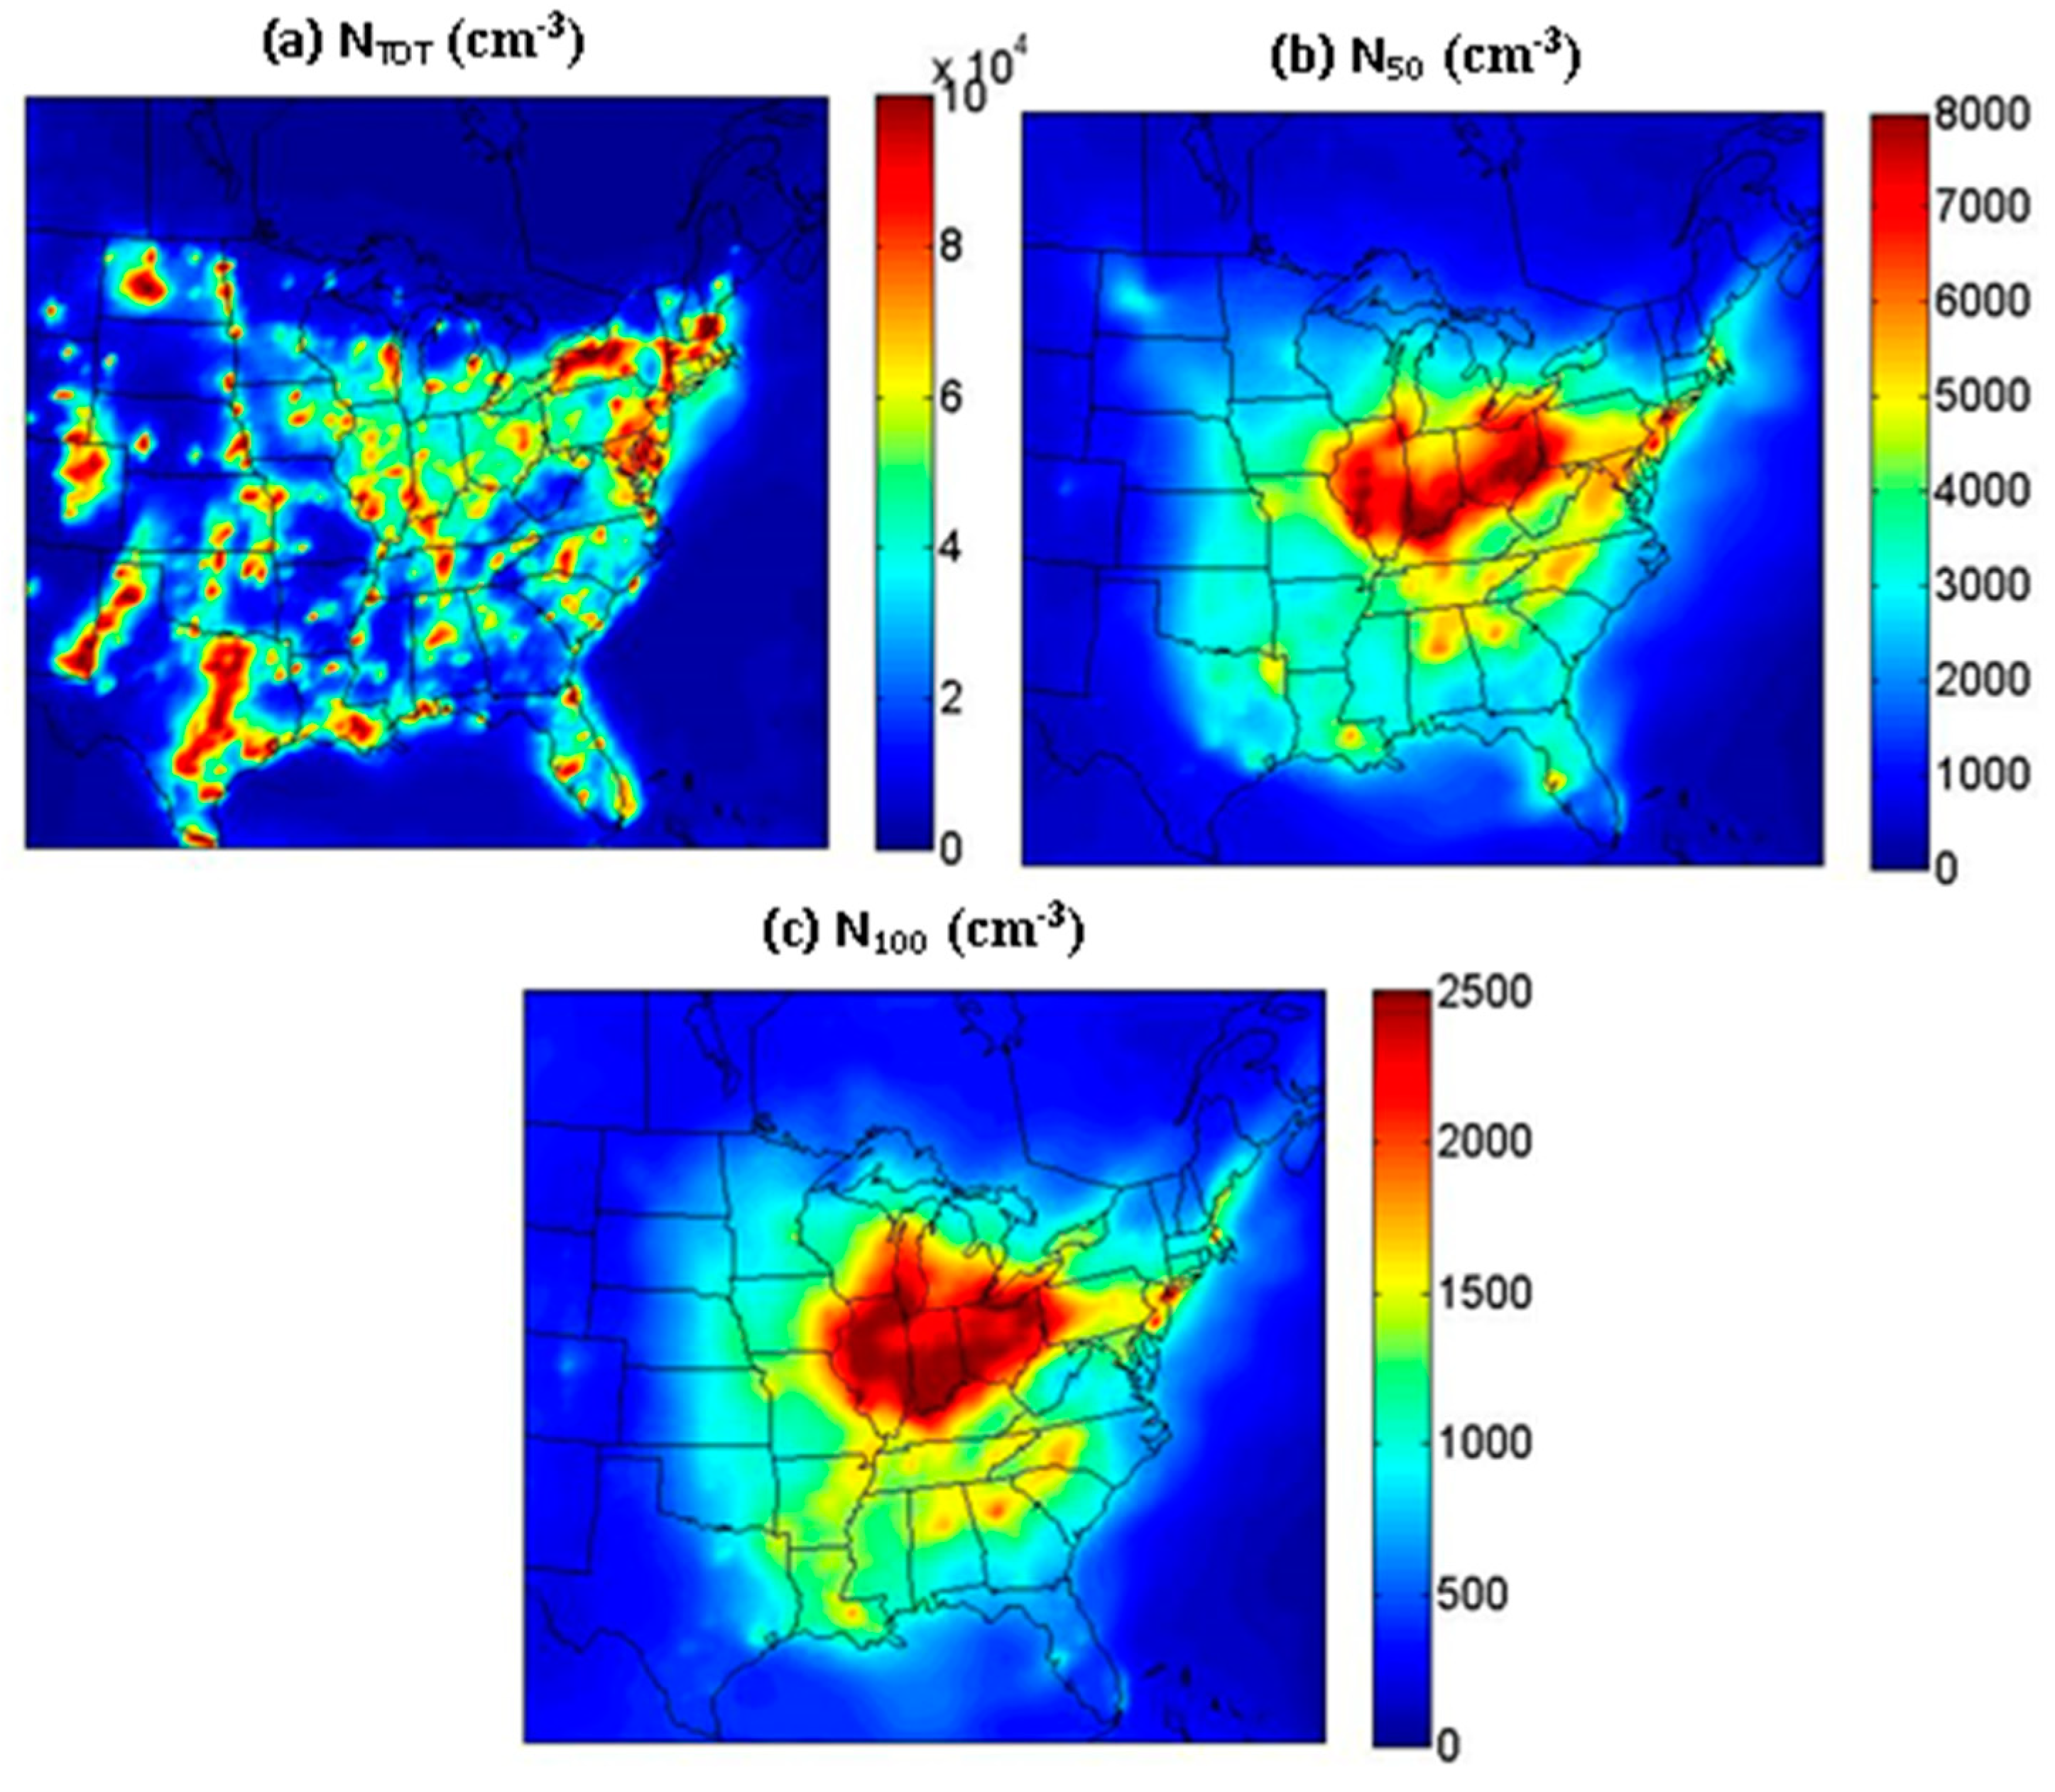
The base number emissions inventory developed by Posner and Pandis [
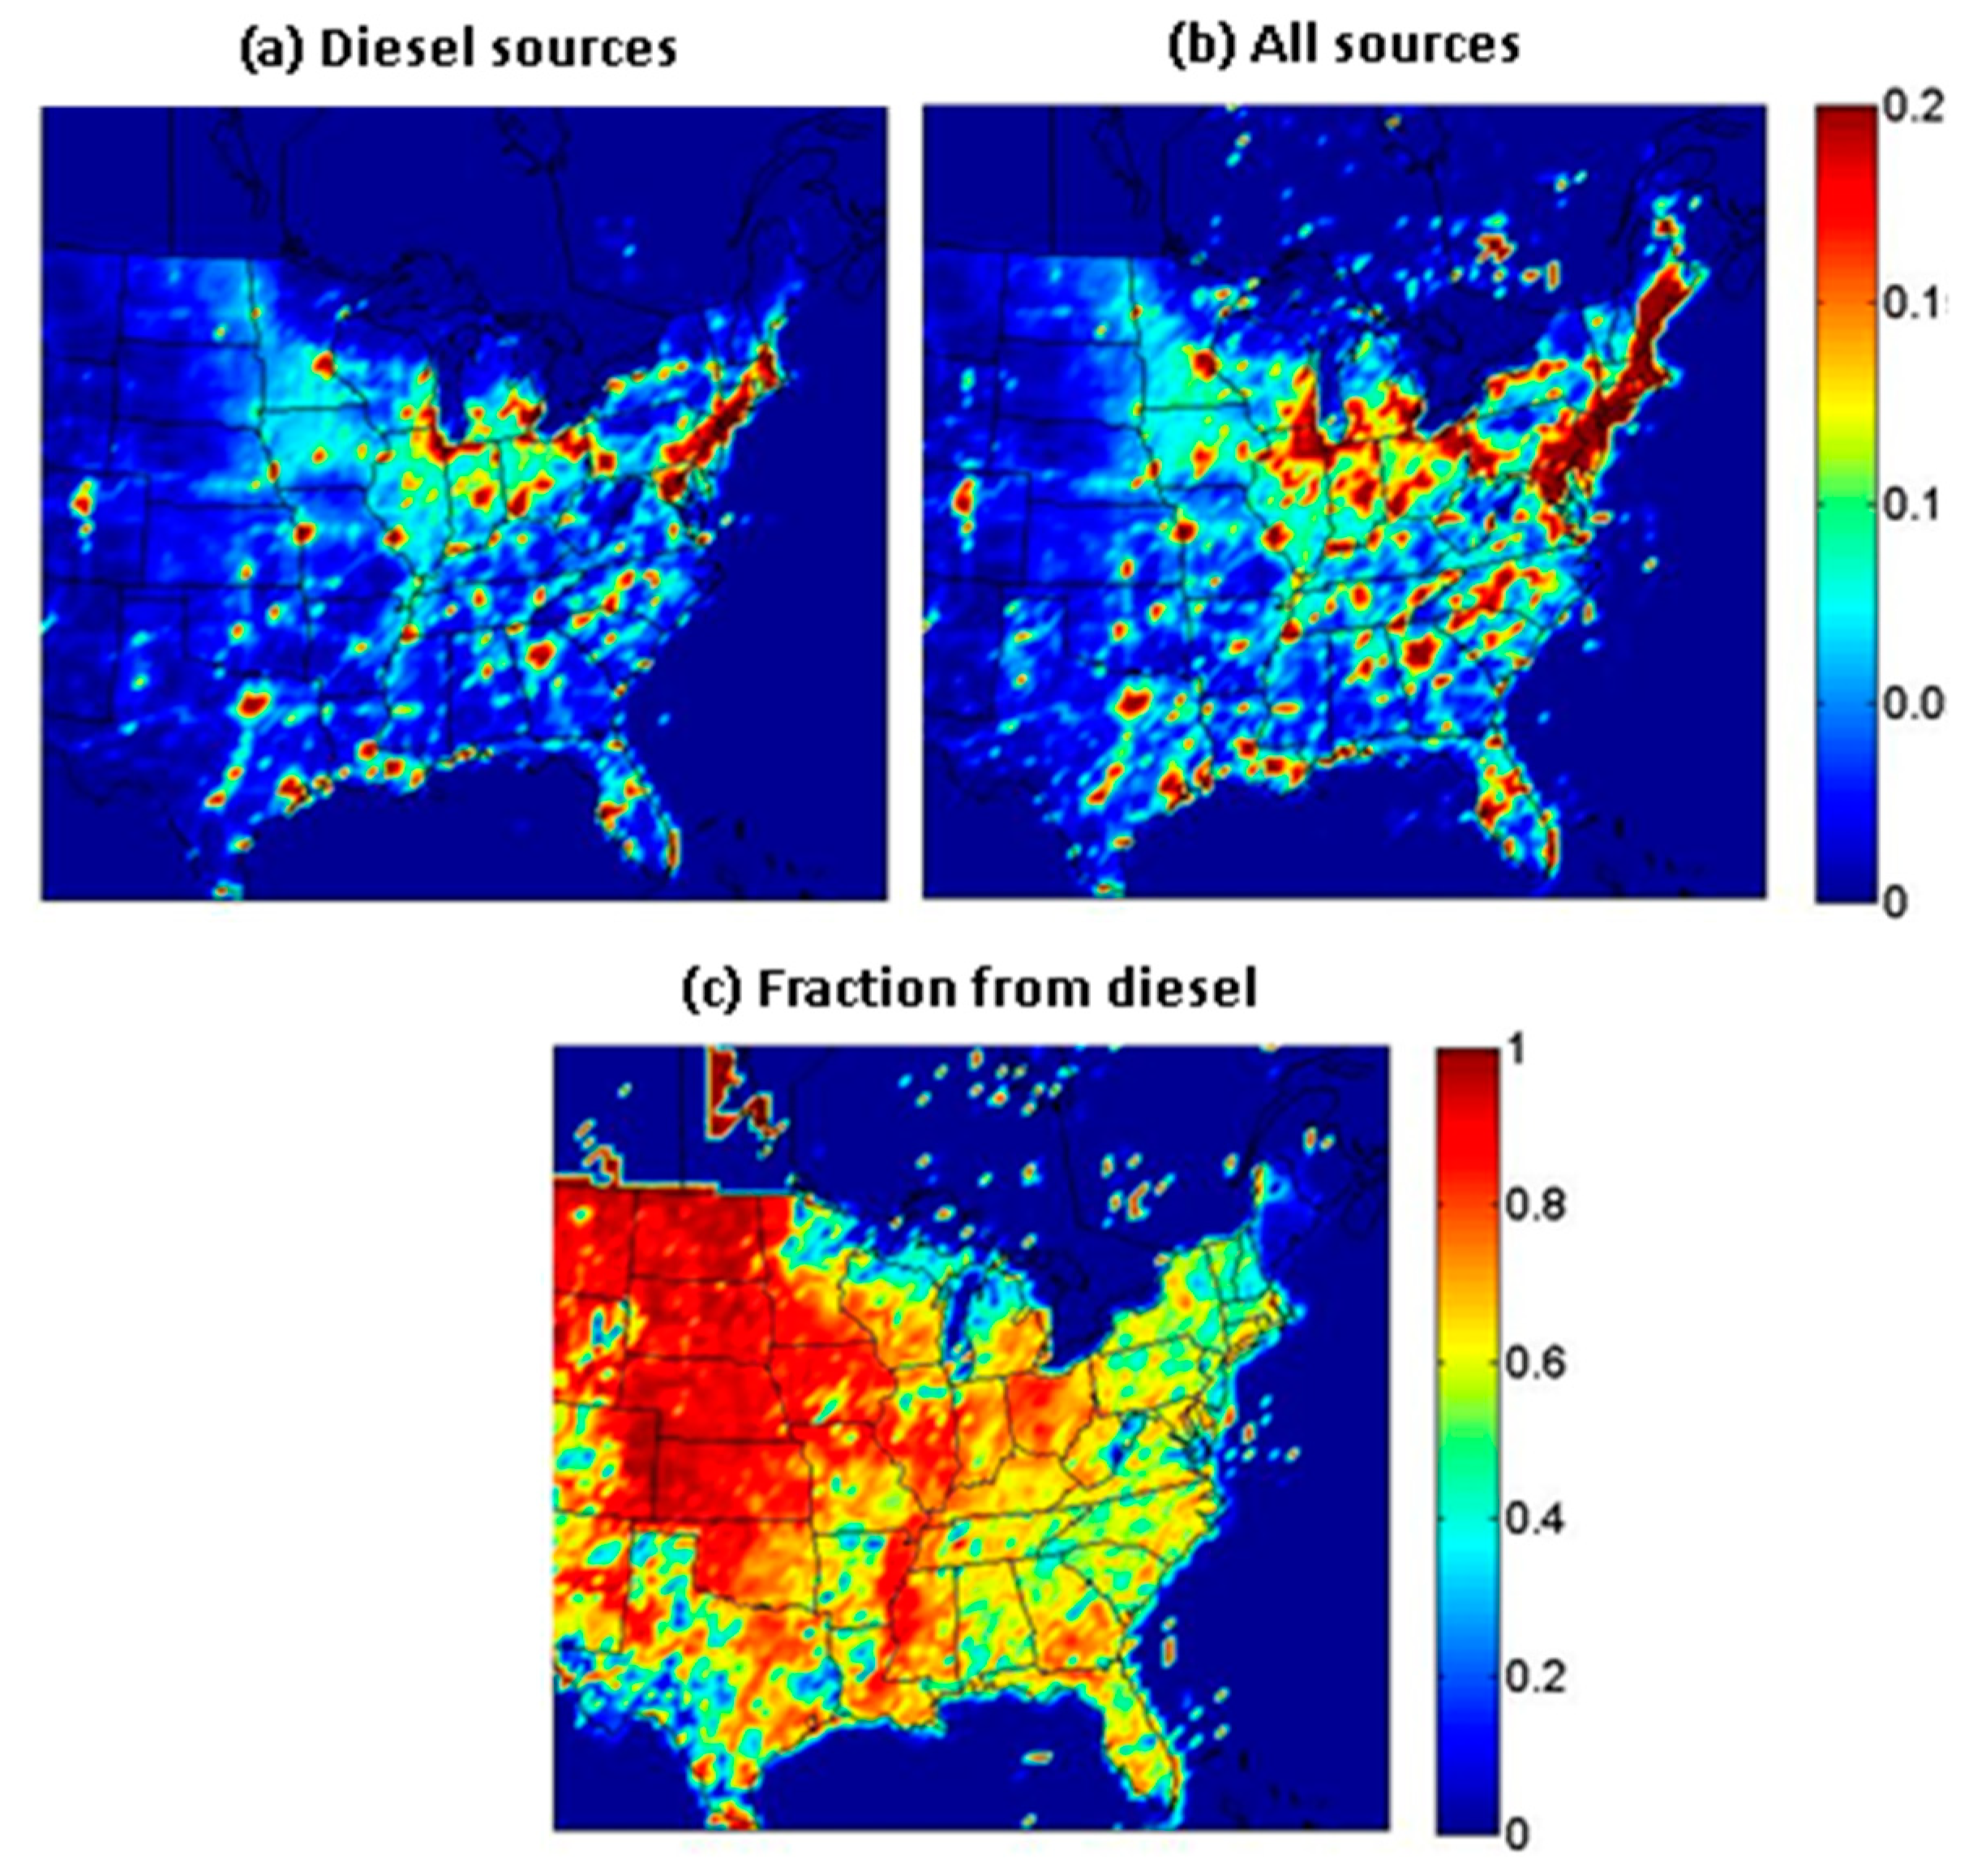
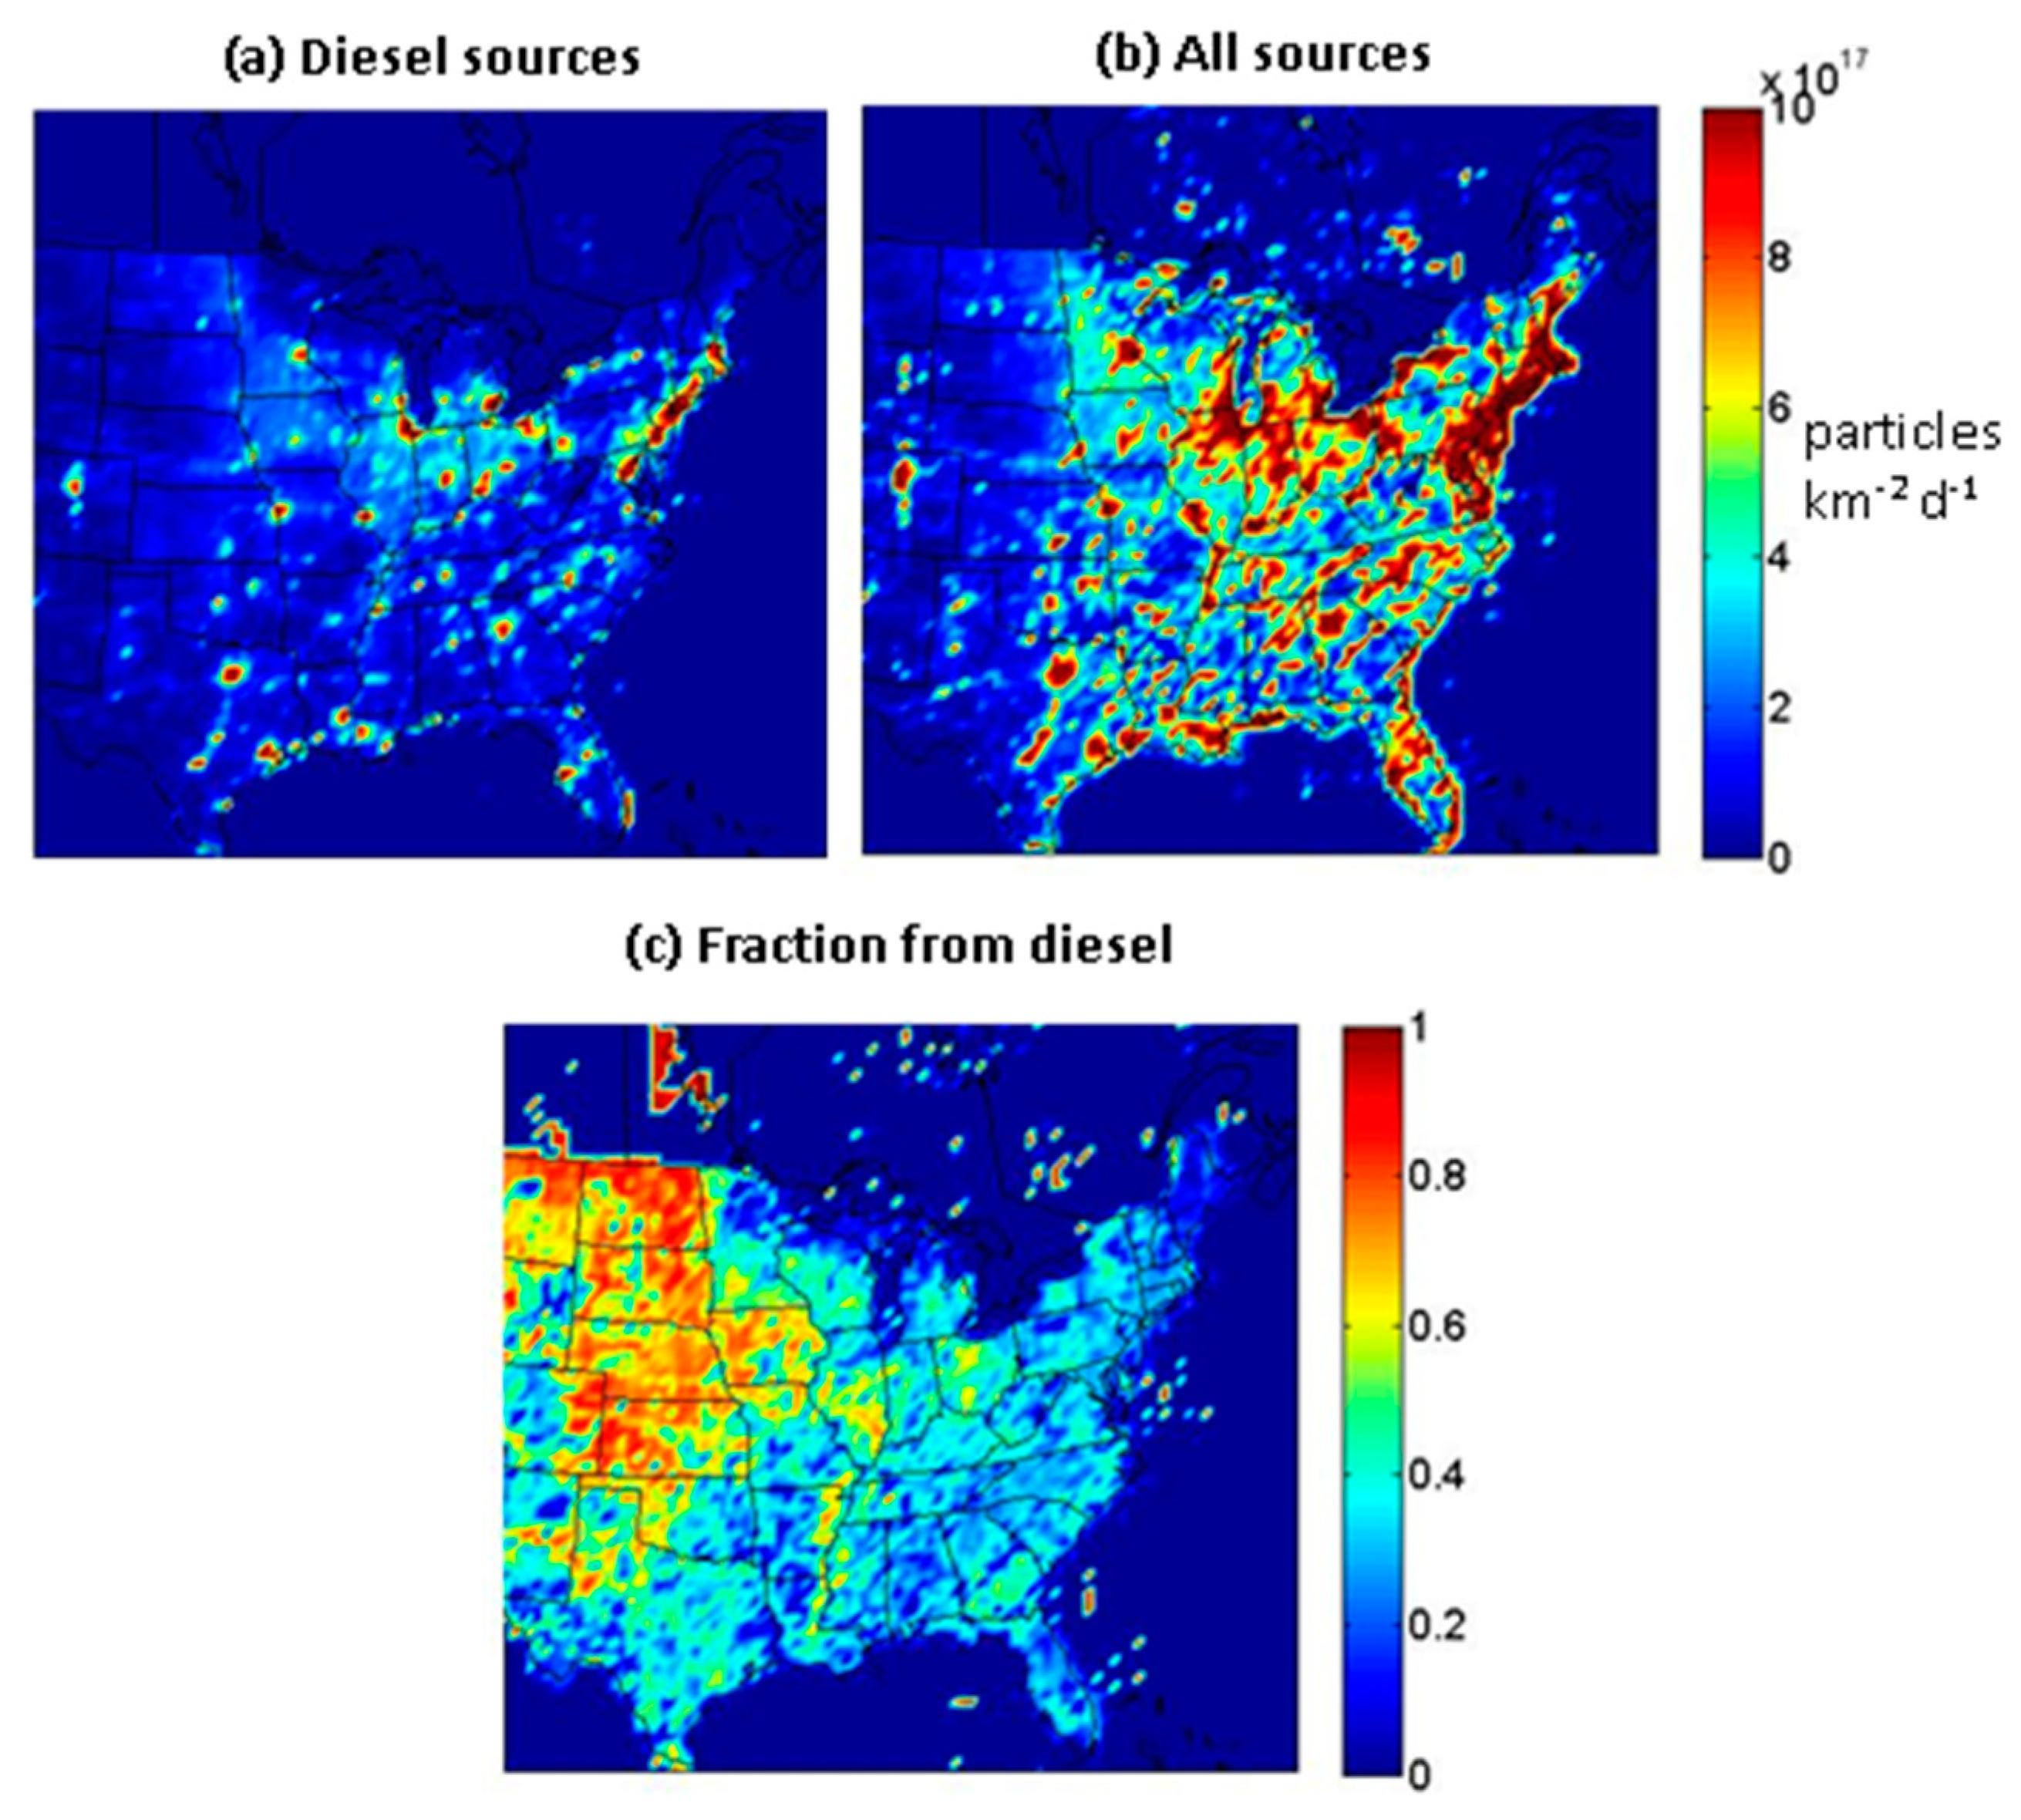
21] is used as the base inventory for this study. The inventory includes biomass burning (combined with wood combustion), gasoline automobiles, industrial emissions, non-road diesel, on-road diesel emissions, and dust. The absolute and fractional contribution of diesel sources (on- and non-road diesel) to total PM2.5 BC and total number (NTOT, equivalent to N0.8 in our study) emissions in the base case are shown in Figure 1 and Figure 2, respectively. According to this July base emissions inventory, non-road and on-road diesel sources are responsible for 58% of the total emitted PM2.5 BC and 27% of the total number emissions in the Eastern U.S. domain. The large contribution of diesel sources to NTOT and PM2.5 BC emissions in the Midwest is associated with non-road diesel emissions during farming activities. Diesel sources are responsible for most of the PM2.5 BC emissions throughout the domain but do not contribute as much to NTOT emissions outside of the Midwest due to the predominance of other sources, such as gasoline.
The reduced diesel emissions inventory was derived to represent a simple case of diesel mitigation in which the base non- and on-road diesel particulate emissions are reduced by 50%. Dallmann et al. [9] found that the 2010 regulation in California of HDD emissions reduced BC emissions from HDD by approximately 50%, so the half-diesel case can be seen as a simplified change in emissions due to regulation. The reduction was applied uniformly across the modeling domain and across all particle-size sections. Gaseous emissions were assumed to remain constant for all simulations in this study. The half-diesel scenario results in a 29% decrease in total BC emissions and a 14% decrease in NTOT emissions as compared to the base emissions.
The double-diesel emissions scenario assumes a major future increase in the number of vehicles and machinery being used. Only the particulate emissions from diesel sources were doubled in this scenario. The increase in diesel emissions was applied uniformly across the modeling domain and across all particle-size sections. The double-diesel scenario results in a 58% increase in PM2.5 BC emissions and a 27% increase in NTOT emissions as compared to the base emissions for the Eastern U.S. domain.

4. Simulated Black Carbon Concentrations

4.1. Base Case

The base case for this study is the same as the base case in Posner and Pandis [21] based on the recommendations of Lane et al. [22] for BC mass emissions. The mean bias of predicted vs. observed concentrations at Speciation Trends Network (STN) (urban) sites [23] was −0.17 μg m−3. The model slightly underpredicts PM2.5 BC concentrations in comparison to the Interagency Monitoring of Protected Visual Environments (IMPROVE) [23] observations in mainly rural areas; the mean bias is −0.17 μg m−3. Predicted average ground concentrations of PM2.5 BC are shown in Figure 3. These predictions have been evaluated by Lane et al. [22].

4.2. Scenario I: Reduction in Diesel Emissions by 50%

Since diesel is a major source of PM2.5 BC emissions (58%) during this summer 2001 period in the Eastern U.S., the half-diesel particulate emissions scenario results in a considerable decrease in PM2.5 BC concentrations over most of the domain (Figure 4). In order to reduce the influence of the boundary conditions, we report domain averages for the Eastern U.S. subdomain proposed by Murphy and Pandis [24] that excludes areas of the domain that are most influenced by the boundary conditions. The Eastern U.S. subdomain-averaged PM2.5 BC concentration reduction is 0.04 μg m−3 or 23% of the base values, which is smaller than what one would expect (29%) for a 50% reduction in 58% of the BC emissions. This small difference is due to the influence of long-range transport simulated through the boundary conditions, which were kept constant for all simulations. The largest absolute reductions are in the Northeast coast and the Chicago area, while the largest fractional reductions are in the Midwest, where non-road diesel emissions are the dominant BC source.

4.3. Scenario II: Double-Diesel Emissions Increase

The double-diesel particulate emissions perturbation results in a considerable increase in PM2.5 BC concentrations over most of the domain (Figure 5). The Eastern U.S. subdomain-averaged PM2.5 BC concentration increase due to the double-diesel perturbation is 0.08 μg m−3 or 46% of the average base value. This is also lower than one would expect (58%) for a proportional increase in BC emissions because of the long-range-transported BC that is assumed to remain constant. The spatial pattern of these increases is similar to the spatial distribution of reductions due to the half-diesel perturbation. The largest absolute increases in PM2.5 BC concentrations are located where emissions from on-road diesel are largest (the Northeast coast and the Chicago area). Most of the largest fractional reductions are where the non-road diesel emissions are largest and the main contributor to particle concentrations (the Midwest).

5. Simulated Particle Number Concentrations

5.1. Base Case

In this study, we focus on total particle number concentrations (NTOT), particles greater than 50 nm in diameter (N50), and particles greater than 100 nm in diameter (N100). Since ultrafine particles (less than 100 nm in diameter) form the majority of NTOT, they can greatly contribute to the number of particles that grow to become CCNs (generally N100) through condensation [25].
Model predictions of particles greater than 3 nm in diameter (N3), which is the range of measurable NTOT, agree with observed Pittsburgh Air Quality Study (PAQS) measurements within 10% on average and in the N100 range within 5%. Maps of the simulation-average ground NTOT, N50, and N100 concentration fields can be found in Figure 6. Using zero-out number but not mass simulations [18], we calculated the contribution of diesel sources to ultrafine particle number concentrations for the July 2001 base case. Figure 7 shows the calculated absolute and fractional contributions of diesel sources to total particle number concentrations for the base case. The peaks in the number concentration contributions from diesel are seen where emissions from diesel sources are also large. Nucleation is the dominant source of particle number concentrations in the domain for this period, so the domain-averaged fractional contribution of diesel to particle number concentrations is small. There are peaks in the Midwest due to the predominance of non-road diesel emissions in those areas with, according to the inventory, few other major emissions nearby. On average, for July 2001 in the Eastern U.S., diesel particles were predicted to contribute 140 cm−3 or about 0.6% to total particle number concentrations.

5.2. Scenario I: Half-Diesel Emissions Reduction

If the effects of the half-diesel emissions scenario on simulated particle number concentrations were linear, they would result in a 50% decrease in diesel particle number concentrations compared to the base case. Figure 8 shows the estimated linear changes as well as the actual simulated changes for this reduction scenario. A simple linear change would, on average, for July 2001 in the Eastern U.S., result in a 70 cm−3 or 0.3% decrease in total particle number concentrations as compared to the base case. Instead, PMCAMx-UF predicts an average increase of 350 cm−3 or 1.6% in total particle number concentrations. Domain-averaged N50 and N100, however, decreased by 0.9% and 1.6%, respectively. PMCAMx-UF also predicts a 1.4% decrease in PM2.5 surface area. The reduction in particle emissions from diesel sources, in this case, changes not only the particle number emissions but also the corresponding condensation and coagulation sinks. There is less particle surface area for vapors to condense onto and fewer large particles with which smaller particles can coagulate.
The results of this half-diesel simulation suggest that reduction in the larger diesel particles can result in increased ultrafine particle number concentrations due to their increased survival probability but also the increased nucleation rates. However, these effects do depend on the size range examined. The N100 concentration (used as a proxy for the CCN concentration) is predicted to decrease in this simulation despite the increase in total particle number, though not as much as one would estimate assuming a proportional change. Chen et al. [13] predicted a 5.6% global-scale decrease in CCN concentrations for a 50% reduction in BC emissions from fossil fuels compared to our predicted 1.6% decrease. The authors assumed a larger reduction in number emissions (22.5%) than in this study (14%) and simulated different time periods. Our results refer to a photochemically active summertime period.

5.3. Scenario II: Doubling of Diesel Emissions

Figure 9 shows the estimated (proportional) changes in the double-diesel emissions scenario as well as the actual simulated changes. A simple linear change would result, on average, in a 140 cm−3 or 0.65% increase in total particle number as compared to the base case. Instead, PMCAMx-UF predicts the opposite: an average 660 cm−3 or 3% decrease in total number concentrations. Domain-average N50 and N100, however, are predicted to increase by 1.9% and 3.3%, respectively. A 2.9% increase in PM2.5 surface area is also predicted. This suggests that the increase in surface area, caused by doubling the diesel emissions, resulted in a reduction in the mass condensing onto ultrafine particles and a corresponding increase in the mass condensing onto larger particles. There was also an increase in the coagulation rates of smaller particles with the larger ones and a reduction in the nucleation rates.
The half- and double-diesel emissions simulations predict counterintuitive changes in the ultrafine particle number concentration results for the same reasons. The double-diesel emissions scenario assumes a doubling of the diesel particle number and mass emissions as compared to the base case, leading to an increase in the condensation and coagulation sinks. With the number of larger particles increasing, there is more particle surface area for vapors to condense onto and more large particles with which smaller particles can coagulate, decreasing the number concentrations.

6. Changes in Aerosol Optical Properties

In this study, core–shell Mie theory is used, assuming spherical particles [26] to compute climate-relevant properties of simulated aerosol concentrations at a wavelength of 550 nm. For the calculations, we used a refractive index of BC equal to 1.85+0.71i [27]. The assumed mixing state, simulated size distribution, mass, and number concentrations of particles in the modeled atmosphere determine climate-relevant properties such as absorption and optical depth. BC, in particular, is important due to its strong absorption properties. PMCAMx-UF simulates aerosol concentrations assuming the internal mixing of particles, i.e., that all particles in a given size section have the same chemical composition. The other extreme representation of particle composition is external mixing, i.e., each particle in a given size section is composed of a different chemical component, one chemical component per particle. Since particle mixing states in the real atmosphere vary between these two extremes, the optical properties of the aerosol have been calculated using model-predicted size-composition distributions and both external and internal mixing assumptions. This gives a range of possible values for calculated climate-relevant properties.
BC is a part of every particle in a given size section when internal mixing is assumed. For external mixing, pure BC particles are assumed with no additional chemical compounds that tend to scatter incoming solar radiation (such as sulfate). Since the internal mixing assumption calculates a greater number of BC-containing particles, its corresponding predictions for the absorption coefficient and absorption aerosol optical depth (AAOD) are higher than for external mixing. Extinction is the sum of absorption and scattering, so its relative changes as compared to the base case depend on the relative magnitudes of both the absorption and scattering coefficients. The predicted BC size distribution was quite variable, with smaller particles in general present near the source areas. These particles grew to larger sizes due to both condensation of secondary material and coagulation further away from their sources. The three-dimensional concentration distribution of BC and the other aerosol components, together with their size distributions, are used for the various optical calculations.

6.1. Base Case

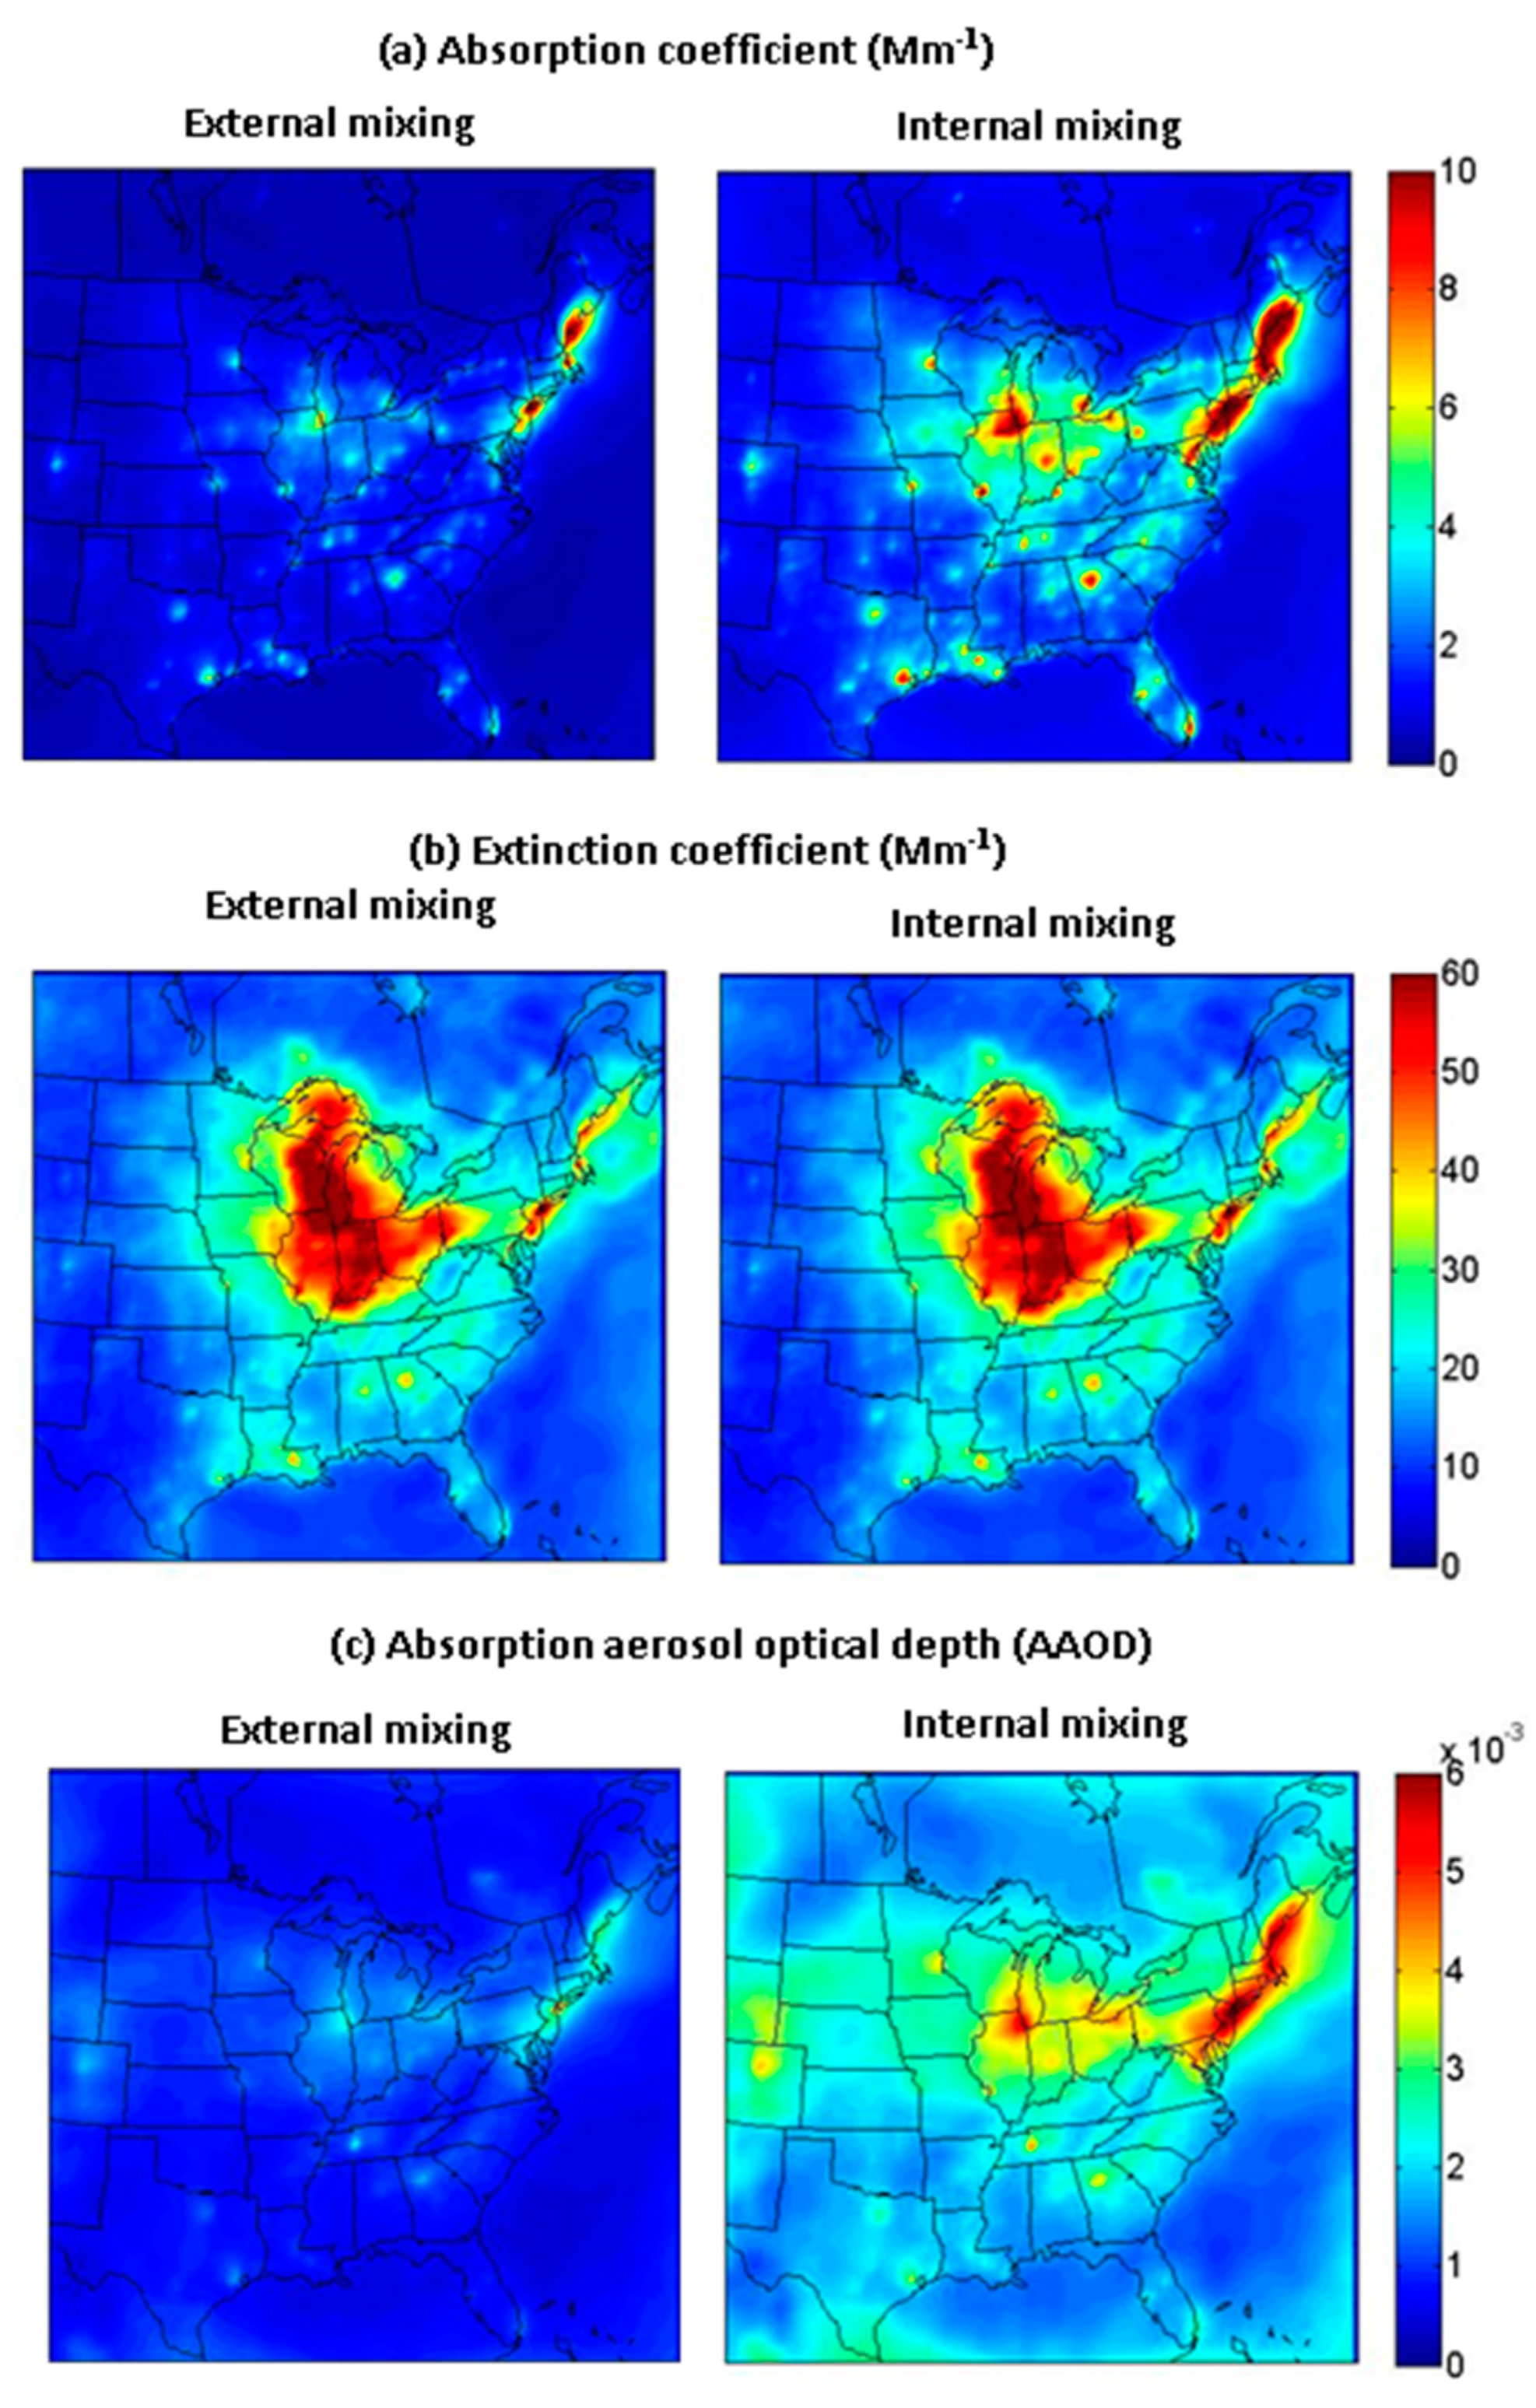
The absorption coefficient, extinction coefficient, and AAOD predictions for the base July 2001 simulation in the Eastern U.S. are shown in Figure 10. The average absorption coefficient during this July 2001 simulation period is, assuming external mixing, 0.91 Mm−1 and, assuming internal mixing, 2.01 Mm−1. Spatially, the high absorption areas are those with considerable emissions from combustion sources (gasoline, diesel, and industrial sources along the Northeast coast and Chicago). The domain-averaged extinction coefficients are 18.95 Mm−1 and 19.35 Mm−1 for external and internal mixing, respectively. High values of the extinction coefficient, as well as the aerosol optical depth (AOD), can be found in areas with high sulfate concentrations. The calculated domain-averaged AOD was determined to be 0.03 for both internal and external mixing. The calculated domain-averaged AAOD for this simulation are 9 × 10⁻⁴ and 2 × 10⁻³ for external and internal mixing, respectively. The spatial distribution of AAOD values is similar to that of the absorption coefficient.

6.2. Scenario I: Half-Diesel Emissions

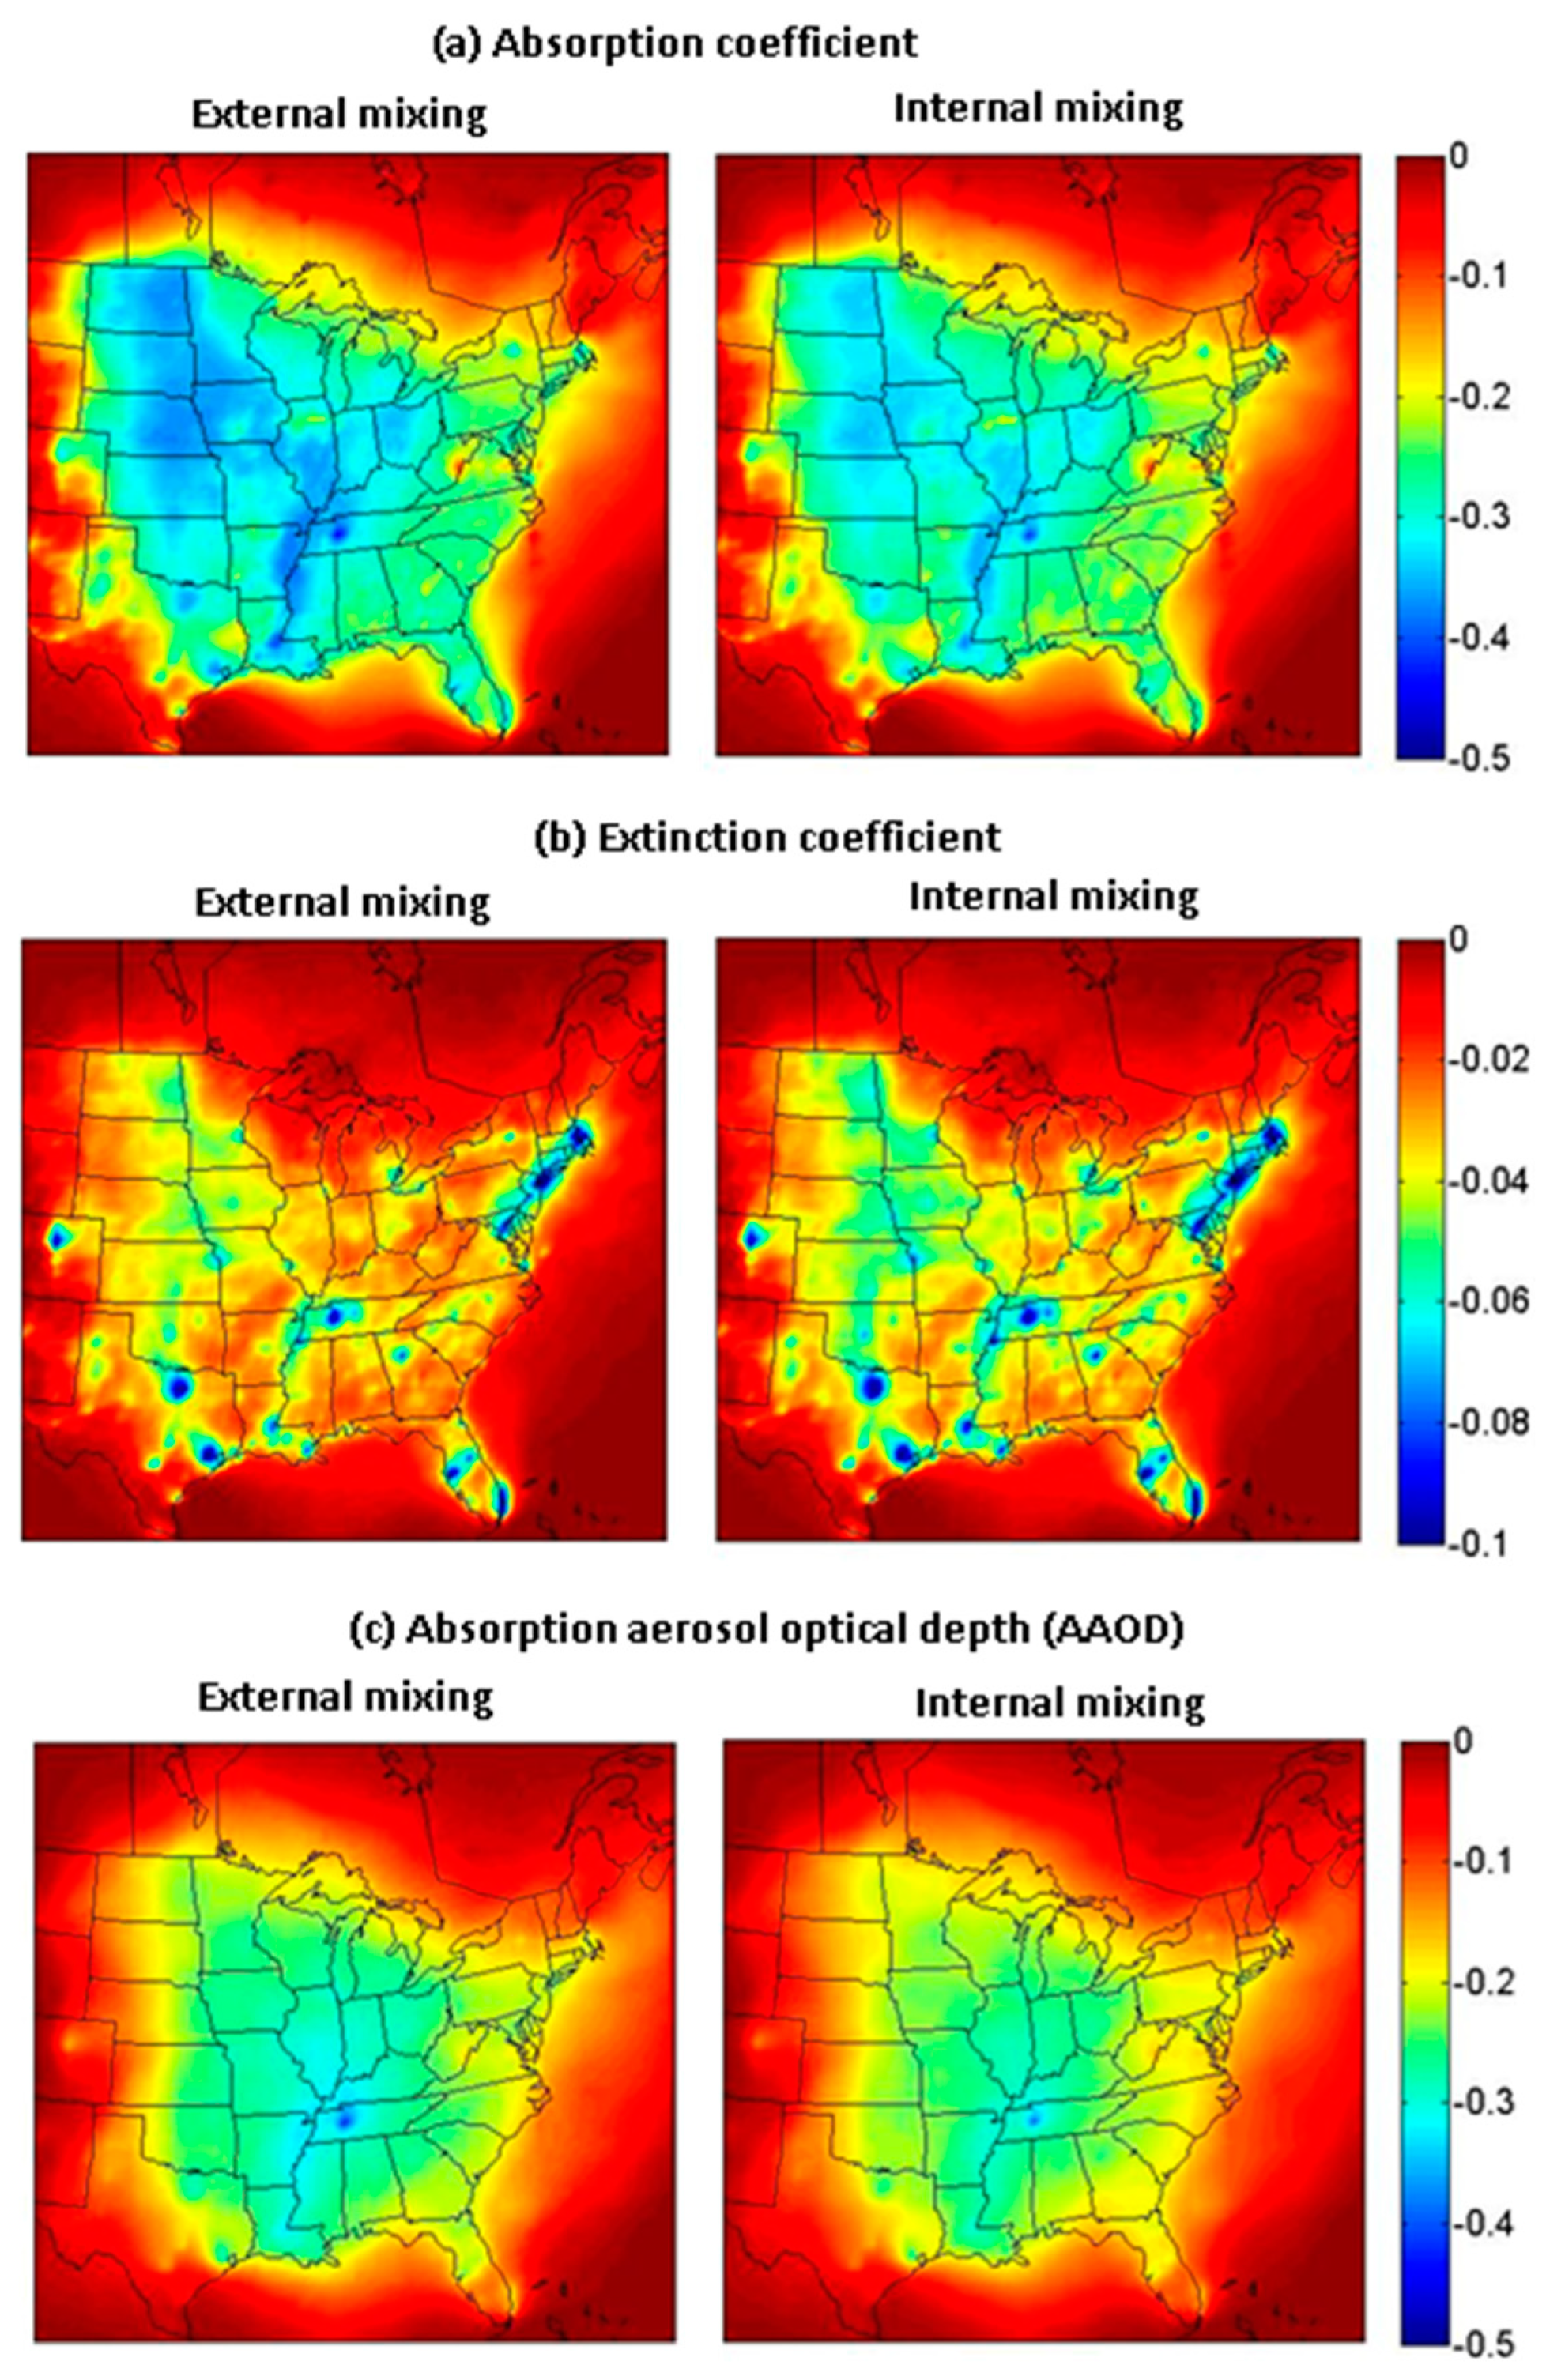
The average fractional reduction in the absorption coefficient is, assuming external mixing, 30% and, assuming internal mixing, 27%. These changes correspond to the changes in PM2.5 BC concentrations. The largest changes in absorption coefficient are in the Midwest, where non-road diesel emissions are the dominant source (Figure 11). Since scattering aerosol dominates the overall extinction during this period and there is little change in scattering when a major absorbing source is reduced, the average fractional reduction in the extinction coefficients for the half-diesel simulation is only 2% for the external mixing assumption and 3% assuming internal mixing. The calculated change in AOD is only 1% for both external and internal mixing assumptions. The average AAOD reduction due to the half-diesel perturbation is 16% and 15% for external and internal mixing assumptions, respectively.

6.3. Scenario II: Double-Diesel Emissions

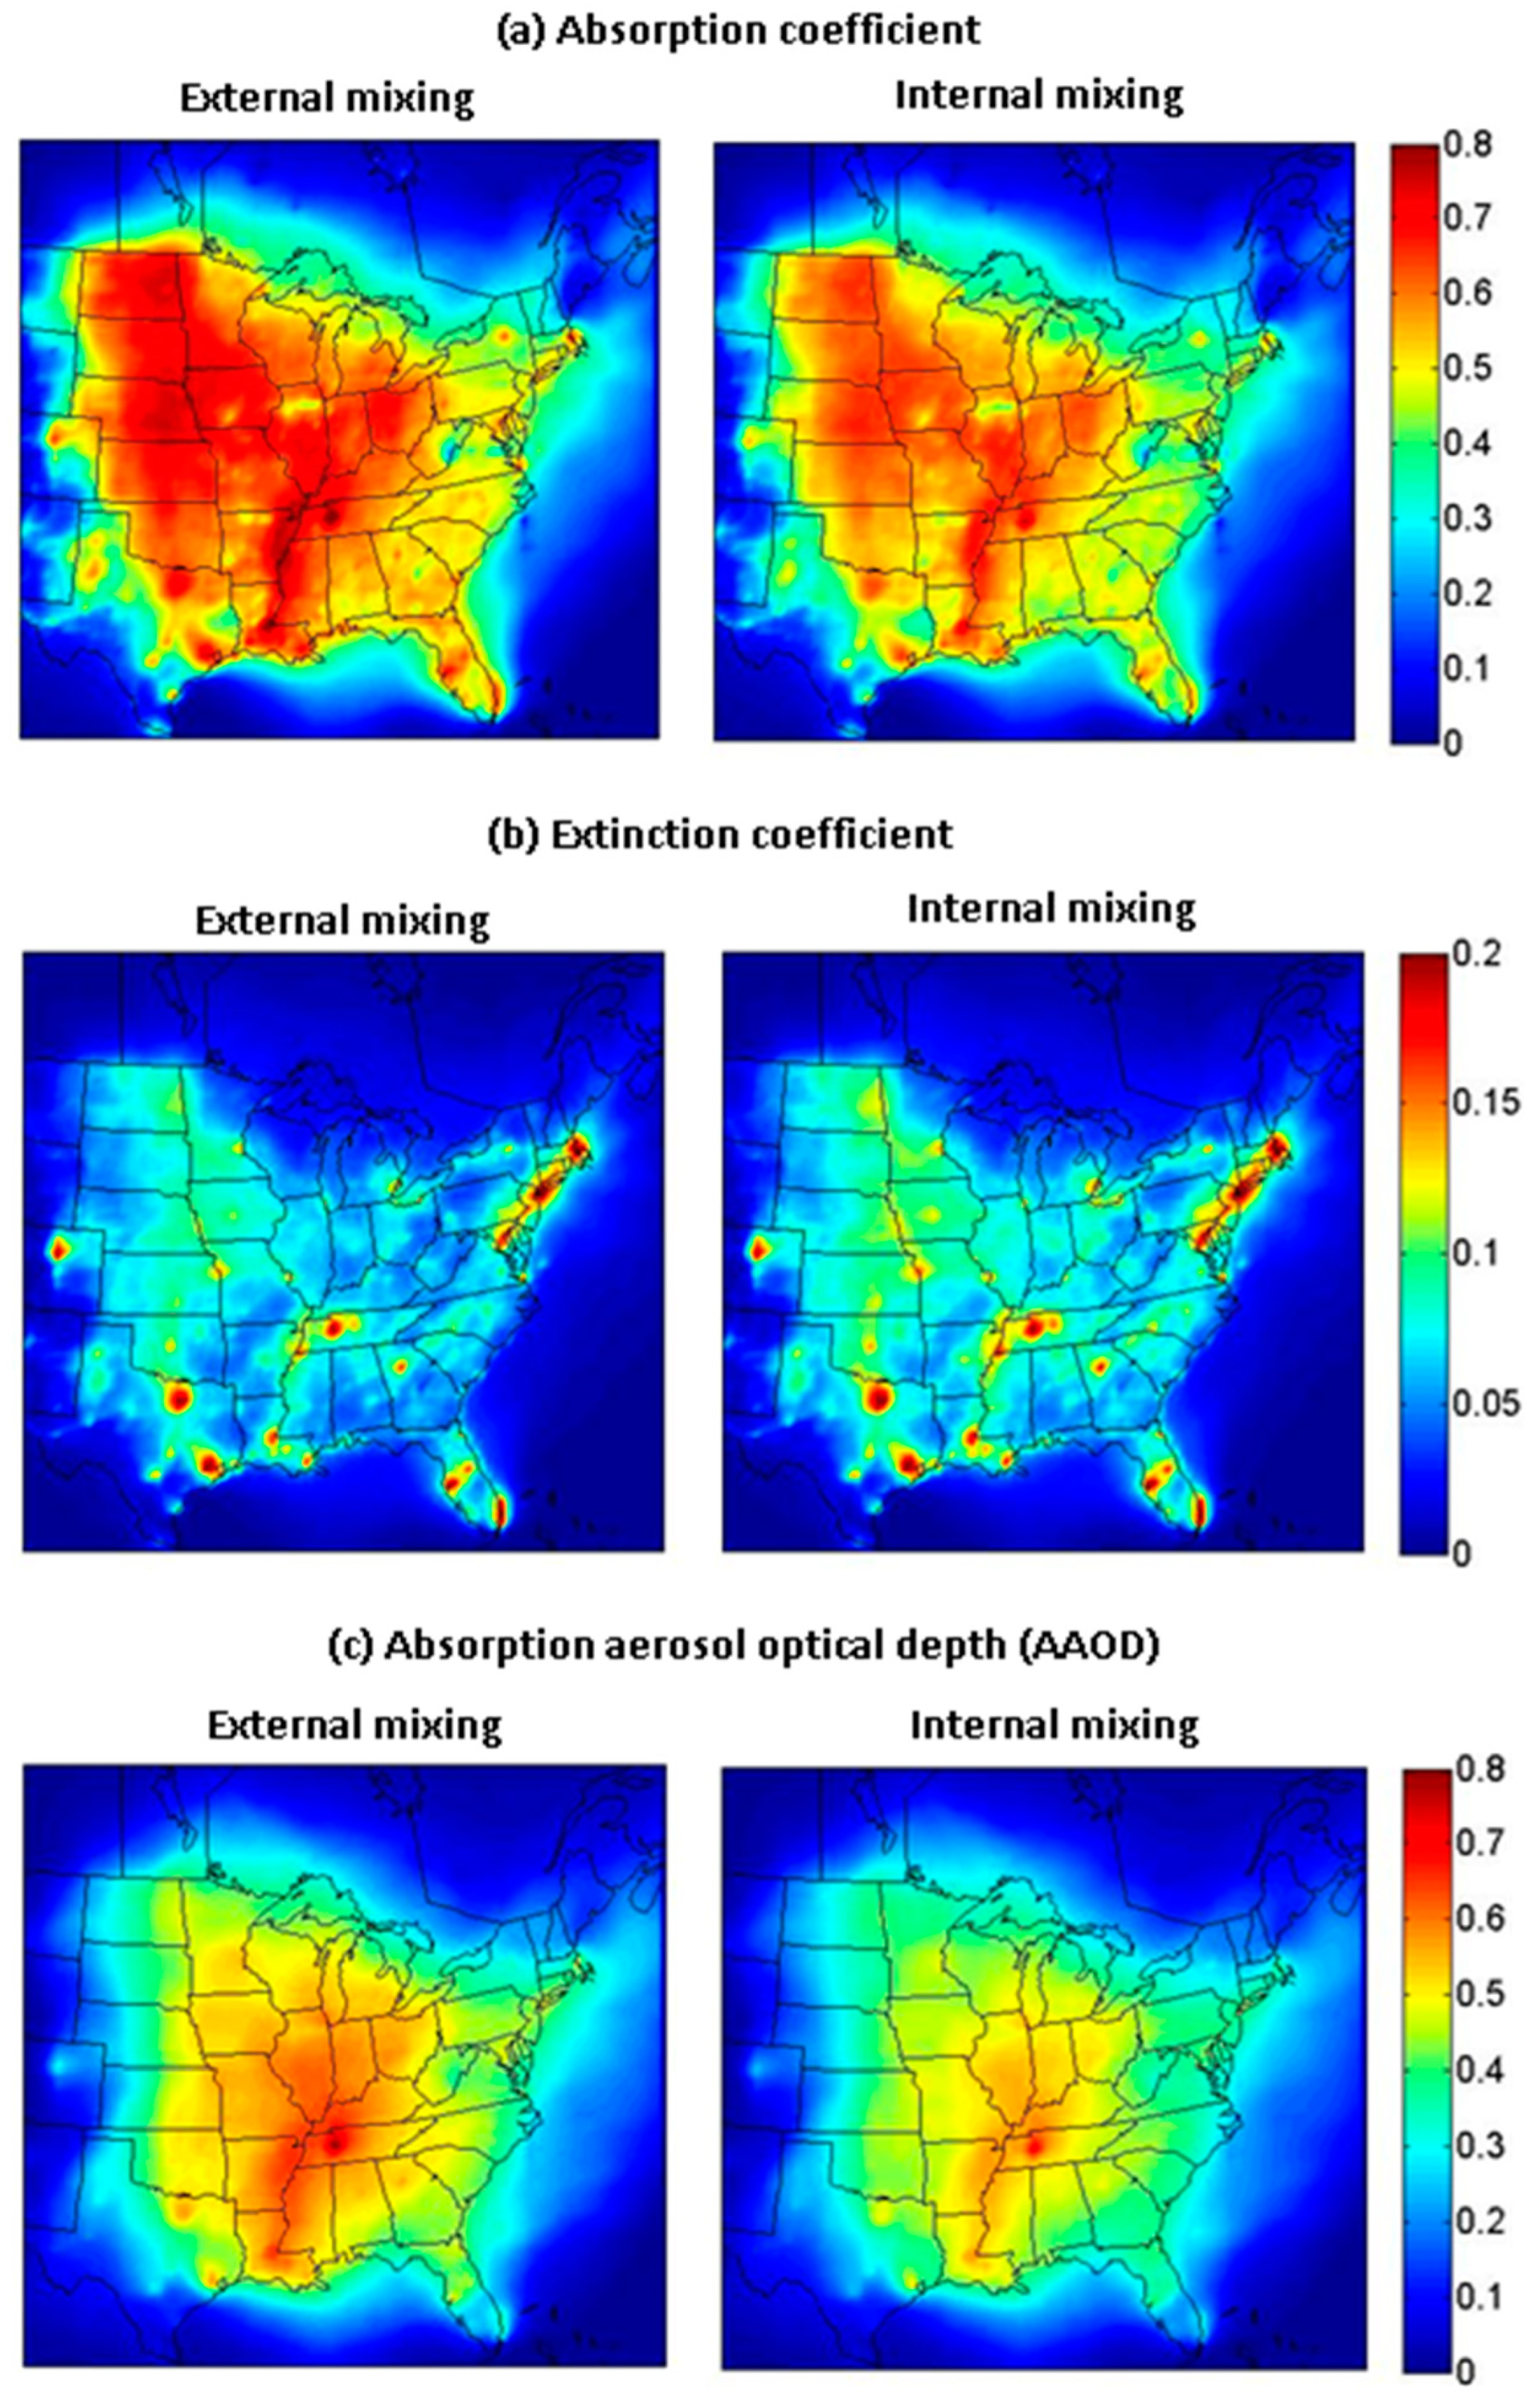
The average fractional increases in the calculated absorption coefficient due to the double-diesel perturbation for the Eastern U.S. subdomain during this July 2001 simulation period are 60%, assuming external mixing, and 52%, assuming internal mixing. The largest changes in absorption coefficient are also in the Midwest (Figure 12). The average fractional increases in the extinction coefficients are only 5% and 6% using external and internal mixing assumptions, respectively, and 2% for AOD.
The average AAOD increases due to the double-diesel perturbation are 32% and 28% for the external and internal mixing assumptions, respectively. The magnitudes of these domain-averaged fractional changes in the absorption coefficient, extinction coefficient, and AAOD for this period due to the doubled emissions are approximately twice as large (in absolute terms) as the changes due to the 50% reduction in diesel emissions.

7. Conclusions

The three-dimensional CTM PMCAMx-UF was used to simulate a summer period base case as well as two simple diesel emission change scenarios: (a) half and (b) double the diesel particulate emissions as compared to the base emissions.
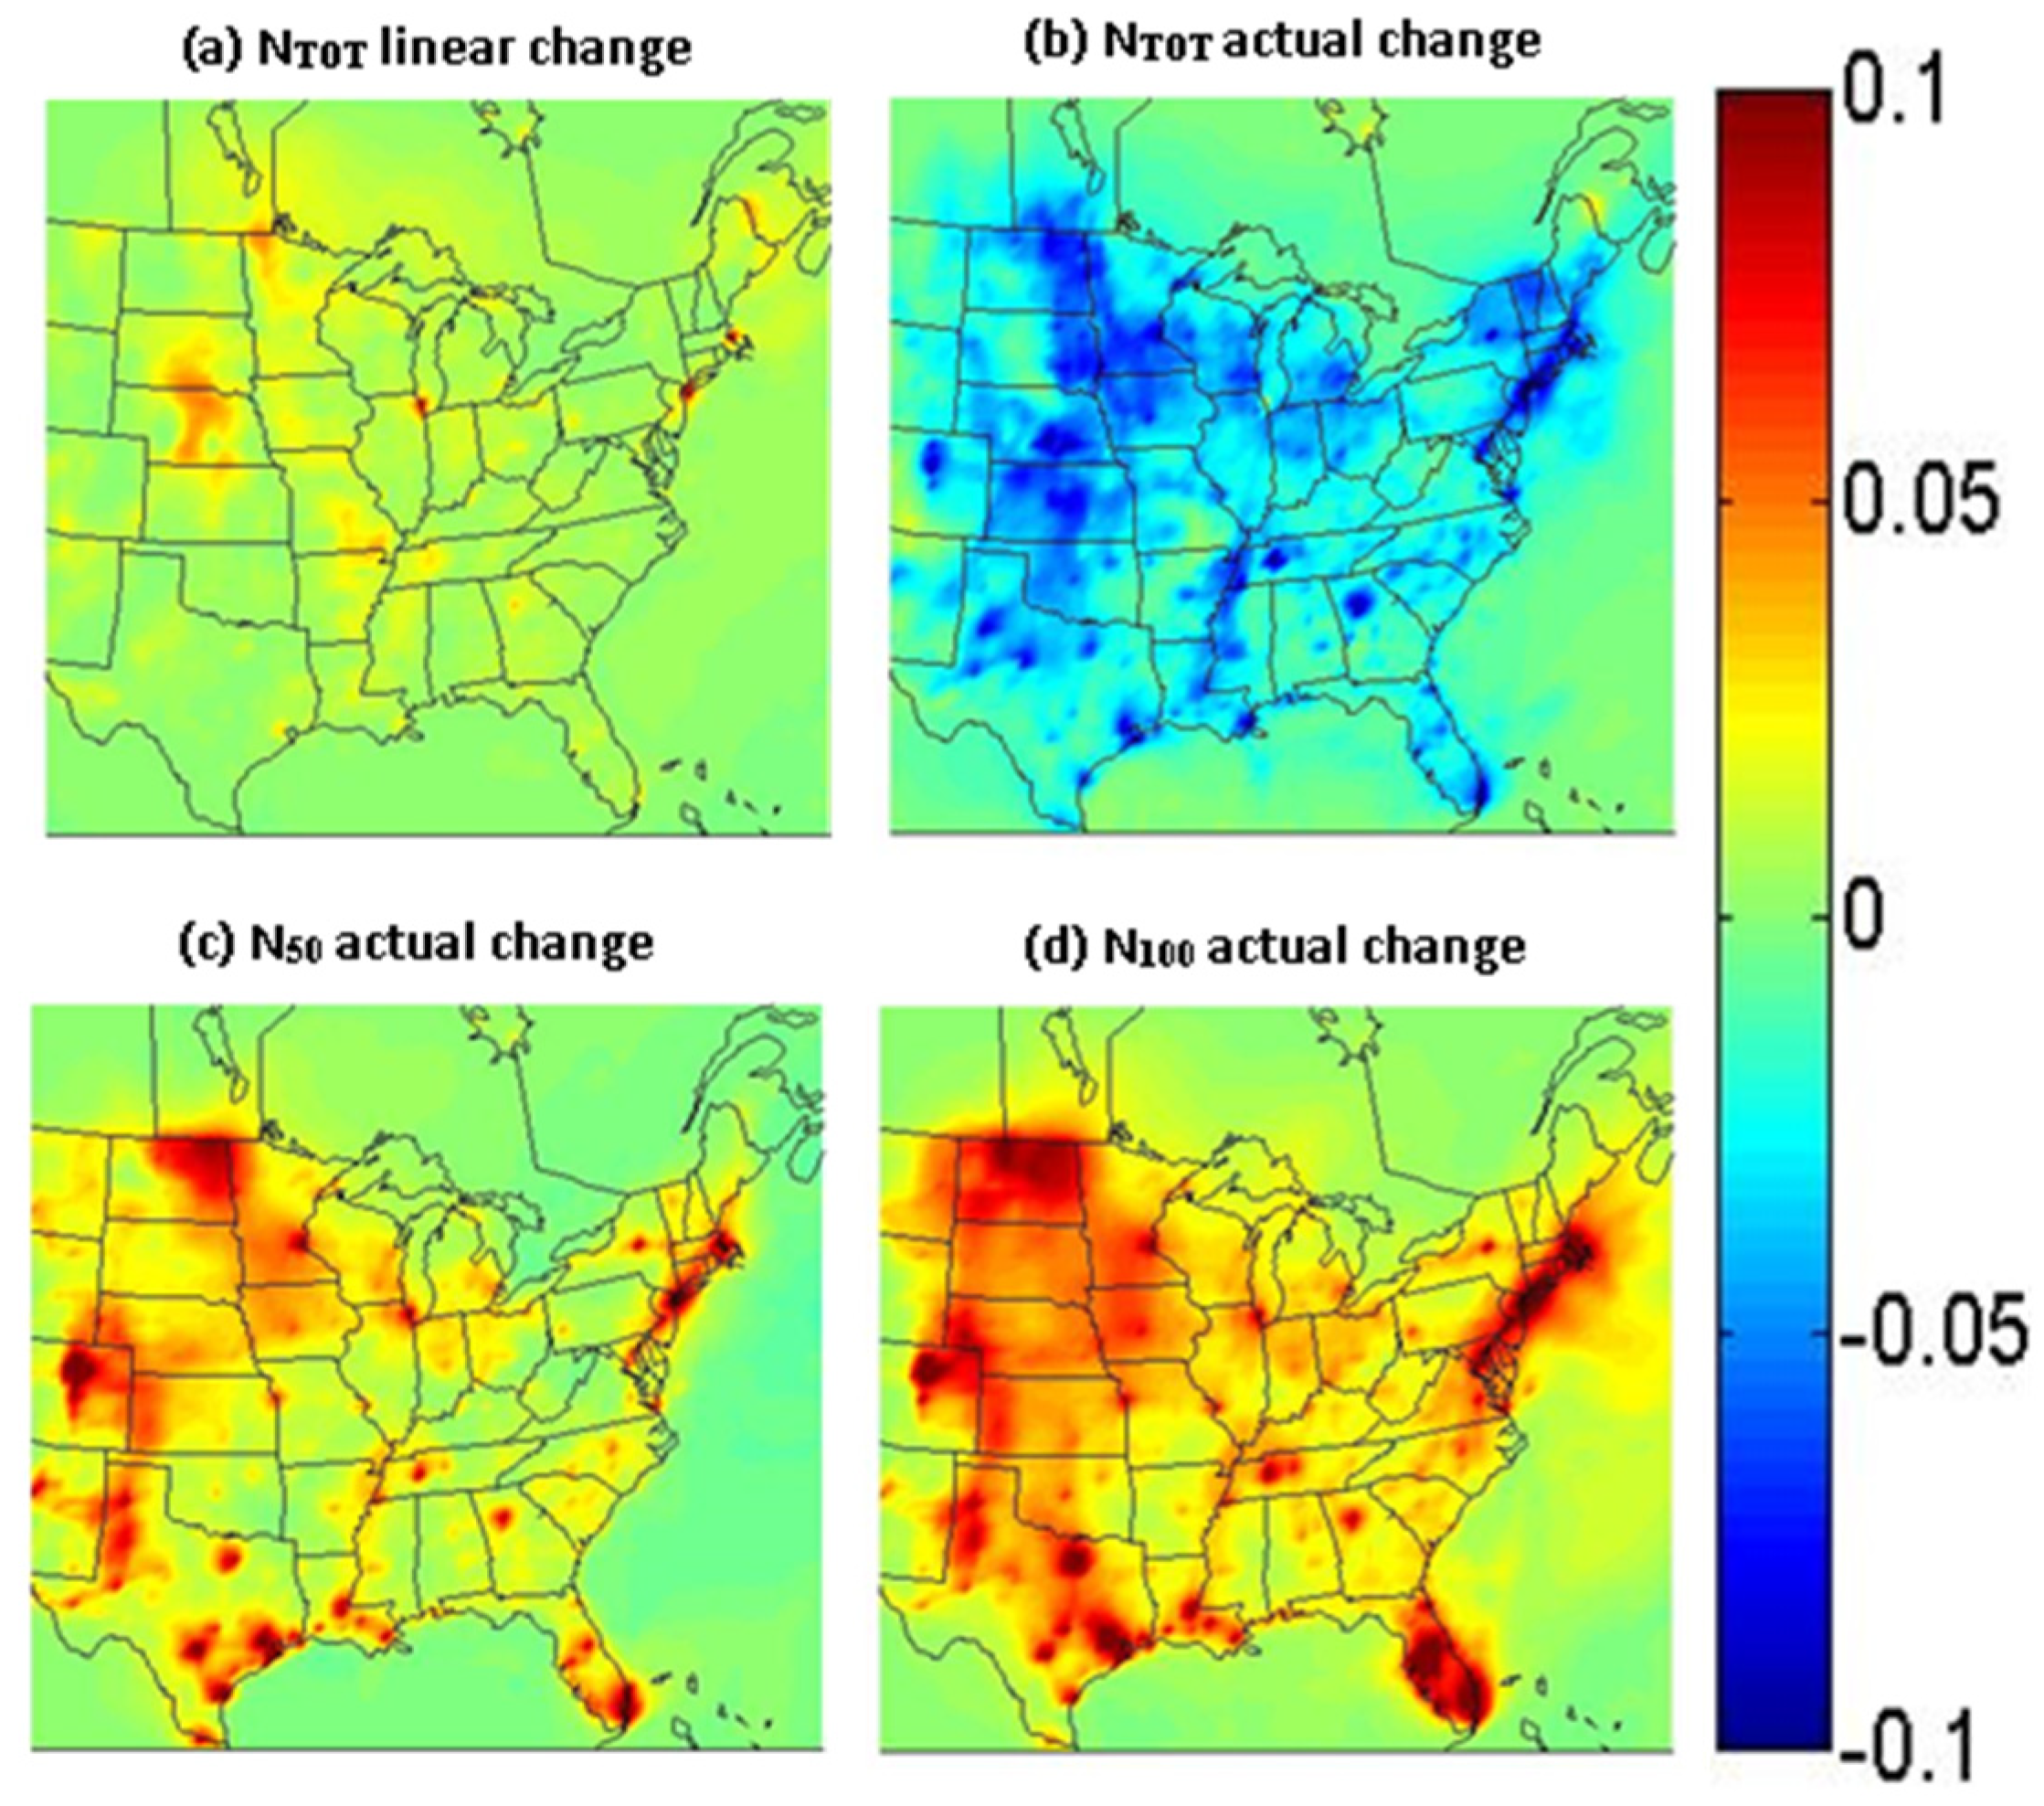
Reduction in the diesel PM emissions by 50% resulted in an increase in the total particle number concentrations on average by 1.6% due to a decrease in the coagulation and condensation sinks. At the same time, a 1.6% decrease in N100 particle concentrations was predicted. Both changes are significantly different from those expected, assuming a proportional change. The same scenario resulted in a 23% decrease in domain-averaged PM2.5 BC concentrations and similar changes both in magnitude and spatial pattern for the absorption coefficient (27–30%) and AAOD (28–32%). These results suggest that mitigation of large diesel particles and/or particle mass emissions reduces climate-relevant properties related to the absorption of black carbon and has health benefits; however, the changes can also have the unintended effect of increased ultrafine particle number concentrations. The changes in CCN will be significantly less than expected, assuming a proportional reduction during this photochemically active period.
The double-diesel simulation resulted in a domain-averaged 3% decrease in total particle number concentrations and a 3.3% increase in N100 concentrations. The domain-averaged PM2.5 BC concentration increased by 46%, and similar changes (52–60%) were predicted for the absorption coefficient. AAOD for the double-diesel perturbation increased by 28–32%. Extinction coefficients for both perturbation simulations changed by only a few percent due to the dominance of scattering aerosols in the Eastern U.S. These changes suggest that increased particle mass emissions from diesel sources increase climate-relevant effects related to black carbon and negatively affect health, but the changes may reduce ultrafine particle number concentrations. This reduction in ultrafine particle concentrations could, in return, reduce the negative health effects that ultrafine particles may have on human health [28].

Author Contributions

L.N.P. carried out the simulations and the analysis and wrote the first draft of the manuscript. S.N.P. supervised and coordinated the work and edited the manuscript. All authors have read and agreed to the published version of the manuscript.

Funding

This work was supported by the European Union’s Horizon Europe (2021–2027) research and innovation program under project EASVOLEE, grant agreement No. 101095457.

Institutional Review Board Statement

Not applicable.

Informed Consent Statement

Not applicable.

Data Availability Statement

The model results used in this study are available upon request ([email protected]). The data are not publicly available due to privacy.

Conflicts of Interest

The authors declare no conflicts of interest.

References

  1. Lelieveld, J.; Barlas, C.; Giannadaki, D.; Pozzer, A. Model calculated global, regional and megacity premature mortality due to air pollution. Atmos. Chem. Phys. 2013, 13, 7023–7037. [Google Scholar] [CrossRef]
  2. IPCC. Climate change 2013: The physical science basis. In Contribution of Working Group I to the Fifth Assessment Report of the Intergovernmental Panel on Climate Change; Cambridge University Press: New York, NY, USA, 2013. [Google Scholar]
  3. U.S. EPA. Integrated Science Assessment for Particulate Matter (Final Report); Report prepared by the U.S. Environmental Protection Agency; EPA/600/R-08/139F; U.S. Environmental Protection Agency: Washington, DC, USA, 2009.
  4. Bond, T.C.; Doherty, S.J.; Fahey, D.W.; Forster, P.M.; Bernsten, T.; DeAngelo, B.J.; Flanner, M.G.; Ghan, S.; Kärcher, B.; Koch, D.; et al. Bounding the role of black carbon in the climate system: A scientific assessment. J. Geophys. Res. 2013, 118, 5380–5552. [Google Scholar] [CrossRef]
  5. Janssen, N.A.; Gerlofs-Nijland, M.E.; Lanki, T.; Salonen, R.O.; Cassee, F.; Hoek, G.; Fischer, P.; Brunekreef, B.; Krzyzanowski, M. Health Effects of Black Carbon; 2012 Report prepared by the World Health Organization; World Health Organization: Copenhagen, Denmark, 2012. [Google Scholar]
  6. Herner, J.D.; Hu, S.; Robertson, W.H.; Huai, T.; Chang, M.-C.O.; Rieger, P.; Ayala, A. Effect of advanced aftertreatment for PM and NOx reduction on heavy-duty diesel engine ultrafine particle emissions. Environ. Sci. Technol. 2011, 45, 2413–2419. [Google Scholar] [CrossRef]
  7. Ban-Weiss, G.A.; McLaughlin, J.P.; Harley, R.A.; Lunden, M.M.; Kirchstetter, T.W.; Kean, A.J.; Strawa, A.W.; Stevenson, E.D.; Kendall, G.R. Long-term changes in emissions of nitrogen oxides and particulate matter from on-road gasoline and diesel vehicles. Atmos. Environ. 2008, 42, 220–232. [Google Scholar] [CrossRef]
  8. Schmidt, C.W. Black carbon: The dark horse of climate change drivers. Environ. Health Perspect. 2011, 119, A172–A175. [Google Scholar] [CrossRef]
  9. Dallmann, T.R.; Harley, R.A.; Kirchstetter, T.W. Effects of diesel particle filter retrofits and accelerated fleet turnover on drayage truck emissions at the Port of Oakland. Environ. Sci. Technol. 2011, 45, 10773–10779. [Google Scholar] [CrossRef]
  10. Kozawa, K.H.; Park, S.S.; Mara, S.L.; Herner, J.D. Verifying emission reductions from heavy-duty diesel trucks operating on Southern California freeways. Environ. Sci. Technol. 2014, 48, 1475–1483. [Google Scholar] [CrossRef]
  11. California Air Resources Board (CARB). Drayage Truck Regulation. Sacramento, CA. 2010. Available online: https://ww2.arb.ca.gov/sites/default/files/classic/msprog/onroad/porttruck/finalregdrayage.pdf (accessed on 2 February 2024).
  12. Bauer, S.E.; Menon, S.; Koch, D.; Bond, T.C.; Tsigaridis, K. A global modeling study on carbonaceous aerosol microphysical characteristics and radiative effects. Atmos. Chem. Phys. 2010, 10, 7439–7456. [Google Scholar] [CrossRef]
  13. Chen, W.-T.; Lee, Y.H.; Adams, P.J.; Nenes, A.; Seinfeld, J.H. Will black carbon mitigation dampen aerosol indirect forcing? Geophys. Res. Lett. 2010, 37, L09801. [Google Scholar] [CrossRef]
  14. Shindell, D.; Kuylenstierna, J.C.I.; Vignati, E.; van Dingenen, R.; Amann, M.; Kilimont, Z.; Ananeberg, S.C.; Muller, N.; Janssens-Maenhout, G.; Raes, F.; et al. Simultaneously mitigating near-term climate change and improving human health and food security. Science 2012, 335, 183–189. [Google Scholar] [CrossRef]
  15. Stolzenburg, D.; Cai, R.; Blichner, S.M.; Kontkanen, J.; Zhou, P.; Makkonen, R.; Kerminen, V.M.; Kulmala, M.; Riipinen, I.; Kangasluoma, J. Atmospheric nanoparticle growth. Rev. Mod. Phys. 2023, 95, 045002. [Google Scholar] [CrossRef]
  16. Harrison, R.M. Airborne particulate matter. Philos. Trans. Royal Soc. A 2020, 378, 20190319. [Google Scholar] [CrossRef] [PubMed]
  17. Rivas, I.; Beddows, D.C.S.; Amato, F.; Green, D.C.; Jarvi, L.; Hueglin, C.; Reche, C.; Timonen, H.; Fuller, G.W.; Niemi, J.V.; et al. Source apportionment of particle number size distribution in urban background and traffic stations in four European cities. Environ. Intern. 2020, 135, 105345. [Google Scholar] [CrossRef] [PubMed]
  18. Jung, J.; Fountoukis, C.; Adams, P.J.; Pandis, S.N. Simulation of in situ ultrafine particle formation in the eastern United States using PMCAMx-UF. J. Geophys. Res. 2010, 115, D03203. [Google Scholar] [CrossRef]
  19. Napari, I.; Noppel, M.; Vehkamäki, H.; Kulmala, M. Parameterization of ternary nucleation rates for H2SO4-NH3-H2O vapors. J. Geophys. Res. 2002, 107, 4381–4386. [Google Scholar]
  20. Vehkamäki, H.; Kulmala, M.; Napari, I.; Lehtinen, K.E.J.; Timmreck, C.; Noppel, M.; Laaksonen, A. An improved parameterization for sulfuric acid–water nucleation rates for tropospheric and stratospheric conditions. J. Geophys. Res. 2002, 107, 4622–4632. [Google Scholar] [CrossRef]
  21. Posner, L.N.; Pandis, S.N. Sources of ultrafine particles in the Eastern United States. Atmos. Environ. 2015, 111, 103–112. [Google Scholar] [CrossRef]
  22. Lane, T.E.; Pinder, R.W.; Shrivastava, M.; Robinson, A.L.; Pandis, S.N. Source contributions to primary organic aerosol: Comparison of the results of a source-resolved model and the chemical mass balance approach. Atmos. Environ. 2007, 41, 3758–3776. [Google Scholar] [CrossRef]
  23. U.S. EPA. User Guide: Air Quality System; Report prepared by the U.S. Environmental Protection Agency; U.S. Environmental Protection Agency: Research Triangle Park, NC, USA, 2002.
  24. Murphy, B.N.; Pandis, S.N. Exploring summertime organic aerosol formation in the Eastern United States using a regional-scale budget approach and ambient measurements. J. Geophys. Res. 2010, 115, D24216. [Google Scholar] [CrossRef]
  25. Pierce, J.R.; Adams, P.J. Uncertainty in global CCN concentrations from uncertain aerosol nucleation and primary emission rates. Atmos. Chem. Phys. 2009, 9, 1339–1356. [Google Scholar] [CrossRef]
  26. Bohren, C.F.; Huffman, D.R. Absorption and Scattering of Light by Small Particles; Wiley: New York, NY, USA, 1998. [Google Scholar]
  27. Bond, T.C.; Bergstrom, R.W. Light absorption by carbonaceous particles: An investigative review. Aerosol Sci. Technol. 2006, 40, 27–67. [Google Scholar] [CrossRef]
  28. Bergmann, M.L.; Andersen, Z.J.; Massling, A.; Kindler, P.A.; Loft, S.; Amini, H.; Cole-Hunter, T.; Guo, Y.; Maric, M.; Nordstrøm, C.; et al. Short-term exposure to ultrafine particles and mortality and hospital admissions due to respiratory and cardiovascular diseases in Copenhagen, Denmark. Environ. Pollut. 2023, 336, 122396. [Google Scholar] [CrossRef] [PubMed]
Figure 1. PM2.5 BC emission rates (kg km−2 d−1) from (a) diesel sources, (b) all sources, and (c) the fractional contribution to PM2.5 emissions of diesel sources for the base simulation.
Atmosphere 15 00199 g001
Figure 2. Total particle number (NTOT) emission rates (particles km−2 d−1) from (a) diesel sources, (b) all sources, and (c) the fractional contribution of diesel sources to total particle number for the base simulation.
Atmosphere 15 00199 g002
Figure 3. Predicted simulation-averaged concentrations of PM2.5 BC (μg m−3) at the ground level for the base case.
Atmosphere 15 00199 g003
Figure 4. Predicted (a) absolute and (b) fractional changes in PM2.5 BC (μg m−3) at the ground level for the half-diesel simulation.
Atmosphere 15 00199 g004
Figure 5. Predicted (a) absolute and (b) fractional changes in PM2.5 black carbon concentrations (μg m−3) at the ground level for the double-diesel simulation.
Atmosphere 15 00199 g005
Figure 6. Predicted concentrations of (a) total particle number (cm−3), (b) the number of particles greater than 50 nm in diameter (cm−3), and (c) the number of particles greater than 100 nm in diameter (cm−3) at the ground level for the base case.
Atmosphere 15 00199 g006
Figure 7. Predicted (a) absolute (cm−3) and (b) fractional contributions of diesel sources to total particle number concentrations (cm−3) at the ground level for the base case.
Atmosphere 15 00199 g007
Figure 8. Predicted fractional changes in total particle number concentrations (cm−3) at the ground level due to a 50% reduction in the base diesel particulate emissions calculated (a) assuming a linear change based on previous source apportionment results and (b) by the half-diesel simulation and actual fractional changes in (c) N50 and (d) N100 determined by the half-diesel simulation.
Atmosphere 15 00199 g008
Figure 9. Predicted fractional changes in NTOT at the ground level due to doubling the diesel particulate emissions calculated (a) assuming a linear change based on previous source apportionment results and (b) by the double-diesel simulation and (c) actual changes in N50 (d) actual changes in N100.
Atmosphere 15 00199 g009
Figure 10. Predicted (a) absorptionO coefficients (Mm−1), (b) extinction coefficients (Mm−1), and (c) absorption aerosol optical depth (AAOD) for the base simulation.
Atmosphere 15 00199 g010
Figure 11. Predicted fractional changes in the (a) absorption coefficient, (b) extinction coefficient, and (c) absorption aerosol optical depth (AAOD) for the half-diesel simulation.
Atmosphere 15 00199 g011
Figure 12. Predicted fractional changes in the (a) absorption coefficient, (b) extinction coefficient, and (c) absorption aerosol optical depth (AAOD) for the double-diesel emissions.
Atmosphere 15 00199 g012
Disclaimer/Publisher’s Note: The statements, opinions and data contained in all publications are solely those of the individual author(s) and contributor(s) and not of MDPI and/or the editor(s). MDPI and/or the editor(s) disclaim responsibility for any injury to people or property resulting from any ideas, methods, instructions or products referred to in the content.

