Article

Long-Term Trends of Extreme Climate Indexes in the Southern Part of Siberia in Comparison with Those of Surrounding Regions

by
Takanori Watanabe
1,*,
Hiroshi Matsuyama
1,
Irina Kuzhevskaia
2,
Olga Nechepurenko
2,3,
Vladislav Chursin
2 and
Valerii Zemtsov
4
1
Department of Geography, Tokyo Metropolitan University, 1-1, Minami-Osawa, Hachioji 192-0397, Tokyo, Japan
2
Department of Meteorology and Climatology, National Research Tomsk State University, 36 Lenin Ave., Tomsk 634050, Russia
3
Institute of Monitoring of Climatic and Ecological Systems (IMCES) SB RAS, 10/3 Academichesky Ave., Tomsk 634055, Russia
4
Department of Hydrology, National Research Tomsk State University, 36 Lenin Ave., Tomsk 634050, Russia
*
Author to whom correspondence should be addressed.
Atmosphere 2023, 14(7), 1131; https://doi.org/10.3390/atmos14071131
Submission received: 22 May 2023 / Revised: 27 June 2023 / Accepted: 5 July 2023 / Published: 8 July 2023
(This article belongs to the Special Issue Extreme Weather Events in Siberia)

Abstract

:
Siberia, which experienced disastrous heat waves in 2010 and 2012, is one of the regions in which extreme climate events have occurred recently. To compare the long-term trends of extreme climate events in the southern part of Siberia with those of surrounding regions, we calculated 11 extreme climate indexes from observational data for 1950–2019 and analyzed the trends in Siberia and other parts of Russia using statistical techniques, i.e., Welch’s t-test, the Mann–Kendall test, Sen’s slope estimator, and a cluster analysis. We clarified that high-temperature events in March are more frequent in Siberia than in the surrounding areas. However, the increasing trends of high temperatures in Siberia were lower than those in northwestern China and Central Asia. The intensity of heavy precipitation is increasing in Siberia, as it is in the surrounding areas. Compared to the surrounding areas analyzed in previous studies, the trend of heavy precipitation in Siberia has not increased much. In particular, Siberia shows a more remarkable decreasing trend in heavy precipitation during the summer than other regions. The dry trends in the summer, however, do not occur in Siberia as a whole, and the opposite trend of summer precipitation was observed in some areas of Siberia.

1. Introduction

1.1. Background

Global warming has received considerable attention because it increases not only air temperature but also the number of extreme events. These include heat waves, droughts, heavy precipitation, disastrous tropical cyclones, floods, and storm surges. These events not only lead to increases in mortality and morbidity associated with natural disasters but also affect the economy, infrastructure, and ecosystem services [1]. The frequency of abnormally high temperatures has increased, whereas the frequency of abnormally low temperatures has decreased since 1980 in many parts of the world [2]. In addition, the frequency of extreme events is significantly different from their frequency before 1979 [3], which is consistent with a previous study [2]. However, regional differences exist in the trends of extreme events; therefore, it is important to investigate their regionalities.
Among the extreme events that have occurred around the world in recent years, one famous example is the Russian heat wave of 2010 [4,5]. This event was caused by a prolonged anticyclonic circulation centered over European Russia, which was generated by quasi-stationary Rossby waves caused by very high sea surface temperatures in the Indian and Atlantic Oceans [6]. At the same time, the absence of evaporative cooling owing to soil dryness caused by a persistent clear sky also intensified the heat wave [5]. After that, Siberia also experienced a severe drought in 2012 [7,8] and catastrophic flooding caused by heavy rainfall in 2014 [9] and 2019 [10]. In the future, extreme events are expected to continue to occur in this region.

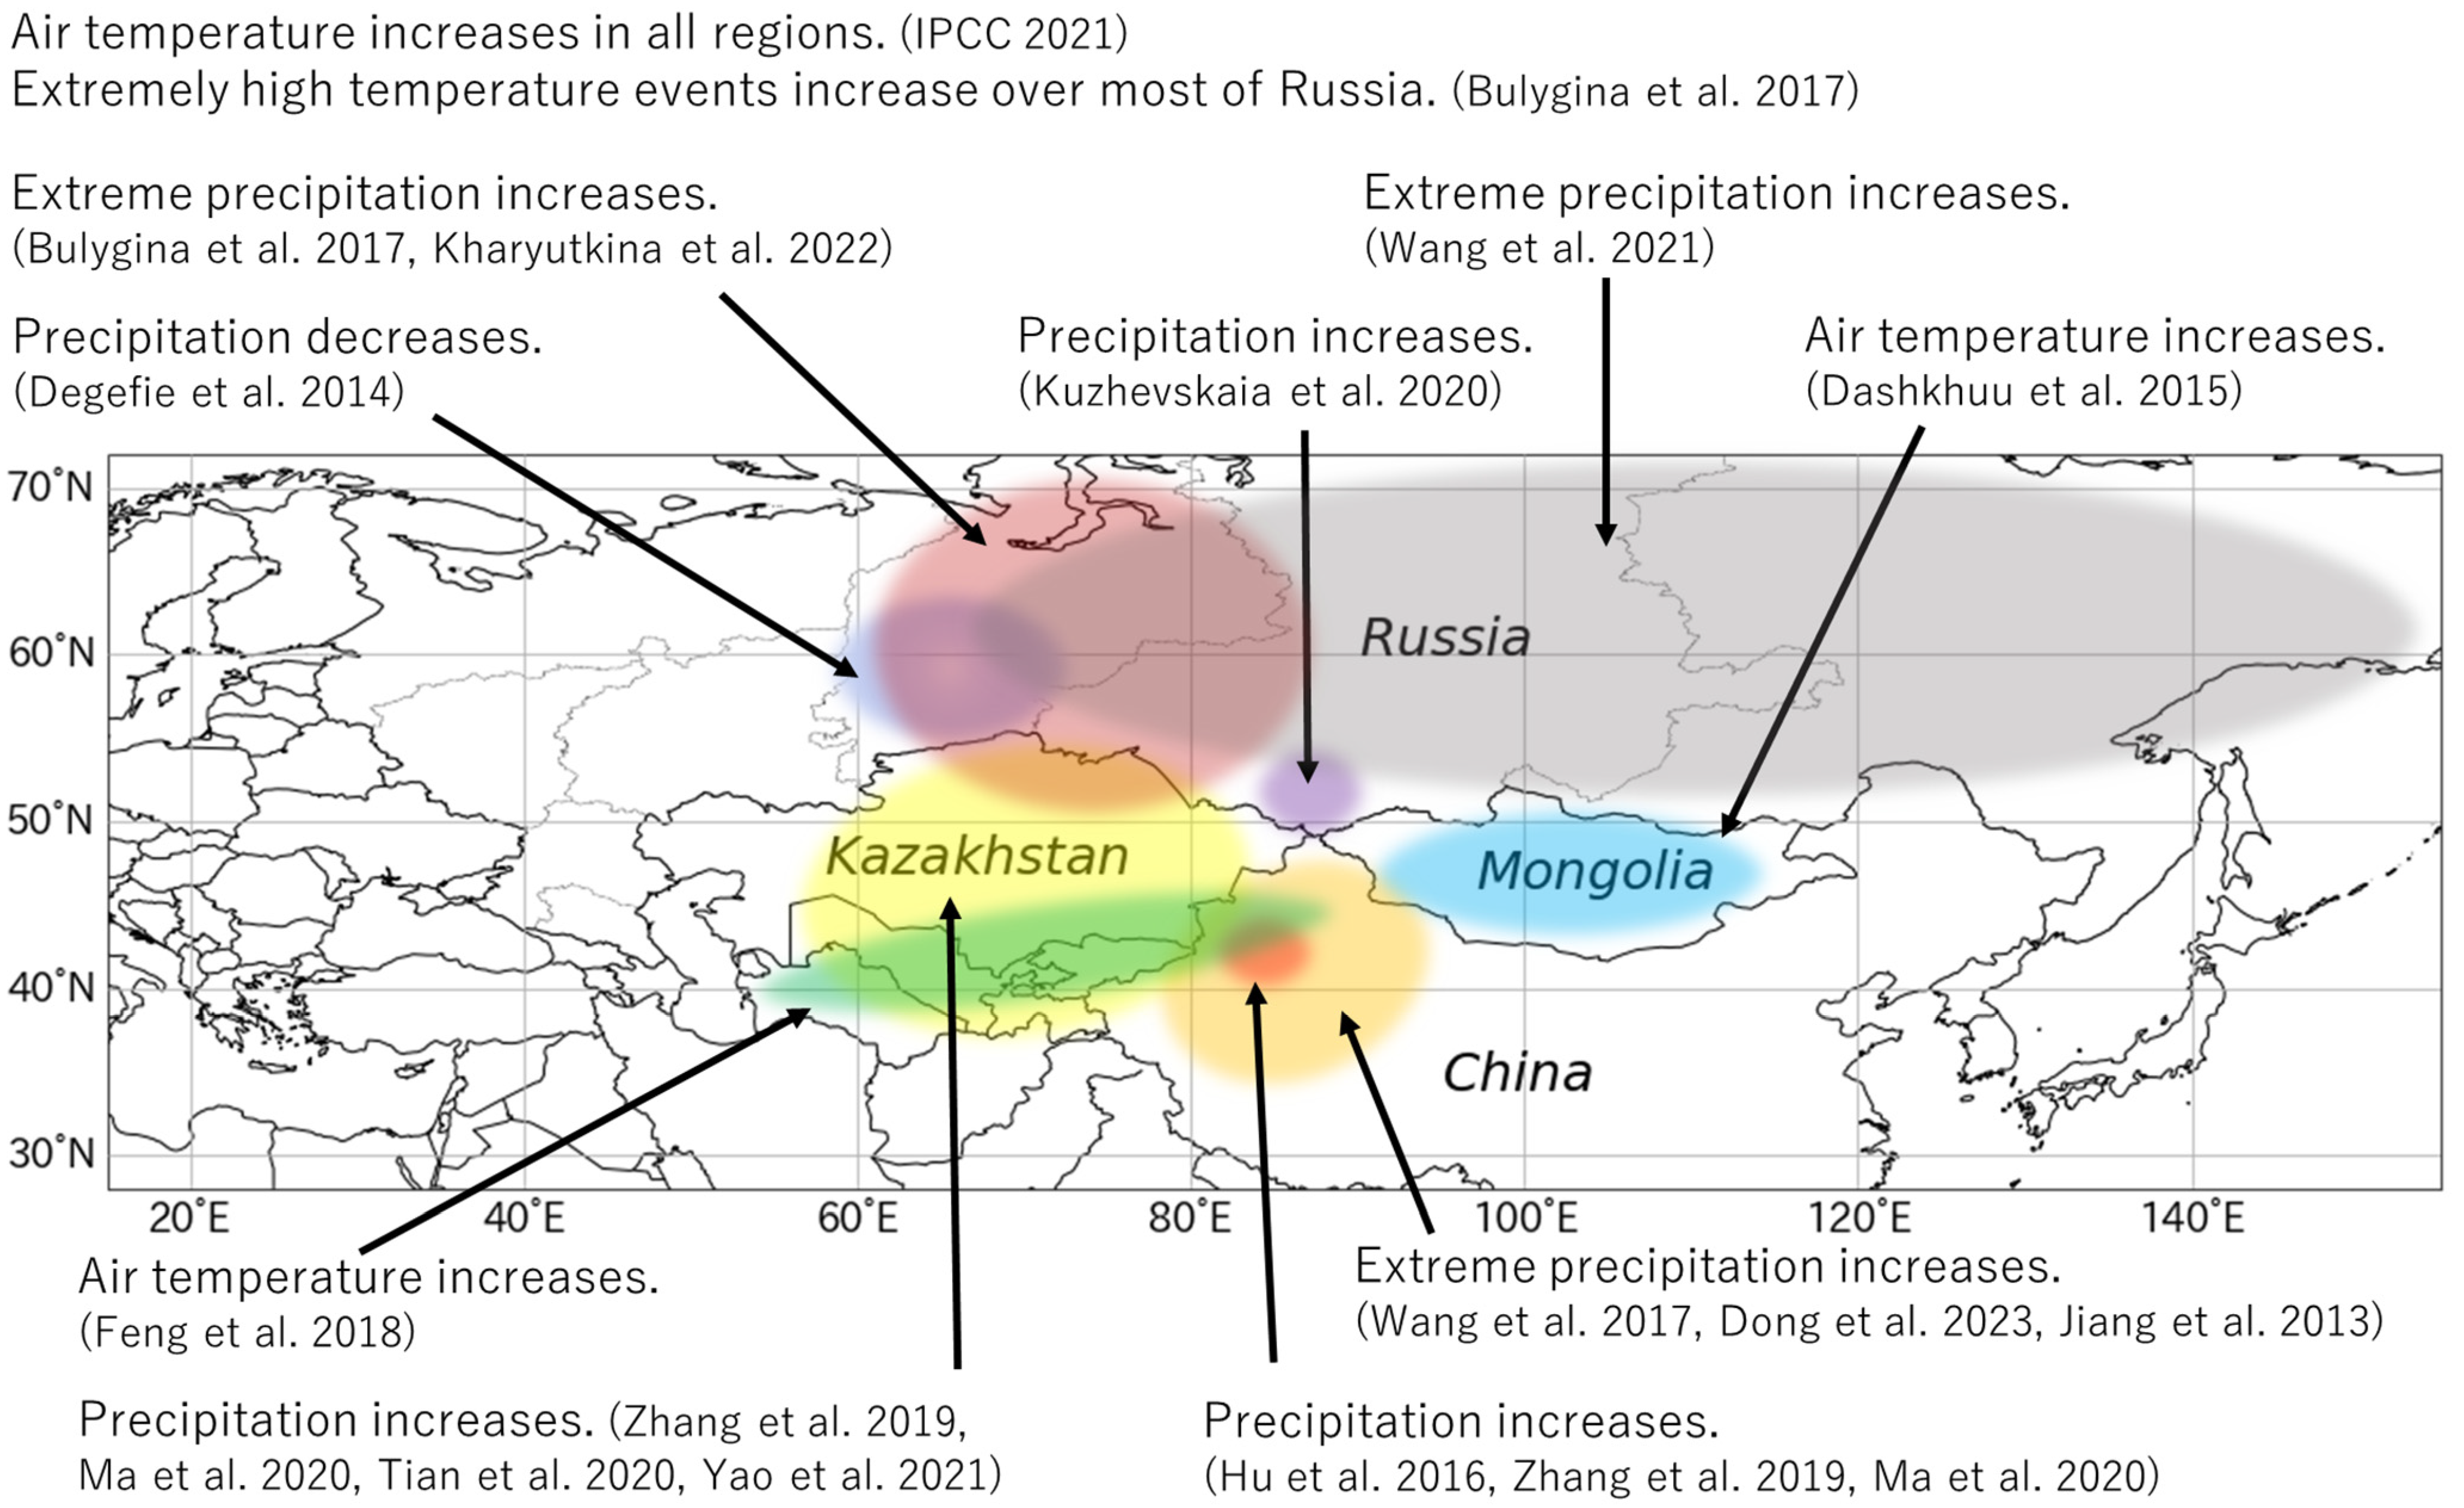
1.2. Literature Review

Figure 1 shows the trend in the occurrence of extreme events around the southern part of Siberia, which this study defined as the region located to the south of 60° N in Siberia, the Ural district in Russia, and neighboring regions. Extreme events related to high temperatures are increasing everywhere. Precipitation extremes are also increasing in many regions but are decreasing only in southwestern Siberia (60–85° E and 50–65° N) [11]. The previous study [11] used data from 26 sites from 1969 to 2011 and calculated 10 extreme climate indexes which were used to evaluate temperature and precipitation extremes [12] (see Section 2). In this region, extreme climate indexes for precipitation averaged over the entire region are decreasing. However, the numbers of sites showing increasing and decreasing trends in heavy rainfall events are comparable. Moreover, only a few sites show statistically significant trends.
Seasonal trends of extreme events in Siberia were also investigated. For example, the number of days with abnormally high temperatures in spring increased at a rate of 0.5–2 days/decade between 1951 and 2006 in the southern part of Western Siberia [13]. This upward trend in Siberia was noted to be as large as that in central European Russia. At the same time, an increase in the number of days of extreme precipitation in spring was also noted [13]. Comparing 95th percentile precipitation in 1979–2020 and 2011–2020, an increase in the amount of extreme precipitation in Western Siberia during summer was noted [14]. Moreover, the monthly climatic extremes during the period 1950–2018 in the Altai Mountains were also investigated [15]. This study found that changes in extreme temperatures are apparent and mostly stronger at night than during the day [15]. April and September have high probabilities of both dry and wet months, with April having the most unstable precipitation regime [15]. Changes in air temperature and precipitation in spring simultaneously cause earlier snowmelt [27,28] and dangerous floods in Western Siberia [29].
Regarding the trends of extreme events in the surrounding regions of Siberia, the frequency of high-temperature events across Russia increased significantly in winter and spring. Trends in heavy rainfall events were slightly increasing, with large regional differences. [13,16].
A warming trend was observed for the average temperature and high-temperature extremes [17,18] in northwestern China. The air temperature in the Tian Shan Mountains (northwestern China) is steadily increasing [19]. Similarly, Mongolia is experiencing an increase in air temperature throughout the region, and the frequency of high-temperature-related extreme events is increasing [20].
Heavy precipitation extremes showed significant increases in northwestern China [17,18]. The frequency and intensity of precipitation have strengthened at more than 70% of the stations in Uyghur (northwestern China) [21]. Winter precipitation in this region significantly increased, whereas spring precipitation decreased [19]. In particular, this strengthening is apparent in the northern region [21]. In the middle of the 1980s, climate shifts occurred in this region, resulting in a warm and wet tendency of the climate [19,22,23].
The air temperature in Central Asia, including Kazakhstan, Uzbekistan, Kyrgyzstan, Tajikistan, and Turkmenistan, is significantly increasing, especially in spring and autumn [24]. The frequency of high temperatures significantly increased from Turkmenistan to the Tian Shan Mountains [24]. In addition, the increase in air temperature in Central Asia is larger than the average of the increases in the global and northern hemisphere [22].
Annual precipitation also shows an increasing trend in Central Asia [22,25]. The amount of precipitation and the extreme precipitation index in the summer show significant increases and abrupt changes around 1998 in this region [23]. The increase in precipitation is linked to the transport of water vapor from the south [26]. Because the increase in air temperature is correlated with the extreme rainfall index, heavy rainfall in this region will intensify owing to global warming [26].

1.3. Problems of Previous Studies and Objective of This Study

The southern part of Siberia is adjacent to many regions with different climatic characteristics, each of which was evaluated for extreme events in different studies [11,13,14,15,16,17,18,19,20,21,22,23,24,25,26] (Figure 1). However, because each study analyzed only a single region, a comprehensive analysis of the entire area is insufficient. Therefore, it is necessary to clarify differences in the long-term variabilities of the climatic extremes in the southern part of Siberia compared with all of Russia and the neighboring regions.
The studies for Siberia [11] are analyzed based on annual or seasonal data; however, precipitation varies even within a season, as has been indicated [13]. The spatial distributions of trends in extreme climate indexes for Russia as a whole were also presented [13]; however, the descriptive statistics of the trends, which are required for a comparison with other regions, have not been computed. By analyzing seasonal trends statistically, it is possible to deeply understand the characteristics of extreme events in Siberia in comparison with those of annual data [11].
In several studies showing the spatial distribution of trends in extreme climate indexes in Siberia [11,13], there are variations in the trends from station to station, especially with respect to precipitation. For example, a previous study [11] showed that there were equal numbers of sites with increasing and decreasing trends in heavy rainfall events even in the interior of southwestern Siberia. This feature suggests that sites with similar climatic characteristics were located adjacent to each other. In fact, regional differences, with the south becoming drier and warmer while the north becomes wetter and cooler, have been highlighted [11]. Regional differences in trends in the interior of Siberia should be considered when understanding the climatic extremes of Siberia.
The main aim of this study is to elucidate differences in the long-term trends of extreme climate events in the southern part of Siberia in comparison with those of surrounding regions. Since it has been noted that trends in extreme climate events vary seasonally, this study analyzes seasonal trends that have not been examined in previous studies [11], in addition to conducting an analysis of annual trends. A cluster analysis of spatial patterns in extreme climate events in the interior of Siberia is also conducted based on monthly trends of extreme events to clarify regional differences in the climatic characteristics of extreme events. Of course, it is important to analyze the relationship between variations in climatic extremes and the atmospheric circulation field. However, this is beyond the scope of this study. First, this study focuses on describing variations in actually occurring climatic extremes.

2. Materials and Methods
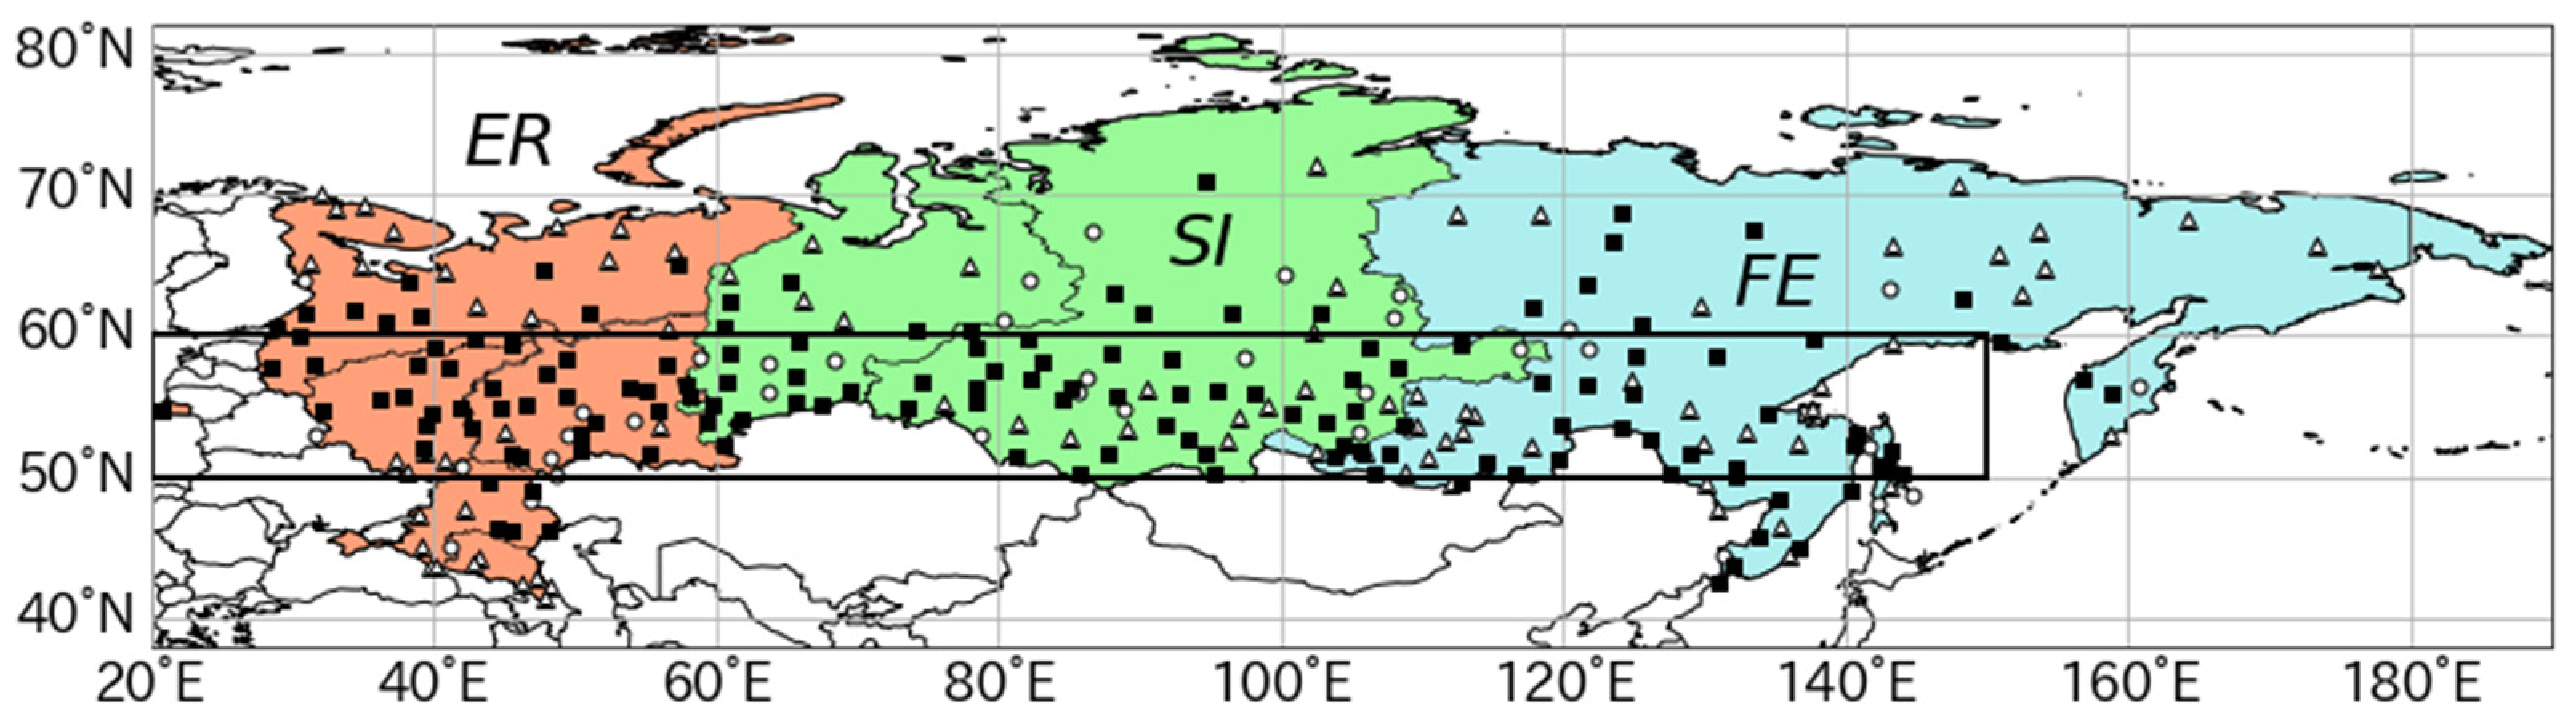
2.1. Data

Meteorological data from 527 weather stations covering Russia are available [30]. The mean, minimum, and maximum daily air temperatures and daily precipitation measurements were used in this study. Because the measurement period varied from station to station, data from 1950 onward were used; most stations began their observations during this period.
Quality control was carried out for the dataset because it contained missing values, outliers, and inhomogeneity resulting from the relocation or replacement of observation equipment and changes in the observation environment. Initially, this study excluded observed stations that contained 5% or more missing values for the period 1950–2019, which was the threshold for missing values [31]. Since the missing periods for air temperature and precipitation differed, we calculated the missing ratio for each item and selected the data for the analysis. After this procedure, a homogeneity test of the dataset was performed using the R-based software RHTest Version 4 [32,33,34]. The test was recommended by the joint CCl/CLIVAR/JCOMM Expert Team (ET) on Climate Change Detection and Indexes (ETCCDI). This study used observed data without significant inhomogeneities in temperature and precipitation.
Figure 2 shows the locations of these meteorological stations. Only observed data from stations located in southern Russia (20–150° E, 50–60° N) were used in this study because the number of stations in northern Russia is small and they are sparsely distributed. As a result, 128 stations were available for air temperature, and 142 stations were available for precipitation. To compare the frequencies and trends of extreme events in Siberia versus all of Russia, the observed data were classified into three regions based on federal districts in Russia: European Russia (the Central, Northwestern, Southern, North Caucasian, and Volga federal districts), Siberia (the Siberian and Ural federal districts), and the Far East (the Far Eastern Federal District), which are abbreviated as ER, SI, and FE, respectively (Figure 2). Since the boundaries of Siberia are not clearly defined, this study considered the Siberian region based on traditional administrative divisions. This study also described the climate of the interior of Siberia, which is enclosed by a thick rectangle (Figure 2). This is based on a cluster analysis of extreme climate events from a different perspective of administrative divisions.

2.2. Methods

To evaluate extreme climate events in Russia, especially in SI, this study focused on 27 extreme climate indexes [12] which contain 16 temperature-related indexes and 11 precipitation-related indexes. These indexes were computed using the R-based software RClimDex Version 1.9, which was developed by ETCCDI. All indexes were calculated as annual values, and 11 indexes were calculated as monthly values. Six temperature-related (TX90P, TN90P, TX10P, TN10P, WSDI, and CSDI) and five precipitation-related indexes (CDD, CWD, RX5day, R95P, and PRCPTOT) considered suitable for the analysis of the study area were used (Table 1). The extreme indexes contain several relative indexes: TX10P, TN10P, TX90P, TN90P, and R95P, which represent the percentage of days that air temperature or precipitation were above (or below) the threshold; these values are the Nth percentile values of the time-series data in the base period (1961–1990).
Welch’s t-test [35] was used to investigate the differences in the extreme indexes between SI and other regions. This is a test for the location between two populations and is mainly used to detect differences in means. Furthermore, it does not assume that the two populations have equal variances. The null hypothesis H0 was that there was no difference in the mean between the two populations, and the alternative hypothesis H1 was that there was a difference in the mean between the two populations. The statistic t in Welch’s t-test was computed as follows:
t = x ¯ 1 x ¯ 2 s 1 2 n 1 + s 2 2 n 2 ,
where x ¯ 1 and x ¯ 2 are the means of each sample; n1 and n2 are the sample sizes; and s 1 2 and s 2 2 are the unbiased estimates of the variances of each sample.
In this study, the Mann–Kendall test [36,37] and Sen’s slope estimator [38] were used for 11 indexes to elucidate trends in the occurrences of climatic extremes in SI and throughout Russia. The Mann–Kendall test is a nonparametric method for identifying whether a significant trend in time-series data is present [36,37]. In a Mann–Kendall test, the null hypothesis H0 is that there is no trend, and the alternative hypothesis H1 is that there is an upward or downward trend. The statistic S in a Mann–Kendall test is obtained as follows:
S = k = 1 n 1 j = k + 1 n s g n X j X k .
Xj and Xk denote the annual values in years j and k, respectively; however, k is less than j, and
s g n X j X k = 1 X j X k > 0 0 X j X k = 0 1 X j X k < 0 .
After calculating the statistic S, the standard statistic Z was computed as follows:
Z = S 1 V a r S 1 / 2 S > 0 0 S = 0 , S 1 V a r S 1 / 2 S < 0
where Var(S) is the variance of the statistic S. If the significance level is α, the hypothesis H0 was adopted if the standard normal variable Z satisfied |Z| ≤ Zα/2 (except Φ(Zα/2) = α/2, Φ(*): standard normal distribution). In addition, the time series exhibited an upward/downward trend when S was more/less than zero.
The trends in the extreme indexes were calculated using Sen’s slope estimator [38] because the least-squares method, which is commonly used to estimate a trend, tends to be affected by outliers. Sen’s slope estimator estimates the median of the slopes of all possible pairs, which makes it possible to robustly calculate a linear trend. In this method, the slope of the time series was estimated as follows:
X i j = Y j Y i t j t i
where Xij is the slope between the two points (ti, Yi) and (tj, Yj), where titj. After calculating Xij for all pairs, the median of the total number N of Xij was computed as follows:
X = X N + 1 / 2 i f   N   i s   o d d 1 2 X N / 2 + X N + 2 / 2 i f   N   i s   e v e n .
The trend increases/decreases when X is positive/negative.
A cluster analysis was performed to identify climatic differences based on trends in extreme events in the interior of Siberia. This study focused on the characteristics of trends in extreme events by season and used TX90P and TX10P, which represent high- and low-temperature events, respectively, in addition to RX5DAY, which represents precipitation events, as input data in the cluster analysis. Ward’s method [39], which is a hierarchical clustering method, was used for data agglomeration. This method considers each data set as a cluster and reduces the number of clusters by merging pairs of clusters closest to each other. The normalized Euclidean distance was used as the distance measure. The optimal number of clusters was subjectively determined from the dendrogram.
The above statistical analyses, i.e., Welch’s t-test, the Mann–Kendall test, Sen’s slope estimator, and the cluster analysis, were all carried out using Python 3.7.

3. Results

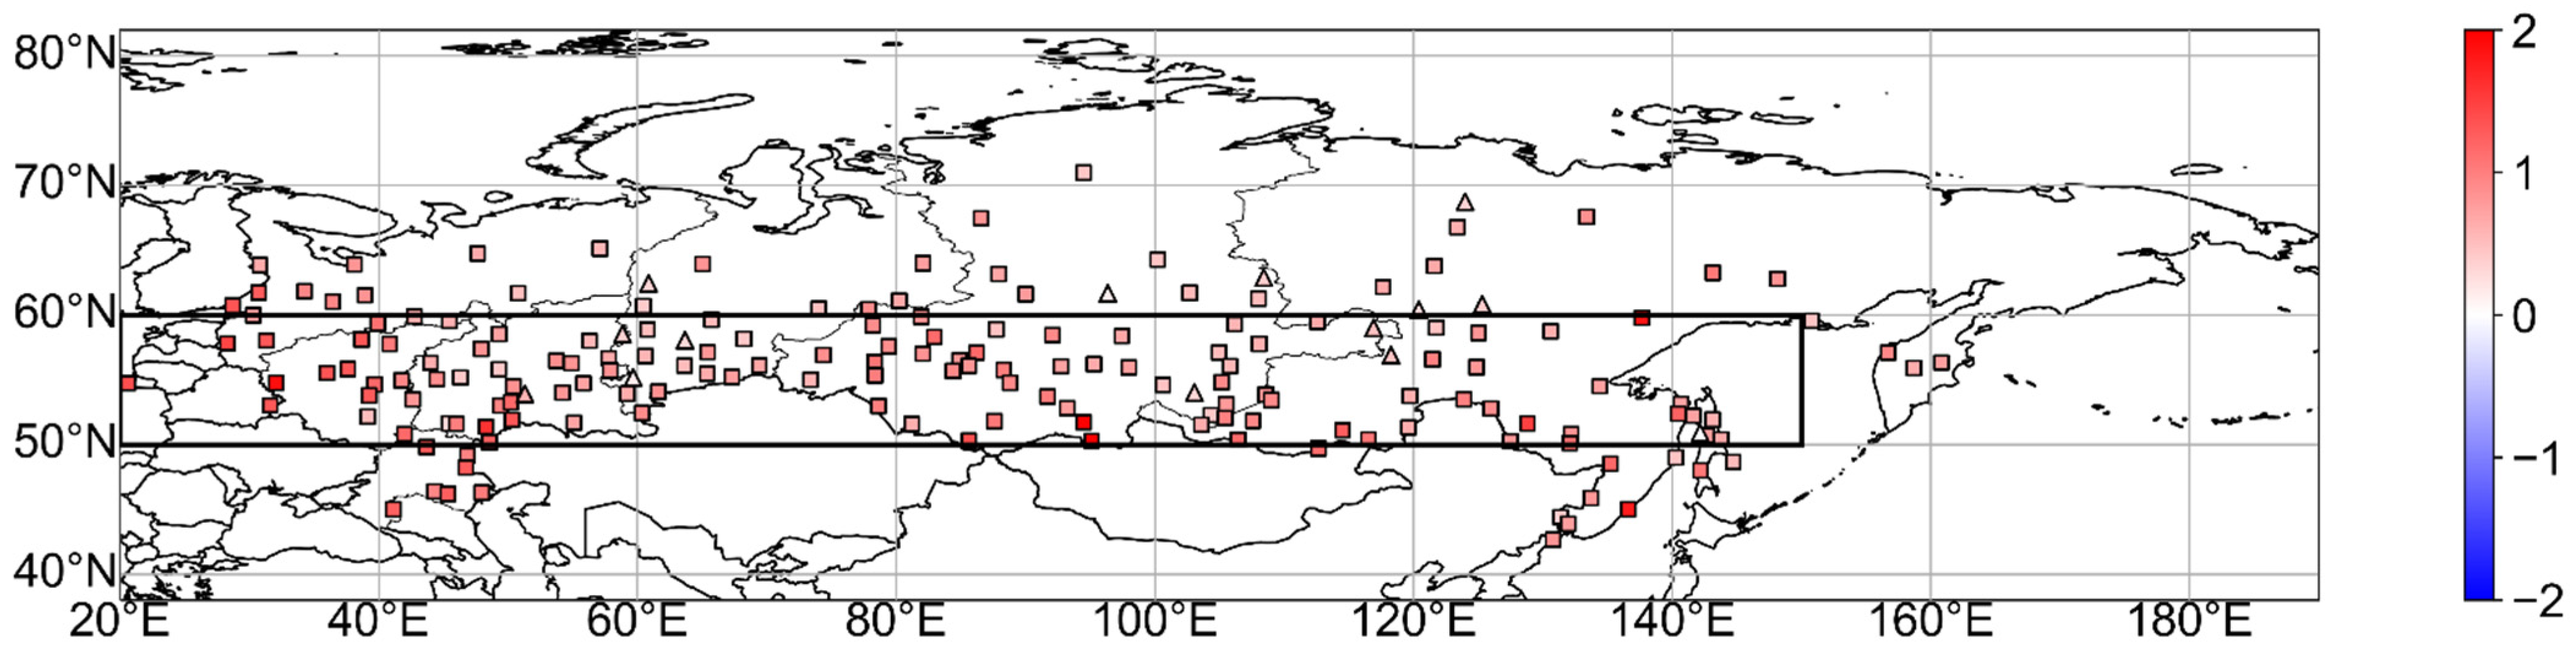
3.1. The Trends of Annual Extreme Indexes in Siberia and the Whole of Russia

Table 2 shows the decadal linear trends (Sen’s slope estimator) of climate indexes in the three regions (European Russia, Siberia, and the Far East). High-temperature-related indexes increased at most of the stations in all regions, and the characteristic of this trend is seen in Figure 3, which shows the spatial distribution of the mean decadal trend of TX90P in the period 1950–2019. In contrast, low-temperature-related indexes, which are TN10P and TX10P, decreased because these indexes tend to decrease as the temperature increases.
Except for CDD, precipitation-related indexes showed positive trends or no trends in all regions. The increase in PRCPTOT and decrease in CDD throughout the entire region indicate a wetting trend throughout Russia. Compared to the trends of the temperature-related indexes, several observation points showed increasing trends, while other points showed decreasing trends within each region. Moreover, the number of stations that showed significant trends in the precipitation-related indexes was lower than the number of stations at which there were significant trends in the temperature-related indexes.
To clarify differences in the mean trend of climate indexes between Siberia and the other regions, this study conducted Welch’s t-test for the differences (Table 2). No differences in the trends of high-temperature-related indexes, such as TX90P and TN90P, were observed between Siberia and European Russia, while the trend of WSDI in Siberia was less than that in European Russia. This indicates that the increase in the duration of high temperatures is more remarkable in European Russia. In contrast, the trends in the low-temperature-related indexes, such as TN10P and CSDI, in Siberia were smaller than those in European Russia. Therefore, the frequency of extreme cold weather in Siberia was reduced compared to that in European Russia. The increases in the precipitation indexes RX5day and R95P in European Russia were significantly greater than those in Siberia. In addition, the decrease in the length of dry spells represented by CDD in Siberia was significantly greater than that in European Russia, despite the fact that CDD decreased in both regions (Table 2). Thus, drought is less likely to occur in Siberia than in European Russia.
The decreases in TX10P, TN10P, and CSDI were greater in the Far East than in Siberia, and the increase in TN90P was greater in Siberia than in the Far East. In other words, the frequency of extremely low temperatures in the Far East is even lower than in Siberia, while extremely high temperatures are more likely to occur in Siberia than in the Far East. The increases in the precipitation indexes RX5day and R95P were significantly greater in the Far East than in Siberia. The CDD and CWD trends in Siberia and the Far East were similar, indicating that there was no significant difference in the long-term drier and wetter trends.

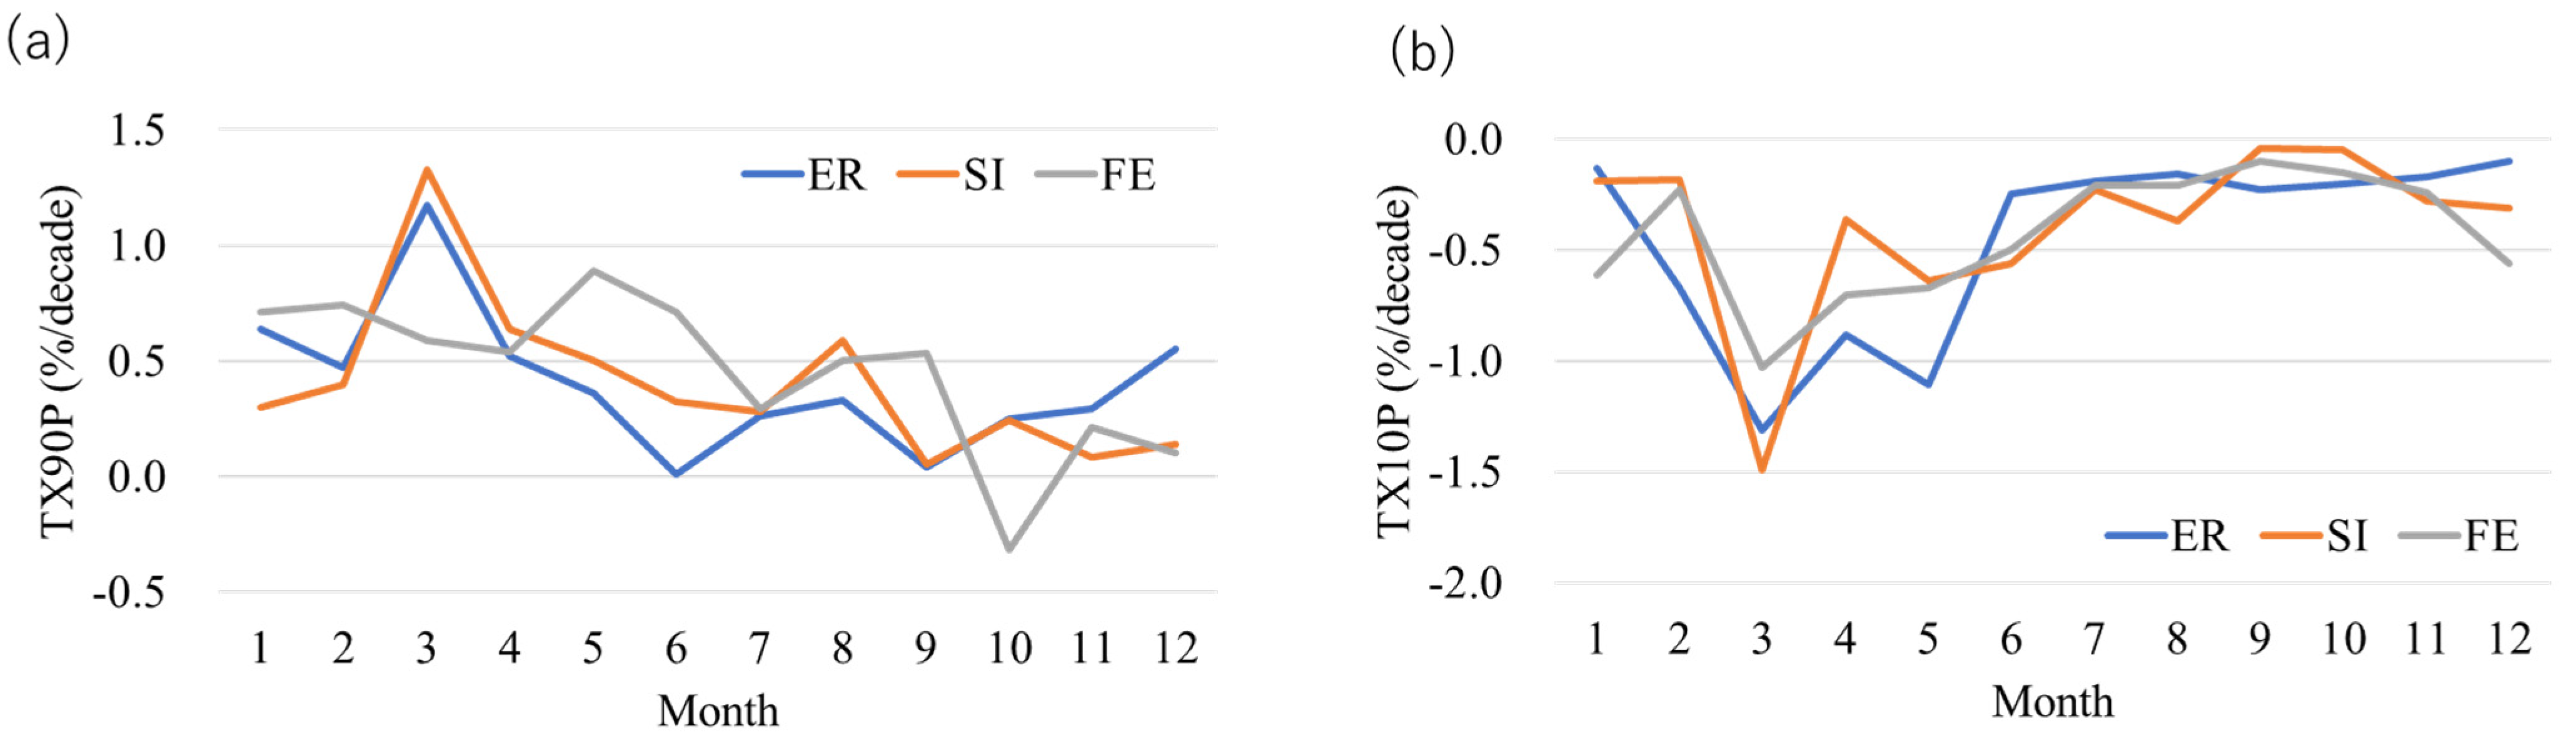
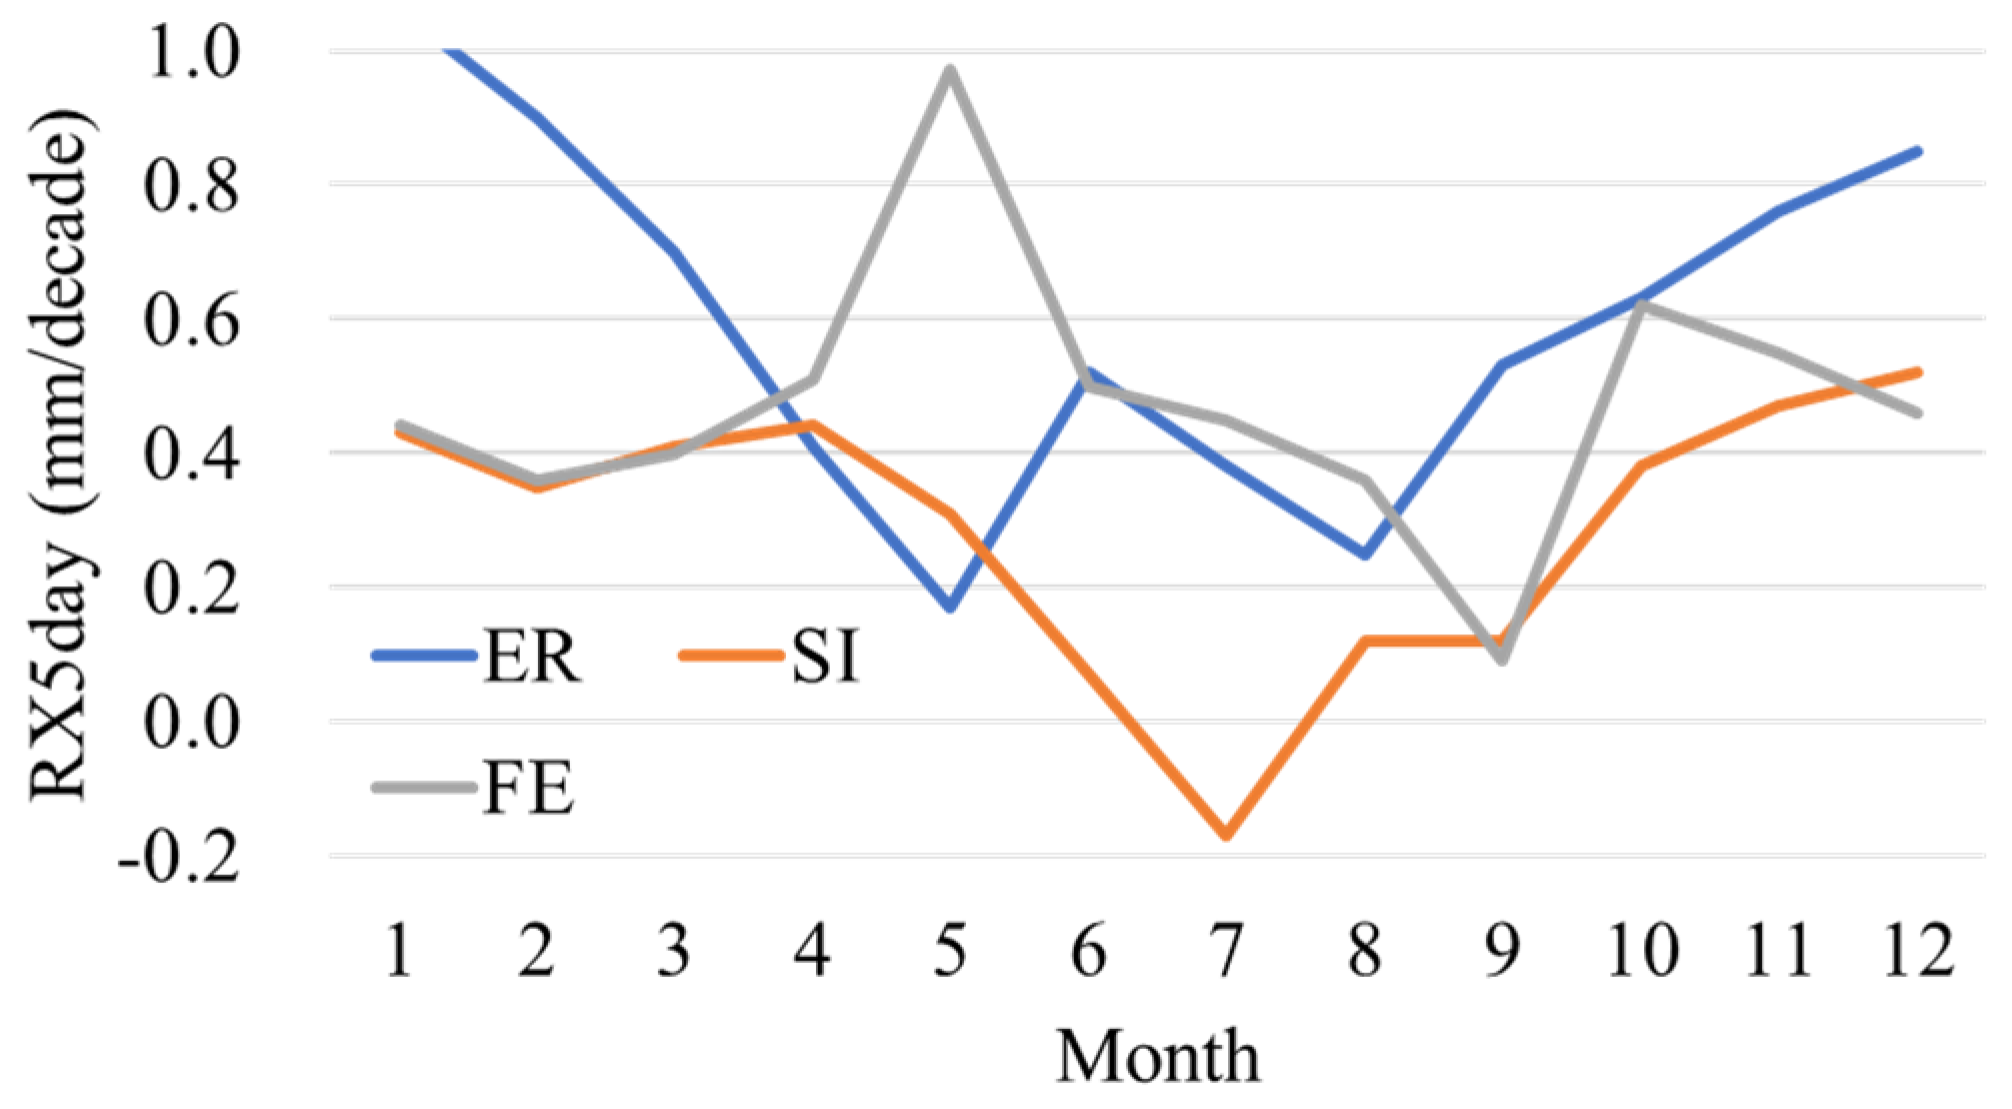
3.2. The Trends of Monthly Extreme Indexes in Siberia and in Other Regions of Russia

The frequency of extreme climate events varies greatly depending on the season. Therefore, the long-term trends of the indexes were calculated monthly, and their variations are shown in Figure 4. The monthly averaged trend of TX90P indicates that the upward trend is the strongest in spring in Siberia and European Russia (Figure 4a). In particular, the trend of TX90P in Siberia reached its maximum in March and has been increasing at a rate of approximately 1.5% per decade. These features indicate that Siberia has seen the greatest increase in the frequency of high-temperature events compared with other regions. In the Far East, the maximum increase in TX90P appeared later than in other regions, reaching a maximum in May. Correspondingly, TX10P reached its minimum in March in all regions (Figure 4b). These features indicate that warming in Russia is particularly noticeable in spring. The frequency of extreme low-temperature events has decreased at a rate of more than 1% per decade in all regions, which is especially evident in data from March. On the other hand, because the long-term trend of TX10P in summer and autumn is close to 0% per decade, the effect of climate change on the frequency of low-temperature events may not be as large as in spring.
Compared with the monthly trends of the temperature-related indexes, those of the precipitation-related indexes exhibit different characteristics in each region (Figure 5). In European Russia and Siberia, the increase in precipitation intensity in winter was the strongest. The monthly trends of RX5day in Siberia were smaller in all seasons except springtime than those in European Russia. However, the precipitation characteristics in the Far East are different from those in other regions because the largest increase in precipitation is observed in May. Furthermore, while all regions showed overall increases in precipitation, Siberia showed a decrease in summer precipitation. This suggests that the decrease in precipitation intensity during summer affects the drying trend.

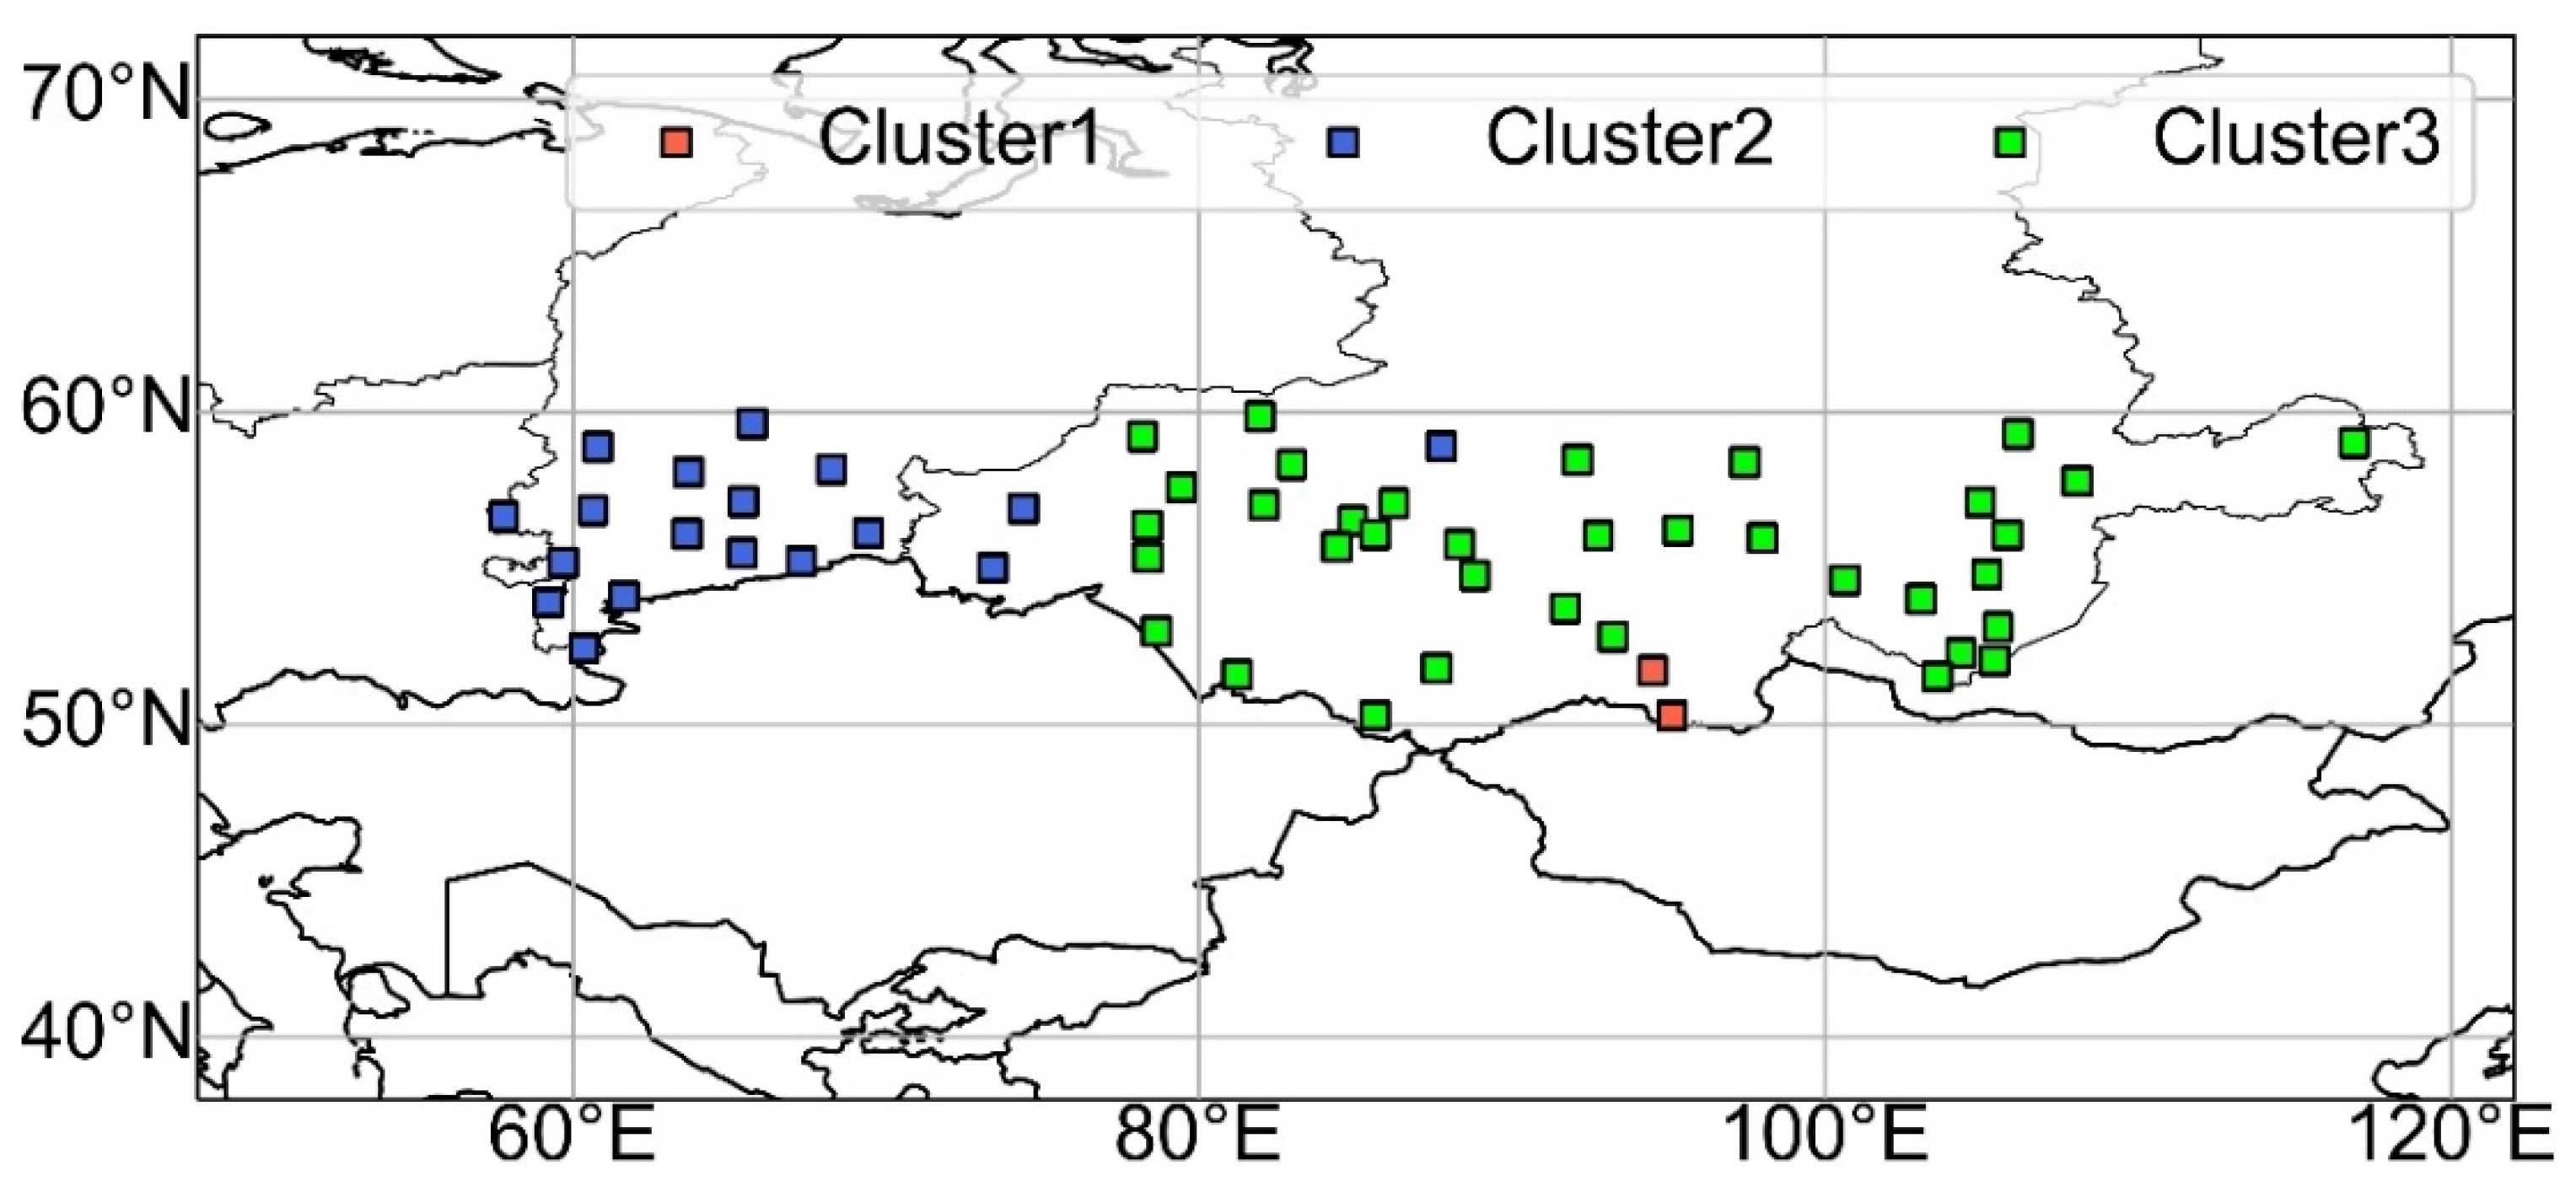
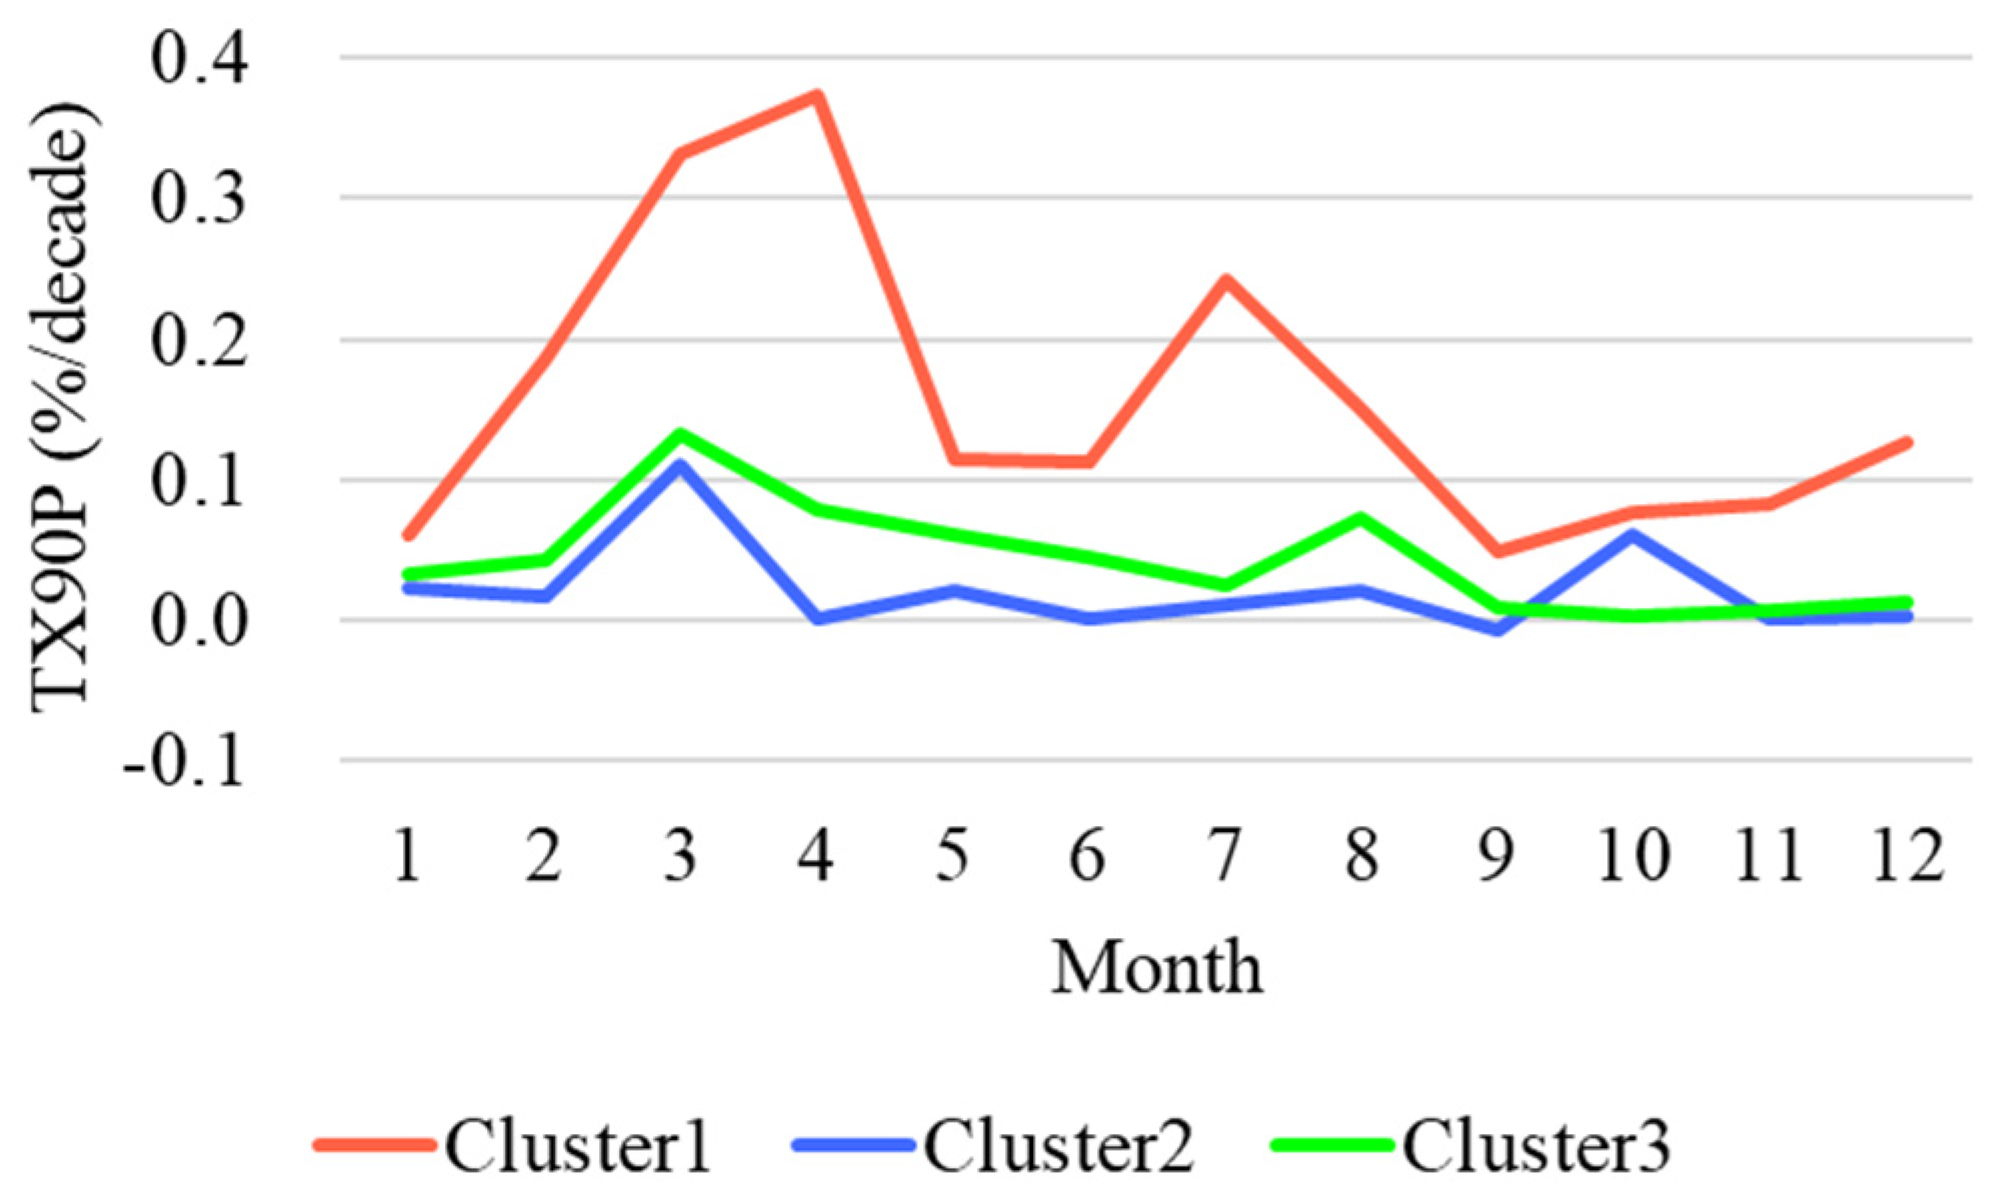
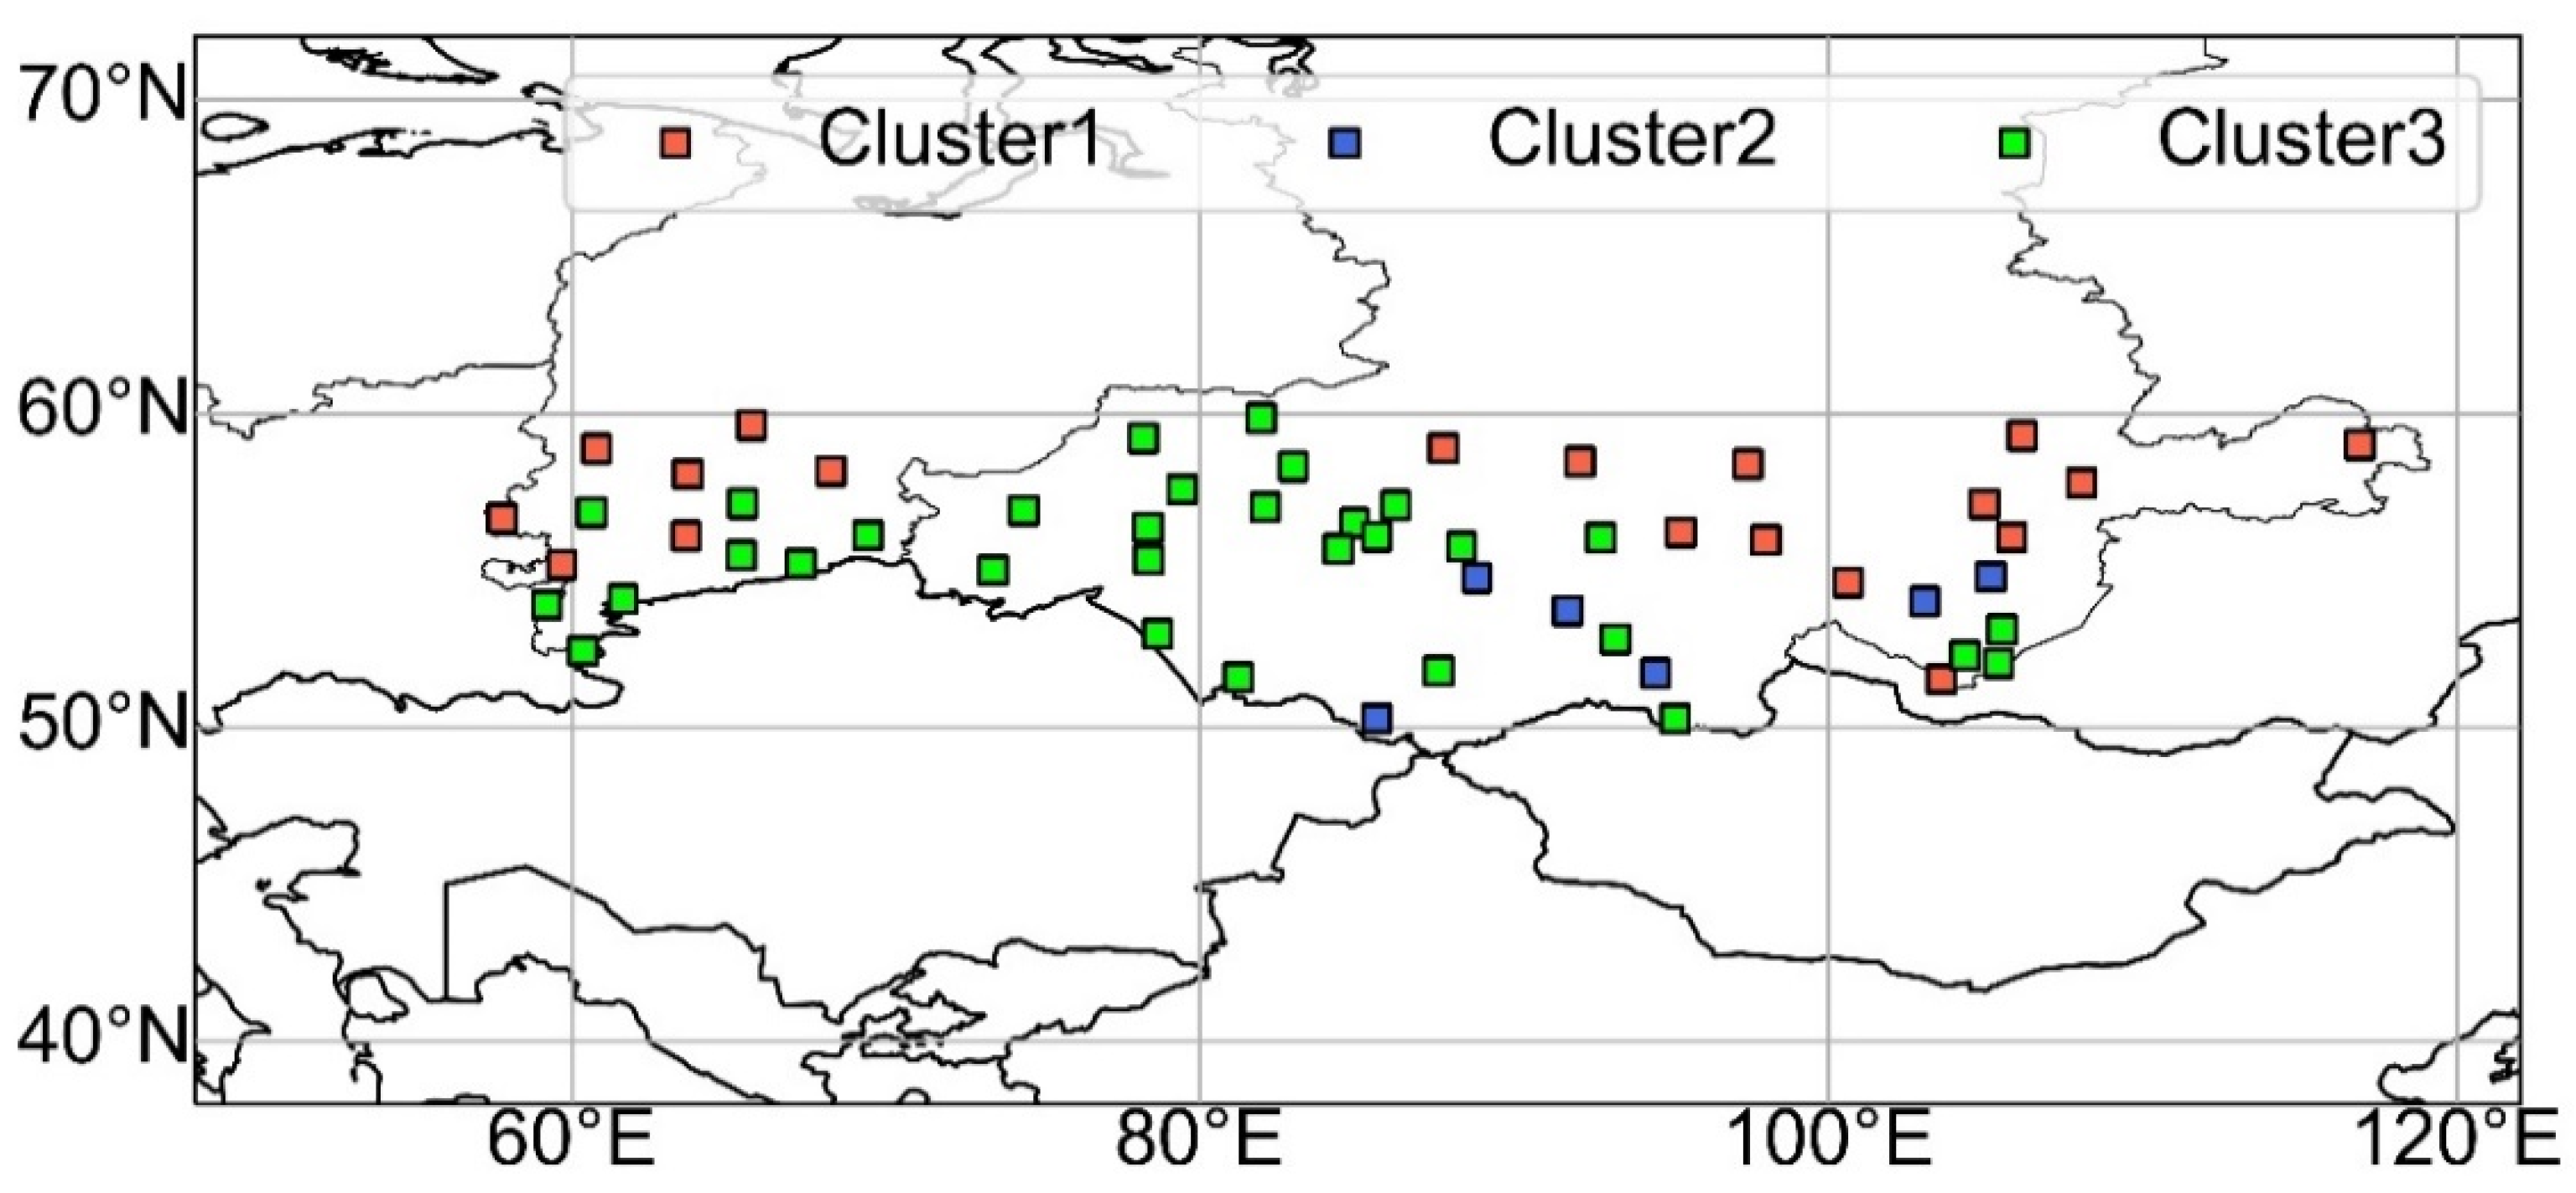
3.3. The Trends of Monthly Extreme Indexes in the Interior of Siberia

Because Siberia is vast, there will be differences in the trends of extreme events within the region. Therefore, a cluster analysis was performed based on the trends of extreme climate indexes such as TX90P, TX10P and RX5day. The climatic characteristics of extreme events were analyzed concerning the interior of Siberia.
Clustering based on the monthly TX90P trends yielded three clusters (Figure 6). Cluster 1, which was the smallest of the three clusters, was located in the region adjacent to northwest Mongolia. Most of the stations in Siberia belonged to Clusters 2 and 3, which were clearly separated depending on longitude. All stations located west of 75° E were included in Cluster 2, whereas most stations located east of 75° E belonged to Cluster 3.
Figure 7 shows the monthly average trends of TX90P for each cluster. Cluster 1 had the most significant increase among the three clusters. In particular, the rate of increase in spring was over 0.3%/decade, indicating a large increase in the frequency of high-temperature events during the snowmelt season. Similarly, in Clusters 2 and 3, increasing trends in spring were also noticeable. Comparing Clusters 2 and 3, the cluster of stations east of 75° E had a stronger increasing trend than that of stations west of 75° E except for in October.
Figure 8 illustrates the spatial distribution of clusters based on monthly TX10P trends. The distribution of TX90P varied in the longitudinal direction (Figure 6), whereas the distribution of TX10P, especially Clusters 1 and 3, varied mainly in the latitudinal direction (Figure 8). Stations belonging to Cluster 1 were located separately in the Ural Federal District and east of the Siberia Federal District. The stations included in Cluster 3 were distributed throughout the Siberian region, especially at approximately 80° E.
The stations in Cluster 2 were fewer and more sparsely located than in the other clusters; however, they tended to be higher in elevation than observations in the other clusters. The monthly average trend calculated for each cluster indicated that the frequency of low-temperature events decreased significantly in spring for all clusters (Figure 9). Cluster 1, which contained stations further north, had a smaller decreasing trend in almost all months than the other clusters. Although Clusters 2 and 3 showed similar monthly trends, Cluster 2 showed a strong downward trend during winter.
The results of clustering by monthly RX5DAY trends showed that all clusters were sparsely distributed compared with the results of the two indexes described above (Figure 10). Comparing the number of stations in each cluster, Cluster 1 had the largest number of stations, and they were distributed throughout Siberia. The results of the monthly average trend of RX5DAY for each cluster indicated that the trend differed substantially between Cluster 1 and the other clusters (Figure 11). Cluster 1 showed a stable and increasing trend in precipitation throughout the year. In contrast, Clusters 2 and 3 showed strong decreasing trends in precipitation during summer, although it increased in all other seasons.

4. Discussion

4.1. Comparison of Trends of Extreme Indexes in Siberia with Previous Studies

The annual trends of the temperature-related indexes were clearly divided into either an increase or decrease in each index (Table 2). These features are consistent with those of a previous study [11] that showed the trends of extreme indexes in southwestern Siberia (60–85° E and 50–65° N). However, the trends of TX90P and TN90P in this study are smaller than those in the previous study. In addition, the trend for TN90P is shown to be more than twice the trend for TX90P in southwestern Siberia; however, there was no significant difference between the two trends in the entirety of Siberia, as shown by this study. Comparing the seasonal trends with previous studies [13,15], the largest trend of increases in extreme high-temperature events in spring was consistent with the previous studies. Although this study also showed an increase in high-temperature events during summer, the increase in the trend was small in the previous studies [13,15].
Compared with a previous study with respect to the precipitation trend, southwestern Siberia showed decreasing trends in precipitation-related indexes on average [11], although there is no significant difference in the number of stations showing an increase and decrease in trends in heavy precipitation. This finding is similar to the results of the present study; however, the stations that show increasing trends of heavy precipitation are slightly more predominant in this study. On the other hand, since CDD showed a decreasing trend in both studies, they agreed that wetting is progressing in Siberia. The study analyzing seasonal trends in climatic extremes indicated that heavy precipitation is more likely to occur in Western Siberia during spring [13]. The present study also shows an increasing trend of heavy precipitation in Siberia during spring; however, the trend is more pronounced during winter.

4.2. The Trends of Extreme Indexes in the Interior of Siberia

There is variability in extreme event trends even within the vast region of Siberia. The clustering of stations was used in this study to identify regional differences in the distribution of extreme climatic trends. The classification based on temperature-related indexes (TX90P and TX10P) showed cohesive distributions in climatically homogeneous areas. Figure 7 shows that the Siberian region has the strongest increasing trend of high-temperature events (TX90P) in spring, especially in the eastern part of the region, which is consistent with the descriptions in previous studies [13,40] that examined trends in the seasonal averaged temperature and the frequency of abnormally high-temperature events. Additionally, it was also noted that in the recent decade (2011–2020), the frequency of high-temperature events in winter has increased in most of Western Siberia [14], i.e., high-temperature events are more likely to occur in colder seasons.
In clusters based on trends in the frequency of low-temperature events (TX10P), clusters showing stronger decreasing trends are widely distributed in Southern Siberia and around 80° E. These results are consistent with those of a previous study [13] in that the frequency of extreme low-temperature events in winter is greatly reduced in Southern Siberia, especially along the borders with Mongolia and Kazakhstan. However, a large decreasing trend of TX10P in spring, as shown in Figure 9, was not noted in [13].
Because clusters based on trends in precipitation indexes are mixed, there is a regional variation in precipitation characteristics within Siberia. Figure 10 shows that many stations in Western Siberia belong to Cluster 1, in which precipitation tends to increase throughout the year. Figure 11 presents an increasing trend in RX5day in all clusters in Siberia, except in summer. This feature is consistent with an earlier study [13] that showed an increasing trend in the frequency of heavy rainfall from fall to spring.
Cluster 2 was mainly located around 80° E (Figure 10) and showed a decreasing trend in precipitation in August (Figure 11). Regarding the effect of atmospheric circulation on precipitation, the 850 hPa geopotential height in summer tends to decrease near Eastern Europe and Mongolia, and moisture flux tends to increase accordingly [23,41]. However, the geopotential height around 80°E, sandwiched between two cyclonic circulations, is increasing. Consequently, the moisture fluxes in this region are smaller than those in Eastern Siberia. Therefore, these moisture flux characteristics influence the amount of moisture inflow in each region and might contribute to summer precipitation variability in the interior of Siberia.
In addition, convective precipitation is increasing, and non-convective precipitation decreases across Russia throughout the year [42,43]. The trend of increasing convective precipitation, especially in summer, is the strongest, and the ratio of convective precipitation to total precipitation also increases. However, there are large regional differences in the convective precipitation trends, and in some areas, the trends do not increase. For example, there are many stations belonging mainly to Cluster 2, which shows a decreasing trends of RX5DAY in summer in the area between 70° E and 90° E. It is noted that non-convective precipitation is decreasing in this region, whereas convective precipitation is not increasing in summer [43]. Moreover, in Eastern Siberia (100° E to 110° E), the annual convective rainfall trend does not increase [42]. Many stations in this region belong to Cluster 3, where precipitation decreases in July despite increasing summer moisture fluxes. The distribution of the clusters based on the RX5DAY trend may not be coherent because the occurrence of convective precipitation is influenced by factors such as local topography and land cover.

4.3. The Trends of Extreme Indexes in Siberia and the Surrounding Regions

Several studies show that the trends of temperature-related indexes in the surrounding regions of Siberia are clearly divided into increases or decreases [13,20,22,24], such as those in Siberia. These uniform trends indicate that warming occurs not only in Siberia but also in the surrounding regions because all trends indicate increases in air temperature. However, there were differences in the trends for each index by region and season, although the positive and negative trends of the indexes were consistent across all regions. For example, a remarkable warming trend in spring was revealed in Siberia (Figure 4). An increase in high-temperature events in Siberia during spring can cause a reduction in the extent of snow cover and the earlier disappearance of snow cover, as indicated by previous studies [27,28,44,45]. On the other hand, it has been reported that the snow depth in Siberia during spring is increasing [27,44]. Therefore, the remarkable warming trend in spring suggests that snowmelt accelerates in the spring, which consequently affects the occurrence of snowmelt flooding. This finding is comparable to those of previous studies [11,13] that investigated climatic extremes in Siberia, as well as a result of a previous study of climatic extremes in Central Asia [24]. However, the absolute values of the indexes in this study were somewhat smaller than those in the aforementioned studies. This may be due to the fact that the increase in temperature in Central Asia is stronger than at higher latitudes [46]. In fact, the increase in spring temperatures has accelerated the timing of snowmelt, and the rate of decrease in snow cover area has been faster in Central Asia than in Siberia [47].
Unlike temperature, the trends of the precipitation-related indexes varied positively and negatively from station to station and did not exhibit a uniform distribution (Table 2). However, with the exception of CDD, which is the index of drought, the number of stations showing a positive trend was greater than the number of stations showing a negative trend. Therefore, precipitation has an overall increasing trend in Russia. Long-term droughts are less likely to occur because CDD shows a decreasing trend in all regions. These characteristics are consistent with the increasing precipitation trend in Russia [19].
RX5day and R95P in Siberia are the smallest in Russia, and the increasing trend of heavy rainfall in Siberia is smaller than in other regions. However, the monthly trend of RX5day in Siberia increased except in summer (Figure 5), where CDD decreased at almost all stations. Therefore, Siberia tends to be as wet as other regions of Russia, and these trends have led to massive flooding and other natural disasters recently [29]. The risk of flooding due to snowmelt is extremely high, especially during spring, because the frequency of high-temperature events mostly increases. Consequently, if these trends continue, the frequency of heavy rainfall and flooding in Siberia will increase in the future.
Compared with studies focusing on the surrounding areas of Siberia, the indexes related to precipitation show increasing trends in northwestern China [17,18,19,21] and Kazakhstan [22,23,25,26]. By analyzing the atmospheric field, cyclonic anomalies have been observed above Central Asia since 1998 [23]; these anomalies produce southerly winds from the Arabian Sea. Correspondingly, anticyclonic anomalies over Mongolia caused a decreasing trend in precipitation over Eastern Siberia, which is adjacent to Mongolia (Figure 2).

5. Conclusions

This study revealed the characteristics of the climatic extremes in Siberia and compared them with the characteristics of climactic extremes in the surrounding regions. Extreme indexes were used to analyze the trends of climatic extremes. The climatic extremes in Siberia revealed in this study are summarized as follows:
  • The trends in climatic extremes related to air temperature showed that global warming is progressing in Siberia and the surrounding regions. Comparing the trends of the temperature-related indexes between Siberia and other regions, the frequency of high-temperature events in Siberia was not significantly different from that in other regions. In terms of monthly trends, a substantial increase in the frequency of high-temperature events during spring was observed. In contrast, the increasing trends of temperature-related indexes in Siberia were lower than those in northwestern China and Central Asia.
  • Regarding the trends of the precipitation-related indexes, precipitation generally increased in Siberia and the surrounding regions, although there were variations in the positive and negative trends among the meteorological stations. However, Siberia is one of the regions in Russia where heavy precipitation is less likely to occur, and the monthly trend of precipitation showed an increase except for in summer. Snowmelt and precipitation, combined with an increase in the number of high-temperature events in spring, may influence the occurrence of flooding. Therefore, there is concern that heavy rainfall and flooding will increase in Siberia in the future.
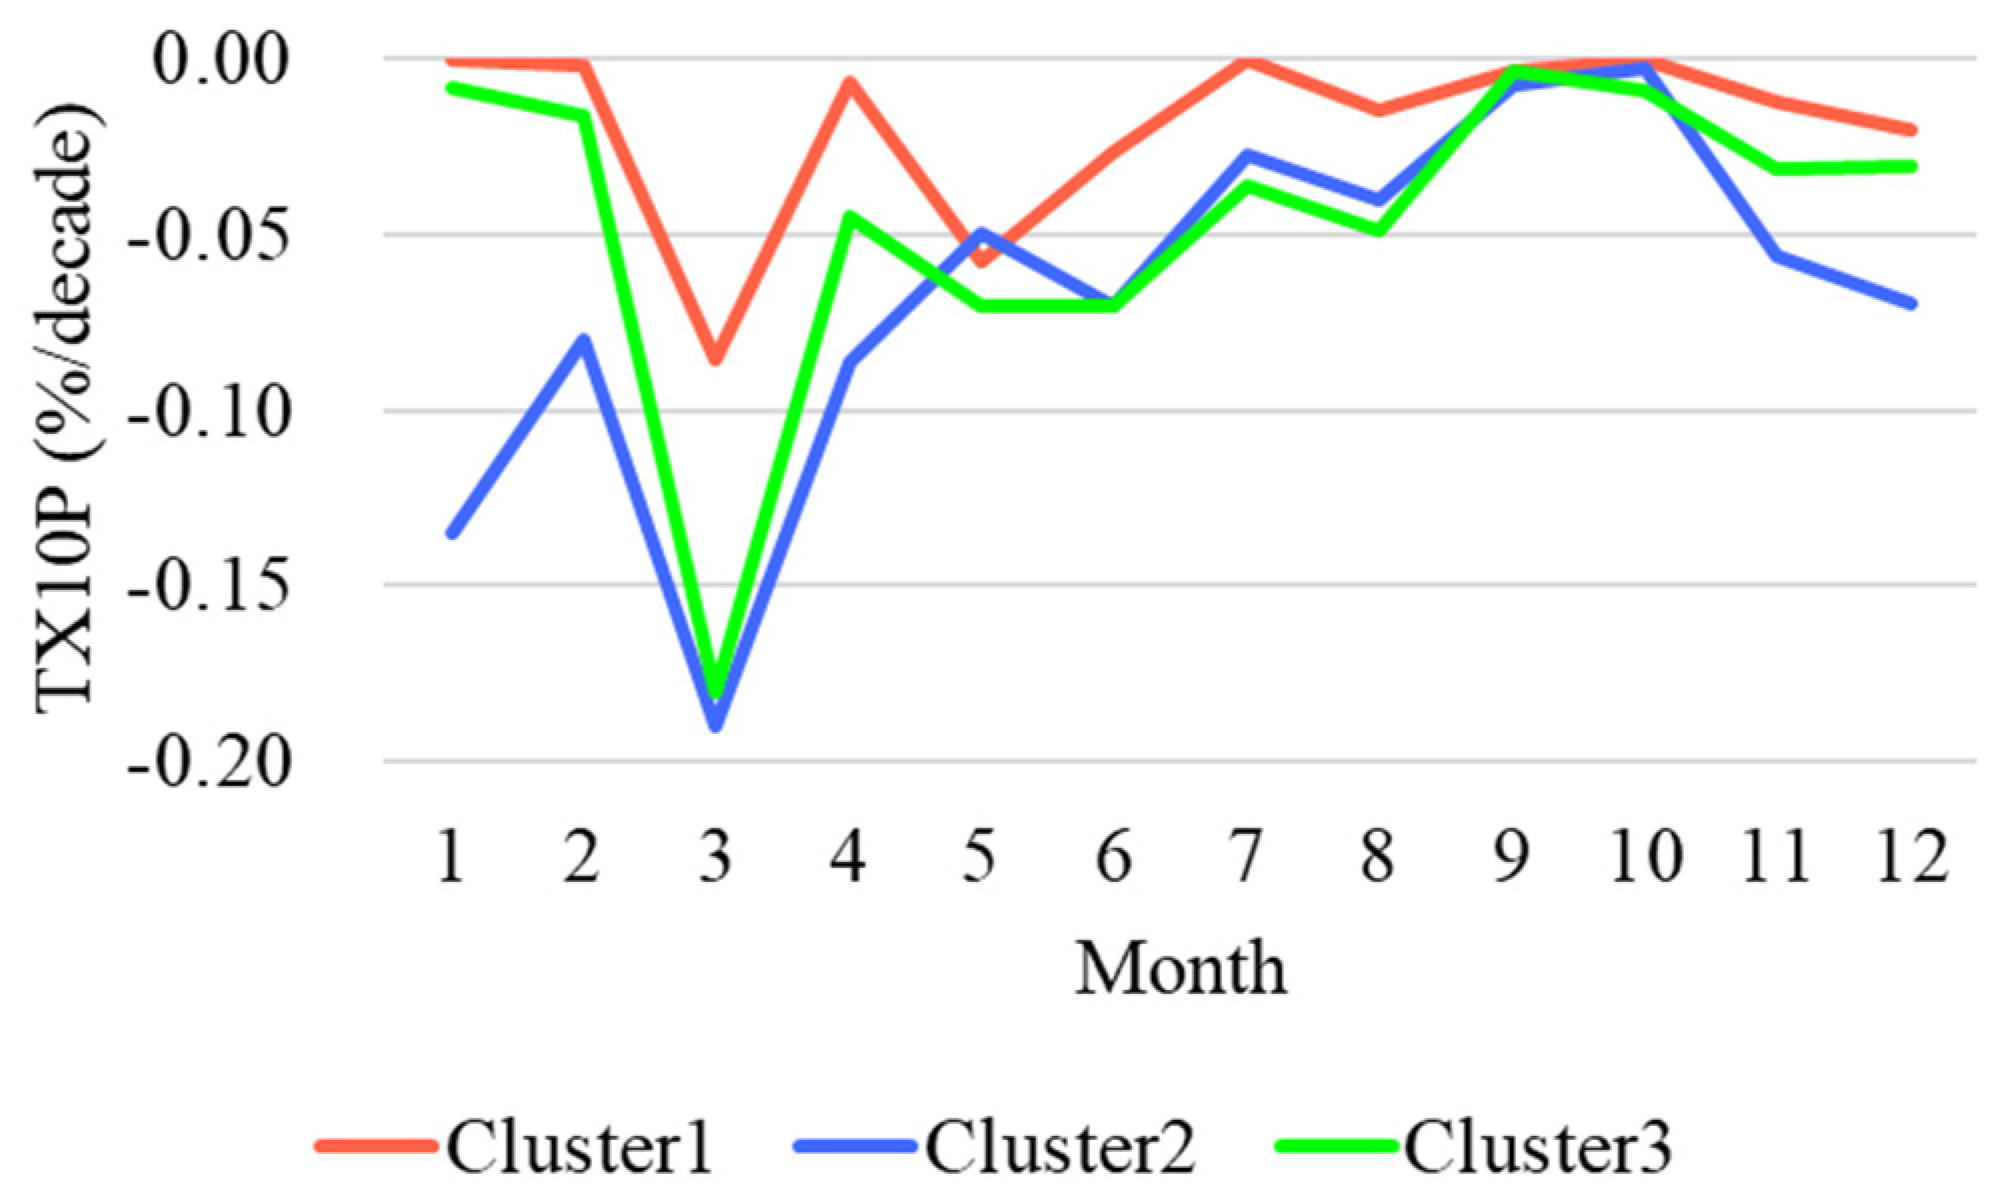
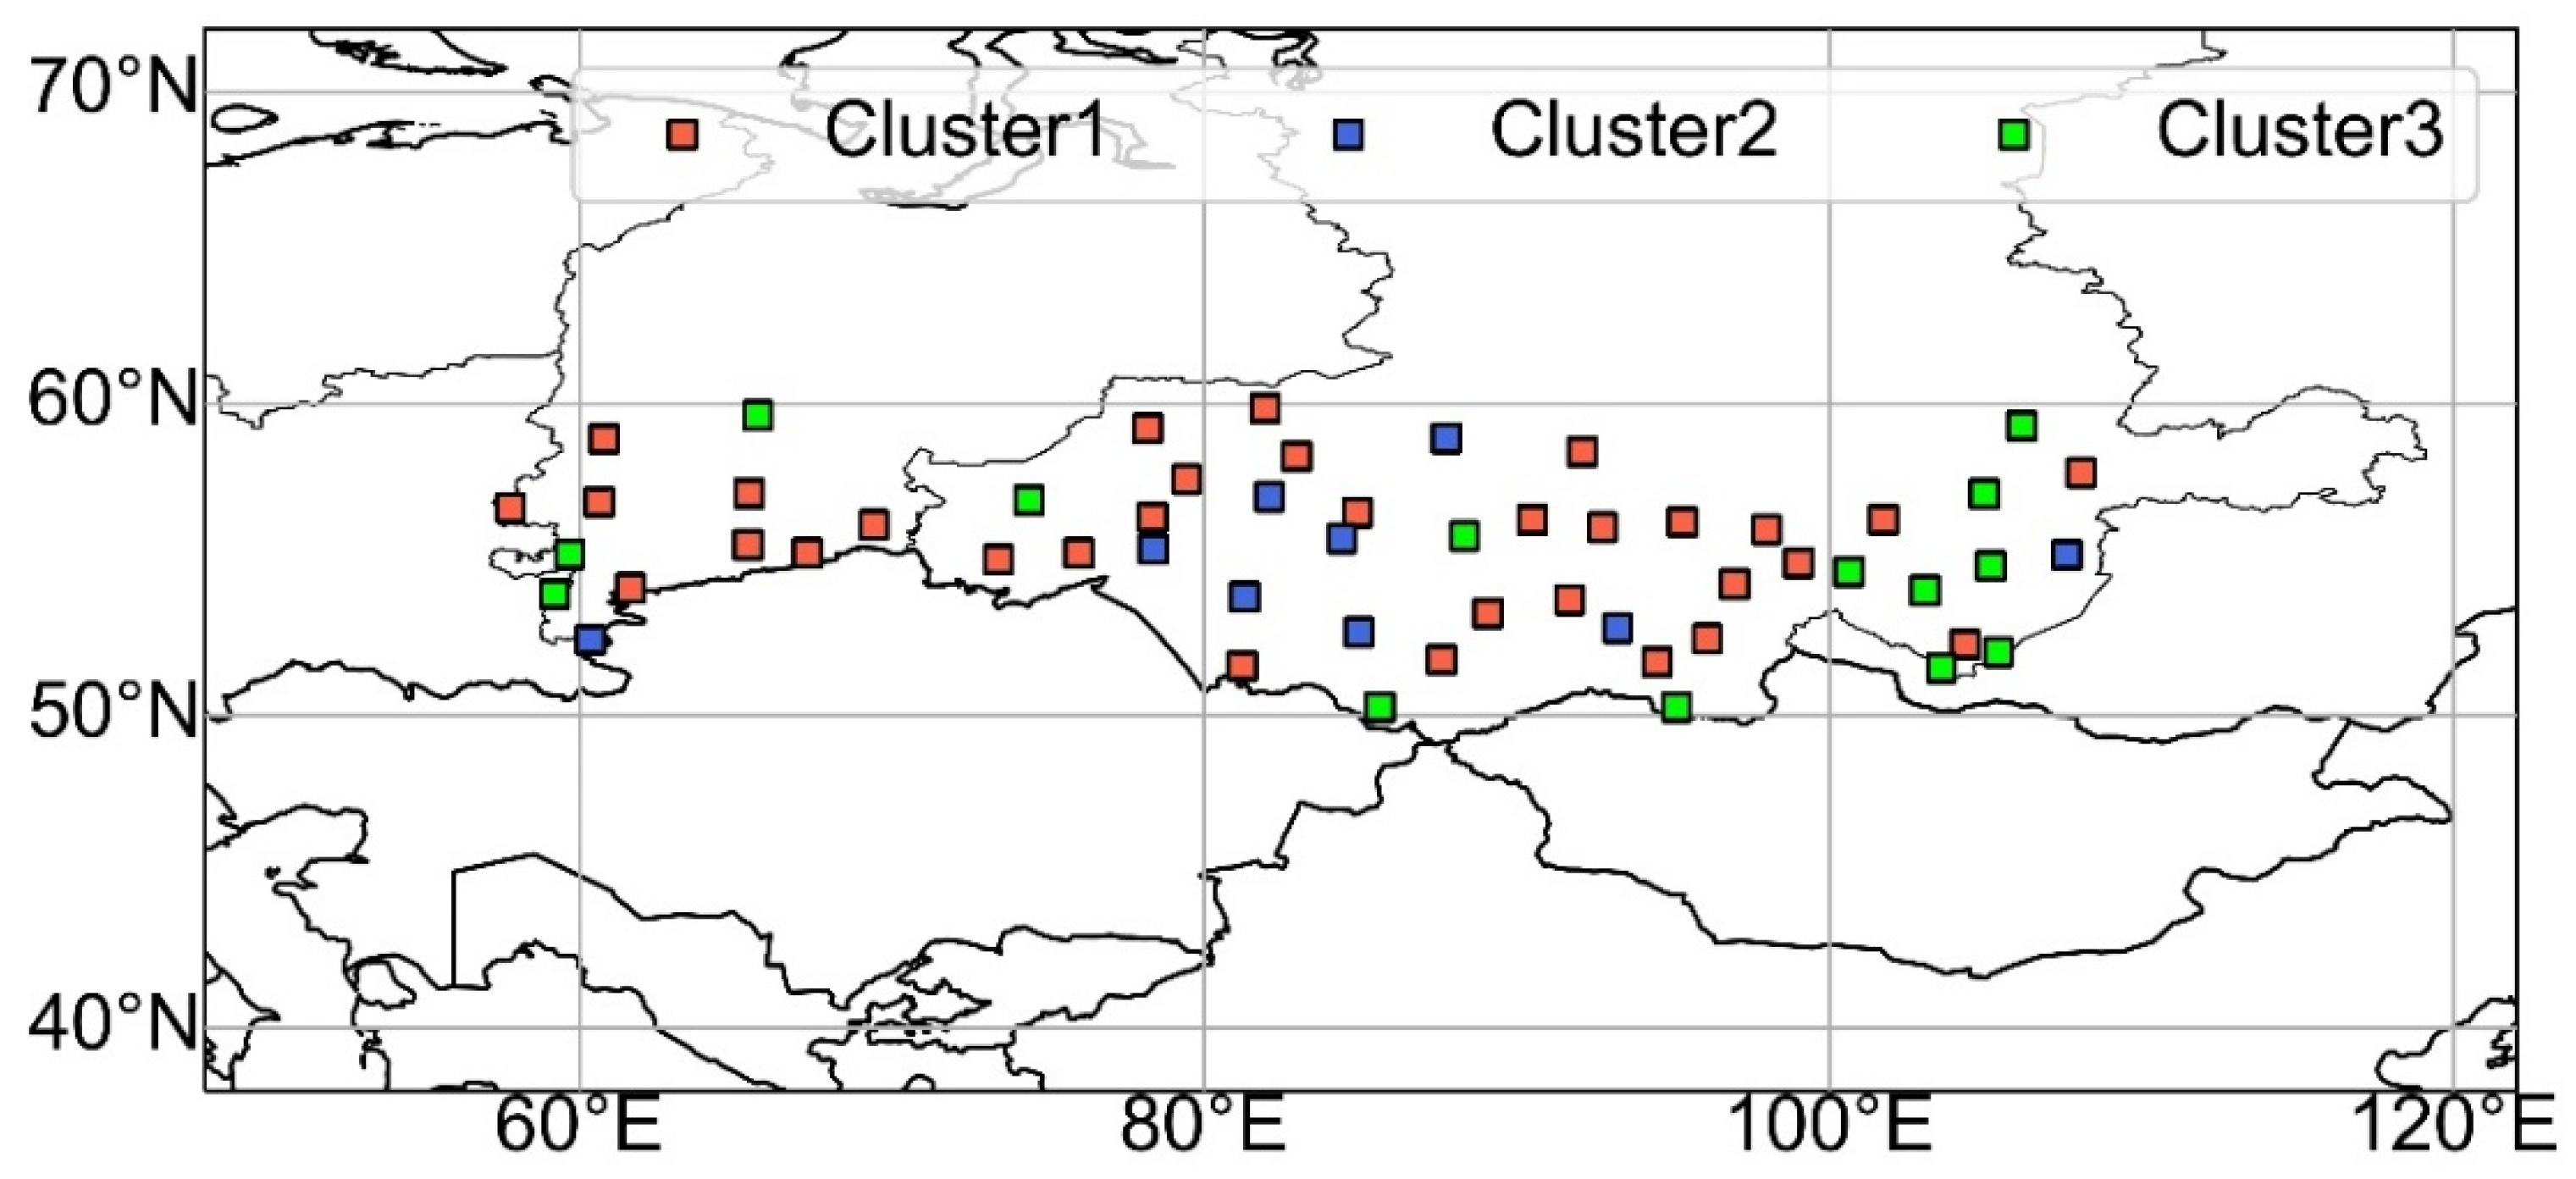
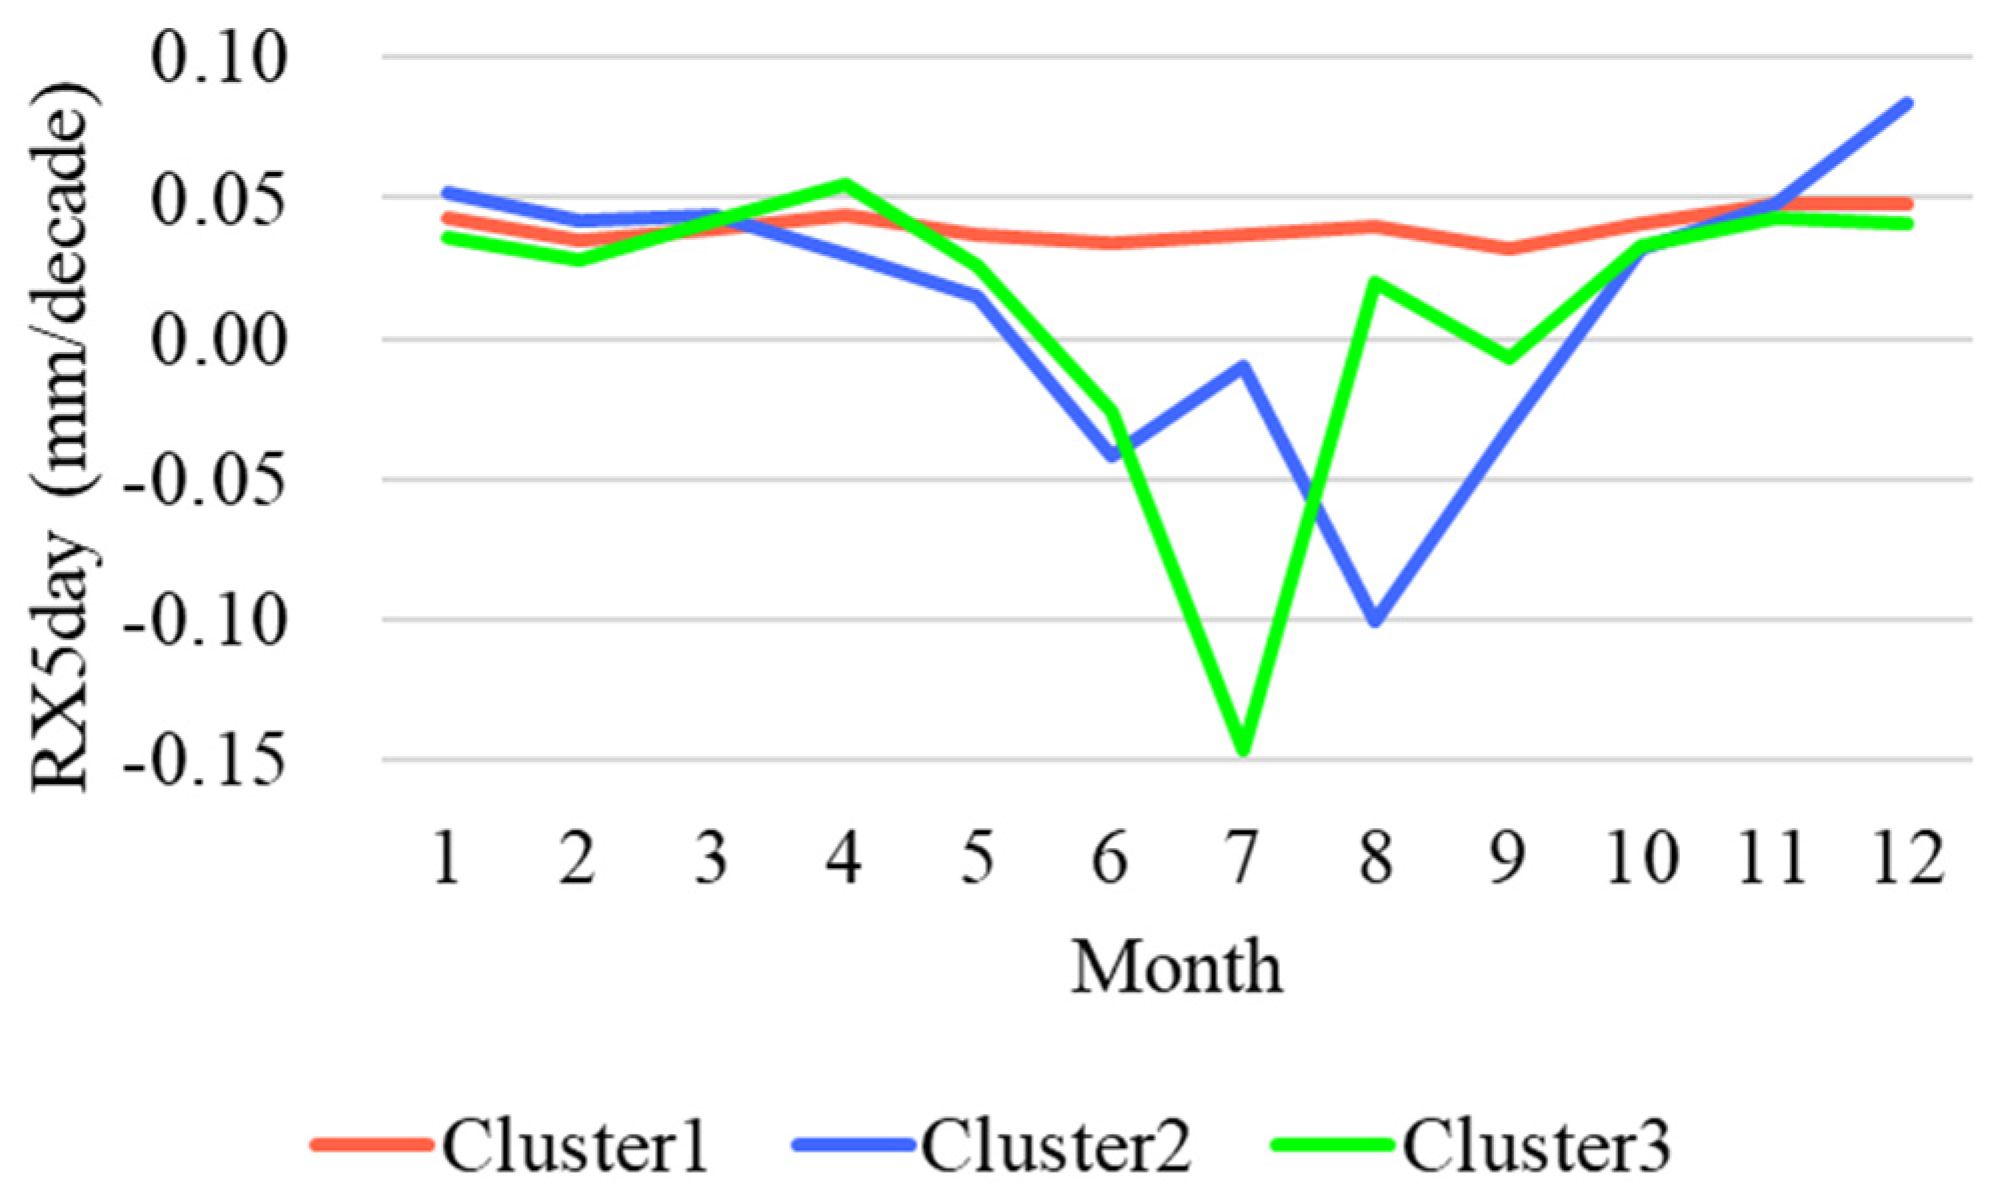
  • Regarding the cluster analysis based on the trends of the temperature-related indexes in the interior of Siberia, it is clear that climatically homogeneous regions are clustered together. In particular, all regions showed marked warming trends in March. However, with respect to the cluster analysis based on trends in the precipitation-related indexes in the interior of Siberia, climatically homogeneous regions were scattered. Although precipitation tends to increase throughout the year in Siberia, several regions show decreasing trends in precipitation during summer.
This study revealed the regional characteristics of the occurrence, seasonal changes, and interannual variations in climatic extremes in Siberia. A future issue will be to elucidate the relationship between the variations in extreme events and the atmospheric circulation field. Moreover, it is necessary to investigate whether climatic features, whose trends in precipitation-related indexes have large regional differences, are similar in the surrounding regions of Siberia. In addition, the clarification of the factors contributing to regional differences in precipitation trends is expected to reduce the risk of disasters associated with climatic extremes. These issues will be discussed in the next article.

Author Contributions

Conceptualization, T.W. and H.M.; methodology, T.W.; software, T.W.; validation, T.W. and H.M.; formal analysis, T.W.; investigation, T.W.; writing—original draft preparation, T.W.; writing—review and editing, H.M., I.K., O.N., V.C. and V.Z.; visualization, T.W.; supervision, H.M.; project administration, H.M.; funding acquisition, H.M. and V.Z. All authors have read and agreed to the published version of the manuscript.

Funding

H.M. was supported by the JST/SICORP Grant Number JPMJSC1901 and JSPS KAKENHI (18KK002800), Japan. V.Z. was supported by the Russian Federal Target Program (Grant RFMEFI61419X0002). The study was carried out using the equipment of the Unique Research Installation “System of experimental bases located along the latitudinal gradient” TSU, with financial support from the Ministry of Education and Science of Russia (RF-2296.61321X0043, 13. УHУ.21.0005, agreement No. 075-15-2021-672).

Institutional Review Board Statement

Not applicable.

Informed Consent Statement

Not applicable.

Data Availability Statement

All data used in this study are available from RIHMI-WDC (2020) [30]. http://meteo.ru accessed on 10 May 2023.

Conflicts of Interest

The authors declare no conflict of interest.

References

  1. IPCC. Climate Change 2021: The Physical Science Basis. Contribution of Working Group I to the Sixth Assessment Report of the Intergovernmental Panel on Climate Change; Masson-Delmotte, V.P., Zhai, A., Pirani, S.L., Connors, C., Péan, S., Berger, N., Caud, Y., Chen, L., Goldfarb, M.I., Gomis, M., et al., Eds.; Cambridge University Press: Cambridge, UK; New York, NY, USA, 2021.
  2. Horton, E.B.; Folland, C.K.; Parker, D.E. The Changing Incidence of Extremes in Worldwide and Central England Temperatures to the End of the Twentieth Century. Clim. Chang. 2001, 50, 267–295. [Google Scholar] [CrossRef]
  3. Alexander, L.V.; Zhang, X.; Peterson, T.C.; Caesar, J.; Gleason, B.; Klein Tank, A.M.G.; Haylock, M.; Collins, D.; Trewin, B.; Rahimzadeh, F.; et al. Global Observed Changes in Daily Climate Extremes of Temperature and Precipitation. J. Geophys. Res. Atmos. 2006, 111, D05109. [Google Scholar] [CrossRef] [Green Version]
  4. Dole, R.; Hoerling, M.; Perlwitz, J.; Eischeid, J.; Pegion, P.; Zhang, T.; Quan, X.W.; Xu, T.; Murray, D. Was There a Basis for Anticipating the 2010 Russian Heat Wave? Geophys. Res. Lett. 2011, 38, L06702. [Google Scholar] [CrossRef] [Green Version]
  5. Lau, W.K.M.; Kim, K.M. The 2010 Pakistan Flood and Russian Heat Wave: Teleconnection of Hydrometeorological Extremes. J. Hydrometeorol. 2012, 13, 392–403. [Google Scholar] [CrossRef] [Green Version]
  6. Trenberth, K.E.; Fasullo, J.T. Climate Extremes and Climate Change: The Russian Heat Wave and Other Climate Extremes of 2010. J. Geophys. Res. Atmos. 2012, 117, D17103. [Google Scholar] [CrossRef]
  7. Pokrovsky, O.S.; Shirokova, L.S.; Kirpotin, S.N.; Kulizhsky, S.P.; Vorobiev, S.N. Impact of Western Siberia Heat Wave 2012 on Greenhouse Gases and Trace Metal Concentration in Thaw Lakes of Discontinuous Permafrost Zone. Biogeosciences 2013, 10, 5349–5365. [Google Scholar] [CrossRef] [Green Version]
  8. Ryazanova, A.A.; Voropay, N.N. Comparative Analysis of Hydrothermal Conditions of Tomsk Region by Using Different Drought Coefficients. IOP Conf. Ser. Earth Environ. Sci. 2019, 386, 012008. [Google Scholar] [CrossRef]
  9. Sukhova, M.G.; Zhuravleva, O.V.; Karanin, A.V.; Kharlamova, N.F. Climatic Causes of Dangerous Hydrological Phenomena in the Altai Region. Air Qual. Atmos. Health 2020, 13, 1211–1222. [Google Scholar] [CrossRef]
  10. Makarieva, O.M.; Nesterova, N.V.; Fedorova, A.D.; Shikhovd, A.N.; Vinogradova, T.A. Modeling of the Summer 2019 Disastrous Floods on the Iya River (Irkutsk Oblast). Geogr. Nat. Resour. 2020, 41, 354–363. [Google Scholar] [CrossRef]
  11. Degefie, D.T.; Fleischer, E.; Klemm, O.; Soromotin, A.V.; Soromotina, O.V.; Tolstikov, A.V.; Abramov, N.V. Climate Extremes in South Western Siberia: Past and Future. Stoch. Environ. Res. Risk Assess 2014, 28, 2161–2173. [Google Scholar] [CrossRef]
  12. Klein Tank, A.M.G.; Zwiers, F.W.; Zhang, X. Guidelines on Analysis of Extremes in a Changing Climate in Support of Informed Decisions for Adaptation. Available online: https://library.wmo.int/doc_num.php?explnum_id=9419 (accessed on 26 October 2022).
  13. Bulygina, O.N.; Razuvaev, V.N.; Korshunova, N.N.; Groisman, P.Y. Climate Variations and Changes in Extreme Climate Events in Russia. Environ. Res. Lett. 2007, 2, 045020. [Google Scholar] [CrossRef]
  14. Kharyutkina, E.V.; Loginov, S.V.; Moraru, E.I.; Pustovalov, K.N.; Martynova, Y.V. Dynamics of Extreme Climatic Characteristics and Trends of Dangerous Meteorological Phenomena over the Territory of Western Siberia. Atmos. Ocean. Opt. 2022, 35, 394–401. [Google Scholar] [CrossRef]
  15. Kuzhevskaia, I.V.; Nechepurenko, O.E.; Chursin, V.V.; Matsuyama, H. Analysis of Climatic Extremity since the 1950s in the Mountain Altai Territory. Geosph. Res. 2020, 3, 97–108. [Google Scholar] [CrossRef]
  16. Wang, P.; Huang, Q.; Tang, Q.; Chen, X.; Yu, J.; Pozdniakov, S.P.; Wang, T. Increasing Annual and Extreme Precipitation in Permafrost-Dominated Siberia during 1959–2018. J. Hydrol. 2021, 603, 126865. [Google Scholar] [CrossRef]
  17. Wang, H.; Pan, Y.; Chen, Y.; Ye, Z. Linear Trend and Abrupt Changes of Climate Indices in the Arid Region of Northwestern China. Atmos. Res. 2017, 196, 108–118. [Google Scholar] [CrossRef]
  18. Dong, T.; Liu, J.; Liu, D.; He, P.; Li, Z.; Shi, M.; Xu, J. Spatiotemporal Variability Characteristics of Extreme Climate Events in Xinjiang during 1960–2019. Environ. Sci. Pollut. Res. 2023, 30, 57316–57330. [Google Scholar] [CrossRef] [PubMed]
  19. Hu, Z.; Li, Q.; Chen, X.; Teng, Z.; Chen, C.; Yin, G.; Zhang, Y. Climate Changes in Temperature and Precipitation Extremes in an Alpine Grassland of Central Asia. Theor. Appl. Climatol. 2016, 126, 519–531. [Google Scholar] [CrossRef]
  20. Dashkhuu, D.; Kim, J.P.; Chun, J.A.; Lee, W.S. Long-Term Trends in Daily Temperature Extremes over Mongolia. Weather Clim. Extrem. 2015, 8, 26–33. [Google Scholar] [CrossRef] [Green Version]
  21. Jiang, F.Q.; Hu, R.J.; Wang, S.P.; Zhang, Y.W.; Tong, L. Trends of Precipitation Extremes during 1960-2008 in Xinjiang, the Northwest China. Theor. Appl. Climatol. 2013, 111, 133–148. [Google Scholar] [CrossRef]
  22. Zhang, M.; Chen, Y.; Shen, Y.; Li, B. Tracking Climate Change in Central Asia through Temperature and Precipitation Extremes. J. Geogr. Sci. 2019, 29, 3–28. [Google Scholar] [CrossRef] [Green Version]
  23. Ma, Q.; Zhang, J.; Game, A.T.; Chang, Y.; Li, S. Spatiotemporal Variability of Summer Precipitation and Precipitation Extremes and Associated Large-Scale Mechanisms in Central Asia during 1979–2018. J. Hydrol. X 2020, 8, 100061. [Google Scholar] [CrossRef]
  24. Feng, R.; Yu, R.; Zheng, H.; Gan, M. Spatial and Temporal Variations in Extreme Temperature in Central Asia. Int. J. Climatol. 2018, 38, e388–e400. [Google Scholar] [CrossRef]
  25. Tian, Y.; Yan, Z.; Li, Z. Spatial and Temporal Variations of Extreme Precipitation in Central Asia during 1982–2020. Atmosphere 2022, 13, 60. [Google Scholar] [CrossRef]
  26. Yao, J.; Chen, Y.; Chen, J.; Zhao, Y.; Tuoliewubieke, D.; Li, J.; Yang, L.; Mao, W. Intensification of Extreme Precipitation in Arid Central Asia. J. Hydrol. 2021, 598, 125760. [Google Scholar] [CrossRef]
  27. Zhong, X.; Zhang, T.; Zheng, L.; Hu, Y.; Wang, H.; Kang, S. Spatiotemporal Variability of Snow Depth across the Eurasian Continent from 1966 to 2012. Cryosphere 2018, 12, 227–245. [Google Scholar] [CrossRef] [Green Version]
  28. Zhong, X.; Zhang, T.; Kang, S.; Wang, J. Spatiotemporal Variability of Snow Cover Timing and Duration over the Eurasian Continent during 1966–2012. Sci. Total Environ. 2021, 750, 141670. [Google Scholar] [CrossRef]
  29. Zolotokrylin, A.N.; Cherenkova, E.A. Seasonal Changes in Precipitation Extremes in Russia for the Last Several Decades and Their Impact on Vital Activities of the Human Population. Geogr. Environ. Sustain. 2017, 10, 69–82. [Google Scholar] [CrossRef] [Green Version]
  30. RIHMI-WDC Weather over the Territory of the Russian Federation in 2010. Available online: http://meteo.ru (accessed on 26 October 2022).
  31. WMO. Guidelines on the Calculation of Climate Normals. Available online: https://library.wmo.int/doc_num.php?explnum_id=4166 (accessed on 26 October 2022).
  32. Wang, X.L.; Feng, Y. RHtestsV4 User Manual. Available online: http://etccdi.pacificclimate.org/software.shtml (accessed on 26 October 2022).
  33. Wang, X.L. Accounting for Autocorrelation in Detecting Mean-Shifts in Climate Data Series Using the Penalized Maximal t or F Test. J. Appl. Meteorol. Climatol. 2008, 47, 2423–2444. [Google Scholar] [CrossRef]
  34. Wang, X.L. Penalized Maximal F-Test for Detecting Undocumented Mean-Shifts without Trend-Change. J. Atmos. Ocean. Technol. 2008, 25, 368–384. [Google Scholar] [CrossRef]
  35. Welch, B.L. The Generalization of ‘Student’s’ Problem When Several Different Population Variances Are Involved. Biometrika 1947, 34, 28–35. [Google Scholar] [CrossRef]
  36. Mann, H.B. Nonparametric Tests Against Trend. Econometrica 1945, 13, 245–259. [Google Scholar] [CrossRef]
  37. Kendall, M.G. Rank Correlation Methods, 4th ed.; Charles Griffin: London, UK, 1975; ISBN 978-0-85264-199-6. [Google Scholar]
  38. Sen, P.K. Estimates of the Regression Coefficient Based on Kendall’s Tau. J. Am. Stat. Assoc. 1968, 63, 1379–1389. [Google Scholar] [CrossRef]
  39. Ward, J.H. Hierarchical Grouping to Optimize an Objective Function. J. Am. Stat. Assoc. 1963, 58, 236–244. [Google Scholar] [CrossRef]
  40. Lomakina, N.Y.; Lavrinenko, A.V. Modern Trends of Temperature of the Atmospheric Boundary Layer over Siberia. Atmos. Ocean. Opt. 2022, 35, 378–386. [Google Scholar] [CrossRef]
  41. Fujinami, H.; Yasunari, T.; Watanabe, T. Trend and Interannual Variation in Summer Precipitation in Eastern Siberia in Recent Decades. Int. J. Climatol. 2016, 36, 355–368. [Google Scholar] [CrossRef]
  42. Ye, H.; Fetzer, E.J.; Wong, S.; Lambrigtsen, B.H. Rapid Decadal Convective Precipitation Increase over Eurasia during the Last Three Decades of the 20th Century. Sci. Adv. 2017, 3, e1600944. [Google Scholar] [CrossRef] [PubMed] [Green Version]
  43. Chernokulsky, A.; Kozlov, F.; Zolina, O.; Bulygina, O.; Mokhov, I.I.; Semenov, V.A. Observed Changes in Convective and Stratiform Precipitation in Northern Eurasia over the Last Five Decades. Environ. Res. Lett. 2019, 14, 045001. [Google Scholar] [CrossRef]
  44. Bulygina, O.N.; Groisman, P.Y.; Razuvaev, V.N.; Korshunova, N.N. Changes in Snow Cover Characteristics over Northern Eurasia since 1966. Environ. Res. Lett. 2011, 6, 045204. [Google Scholar] [CrossRef]
  45. Zhang, Y.; Ma, N. Spatiotemporal Variability of Snow Cover and Snow Water Equivalent in the Last Three Decades over Eurasia. J. Hydrol. 2018, 559, 238–251. [Google Scholar] [CrossRef]
  46. Dunn, R.J.H.; Alexander, L.V.; Donat, M.G.; Zhang, X.; Bador, M.; Herold, N.; Lippmann, T.; Allan, R.; Aguilar, E.; Barry, A.A.; et al. Development of an Updated Global Land In Situ-Based Data Set of Temperature and Precipitation Extremes: HadEX3. J. Geophys. Res. Atmos. 2020, 125, e2019JD032263. [Google Scholar] [CrossRef]
  47. Bormann, K.J.; Brown, R.D.; Derksen, C.; Painter, T.H. Estimating Snow-Cover Trends from Space. Nat. Clim. Chang. 2018, 8, 924–928. [Google Scholar] [CrossRef]
Figure 1. Summary of the trends in extreme climate events around Siberia, based on research conducted in previous studies [1,11,13,14,15,16,17,18,19,20,21,22,23,24,25,26].
Atmosphere 14 01131 g001
Figure 2. Study area and the distribution of weather stations in Russia. The circles represent the stations at which only temperature-related indexes were calculated, while the triangles represent the stations at which only precipitation-related indexes were calculated. Squares represent the stations at which all indexes were calculated. The colors indicate the three regions of Russia: European Russia (ER; red), Siberia (SI; green), and the Far East (FE; blue). The thick rectangle denotes the range of observation stations used in this study.
Atmosphere 14 01131 g002
Figure 3. Spatial distribution of the TX90P decadal trend (% per decade) from 1950 to 2019. The squares represent the stations that showed significant trends at the 5% level in a Mann–Kendall test. Triangles also represent the stations that had no significant trend at the 5% level in a Mann–Kendall test. The thick rectangle denotes the range of observation stations used in this study.
Atmosphere 14 01131 g003
Figure 4. Monthly averaged trends of (a) TX90P (%/decade) and (b) TX10P (%/decade) in 3 regions in 1950–2019. ER: European Russia; SI: Siberia; FE: the Far East.
Atmosphere 14 01131 g004
Figure 5. Monthly average trend of RX5day (mm/decade) in 3 regions in 1950–2019. ER: European Russia; SI: Siberia; FE: the Far East.
Atmosphere 14 01131 g005
Figure 6. Spatial distribution of the clusters based on the monthly trends of TX90P in 1950–2019 in the southern part of Siberia.
Atmosphere 14 01131 g006
Figure 7. Monthly averaged trends of TX90P by each cluster.
Atmosphere 14 01131 g007
Figure 8. Same symbology as in Figure 6 but for TX10P.
Atmosphere 14 01131 g008
Figure 9. Same symbology as in Figure 7 but for TX10P.
Atmosphere 14 01131 g009
Figure 10. Same symbology as in Figure 6 but for RX5DAY.
Atmosphere 14 01131 g010
Figure 11. Same symbology as in Figure 7 but for RX5DAY.
Atmosphere 14 01131 g011
Table 1. Descriptions of the climate indexes [12]. TX, TN, and PRCP represent the daily maximum temperature, daily minimum temperature, and amount of daily precipitation, respectively.
IndexDefinitionUnit
High-temperature-related indexes
TX90PPercentage of days when TX > 90th percentile of TX in 1961–1990%
TN90PPercentage of days when TN > 90th percentile of TN in 1961–1990%
WSDITotal number of days that TX exceeded the 90th percentile of TX in 1961–1990 for at least 6 consecutive daysDays
Low-temperature-related indexes
TX10PPercentage of days when TX < 10th percentile of TX in 1961–1990%
TN10PPercentage of days when TN < 10th percentile of TN in 1961–1990%
CSDITotal number of days that TN was below the 10th percentile of TN in 1961–1990 for at least 6 consecutive daysDays
Precipitation-related indexes
CDDMaximum length of a dry spell, maximum number of consecutive days with PRCP < 1 mmDays
CWDMaximum length of a wet spell, maximum number of consecutive days with PRCP ≥ 1 mmDays
RX5dayMonthly maximum 5-day precipitationmm
R95PAnnual total PRCP when PRCP > 95th percentile of PRCP in 1961–1990mm
PRCPTOTAnnual total precipitation in days with precipitation of 1 mm or moremm
Table 2. Decadal linear trends in the extreme indexes in the three regions from 1950 to 2019. The trend is the Sen’s slope estimator of extreme indexes. The trend values, which are highlighted in bold, indicate that the difference in the trend in climate indexes between Siberia and other regions is statistically significant at the 5% level. Z+ and Z− respectively represent the number of stations with positive or negative Z values in Mann–Kendall test. Numbers in parentheses denote those stations that are statistically significant at the 5% level. ER: European Russia, SI: Siberia, FE: the Far East.
ERSIFE
IndexUnitTrendZ+Z−TrendZ+Z−TrendZ+Z−
TX90P%0.9642(40)0(0)0.8156(52)0(0)0.8629(28)1(0)
TN90P%1.0942(41)0(0)1.0456(56)0(0)0.9330(29)0(0)
WSDIDays1.2342(39)0(0)0.2756(43)0(0)0.2729(19)1(0)
TX10P%−0.880(0)42(41)−0.770(0)56(53)−0.880(0)30(30)
TN10P%−0.821(1)41(41)−0.872(1)54(52)−1.020(0)30(28)
CSDIDays−0.121(0)41(31)−0.161(0)55(39)−0.051(0)29(20)
CDDDays−0.45(0)35(12)−1.011(0)54(28)−1.167(1)40(23)
CWDDays0.0638(20)2(0)0.0241(7)14(1)0.0229(8)18(0)
RX5DAYmm0.7235(10)5(0)032(5)23(2)0.9238(6)7(0)
R95Pmm4.7339(23)1(0)1.1838(8)17(2)3.7239(14)8(0)
PRCPTOTmm15.1339(35)1(0)7.8948(30)7(0)11.3142(26)5(0)
Disclaimer/Publisher’s Note: The statements, opinions and data contained in all publications are solely those of the individual author(s) and contributor(s) and not of MDPI and/or the editor(s). MDPI and/or the editor(s) disclaim responsibility for any injury to people or property resulting from any ideas, methods, instructions or products referred to in the content.

