Abstract
The socioeconomic impacts caused by floods in the south of Eastern Siberia (SES), and the expected increase in precipitation extremes over northern Eurasia, have revealed the need to search for atmospheric circulation patterns that cause extreme precipitation events (EPE) in SES, as well as their changes. We investigate the circulation patterns causing extreme precipitation in SES and Mongolia, by examining the instability and moisture transport associated with potential vorticity (PV) dynamics during two time periods: 1982–1998 and 1999–2019. The EPE were characterized by an increase in instability within the precipitation area, which was compensated by stability around the area, with the East Asian summer monsoon transport being enhanced. PV in the subtropical regions and mid-latitudes has shown the amplification of positive and negative PV anomalies to the southeast and northwest of Lake Baikal, respectively. The PV contours for EPE have shapes of cyclonic wave breaking and cutoff low. EPE accompanied by wave breaking are characterized by strong redistribution areas, with extremely high and low stability and moisture. This can lead to the coexistence of floods and droughts, and in part was the driver of the earlier revealed “seesaw” precipitation mode over Mongolia and SES. We suggest a shift of extreme precipitation to the northwest has occurred, which was probably caused by the wave propagation change.
1. Introduction
Catastrophic floods cause dramatic social and economic losses around the world. There has been a significant increase in the number of floods during the period of sharp climatic changes recorded in recent decades [1,2,3,4,5]. In Russia, many regions are at risk of floods of various origins [4]. In summer, rain floods play a unique role, especially flash floods [4]. The southern region of Eastern Siberia (SES) is especially vulnerable to rain floods and flash floods, as indicated by previous studies [6,7]. In the last five years, three exceptional hydrological events in SES have been recorded. In 2018, floods were recorded in Transbaikalia (July) and it was the first high-water year in the Lake Baikal basin since 1998 [8]. In 2019—floods in the Irkutsk region (June, July) [9,10,11]. The 2019 event is in the top five events in Russia in terms of damage caused [5]. As shown by some papers and Roshydromet’s reports, floods of such magnitude were not observed on the rivers in SES [8,9,10]. The floods in 2018 and 2019 were caused by extreme rainfall in June and July [8,9,10,11]. The causes, variability, frequency, and predictability of extreme precipitation events (EPE) are among the top concerns for decision-makers in many countries worldwide. EPE are often the cause of flash floods, which are considered to be one of the most dramatic hydrological phenomena [12].
The change in precipitation characteristics is one of the leading reasons for the increase in the frequency of extreme floods during abrupt climatic changes [3]. Warming of the troposphere, and an increase in its moisture content, due to climate change, have led to a change in the characteristics of precipitation in all regions of the globe, including northern Eurasia and Russia [13,14,15,16,17,18,19,20]. The authors of [14,15] have demonstrated that the key characteristics of summer precipitation in northern Eurasia are characterized by an increase in heavy rainfall frequency and prolonged no-rain periods, so precipitation becomes less uniform and stable. The authors of [17] showed the changes in convective and stratiform precipitation in Northern Eurasia over the last five decades. The authors concluded that there had been an increase in convective precipitation and shift of precipitation type toward more heavy showers. The authors of [17,21,22,23] demonstrated the important role of atmospheric dynamics in the formation of these key changes. Thus, as shown by the results in [23], the changes in the severity of precipitation under the influence of climatic changes are heterogeneous. Consequently, the circulation patterns causing the varying intensity of precipitation should be revealed for every specific region. Estimates of the leading circulation patterns, along with estimates of precipitation changes, are needed, to identify regions most vulnerable to climate change, for further mitigation and adaptation to these changes [24].
Two dramatic flood events (2018 and 2019) have made us realize that there is a significant gap in the uniform conceptions of circulation patterns causing extreme precipitation in SES. Thus, the present paper is intended to collate the existing knowledge on the formation of extreme precipitation in SES, and supplement it.
In general, precipitation intensity depends on ascent conditions (instability) and the water content of air masses. The three main mechanisms of air instability generation are local heating, orography (movement of air up the slopes of mountains), and large-scale potential vorticity (PV) dynamics [8]. SES is located on the border of boreal summer cyclone circulation, the arid belt of Asia, and the northern border of the East Asian summer monsoon (EASM) [25]. Papers addressing the atmospheric circulation patterns of precipitation in SES, and neighboring regions, have shown the significant role of cyclonic activity in activating monsoonal air masses of eastern and southeastern origin, as well as in the northward propagation of EASM, in the formation of precipitation [26,27,28,29]. A limited number of papers [8,11] (and the review of these papers) have shown that cyclones associated with a large amount of precipitation are formed under deep intrusions of polar air. These conditions occur when two air masses of different origins, polar and subtropical, come into contact, resulting in high baroclinicity. In [8], a special case of Mongolian cyclogenesis is considered. Cyclones are influenced by the deep intrusion of polar air masses, originating in Mongolia and then moving to SES, where they cause a large amount of precipitation. Additionally, the orography of the region can contribute to the growth of instability associated with fronts [8].
In addition, the papers [30,31] demonstrate the relationship between precipitation in SES and Mongolia. Empirical orthogonal function (EOF) analysis of the precipitation field [31] has revealed that up to 50% of the variability of precipitation is due to the mode, called by the authors [30], a “seesaw”. An increase in precipitation in Mongolia is accompanied by a decrease in SES and vice versa. The authors of [30,31] showed that the seesaw mode is caused by upper tropospheric forcing, via subtropical and mid-latitude waveguides’ configurations, and their changes. Therefore, it is practical to study the mechanisms causing extreme precipitation in SES, together with their study in Mongolia. Additionally, it is important to note that the authors of [31,32] have shown that the hydroclimatic conditions, and atmospheric circulation patterns, over Eurasia have significantly changed since the mid-1990s. Therefore, it is important to take into account this shift, in the analysis of the mechanisms that cause extreme precipitation in SES, and its relationship with Mongolia.
Thus, previous studies point to a crucial role of dynamic factors in the formation of the most significant precipitation in SES, which is in agreement with the results obtained for mid-latitudes. The dynamics of the atmosphere are well described through the analysis of PV contours on isentropic surfaces [33]. PV analysis is especially necessary for extreme situations involving large-scale dynamics, such as wave breaking and blocking. Inversion of PV contours is typically caused by strong advection perturbations. Air masses with high PV (with properties of polar air, lower stratosphere) penetrate to the south, and air masses with low PV from tropical latitudes (tropospheric air) penetrate to the pole. The final stage of the overturning (breaking) is marked by a strong geopotential gradient inversion in the middle atmosphere, known as blocking. The processes of non-linear wave amplification and irreversible deformation of PV contours, are known as Rossby wave breaking (RWB) [34]. According to the directions of high and low PV intrusion, RWBs usually are divided into anticyclonic wave breaking (AWB) and cyclonic wave breaking (CWB) types. CWB is characterized by the intrusion of an air mass with high PV from the northwest to the southeast, while in AWB, it intrudes from the northeast to the southwest. Two main objects associated with breaking are PV streamers and cutoff low (COL) formation. PV streamers are elongated regions of high PV that protrude from a region of broken PV contours, while COL formation is the development of a closed low-pressure system within a region of broken PV contours. Thorncroft et al. (1993) [34] demonstrated how the life cycle of cyclones is related to wave-breaking processes. A comprehensive study of features associated with RWB and extreme precipitation was demonstrated in [35]. RWB causes a strengthening of moisture transport and ascent, by reducing static stability (positive anomalies of PV in the upper troposphere). The waves breaking, and the inversion of geopotential height in the middle and upper troposphere, are most frequent in Siberia, in the middle of the summer [36]. Chiy et. al. (2018) [36] showed that precipitation in mid-summer (July, August) is forced by both types of waves breaking.
Our study focuses on analyzing the circulation patterns associated with EPE in SES and Mongolia during the periods of 1982–1998 and 1999–2019. Specifically, we examine the instability and moisture transport related to the PV dynamics. The paper is organized as follows. In Section 2 we show the data and methods that were applied in these study; in Section 3—the data and results; and in Section 4—the discussion and conclusions.
2. Data and Methods
2.1. Precipitation
We used GPCC (Global Precipitation Climatology Centre) data [37,38], ver. 2020. The dataset consists of ground-based observations of daily precipitation, which were quality-controlled and then interpolated onto a grid, with a resolution of 1° × 1°. The dataset covers the years 1982 to 2019. Paper [39] showed the GPCC data are in the best agreement with the data of Siberian meteorological stations (RIHMI-WDC—All-Russian Research Institute of Hydrometeorological Information—World Data Center) for the period of 1979–2018. We compared the obtained distributions of extreme precipitation based on GPCC with those obtained using the ERA5 reanalysis [39], with a resolution of 0.25° × 0.25°. The data show good qualitative agreement, but the model (ERA5) significantly underestimates the values. This outcome is consistent with the results of [39].
There are several approaches to estimating the extremeness of precipitation [24,39]. Calculating percentile values has a major advantage when there is a need to operate with gridded data [21,22]. We calculated the 99th percentile of precipitation for every grid point, for every summer season (JJA) from 1982 to 2019. The areas of precipitation, to which the P = 1% event belongs, were reconstructed by gradual filling. The obtained EPE were grouped as follows: M—Mongolia, SES-M—border of Mongolia and south of Eastern Siberia, SES—south of Eastern Siberia (Figure 1). For the identified EPE, a temporal specification was suggested. We divided EPE according to the number of days with 99th percentile—1-day precipitation (1-day EPE) and 2 or 3-day precipitation (2-day EPE). So we operated with six based groups: M2 and 1, SES-M1 and 2, SES1 and 2. Index 1 and 2 correspond to 1-day and 2 or more-day EPE. Events, by groups, are given in [40]. Most EPE events occur in the middle of summer, between June 20 and August 20 (85%). The largest number of events occurs in July (45%), and the least in June (17.5%). Before discussing the circulation pattern, it should be noted that no events were found for the M2 group after 1998. In order to compare two periods 1982–1998 (16 years) and 1999–2019 (21 years), the total precipitation was normalized to the number of years.
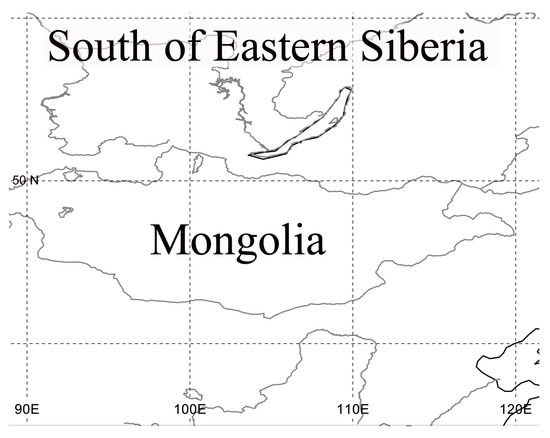
Figure 1.
The map of the region under study.
2.2. Atmopsheric Circulation
We used 6-hourly ERA5 data [41], with a spatial resolution of 1.5° × 1.5°. The following parameters were used: total column water, vertical velocity at 500 hPa, u and v wind components at 850 hPa, vertical integral northward and eastward water vapor flux, and PV at 330 and 350 K. Based on the vertical integral northward and eastward water vapor flux we obtained the water vapor transport. According to [42,43], the levels of 330 and 350 K cross PV contours in the mid-latitudes and subtropics, respectively. Consequently, the dynamics of PV contours at 330 K characterize the mid-latitude waves’ amplification and breaking, and at 350 K—the subtropical. We applied composite analysis, which is one of the primary methods for detecting circulation patterns, in this study [24].
Additionally, for some important cases, we analyzed the weather maps that were provided by regional divisions of Roshydromet, along with hourly PV dynamics at 330 and 350 K. As noted in the introduction, PV contours allow the detection of two main objects that cause an increase in instability: waves breaking and COL. Based on the synoptic analysis, wave breaking can be identified by the shape of deformation, as shown in [34], and the intrusion direction, and the COLs are recognized when there is a closed 2 PVU area [44].
3. Results
The average precipitation and anomalies of vertical velocity (VV) at 500 hPa are shown in Figure 2. The positive anomalies of VV correspond to descending motions, and negative anomalies to ascending motions. The areas with high precipitation are characterized by increased ascending motions (instability of troposphere). While the areas without precipitation are characterized by amplification of descending motions (stability of troposphere). Anomalies of vertical velocities were also calculated at other geopotential heights, the maximum deviations were found in the 500–400 hPa layer. The areas of stability and instability are more intense for 2-day EPE groups (Figure 2a–e) compared to 1-day groups (Figure 2f–k).
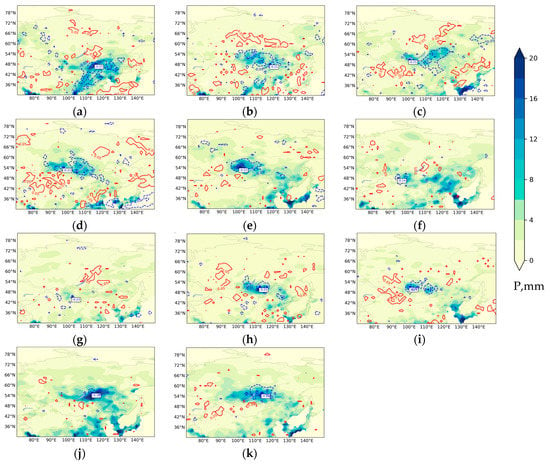
Figure 2.
The average precipitation (P, mm) and anomalies of vertical velocity at 500 hPa (90% confidence level). The dashed blue lines show increasing ascending motions, and solid red lines show descending motions. The white rectangle shows the maximum increase in ascending motions. (a) M2 (1982–1998), (b) SES-M2 (1982–1998), (c) SES-M2 (1999–2019), (d) SES2 (1982–1998), (e) SES2 (1999–2019), (f) M1 (1982–1998), (g) M1 (1999–2019), (h) SES-M1 (1982–1998), (i) SES-M1 (1982–1998), (j) SES1 (1982–1998), (k) SES1 (1999–2019).
The individuality of precipitation–VV patterns should be considered. First of all, the spatial distribution of average precipitation and VV anomalies for the first period (1982–1998) demonstrates that eastern Mongolia is located on the northwest periphery of a large area with high average precipitation and instability, located in East Asia (Figure 2a). The most intense processes are observed on the border between northern China and Mongolia. The M2 group was not found for the second period (1999–2019). The average precipitation for M1 events in 1982–1998 in eastern Mongolia was lower than in 1999–2019 (Figure 3a). The third part of events in the second period occurred in 2018, which was not typical [8]. Therefore, we suppose that the comparison of periods is not entirely correct and needs further analysis. For SES-M1 and 2 events, the maximum VV has shifted to the west (Figure 2b,c,h,i), such shifting is also typical for precipitation SES-M1 (Figure 3c); for the SES-M2 (Figure 3b) the main precipitation area has moved to the north. For SES2, the average precipitation in the period of 1999–2019 is concentrated in a narrow area east of 100 °E, as shown in Figure 3d. However, it should be noted that about a quarter of the events in this group occurred during the anomalous year of 2019, and should therefore be taken into consideration for further analysis.
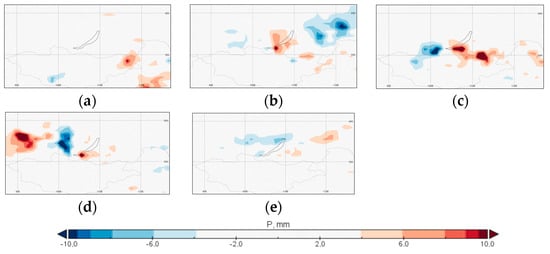
Figure 3.
The difference in precipitation between two periods (1982–1998 and 1999–2019). (a) M1, (b) SES-M2, (c) SES-M1, (d) SES2, (e) SES 1. Negative values (blue) correspond to location maxima in 1999–2019, and positive values (red) in 1982–1998.
The average streamlines at 850 hPa and water vapor transport, are shown in Figure 4. With the exception of the M1 group (Figure 4f,g here the pattern is less pronounced), the areas of convergence of the vast cyclonic-like stream correspond to the maximum precipitation and instability. Most of the composites show anticyclonic circulation in the area of descending motions. The cyclonic-like streams have origins in the mid- (and polar-) latitudes and in East Asia. The strong southeasterly flow obtained for EPE can be associated with the EASM increasing (traditional Chinese meaning of a strong EASM—an abnormal northward extension of a southerly over northern China [45]). The moisture transport is greatest for 2-day precipitation groups, especially for the M2 and SES-M2 in the first period (1982–1998) (Figure 4a,b). The SES-M2 groups in the second period (1999–2019) (Figure 4c), and ES2 for both periods (Figure 4d,e), are characterized by two lines of water transport increasing. The first line is related to the instability area over the SES-M region and the second one is located in the Mei-yu frontal area [45].
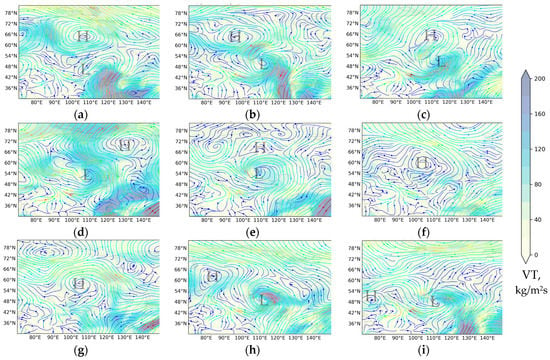

Figure 4.
The average streamlines at 850 hPa and water vapor transport. (a) M2 (1982–1998), (b) SES-M2 (1982–1998), (c) SES-M2 (1999–2019), (d) SES2 (1982–1998), (e) SES2 (1999–2019), (f) M1 (1982–1998), (g) M1 (1999–2019), (h) SES-M1 (1982–1998), (i) SES-M1 (1982–1998), (j) SES1 (1982–1998), (k) SES1 (1999–2019). The cyclonic and anticyclonic rotating areas are shown by letters L and H, respectively.
Figure 5 demonstrates the PV anomalies accompanying the EPE formation. The negative anomalies correspond to regions of PV decrease, and the positive anomalies to regions of PV increase. It should be noted that lower PV is typical for low latitudes, and higher for high latitudes. There are common patterns in PV anomalies, that are strongly pronounced for 2-day precipitation groups and less so for 1-day groups. The negative anomalies are located south/southeast of Lake Baikal, and positive to the west and northwest. With the exception of the SES2 group, in the period 1999–2019, compared to 1982–1999, positive PV anomalies at 330 K (Figure 5c,i,k) are more characteristic. So EPE accompanied the presence of two opposite PV anomalies, which can be associated with the wave amplitude amplification. The shapes of amplification of PV anomalies (Figure 5b–d,e,h,i,k) are similar to a CWB [36]. The CWB has a significant influence on precipitation east of Baikal [36]. Moreover, [43,46] showed the maximum areas of CWB frequency to be east of Lake Baikal.
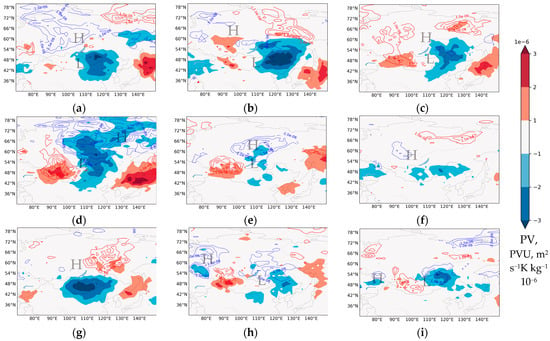

Figure 5.
The anomalies of PV at 330 K (blue dashed lines—negative, red—positive) and 350 K (filling) (90% confidence level). (a) M2 (1982–1998), (b) SES-M2 (1982–1998), (c) SES-M2 (1999–2019), (d) SES2 (1982–1998), (e) SES2 (1999–2019), (f) M1 (1982–1998), (g) M1 (1999–2019), (h) SES-M1 (1982–1998), (i) SES-M1 (1982–1998), (j) SES1 (1982–1998), (k) SES1 (1999–2019). The cyclonic and anticyclonic rotating areas are shown by letters L and H, respectively, according to Figure 4.
We analyzed the dynamics of the contours at two levels, 330 and 350 K, to clarify the forms of their transformation for cases of extreme precipitation. The vorticity contours 2–6 PVU, according to the groups, are given in [47].
The synoptic analysis of PV anomalies and contours (2–6 PVU) easily identifies the neighborhood of areas with opposite vorticities. In addition, it was revealed that CWB and COL areas of PV are often observed for EPE, especially for 2-day extremes. Table 1 shows the main elements accompanying the 2-day EPE. The shapes of breaking, amplitudes, and intensity are different for the level of 330 and 350 K for each case. These elements require an individual analysis of the processes of cyclogenesis, which could determine the degree of the extremeness of the processes.

Table 1.
The 2-day EPE and the PV shapes.
In this paper, we present well-defined regularities and examples associated with the most extreme precipitation, which are shown in Table 1 (M2, SES-M2, and SES2). The stronger deformations of PV contours are characterized for these groups (Figure 4). The object of close attention is the main difference between these groups’ events, associated with the areas of positive PV (higher vorticity compared to the average) at 330 K and 350 K. Two cases (Figure 6) demonstrate two types of patterns of PV contours. In the first case (Figure 6a,b), the PV contours and anomalies for 330 and 350 K show the two different structures. Subtropical dynamics are characterized by the PV gradient inversion, with the directions of PV intrusions corresponding to CWB. In the mid-latitudes of Eastern Siberia, PV contours have a vast Ω-shape, with negative PV anomalies in the center and positive on both sides of these shapes. In the second case (Figure 6c,d) the contours and anomalies of PV for 330 and 350 K show similar configurations. The positive anomalies are higher for contours at 330 K and negative for 350 K. The inversion of PV contours is characterized for both levels, and the directions of PV intrusions correspond to CWB. These cases, demonstrating the two types of wave propagation, can be useful for further analysis of wave patterns. Composite analysis (Figure 5) and synoptic analysis of individual cases [47] have shown that the first type is associated with precipitation in Mongolia and SES-M in 1982–1998, and the second type for SES-M in 1999–2019 and for SES in both periods.
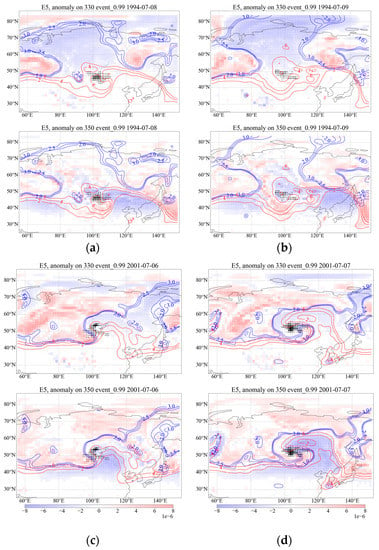
Figure 6.
Event 1: 8th (a) and 9th (b) July 1994; and event 2: 6th (c) and 7th (d) July 2001. 2–6 PVU contours are shown: red—350 K, blue—330 K. The anomalies of PV are shown by filling, at 330 K (upper figure) and 350 K (lower figure). The black dots correspond to the precipitation areas.
To reveal the differences in the main characteristics contributing to precipitation for these events, we analyzed the weather maps, vertical motions, and water content. The synoptic analysis, performed using the archived synoptic bulletins, has uncovered the primary distinctions between the two situations. The precipitation in the 1994 case, characterized by an inversion of PV at 350 K, was accompanied by a weak sea level pressure gradient and high near-surface temperature (+27–+35 °C). Thus, it is hypothesized that the rainfall was associated with local overheating and the development of mesoscale convective complexes. The strong precipitation for the second case (2001), was caused by the cyclonic dynamics, with strong pressure gradients, and most of the rainfall was associated with the low center. We estimated the total column water and vertical velocities for these cases (Figure 7). In the 2001 case, updraft areas, and areas of compensating downdrafts, were significantly higher than in 1994 for all synoptic hours. Both cases were characterized by high water content, reaching 40 kg/m2. In the 2001 case, the maximum water content (6.07 18 UTC) reached 50 kg/m2.
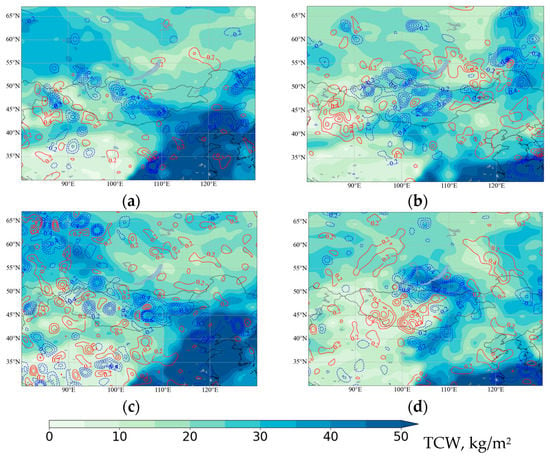
Figure 7.
Total column water (filled) and vertical velocity at 500 hPa (red—descending motions, blue—ascending) for 1st case (1994) (a) 8th July 0 UTC, (c) 12 UTC; and 2nd case (2001) (b) 6th July 0 UTC, (d) 18 UTC.
In these two cases, an important point is the source of the main moisture. In the case of 1994, the source is the monsoon system (Figure 7a,c), and in the second case (Figure 7b,d), in the process of breaking and cyclogenesis, the moisture of a vast area is accumulated in a narrow band in front of a high PV intrusion. Figures available in [48] provide a visual representation of the dynamics of the development of vertical velocities and moisture content, which can be analyzed to better understand the mechanisms driving extreme precipitation events in the region. We suppose that, for both cases, the precipitation was dynamically forced, due to upper tropospheric forcing (Figure 6). However, in the first case, the presence of a well-developed monsoon system, with increased moisture content, played an important role, and in the second, more significant baroclinic disturbances with strong ascending motions were important.
4. Discussion and Conclusions
The socioeconomic impacts caused by floods in SES prompted us to search for the main atmospheric circulation patterns that contribute to extreme precipitation in the summer months (June–August). Expected increases in precipitation extremes over northern Eurasia have highlighted the need not only to search for atmospheric patterns accompanying these extremes, but also to investigate how they are changing over time. The review of previous studies of crucial factors contributing to summer precipitation in SES has demonstrated the key role of dynamics factors (cyclogenesis, fronts), and moisture transport from the regions located southeast of Lake Baikal. The latter can be associated with the increasing northward East Asia summer monsoon moisture extension, forced by cyclonic activity around Lake Baikal. Besides, it demonstrated the seesaw precipitation mode between Mongolia and SES: an increase in precipitation in Mongolia is accompanied by a decrease in SES and vice versa. Moreover, a change in the precipitation mode at end of the 1990s was also revealed. The shift in precipitation mode is probably associated with the change in wave propagation over Eurasia.
Our study is significant, as it provides the first analysis of the circulation patterns leading to extreme precipitation events in Eastern Siberia and Mongolia. Specifically, we examine the role of instability and moisture transport associated with PV dynamics during two distinct time periods: 1982–1998 and 1999–2020. By doing so, we aim to enhance our understanding of the underlying mechanisms driving such events, and to inform future research and decision-making in the region. The EPE were characterized by an increase in instability within the precipitation area, which was compensated by stability around the area, with the East Asian summer monsoon transport being enhanced. These outcomes are in agreement with previous studies of water transport to Lake Baikal [26,27,28,29], and the abnormal northward extension of southerlies over northern China, is associated with cyclonic activity and mid-latitude wave propagation [28]. Composites of PV anomalies in the subtropical area and in mid-latitudes, showed the amplification of positive and negative PV southeast and northwest of Lake Baikal, respectively. It was additionally revealed, that the PV contours for EPE have shapes of CWB and/or COL. The role of CWB for precipitation east of Lake Baikal was revealed in [36], and it was also demonstrated that, east of Baikal there is an area with a high frequency of CWB [43,46]. We guess that the breaking is preceded by wave propagation from the Euro-Atlantic region, since at 350 K, particularly the 2-day group is characterized by the alternation of positive and negative PV. These suggestions agreed with [36], that showed the wave train pattern preceded the two types of breaking in East Asia. The types of wave propagation patterns across Eurasia were reviewed in part in [49]. The evidence discussed above, suggests that changes in precipitation patterns in the Siberian and Mongolian regions can serve as important indicators for wave propagation in the atmosphere. This, in turn, makes these regions vulnerable to the impacts of climate change, both now and in the future.
Our analysis suggests a northward or westward shift (depending on the group) in the location of extreme precipitation events. This conclusion is supported by the observed trend in the main modes of variability of total monthly precipitation in July, which show increases in Siberia and decreases in Mongolia [31]. The exception is July 2018, when extreme precipitation was recorded both in Eastern Siberia and Mongolia [8]. The summer of 2019 is a major example of a shift—three events of 2-day extreme precipitation (99th percentile) were recorded in southern Siberia, without affecting the Mongolia area. We emphasize that these are preliminary results and this issue requires more extensive research. Previous studies [14,15] have suggested that, under the influence of climate change, the probability of extreme precipitation events may increase, but there may be longer periods of dryness between EPE.
The analysis of water content and transport, along with PV, for the most extreme EPE, has revealed that there were at least two different types of circulation patterns that contributed to the occurrence of extreme precipitation. The first type of pattern is characterized by high water content over East Asia and the maxima of EASM intensification. Subtropical dynamics are characterized by a PV gradient inversion, with the directions of PV intrusions corresponding to CWB. In mid-latitudes of Eastern Siberia, PV contours have a vast Ω-shape, with negative PV anomalies in the center and positive anomalies on both sides of these shapes. The second type of pattern is characterized by two lines of increasing water transport: in the south (30 °N), associated with the monsoon system, and in the north (50° N), forced by a large cyclonic instability area. Both subtropical and mid-latitude contours of PV have CWB shapes. Both types are characterized by strong redistribution of extremely high and low precipitation over Siberia, Mongolia, and adjacent regions, which can lead to neighborhoods of floods and droughts. Composite analysis and individual cases, have shown that the first type is associated with M2 and SES-M2 groups in 1982–1998 and the second type with SES-M2 in 1999–2019, and for SES2 in both periods. The first type, which is characterized by PV contour overturning only at 350 K, can be associated with the concept of two opposite waves over Siberia and Mongolia [30]. Negative PV anomalies at 330 K suppress precipitation over Eastern Siberia, while a PV inversion over Mongolia promotes high precipitation. The second case, in which both levels are simultaneously involved in breaking processes, demonstrated similar wave propagation for both subtropical and mid-latitude regions. Hence, we suppose that there are changes in wave propagation properties that agreed with previous studies [31,32] and are supported by current papers [50]. Our work has revealed an important relationship between the characteristics of wave propagation and synoptic processes that occur during EPE in Mongolia and SES. In our research, we found evidence to support the idea that mesoscale convection, which refers to thunderstorms, and other types of convective activity on a smaller scale, can be driven by upper-level large-scale circulation anomalies [24]. This means that the weather patterns and conditions occurring in the upper atmosphere, can have a significant impact on the formation and behavior of thunderstorms at a smaller scale. This finding is important because it suggests that forecasting and predicting these types of weather events may require considering not just local conditions, but also larger-scale atmospheric patterns and dynamics.
In the future, our plan is to further generalize the synoptic cases, and analyze the teleconnection patterns’ characteristics [49,51,52] for the two periods of precipitation groups identified in this study.
Author Contributions
Conceptualization, O.A. and P.A.; methodology, P.A.; software, P.A. and A.G.; validation, A.Z., T.G. and O.A.; formal analysis, O.A. and T.G.; investigation, O.A. and T.G.; resources, P.A. and A.G.; data curation, P.A.; writing—original draft preparation, O.A.; writing—review and editing, O.A.; visualization, P.A. and A.G.; supervision, O.A.; project administration, O.A.; funding acquisition, O.A. All authors have read and agreed to the published version of the manuscript.
Funding
This research was funded by the RSF, grant number 23-27-00167 https://rscf.ru/en/project/23-27-00167/.
Institutional Review Board Statement
Not applicable.
Informed Consent Statement
Not applicable.
Data Availability Statement
Acknowledgments
We would like to express our gratitude to the three anonymous reviewers whose comments and suggestions greatly helped to improve the quality and clarity of this manuscript.
Conflicts of Interest
The authors declare no conflict of interest.
Abbreviations
| SES | south of Eastern Siberia |
| EPE | extreme precipitation events |
| PV | potential vorticity |
| CWB | cyclonic wave breaking |
| AWB | anticyclonic wave breaking |
| COL | cut-off low |
| M (1 and 2) | EPE that were observed in Mongolia |
| SES-M (1 and 2) | EPE that were observed in area of border between SES and Mongolia |
| SES (1 and 2) | EPE that were observed in SES |
References
- Field, C.B.; Barros, V.; Stocker, T.F.; Dahe, Q. Managing the Risks of Extreme Events and Disasters to Advance Climate Change Adaption: Special Report of the Intergovernmental Panel on Climate Change; Cambridge University Press: Cambridge, UK, 2012. [Google Scholar]
- Arnell, N.W.; Gosling, S.N. The impacts of climate change on river flood risk at the global scale. Clim. Chang. 2014, 134, 387–401. [Google Scholar] [CrossRef]
- Tabari, H. Author correction: Climate change impact on flood and extreme precipitation increases with water availability. Sci. Rep. 2020, 10, 16969. [Google Scholar] [CrossRef]
- Frolova, N.L.; Kireeva, M.B.; Magrickiy, D.V.; Bologov, M.B.; Kopylov, V.N.; Hall, J.; Semenov, V.A.; Kosolapov, A.E.; Dorozhkin, E.V.; Korobkina, E.A.; et al. Hydrological hazards in Russia: Origin, classification, changes and risk assessment. Nat. Hazards 2016, 88, 103–131. [Google Scholar] [CrossRef]
- Grigorieva, E.A.; Livenets, A.S. Risks to the health of russian population from floods and droughts in 2010–2020: A scoping review. Climate 2022, 10, 37. [Google Scholar] [CrossRef]
- Korytny, L.M.; Kichigina, N.V. Geographical analysis of river floods and their causes in southern East Siberia. Hydrol. Sci. J. 2006, 51, 450–464. [Google Scholar] [CrossRef]
- Kichigina, N.V. Flood Hazard on the Rivers of the Baikal Region. Geogr. Nat. Resour. 2018, 39, 120–129. [Google Scholar] [CrossRef]
- Antokhina, O.Y.; Latysheva, I.V.; Mordvinov, V.I. A Cases Study of mongolian cyclogenesis during the july 2018 blocking events. Geogr. Environ. Sustain. 2019, 12, 66–78. [Google Scholar] [CrossRef]
- Fedorova, A.; Makarieva, O.; Nesterova, N.; Shikhov, A.; Vinogradova, T. Modelling maximum discharge of the catastrophic flood at the Iya River (Irkutsk region, Russia) in 2019. E3S Web Conf. 2020, 163, 01004. [Google Scholar] [CrossRef]
- Vilfand, R.M.; Kulikova, I.A.; Makarova, M.E. Weather and climate features of the northern hemisphere in 2019 in the context of long-period variability. IOP Conf. Ser. Earth Environ. Sci. 2020, 606, 012067. [Google Scholar] [CrossRef]
- Kononova, N.K. Weather extremums in Siberia in 2019 and their connection with circulation of the atmosphere. Environ. Dyn. Glob. Clim. Chang. 2019, 10, 110–119. [Google Scholar] [CrossRef]
- Kelsch, M.; Caporali, E.; Lanza, L.G. Hydrometeorology of flash floods. In Coping with Flash Floods; Springer: Dordrecht, The Netherlands, 2001; pp. 19–35. [Google Scholar] [CrossRef]
- Myhre, G.; Alterskjær, K.; Stjern, C.W.; Hodnebrog, Ø.; Marelle, L.; Samset, B.H.; Sillmann, J.; Schaller, N.; Fischer, E.; Schulz, M.; et al. Frequency of extreme precipitation increases extensively with event rareness under global warming. Sci. Rep. 2019, 9, 16063. [Google Scholar] [CrossRef] [PubMed]
- Groisman, P.Y.; Knight, R.W.; Easterling, D.R.; Karl, T.R.; Hegerl, G.C.; Razuvaev, V.N. Trends in intense precipitation in the climate record. J. Clim. 2005, 18, 1326–1350. [Google Scholar] [CrossRef]
- Groisman, P.; Shugart, H.; Kicklighter, D.; Henebry, G.; Tchebakova, N.; Maksyutov, S.; Monier, E.; Gutman, G.; Gulev, S.; Qi, J.; et al. Northern Eurasia Future Initiative (NEFI): Facing the challenges and pathways of global change in the twenty-first century. Prog. Earth Planet. Sci. 2017, 4, 41. [Google Scholar] [CrossRef]
- Aleshina, M.A.; Semenov, V.A.; Chernokulsky, A.V. A link between surface air temperature and extreme precipitation over Russia from station and reanalysis data. Environ. Res. Lett. 2021, 16, 105004. [Google Scholar] [CrossRef]
- Chernokulsky, A.; Kozlov, F.; Zolina, O.; Bulygina, O.N.; Mokhov, I.I.; Semenov, V.A. Observed changes in convective and stratiform precipitation in Northern Eurasia over the last five decades. Environ. Res. Lett. 2019, 14, 045001. [Google Scholar] [CrossRef]
- Khlebnikova, E.I.; Rudakova, Y.L.; Shkolnik, I.M. Changes in precipitation regime over the territory of Russia: Data of regional climate modeling and observations. Russ. Meteorol. Hydrol. 2019, 44, 431–439. [Google Scholar] [CrossRef]
- Zolotokrylin, A.; Cherenkova, E. Seasonal changes in precipitation extremes in russia for the last several decades and their impact on vital activities of the human population. Geogr. Environ. Sustain. 2017, 10, 69–82. [Google Scholar] [CrossRef]
- Shikhov, A.N.; Abdullin, R.K.; Tarasov, A.V. Mapping temperature and precipitation extremes under changing climate (on the example of The Ural region, Russia). Geogr. Environ. Sustain. 2020, 13, 154–165. [Google Scholar] [CrossRef]
- Catto, J.L.; Pfahl, S. The importance of fronts for extreme precipitation. J. Geophys. Res. Atmos. 2013, 118, 10791–10801. [Google Scholar] [CrossRef]
- Pfahl, S.; Wernli, H. Quantifying the relevance of cyclones for precipitation extremes. J. Clim. 2012, 25, 6770–6780. [Google Scholar] [CrossRef]
- Pfahl, S.; O’Gorman, P.A.; Fischer, S.P.E.M. Understanding the regional pattern of projected future changes in extreme precipitation. Nat. Clim. Chang. 2017, 7, 423–427. [Google Scholar] [CrossRef]
- Barlow, M.; Gutowski, W.J.; Gyakum, J.R.; Katz, R.W.; Lim, Y.-K.; Schumacher, R.S.; Wehner, M.F.; Agel, L.; Bosilovich, M.; Collow, A.; et al. North American extreme precipitation events and related large-scale meteorological patterns: A review of statistical methods, dynamics, modeling, and trends. Clim. Dyn. 2019, 53, 6835–6875. [Google Scholar] [CrossRef]
- Wang, Z.; Fu, Z.; Liu, B.; Zheng, Z.; Zhang, W.; Liu, Y.; Zhang, F.; Zhang, Q. Northward migration of the East Asian summer monsoon northern boundary during the twenty-first century. Sci. Rep. 2022, 12, 10066. [Google Scholar] [CrossRef]
- Berezhnykh, T.V.; Marchenko, O.Y.; Abasov, N.V.; Mordvinov, V.I. Changes in the summertime atmospheric circulation over East Asia and formation of long-lasting low-water periods within the Selenga River basin. Geogr. Nat. Resour. 2012, 33, 223–229. [Google Scholar] [CrossRef]
- Osipova, O.P.; Osipov, E.Y. Atmospheric circulation processes and precipitation regime in the northern part of the Baikal Mountain Region. Russ. Meteorol. Hydrol. 2019, 44, 695–703. [Google Scholar] [CrossRef]
- Chen, H.; Teng, F.; Zhang, W.; Liao, H. Impacts of anomalous midlatitude cyclone activity over East Asia during summer on the decadal mode of East Asian summer monsoon and its possible mechanism. J. Clim. 2017, 30, 739–753. [Google Scholar] [CrossRef]
- Mokhov, I.I.; Shukurov, K. Potential sources of precipitation in Lake Baikal basin. In Proceedings of the 23rd International Symposium on Atmospheric and Ocean Optics: Atmospheric Physics 2017, Irkutsk, Russia, 3–7 July 2017. [Google Scholar] [CrossRef]
- Iwao, K.; Takahashi, M. A Precipitation seesaw mode between Northeast Asia and Siberia in summer caused by rossby waves over the Eurasian continent. J. Clim. 2008, 21, 2401–2419. [Google Scholar] [CrossRef]
- Antokhina, O.Y.; Antokhin, P.N.; Martynova, Y.V.; Mordvinov, V.I. The linkage of the precipitation in the Selenga River Basin to midsummer atmospheric blocking. Atmosphere 2019, 10, 343. [Google Scholar] [CrossRef]
- Schubert, S.D.; Wang, H.; Koster, R.D.; Suarez, M.J.; Groisman, P.Y. Northern Eurasian heat waves and droughts. J. Clim. 2014, 27, 3169–3207. [Google Scholar] [CrossRef]
- Hoskins, B.J.; McIntyre, M.E.; Robertson, A.W. On the use and significance of isentropic potential vorticity maps. Q. J. R. Meteorol. Soc. 2007, 111, 877–946. [Google Scholar] [CrossRef]
- Thorncroft, C.D.; Hoskins, B.J.; McIntyre, M.E. Two paradigms of baroclinic-wave life-cycle behaviour. Q. J. R. Meteorol. Soc. 1993, 119, 17–55. [Google Scholar] [CrossRef]
- de Vries, A.J. A global climatological perspective on the importance of Rossby wave breaking and intense moisture transport for extreme precipitation events. Weather. Clim. Dyn. 2021, 2, 129–161. [Google Scholar] [CrossRef]
- Chyi, D.; Xie, Z.; Shi, N.; Guo, P.; Wang, H. Wave-breaking features of blocking over central Siberia and its impacts on the precipitation trend over southeastern lake Baikal. Adv. Atmos. Sci. 2019, 37, 75–89. [Google Scholar] [CrossRef]
- Schneider, U.; Finger, P.; Meyer-Christoffer, A.; Rustemeier, E.; Ziese, M.; Becker, A. Evaluating the Hydrological cycle over land using the newly-corrected precipitation climatology from the global precipitation climatology centre (GPCC). Atmosphere 2017, 8, 52. [Google Scholar] [CrossRef]
- Prakash, S.; Gairola, R.M.; Mitra, A.K. Comparison of large-scale global land precipitation from multisatellite and reanalysis products with gauge-based GPCC data sets. Theor. Appl. Clim. 2014, 121, 303–317. [Google Scholar] [CrossRef]
- Kharyutkina, E.; Loginov, S.; Martynova, Y.; Sudakov, I. Time series analysis of atmospheric precipitation characteristics in western Siberia for 1979–2018 across Different Datasets. Atmosphere 2022, 13, 189. [Google Scholar] [CrossRef]
- Available online: https://doi.org/10.5281/zenodo.7683621 (accessed on 28 February 2023).
- Hersbach, H.; Bell, B.; Berrisford, P.; Hirahara, S.; Horanyi, A.; Muñoz-Sabater, J.; Nicolas, J.; Peubey, C.; Radu, R.; Schepers, D.; et al. The ERA5 global reanalysis. Q. J. R. Meteorol. Soc. 2020, 146, 1999–2049. [Google Scholar] [CrossRef]
- Holton, J.R.; Haynes, P.; McIntyre, M.E.; Douglass, A.R.; Rood, R.; Pfister, L. Stratosphere-troposphere exchange. Rev. Geophys. 1995, 33, 403–439. [Google Scholar] [CrossRef]
- Jing, P.; Banerjee, S. Rossby wave breaking and isentropic stratosphere-troposphere exchange during 1981–2015 in the northern hemisphere. J. Geophys. Res. Atmos. 2018, 123, 9011–9025. [Google Scholar] [CrossRef]
- Portmann, R.; Sprenger, M.; Wernli, H. The three-dimensional life cycles of potential vorticity cutoffs: A global and selected regional climatologies in ERA-Interim (1979–2018). Weather. Clim. Dyn. 2021, 2, 507–534. [Google Scholar] [CrossRef]
- Wang, B.; Wu, Z.; Li, J.; Liu, J.; Chang, C.-P.; Ding, Y.; Wu, G. How to measure the strength of the east Asian summer monsoon. J. Clim. 2008, 21, 4449–4463. [Google Scholar] [CrossRef]
- Bowley, K.A.; Gyakum, J.R.; Atallah, E.H. A New perspective toward cataloging northern hemisphere Rossby wave breaking on the dynamic tropopause. Mon. Weather. Rev. 2019, 147, 409–431. [Google Scholar] [CrossRef]
- Available online: https://doi.org/10.5281/zenodo.7683717 (accessed on 28 February 2023).
- Available online: https://doi.org/10.5281/zenodo.7683742 (accessed on 28 February 2023).
- Yang, D.; Wang, L. The summertime circulation types over Eurasia and their connections with the north Atlantic oscillation modulated by north Atlantic SST. Atmosphere 2022, 13, 2093. [Google Scholar] [CrossRef]
- Dong, B.; Sutton, R.T.; Shaffrey, L.; Ben Harvey, B. Recent decadal weakening of the summer Eurasian westerly jet attributable to anthropogenic aerosol emissions. Nat. Commun. 2022, 13, 1148. [Google Scholar] [CrossRef] [PubMed]
- Jovanovic, G.; Reljin, I.; Reljin, B. The influence of Arctic and north Atlantic oscillation on precipitation regime in Serbia. IOP Conf. Ser. Earth Environ. Sci. 2008, 4, 012025. [Google Scholar] [CrossRef]
- Li, J.; Ruan, C. The north Atlantic–Eurasian teleconnection in summer and its effects on Eurasian climates. Environ. Res. Lett. 2017, 13, 024007. [Google Scholar] [CrossRef]
Disclaimer/Publisher’s Note: The statements, opinions and data contained in all publications are solely those of the individual author(s) and contributor(s) and not of MDPI and/or the editor(s). MDPI and/or the editor(s) disclaim responsibility for any injury to people or property resulting from any ideas, methods, instructions or products referred to in the content. |
© 2023 by the authors. Licensee MDPI, Basel, Switzerland. This article is an open access article distributed under the terms and conditions of the Creative Commons Attribution (CC BY) license (https://creativecommons.org/licenses/by/4.0/).