Article

Lightning-Ignited Wildfires and Associated Meteorological Conditions in Western Siberia for 2016–2021

by
Elena Kharyutkina
1,2,*,
Evgeniia Moraru
1,
Konstantin Pustovalov
1,2 and
Sergey Loginov
1
1
Institute of Monitoring of Climatic and Ecological Systems, Siberian Branch of Russian Academy of Sciences, 634055 Tomsk, Russia
2
Department of Meteorology and Climatology, Faculty of Geology and Geography, National Research Tomsk State University, 634050 Tomsk, Russia
*
Author to whom correspondence should be addressed.
Atmosphere 2024, 15(1), 106; https://doi.org/10.3390/atmos15010106
Submission received: 27 November 2023 / Revised: 29 December 2023 / Accepted: 12 January 2024 / Published: 15 January 2024
(This article belongs to the Special Issue Extreme Weather Events in Siberia)

Abstract

:
The analysis of the spatio-temporal variability of lightning-ignited wildfires and meteorological conditions preceding their occurrence from both dry lightning and lightning with precipitation in Western Siberia for the warm seasons (May–September) of 2016–2021 was carried out. In the Arctic zone, fires from lightnings occur in most cases (83%) almost without precipitation (<2.5 mm/day), whereas in the forest and steppe zones the number of cases is less (81% and 74%, respectively). The most significant changes in meteorological conditions before the ignition were also revealed in the northern part 3–4 days before. Among all considered parameters, the most important role in the occurrence of dry lightning-ignited wildfires belongs to mid-tropospheric instability, lower-tropospheric dryness, and the moisture content of the top soil and surface floor layer. Moreover, in the Arctic zone of Western Siberia, more extreme (hotter and drier) meteorological conditions should be observed for the occurrence of ignition from lightning. The threshold values for the considered meteorological parameters were derived for our region for the first time. Obtained results can be used in the development of models for potential fire hazards prediction in various landscapes, which will have a practical application in various spheres of the national economy.

1. Introduction

According to [1], the most significant factors influencing the occurrence and development of wildfires are climate change, human activity, and land cover type. The study of [2], carried out for the territory of the Siberian forests, shows that during recent decades, the frequency of forest fires caused by climate changes and the area of burned forests have increased. The occurrence of wildfires, probably, depends on factors that control landscape flammability and ignition frequency, including climatic and weather variables [3,4].
Despite the fact that most forest fires, intentionally or accidentally, are the result of human activities, lightning is the most common cause of fire in many boreal and Arctic regions [5,6]. Current climate change, according to [7], can lead to change in the lightning activity regime as a fire hazard on a global scale.
According to the results presented [8], in Siberia, lightning is a much more common cause of forest fires than in other territories—28% of fires occur due to their «fault» and in the territory of the Tomsk region—by up to 37% [9,10]. Moreover, in the Siberian Arctic as a whole, the decadal frequency of wildfire tripled from the 2001–2010 to the 2011–2020 periods with the greatest increase in Western Siberia [11]. The authors found that annual fire frequency and the extent of burned areas were related to various combinations of seasonal air temperature, precipitation, ground moisture, and lightning frequency.
Particular attention should be paid to fires caused by severe thunderstorms with numerous lightning strikes, which produce virtually no precipitation [12,13,14]. This phenomenon is called “dry” thunderstorms, which are associated with isolated cumulonimbus clouds arising in the tropical air mass. According to [15,16], in middle latitudes, these thunderstorms usually occur in the summer at daytime temperatures above +28°, relative humidity below 40%, the base height of cumulonimbus clouds above 1500–2000 m, and precipitation evaporates in dry air when falling or practically reaching the surface.
The influence of meteorological conditions on the occurrence of fires from dry thunderstorms can differ significantly for each individual territory. Thus, in the northwest of the Pacific Ocean [17], the USA [14], Australia [18,19], and the Mediterranean basin [20], dry thunderstorm days occur with low atmospheric stability, low relative humidity, and a high temperature difference between values at 850 hPa and at 2 m. These things considered, the occurrence of dry lightning needs a lifting mechanism [21]. For example, in Catalonia, these lightning episodes tend to be dynamically related to shortwave troughs at 500 hPa.
It is regularly recorded that in certain areas of the globe, on certain days, 50% or more fires occurred due to dry thunderstorms [15,16]. Dry thunderstorms cannot always be detected; therefore, most fires caused by lightning refer to anthropogenic or unknown causes. Traditional methods for identification and forecasting thunderstorms do not make it possible to divide them into “dry” and “wet”. Moreover, the main factor taken into account when forecasting thunderstorms is the increased moisture content of the atmosphere, which contradicts the conditions for the formation of dry thunderstorms [16].
According to [17], to identify cases with «dry» thunderstorms for the northwestern United States, a threshold value of total daily precipitation was used: 1/100 inch (0.25 mm/day) and 1/10 inch (2.5 mm/day). These thresholds are widely used in the study of dry thunderstorms [22,23,24] and others. According to [14,17], one of the important parameters for dry thunderstorms forecasting is moisture content in the atmosphere, since a moisture deficit in the surface atmosphere increases the probability of severe thunderstorm occurrence and, as a rule, causes virtually no precipitation. Another important parameter is the stability of the atmosphere, and it is assumed that the more unstable the atmosphere, the more likely thunderstorms are. When fires occur, the soil moisture content and forest fuel also play an important role. As a rule, the occurrence of forest fires is accompanied by low fuel moisture [4]. For example, the occurrence of extreme fires in Central Siberia and the Transbaikal region may be associated with anomalies in soil moisture and precipitation [2,25,26]. In [27], correlations between the number of hotspots and fuel moisture components are revealed in certain spring and summer months in the south of Western Siberia. The fire in the forest fuel material caused by lightning can smolder inside the trunk for several days until favorable conditions allow its development into a forest fire [23,28,29].
Due to the continuing increase in air temperature, there will be an increase in climate extremes both on the global [30] and regional scales, including Western Siberia [31,32], by the end of the 21st century. At the same time, increases in lightning activity [6] and in the number and area of lightning fires [33] are expected. This tendency is especially dangerous for ecologically vulnerable Arctic regions, where lightning is a main source of natural fires [34].
Thus, despite the fact that a large number of studies are devoted to the problem of wildfires occurrence, in particular, the significant contribution to the fire hazard of such a phenomenon as a dry thunderstorm is underestimated. From this point of view, the study of the conditions for its occurrence in the region of Western Siberia (including the Arctic zone) is a question of a high interest. The results will clarify global and regional climate models and will also be useful for practical applications in the spheres of the national economy when predicting potential fire hazards for various landscapes.
The purpose of the study is to analyze the spatio-temporal variability in the number of lightning-ignited wildfires (LIWs) and meteorological conditions preceding their occurrence from both dry and wet lightning in Western Siberia for the period of 2016–2021.
The paper is organized as follows. In Section 2, we present data sets and briefly describe the used data methods. In Section 3, the results of the spatial and temporal distribution of the number of lightning-ignited wildfires and their comparative analysis with the meteorological conditions preceding selected cases of ignition are presented. In Section 4, we discuss the obtained results and make some comparisons with other studies. The conclusion, limitations, and future direction of the research are briefly summarized in Section 5.

2. Materials and Methods

The study was carried out for the territory of Western Siberia (45–75° N, 60–95° E), covering the Western Siberian Plain and the northern part of Kazakhstan (hereinafter, WS), for the warm seasons (from May to September) for the period of 2016–2021. The analysis was carried out both for the WS region as a whole and separately for its northern part (65–75° N, NWS): the zone of tundra and permafrost; the central part (55–65° N, CWS): the zone of mixed forests and waterlogged areas; and the southern part (45–55° N, SWS): the zone of steppes and forest steppes.
As a forest fire characteristic, we used data about active fires (thermal anomalies/hotspots) from the Fire Information for Resource Management System (FIRMS) archive Moderate Resolution Imaging Spectroradiometer (MODIS) with daily time resolution and a spatial resolution of 1 km2 × 1 km2 [35]. Since some thermal anomalies can indicate anthropogenic heat sources, to clarify the fact of the presence of fires, we also used the database of permanent fires from the Institute of Space Research of the Russian Academy of Sciences [36].
Information about lightning data was obtained from the Worldwide Lightning Network (WWLLN) [37]—a unique, open-access global database of lightning frequency that provides a basis for climatology of diurnal and seasonal variations in lightning time series [38,39]. Operational data from 5 or more receivers, located at distances of up to 3000 km, contained information on lightning discharges every 1 h with a 7 h delay in open access [37]. The worldwide average efficiency of lightning detection for WWLLN is about 30% [40], and WWLLN preferentially detects cloud-to-ground lightning [41]. This feature was favorable for the current study since cloud-to-ground lightning is the main cause of fires.
To decrease the number of hotspots, we combined them in a fire cluster that began with a single hotspot that first recorded in time. Further, all neighboring hotspots located in space with a radius of 2 km and, in time, 1 day belonged to one cluster—a fire (Figure 1: left panel). To identify LIWs, we used the following algorithm (Figure 1):
-
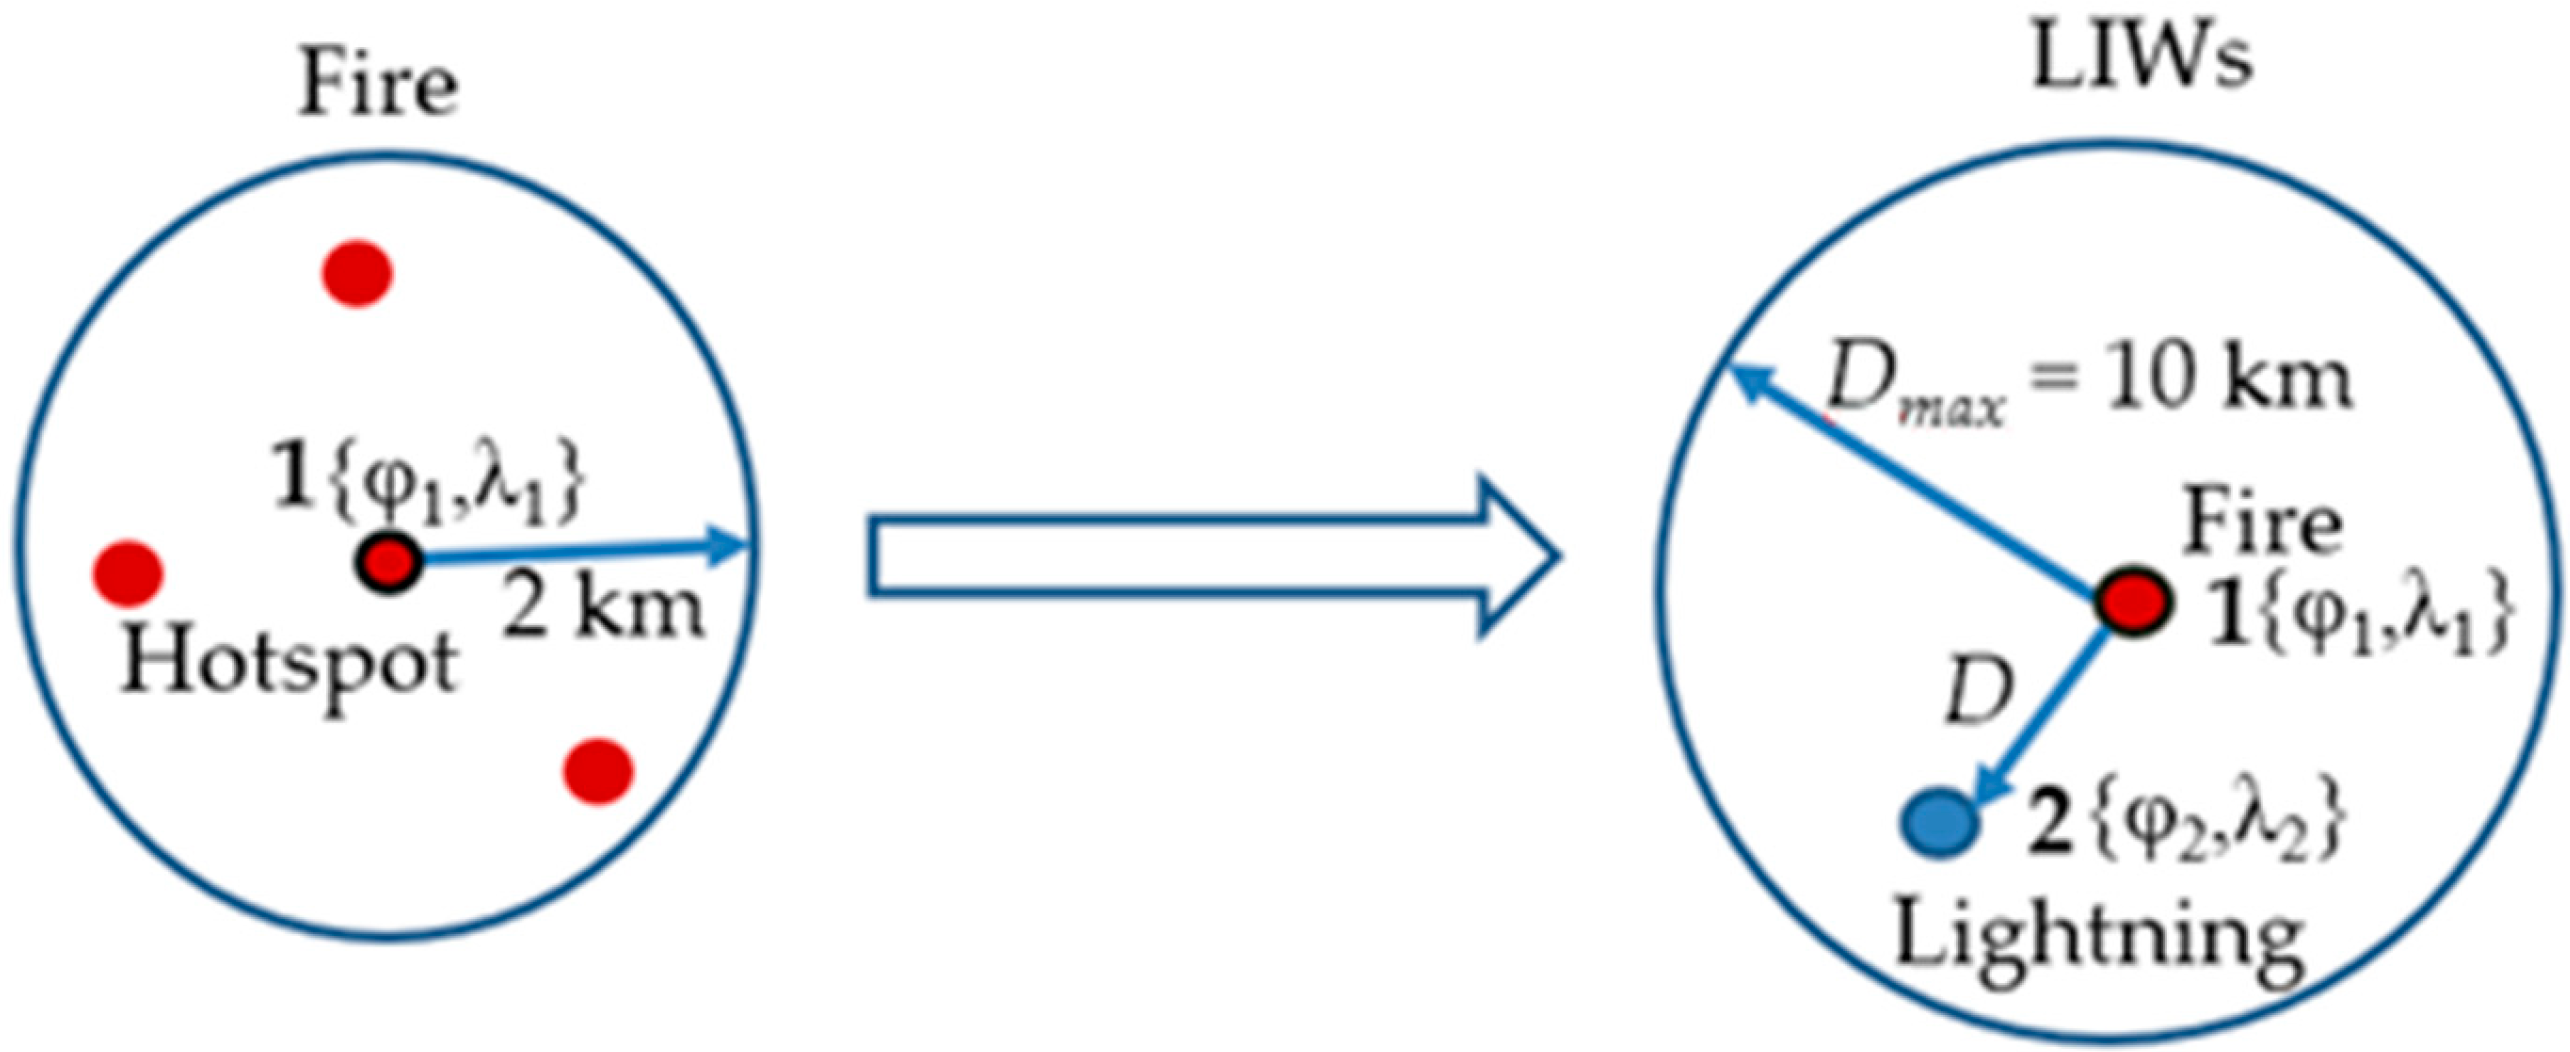
The identification of the fire center—point 1, i.e., the coordinates of the first hotspot recorded in time when clustering;
-
The identification of lightning discharge coordinates for the same time (days with fires);
-
The selection of cases when lightning discharge (first recorded in time—point 2) is located at a distance (D) of no more than 10 km (Dmax) from the fire (point 1, determined early). Thus, we calculated the distance between point 1 and point 2. The distances between the hotspot and lightning discharge were calculated using the “distance” function for the MATLAB programming environment (MATLAB and Statistics Toolbox Release 2016b, The MathWorks, Inc., Natick, MA, USA).
The choice of such a radius is based on the accuracy of the WWLLN data [20].
We searched for the most probable fire candidates to be ignited by lightning using an approach based on the formula proposed by [42]. For the first step, we calculated (as in [43]) a proximity index (A) between each observed lightning and the active fire:
A = 1 t t m a x 1 D D m a x ,
where D and Δt—the distance and time interval between a lightning event and the active fire; Dmax—the maximum distance (radius) for these events, Δtmax—the maximum time interval (holdover period), and —the smoldering time (the time from the moment of lightning to the moment of the first identification of the fire) [44]. We chose the criterion Δt from 0 to 6 days before the ignition (0—day of ignition). The choice of the Δt range was associated with the assumption that the identified cases were the consequence of a certain synoptic process that occured during a certain period over a certain territory (natural synoptic period (5–7 days)). The range of A is [0,…,1].
The probability (B) of a fire caused by each lightning event (i) was calculated:
B = 1 i = 1 n 1 A i ,
where n—the number of LIWs.
We divided all identified cases into 2 groups, “dry” and “wet” LIWs (hereinafter, Dry and Wet LIWs) based on the threshold values of total precipitation [17]: tv = 0.25 mm/day and tv = 2.5 mm/day. Thus, when the quantity of atmospheric precipitation was ≥tv, we considered that these cases belonged to Wet LIWs, and when the quantity of atmospheric precipitation was less than tv, they belonged to Dry LIWs.
Dry lightning needs three key ingredients: mid-tropospheric moisture, a lifting mechanism, and a sufficiently dry lower troposphere [17].
To capture these conditions, we derived meteorological parameters preceding the ignition (for each case of LIW in each group—Dry and Wet) based on ERA5 re-analysis data (the fifth generation of the European Center for Medium-Range Weather Forecasts re-analysis) with a spatial resolution of 0.25° × 0.25° [45] for May–September of 2016–2021. Based on the coordinates of selected LIWs, we identified correspondent grid cells. Thus, for both Dry and Wet LIWs, we prepared daily data sets of the following values.
(1)
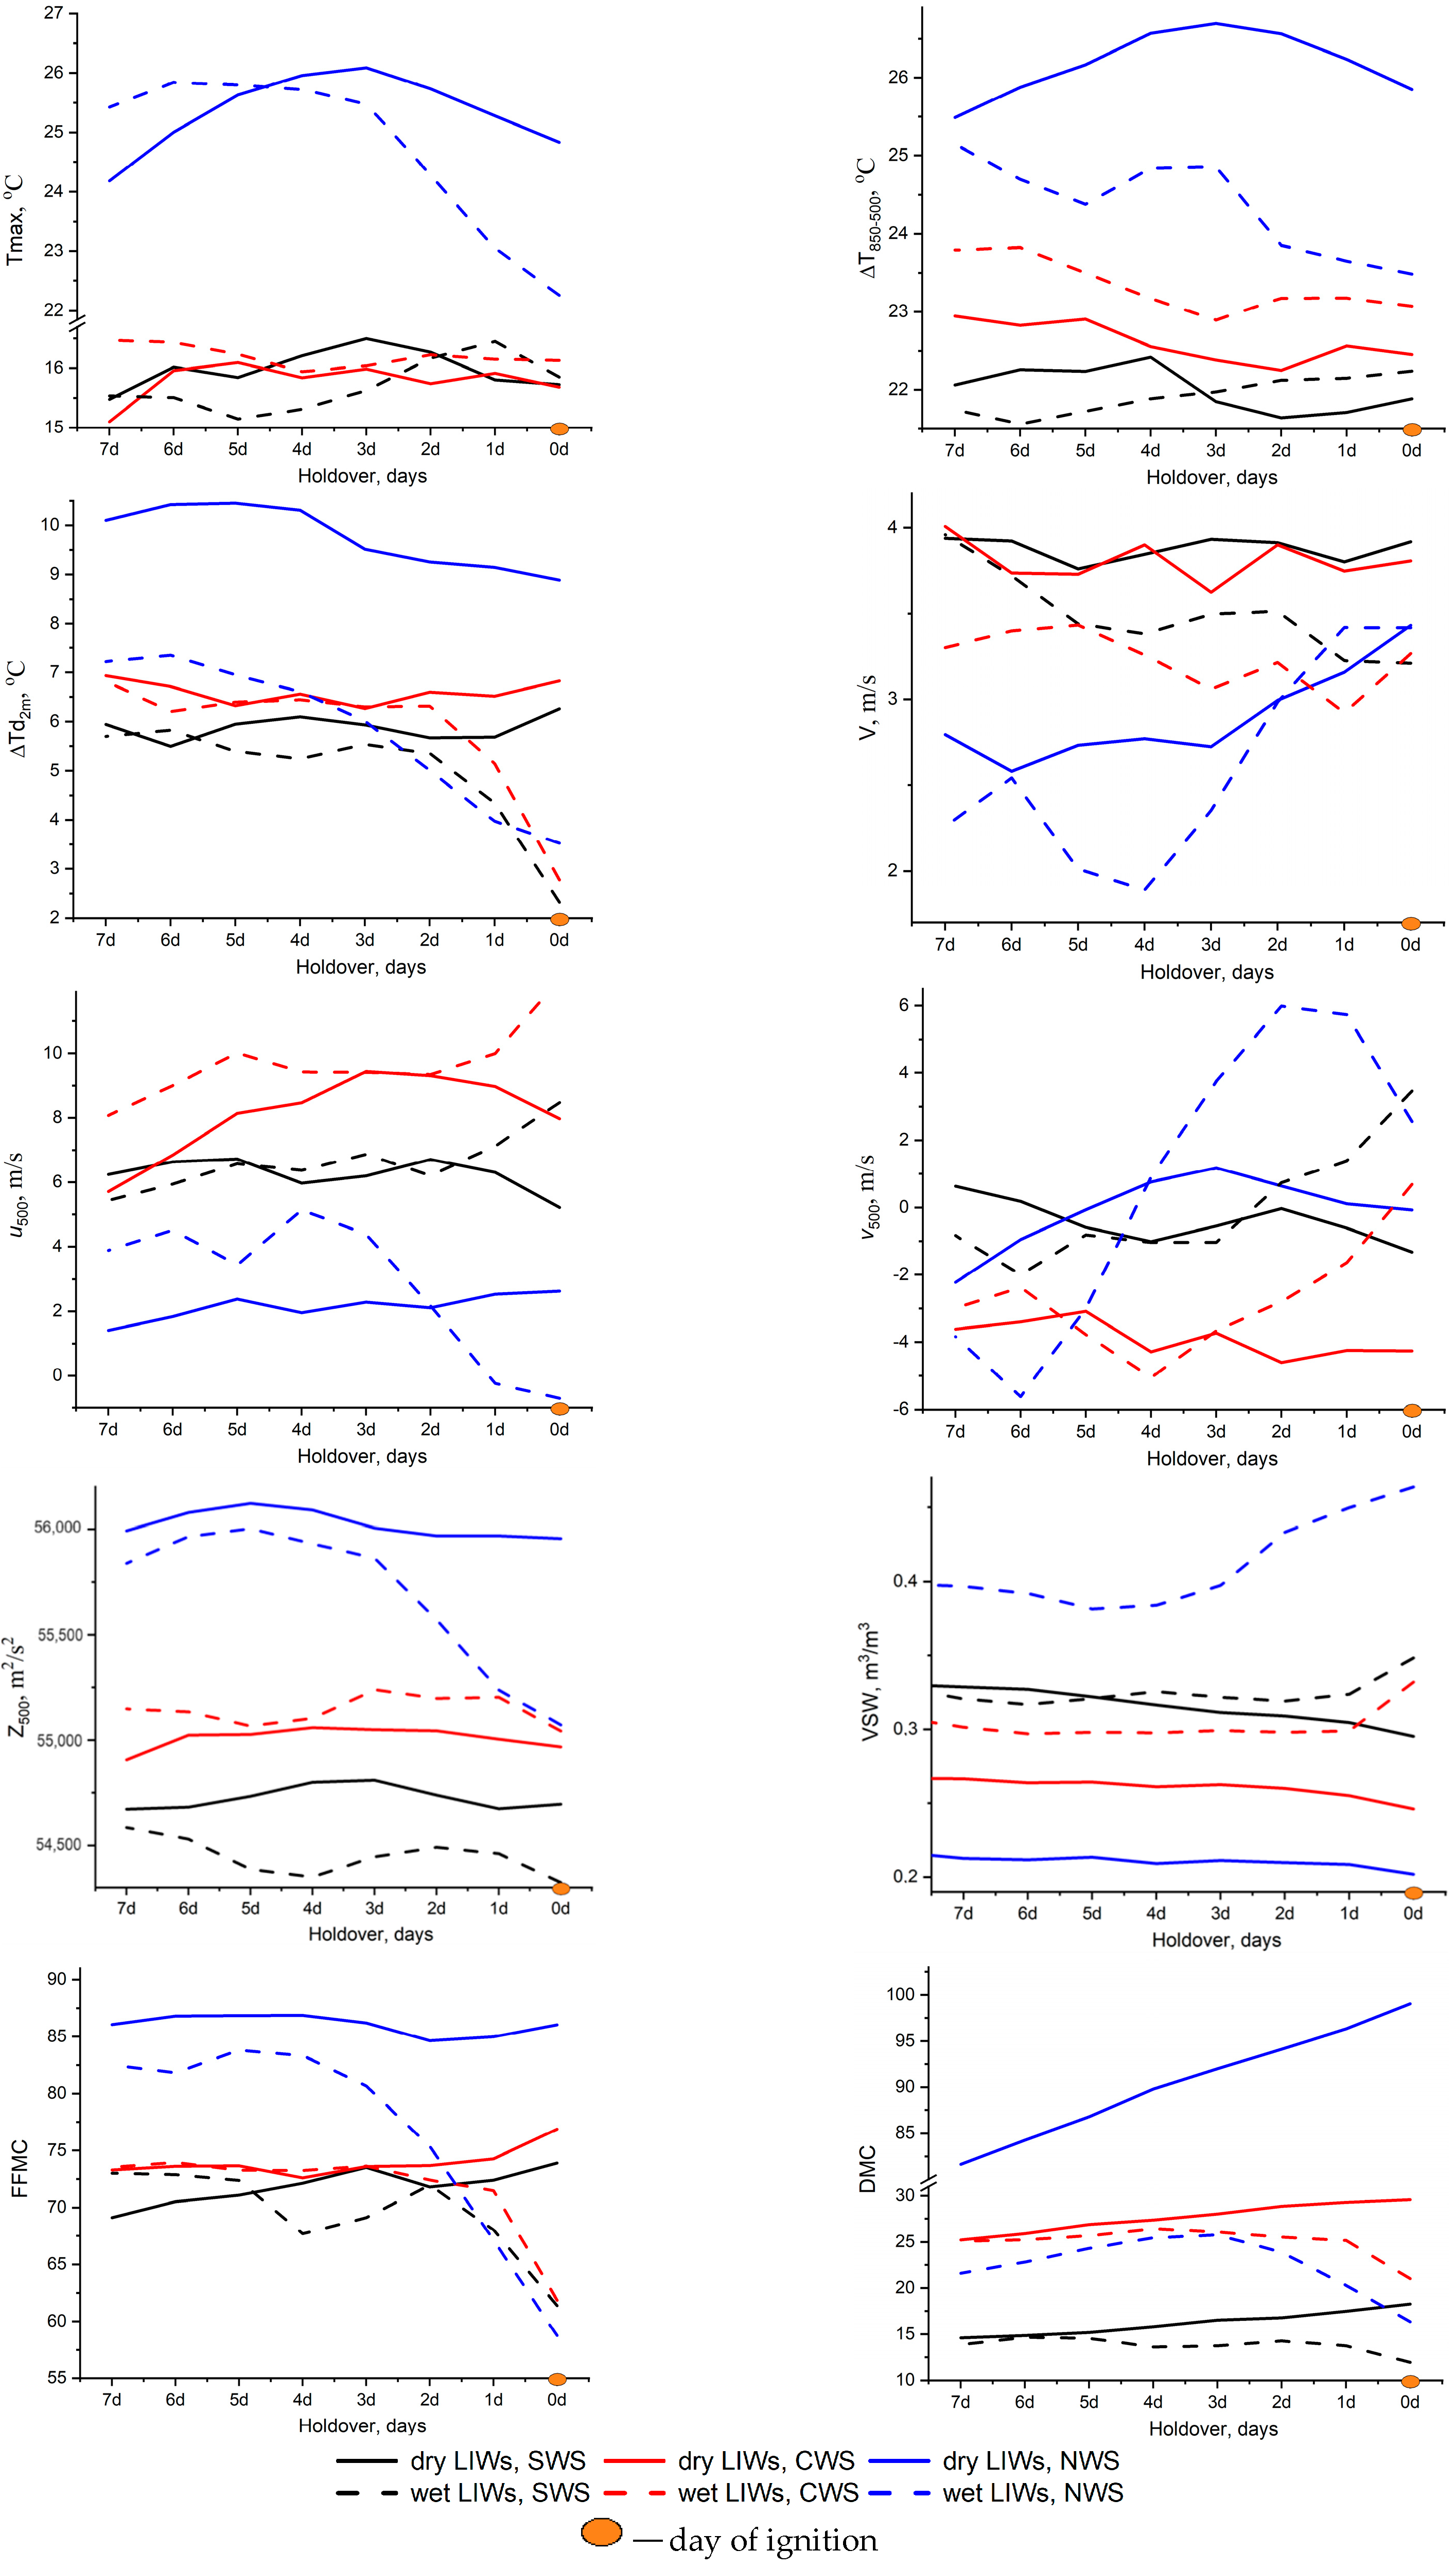
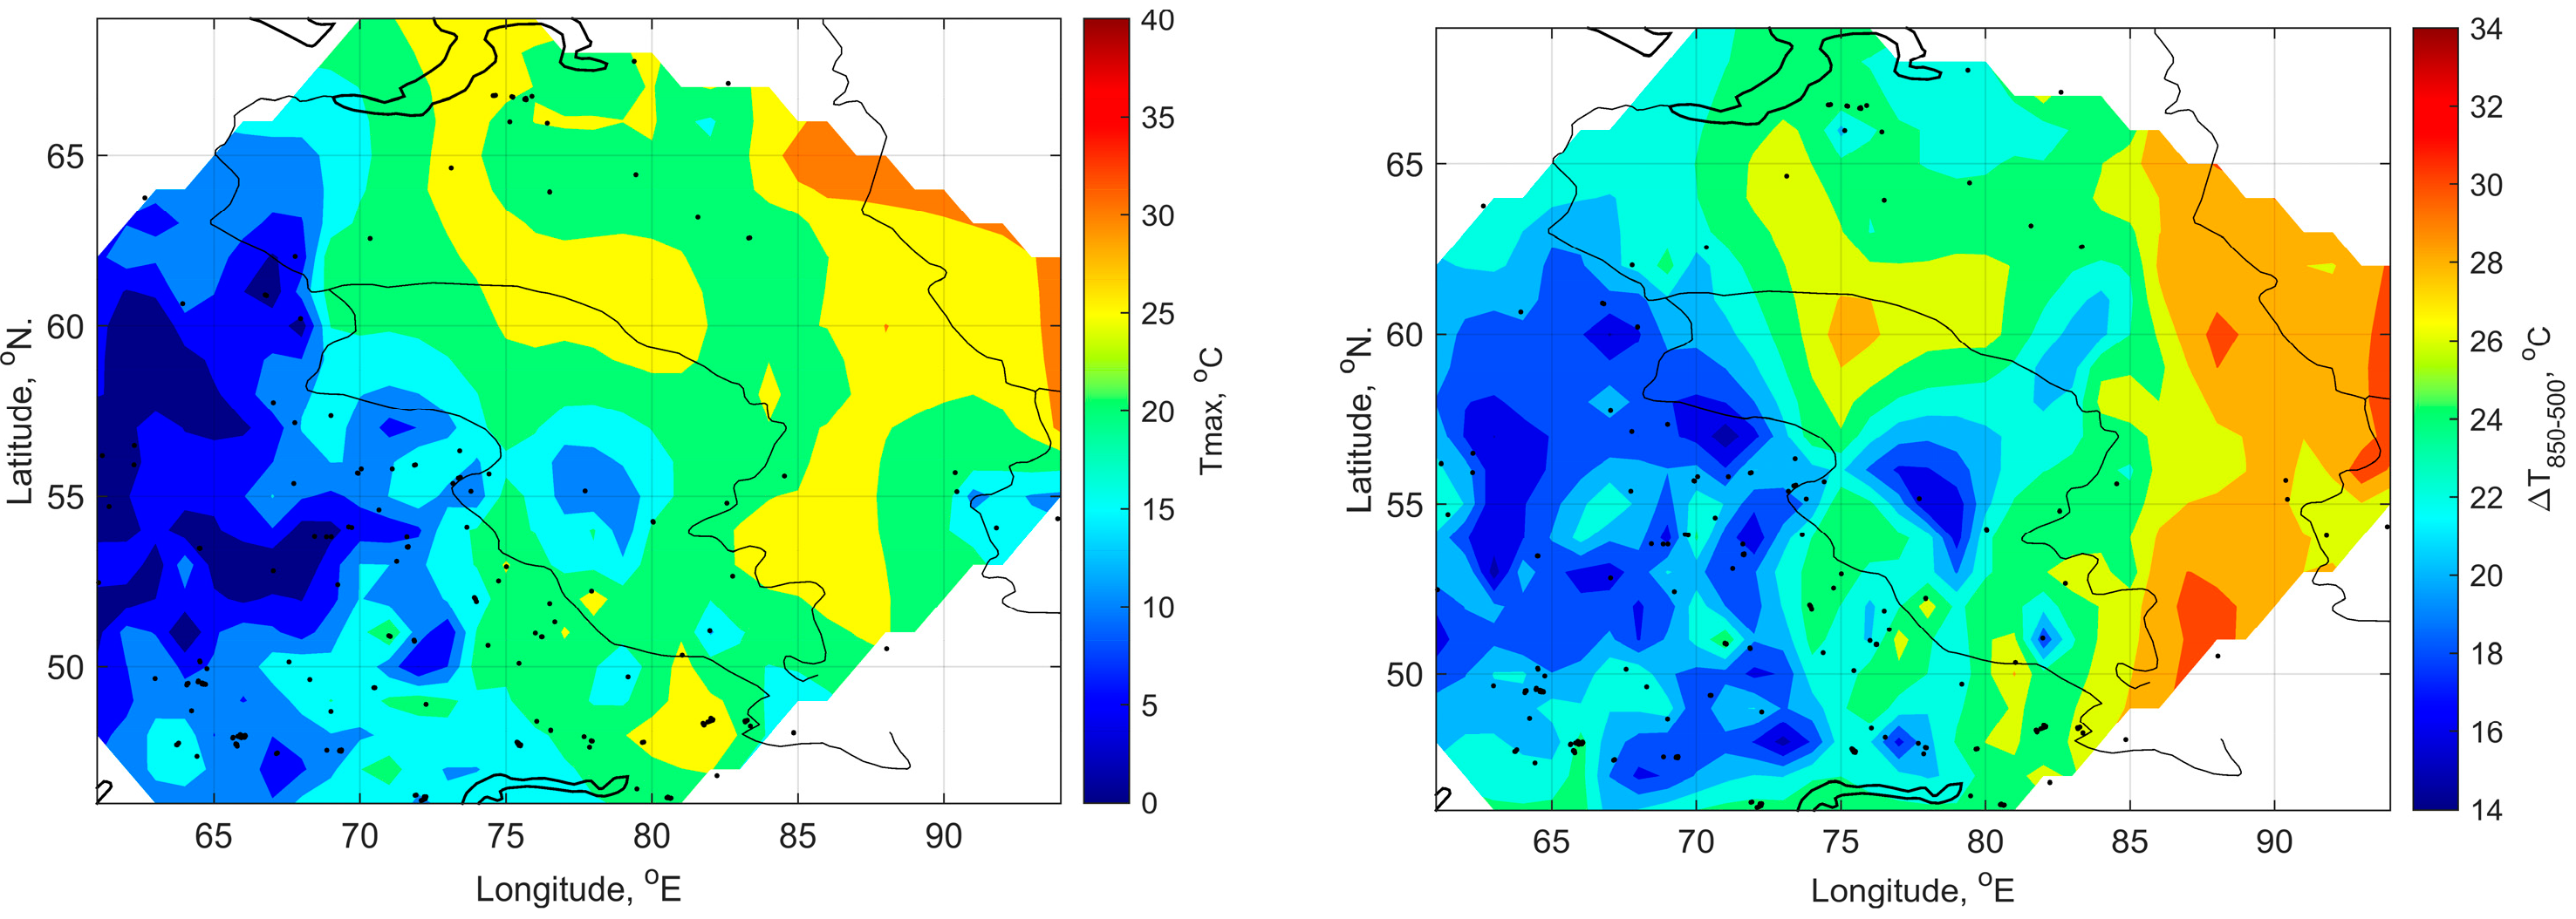
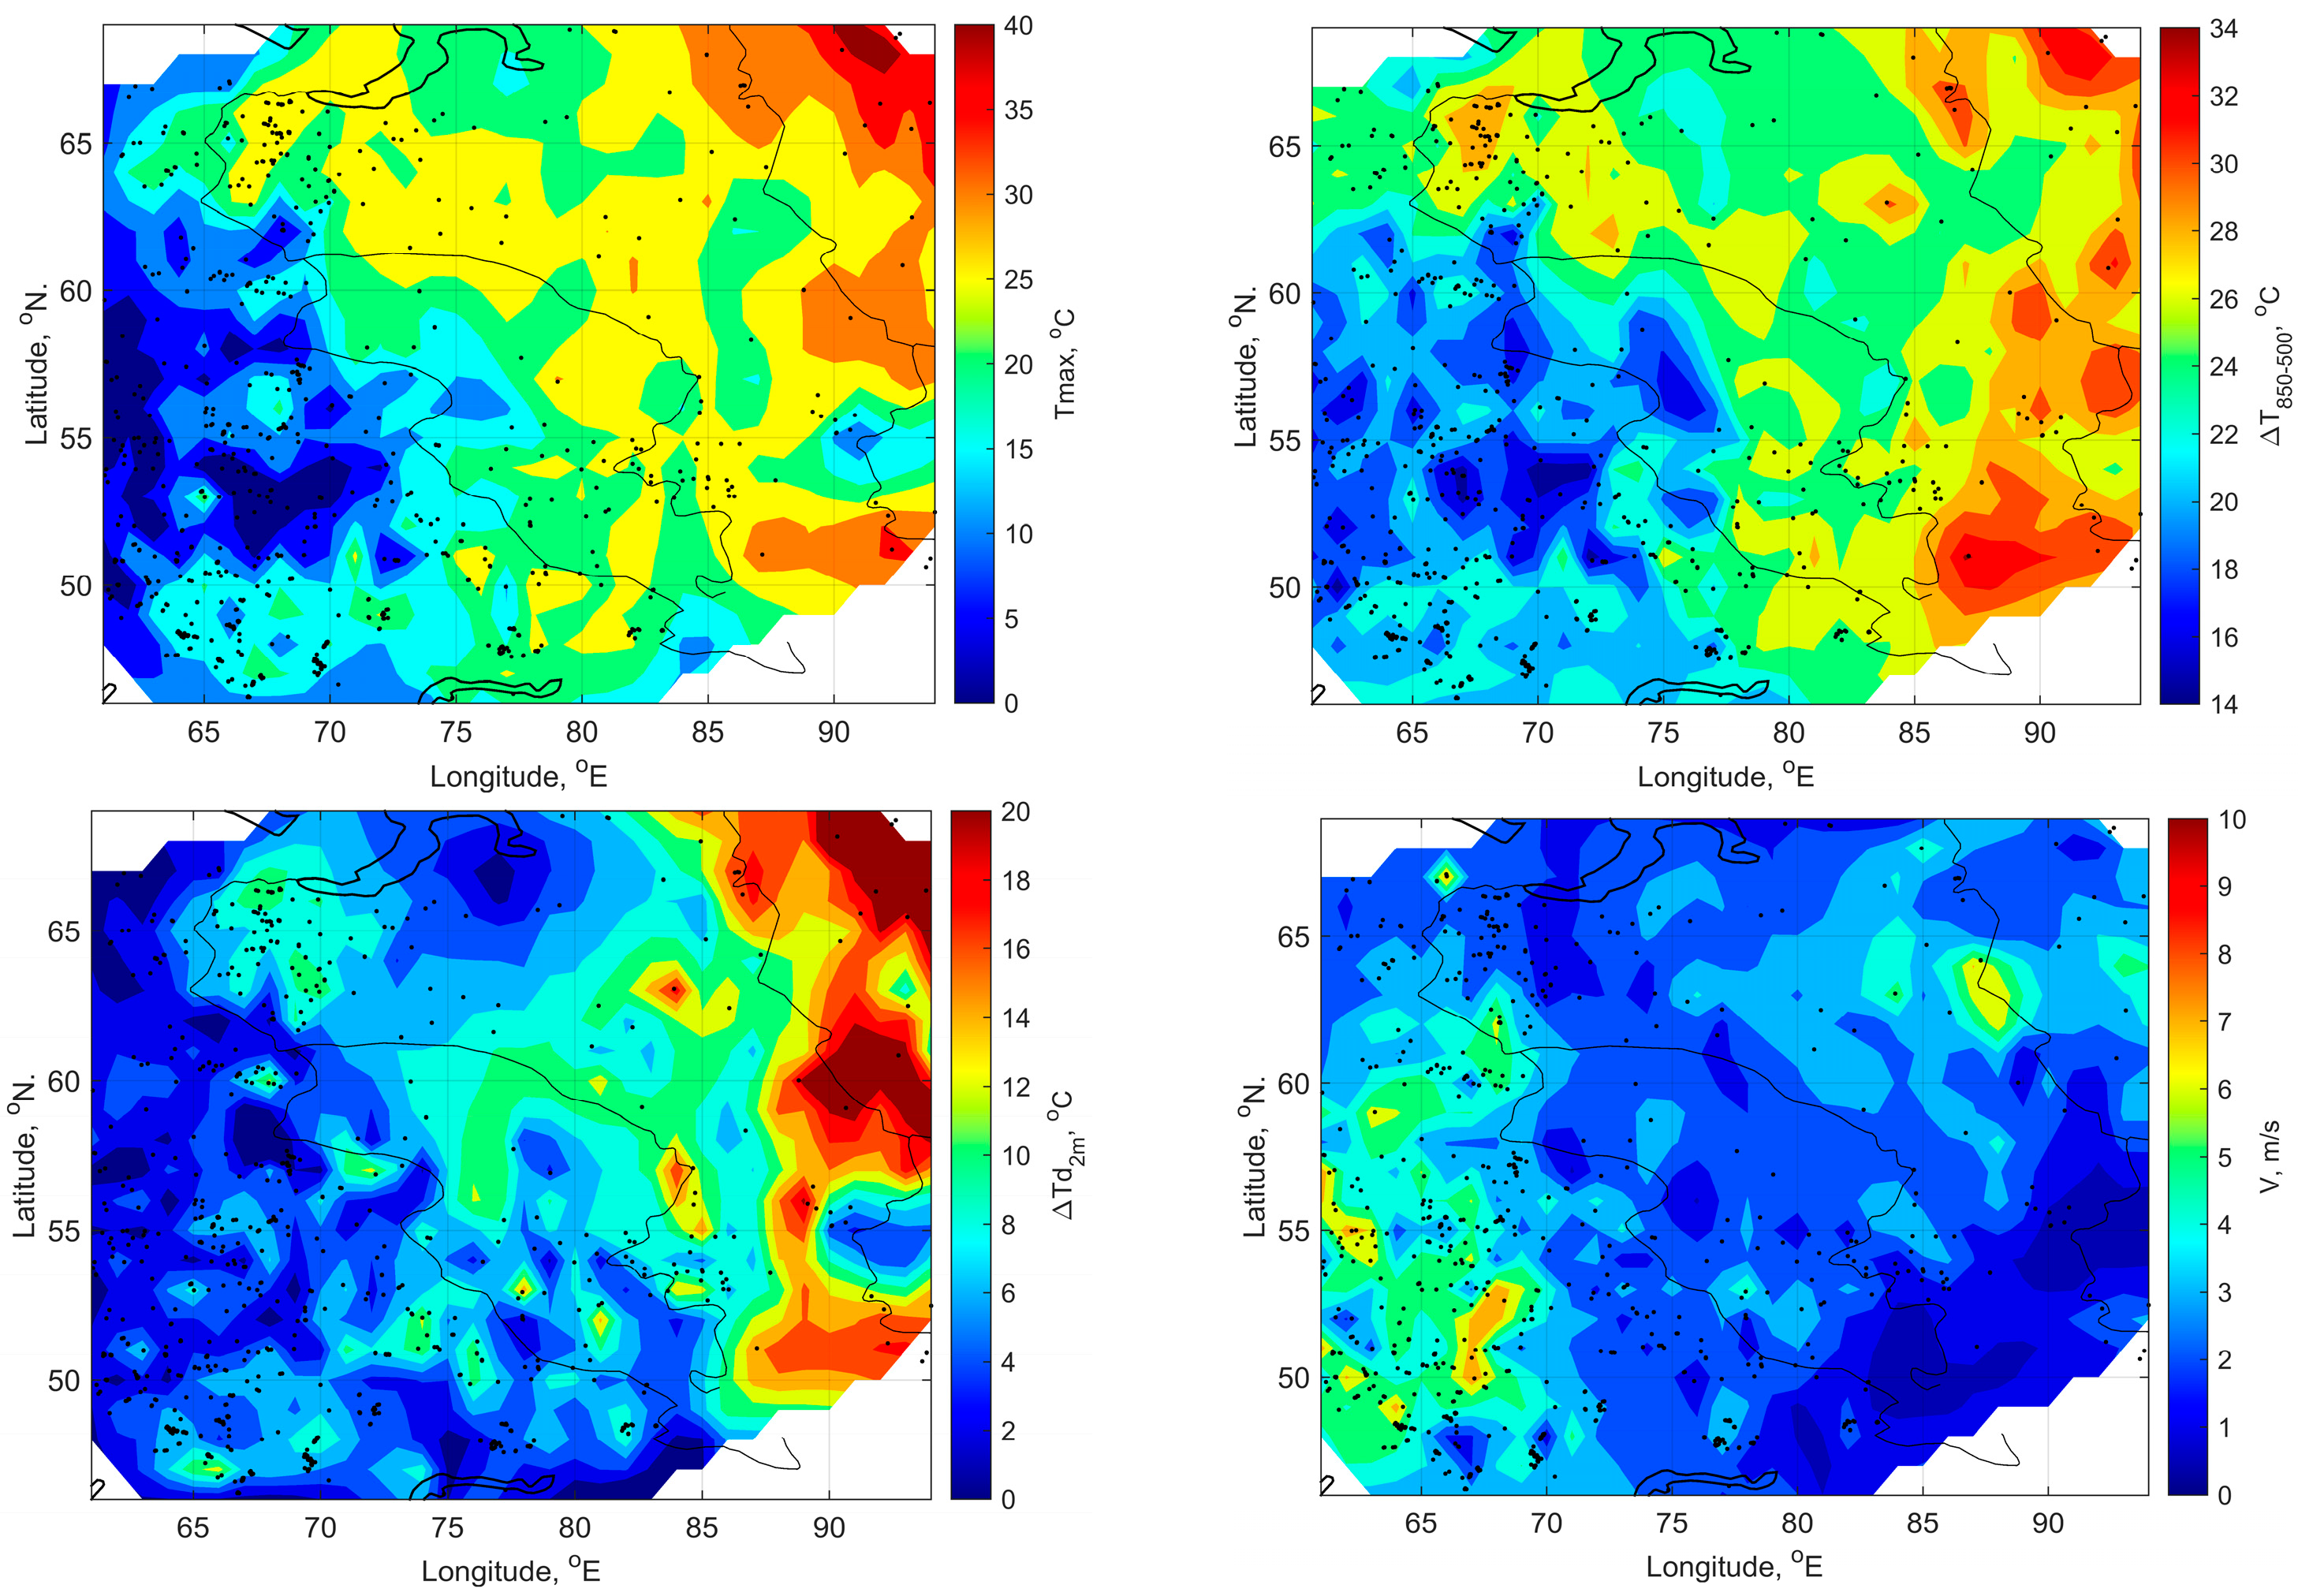
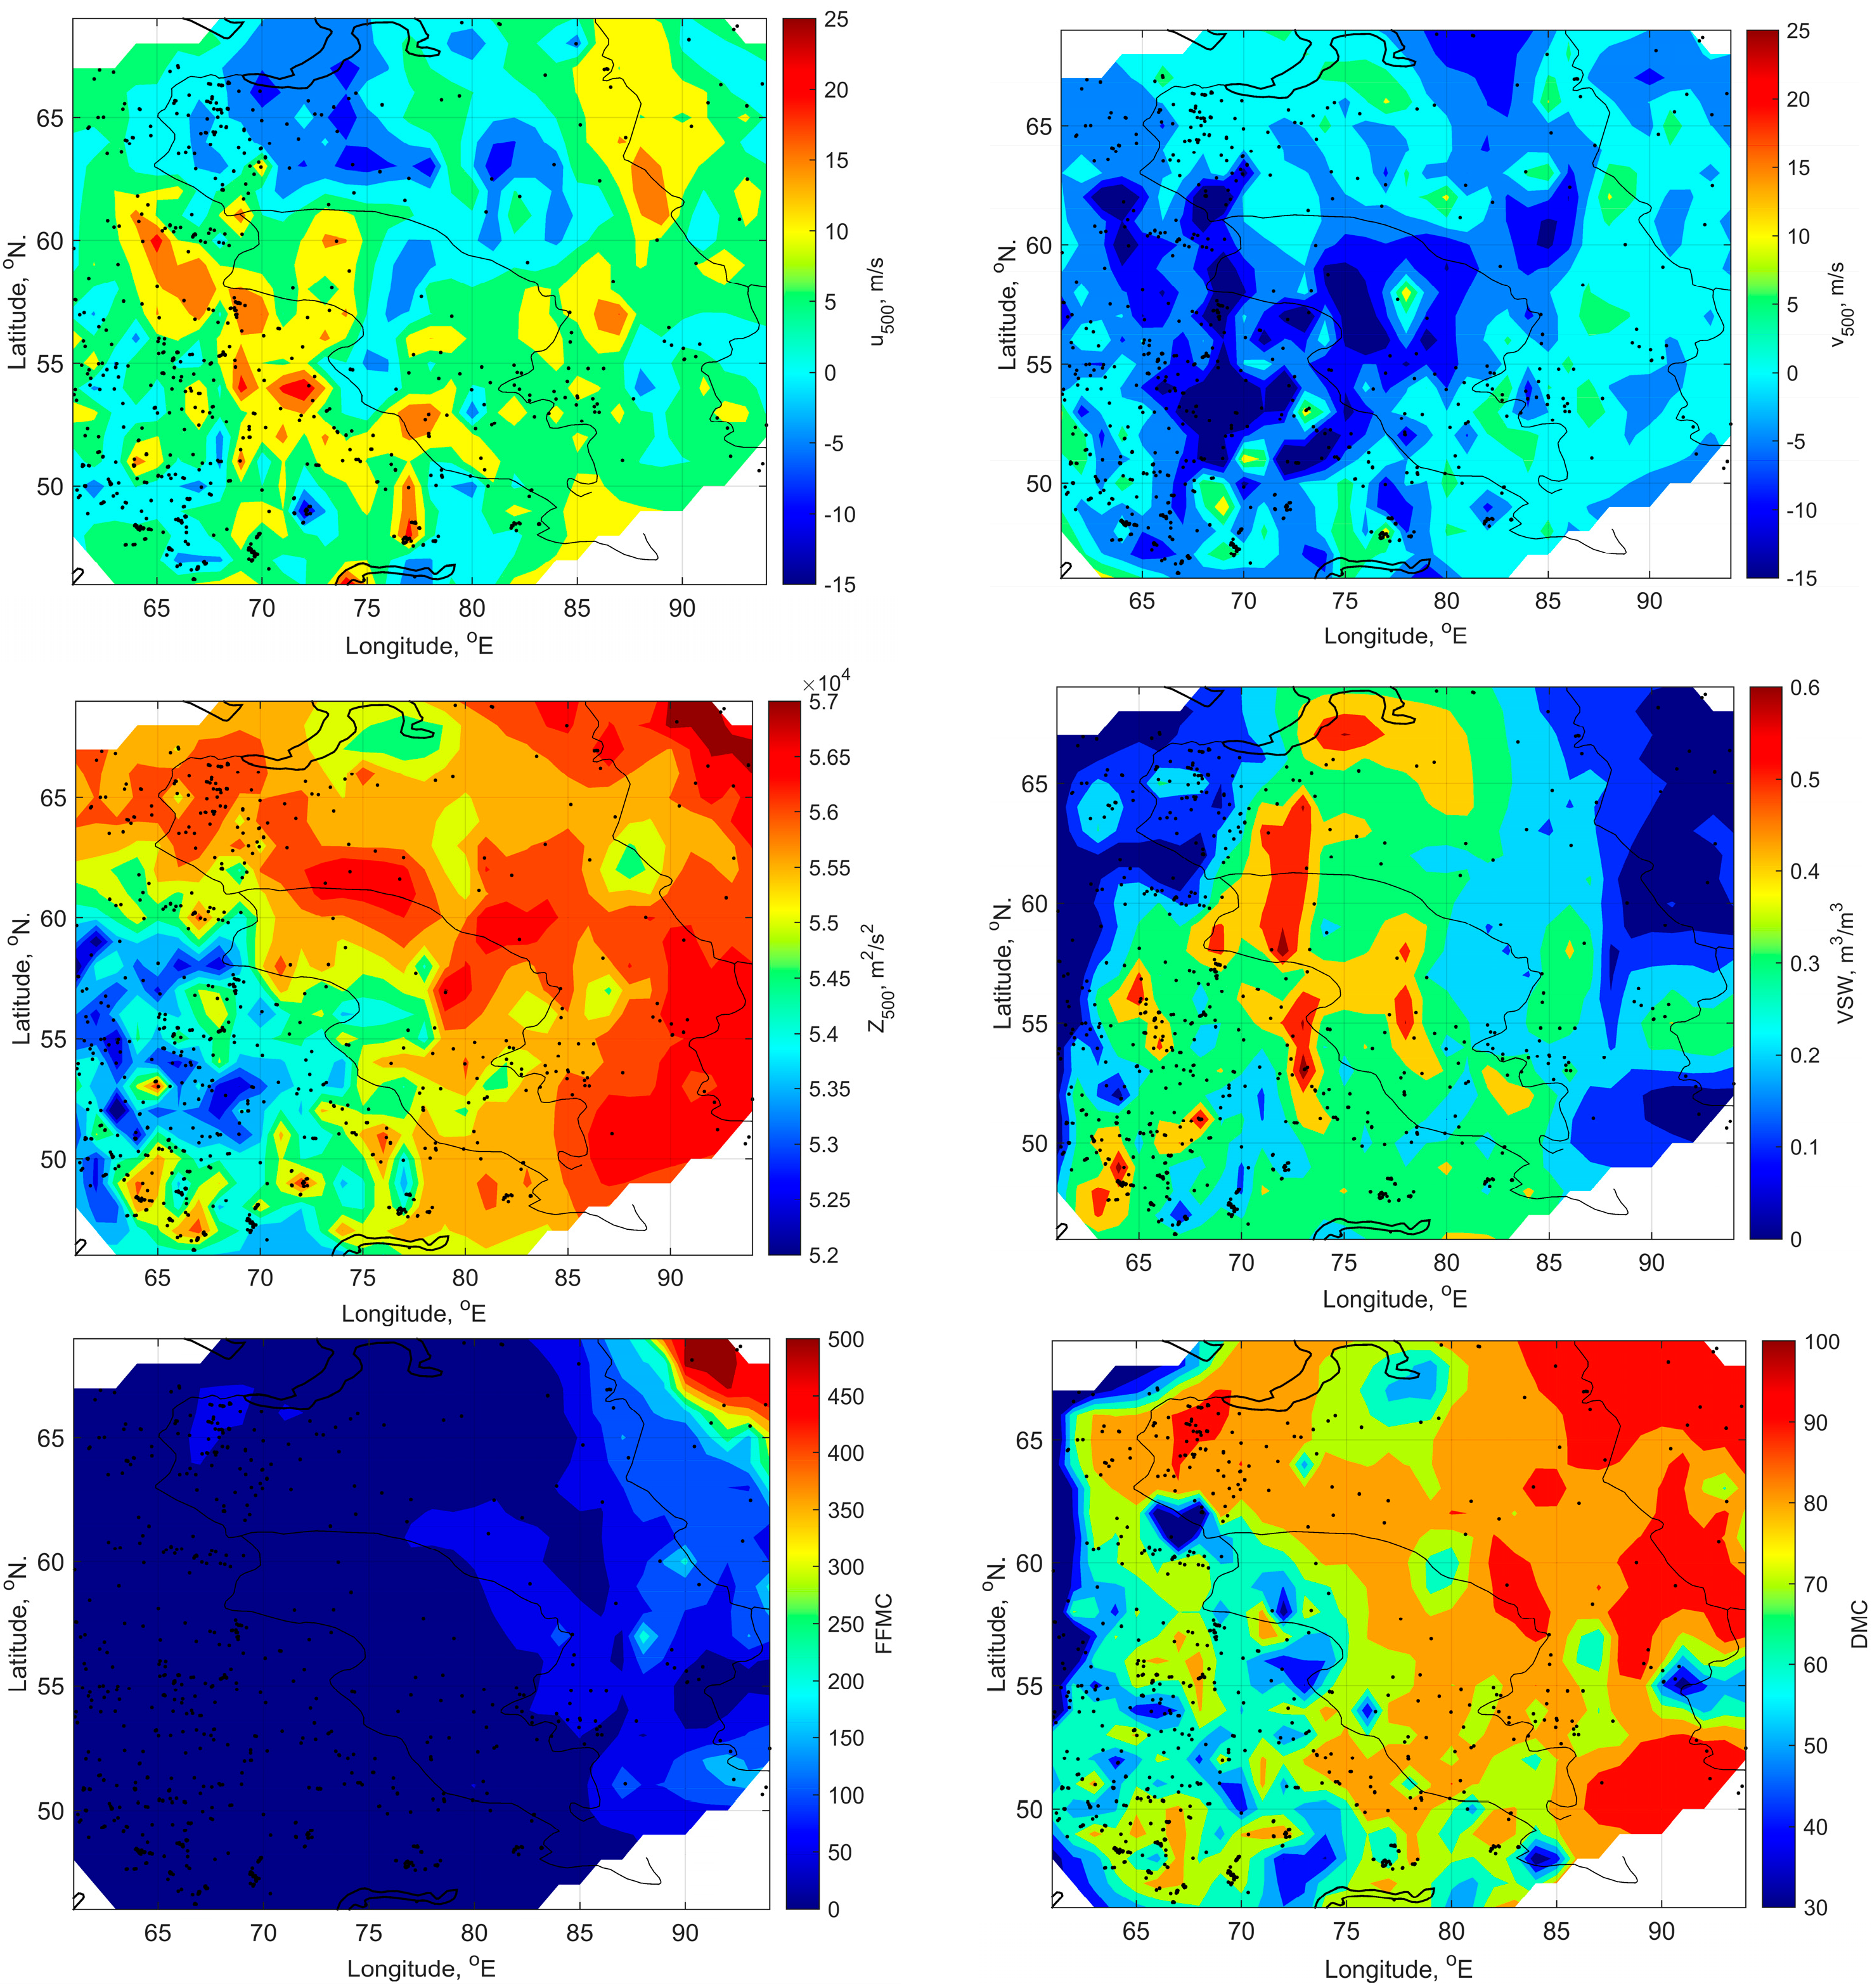
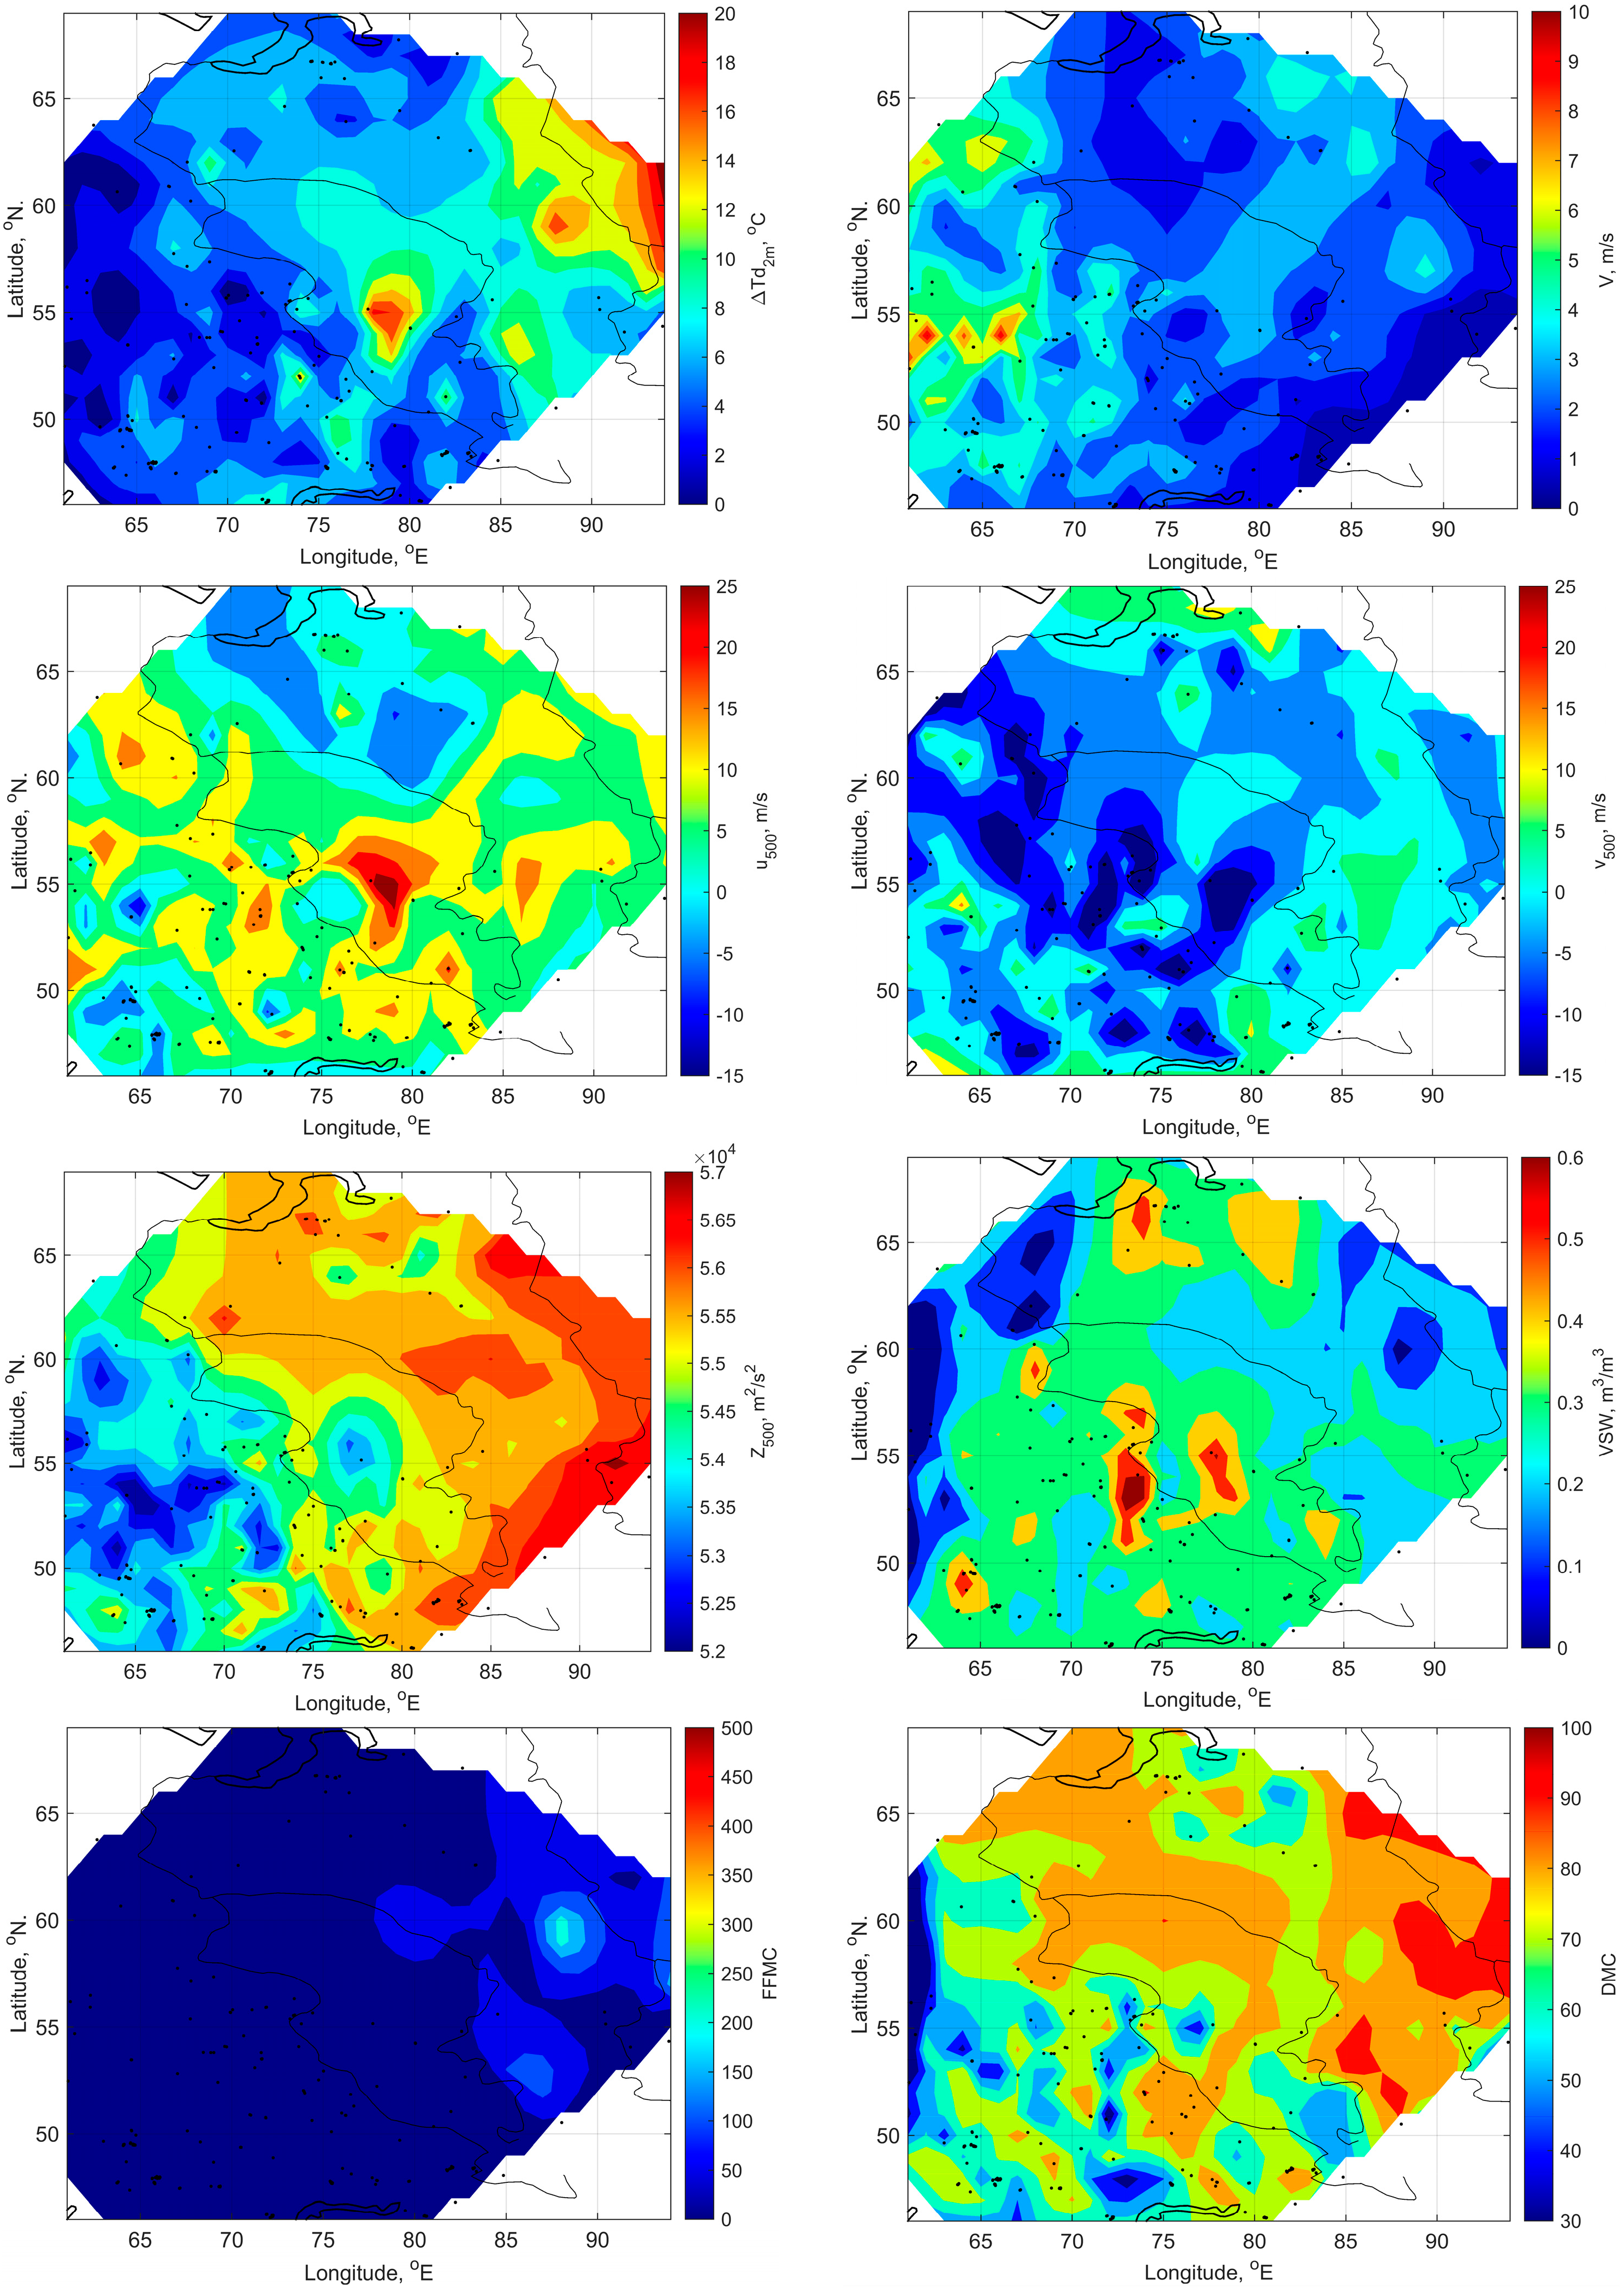
Atmospheric characteristics [24]: air temperature difference in the middle troposphere (∆T850-500) as a characteristic of atmospheric instability; dew point depression temperature (∆Td2m) as a characteristic of lower-tropospheric dryness; mid-tropospheric wind speeds at 500 hPa (zonal and meridional components (u500 and v500); geopotential at 500 hPa (z500) as a large-scale atmospheric pattern; and daily maximum air temperature (Tmax) and wind speed at 10 m (V) as near-surface instability and dryness.
(2)
Soil and fuel characteristics [27]: volumetric soil water layer at 0–7 cm (VSW); indices from the Canadian Forest Fire Weather Indices (CFFWIs), describing the moisture content of a thin surface floor layer (1.2 cm) and a top surface floor layer (7 cm), i.e., the Fine Fuel Moisture Code (FFMC) and the Duff Moisture Code (DMC), respectively.
The statistical significance of the derived estimates was determined using a two-tailed null hypothesis t-test at α = 0.05 [46]. To assess the error in the number of events, an estimate of white noise amplitude was calculated (α = 0.05) to evaluate the null hypothesis when the value was not equal to 0. Statistical values of relationships we present in terms of their correlation (Pearson coefficient correlation) [46].

3. Results

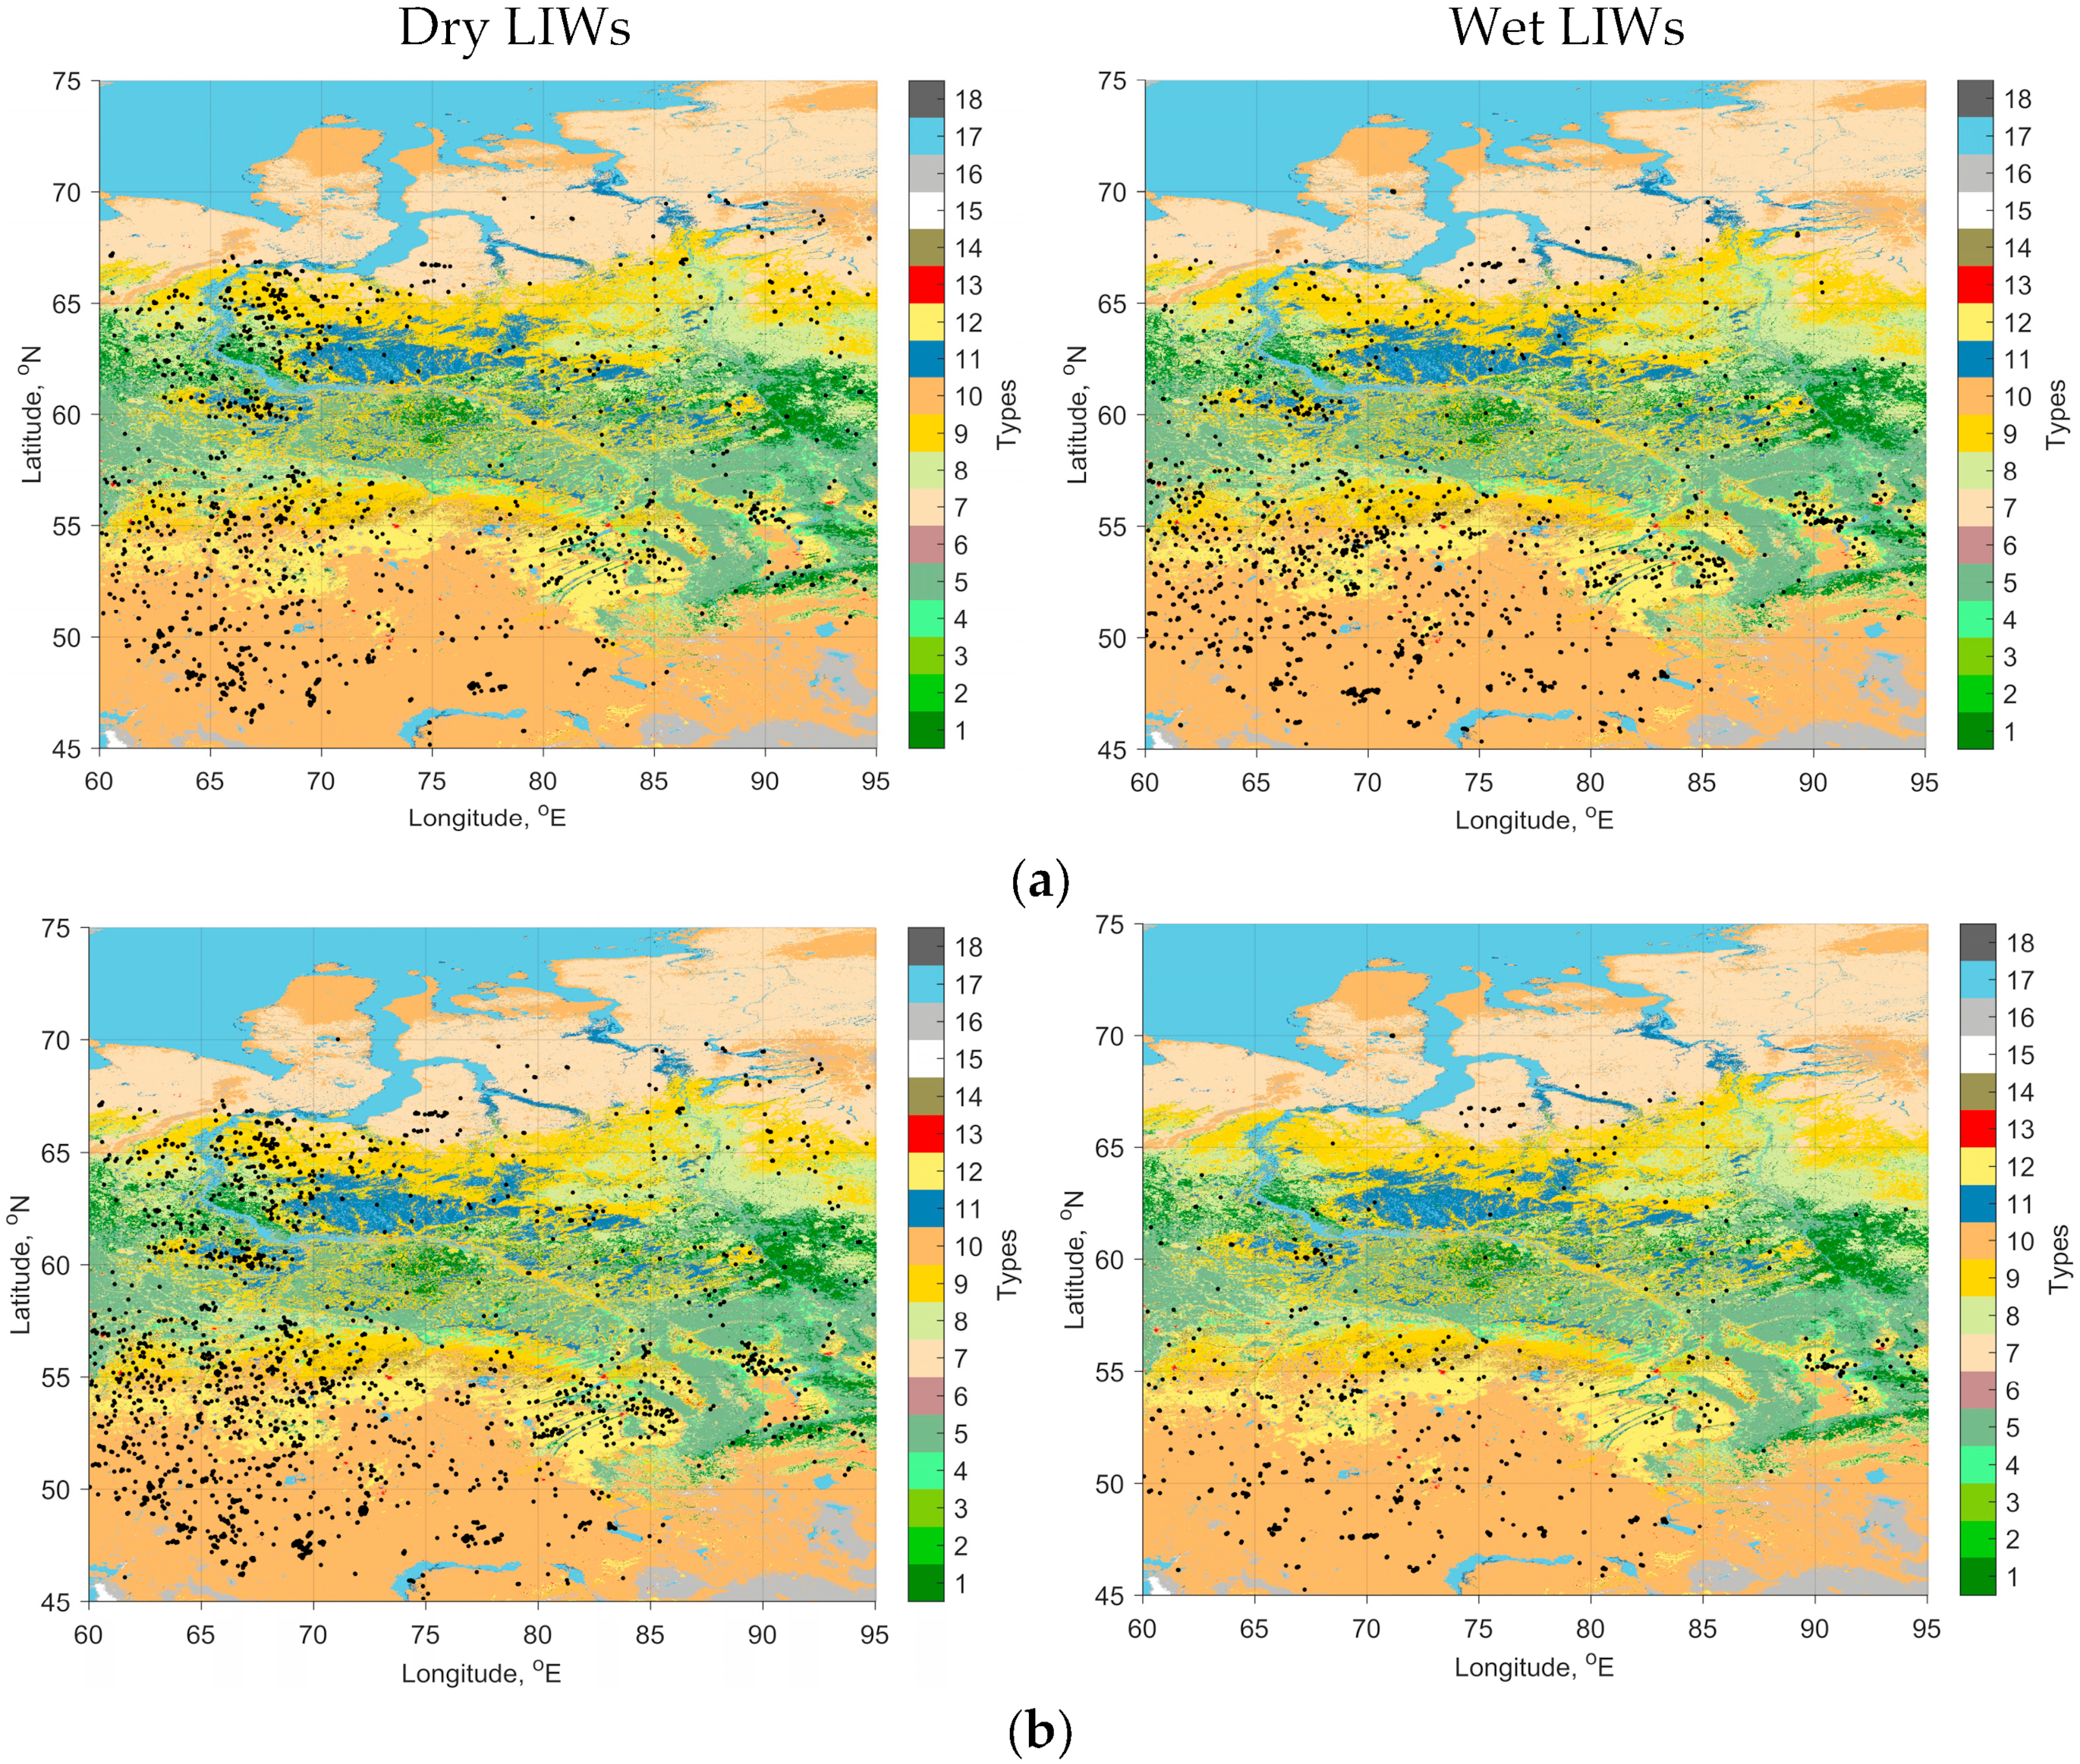
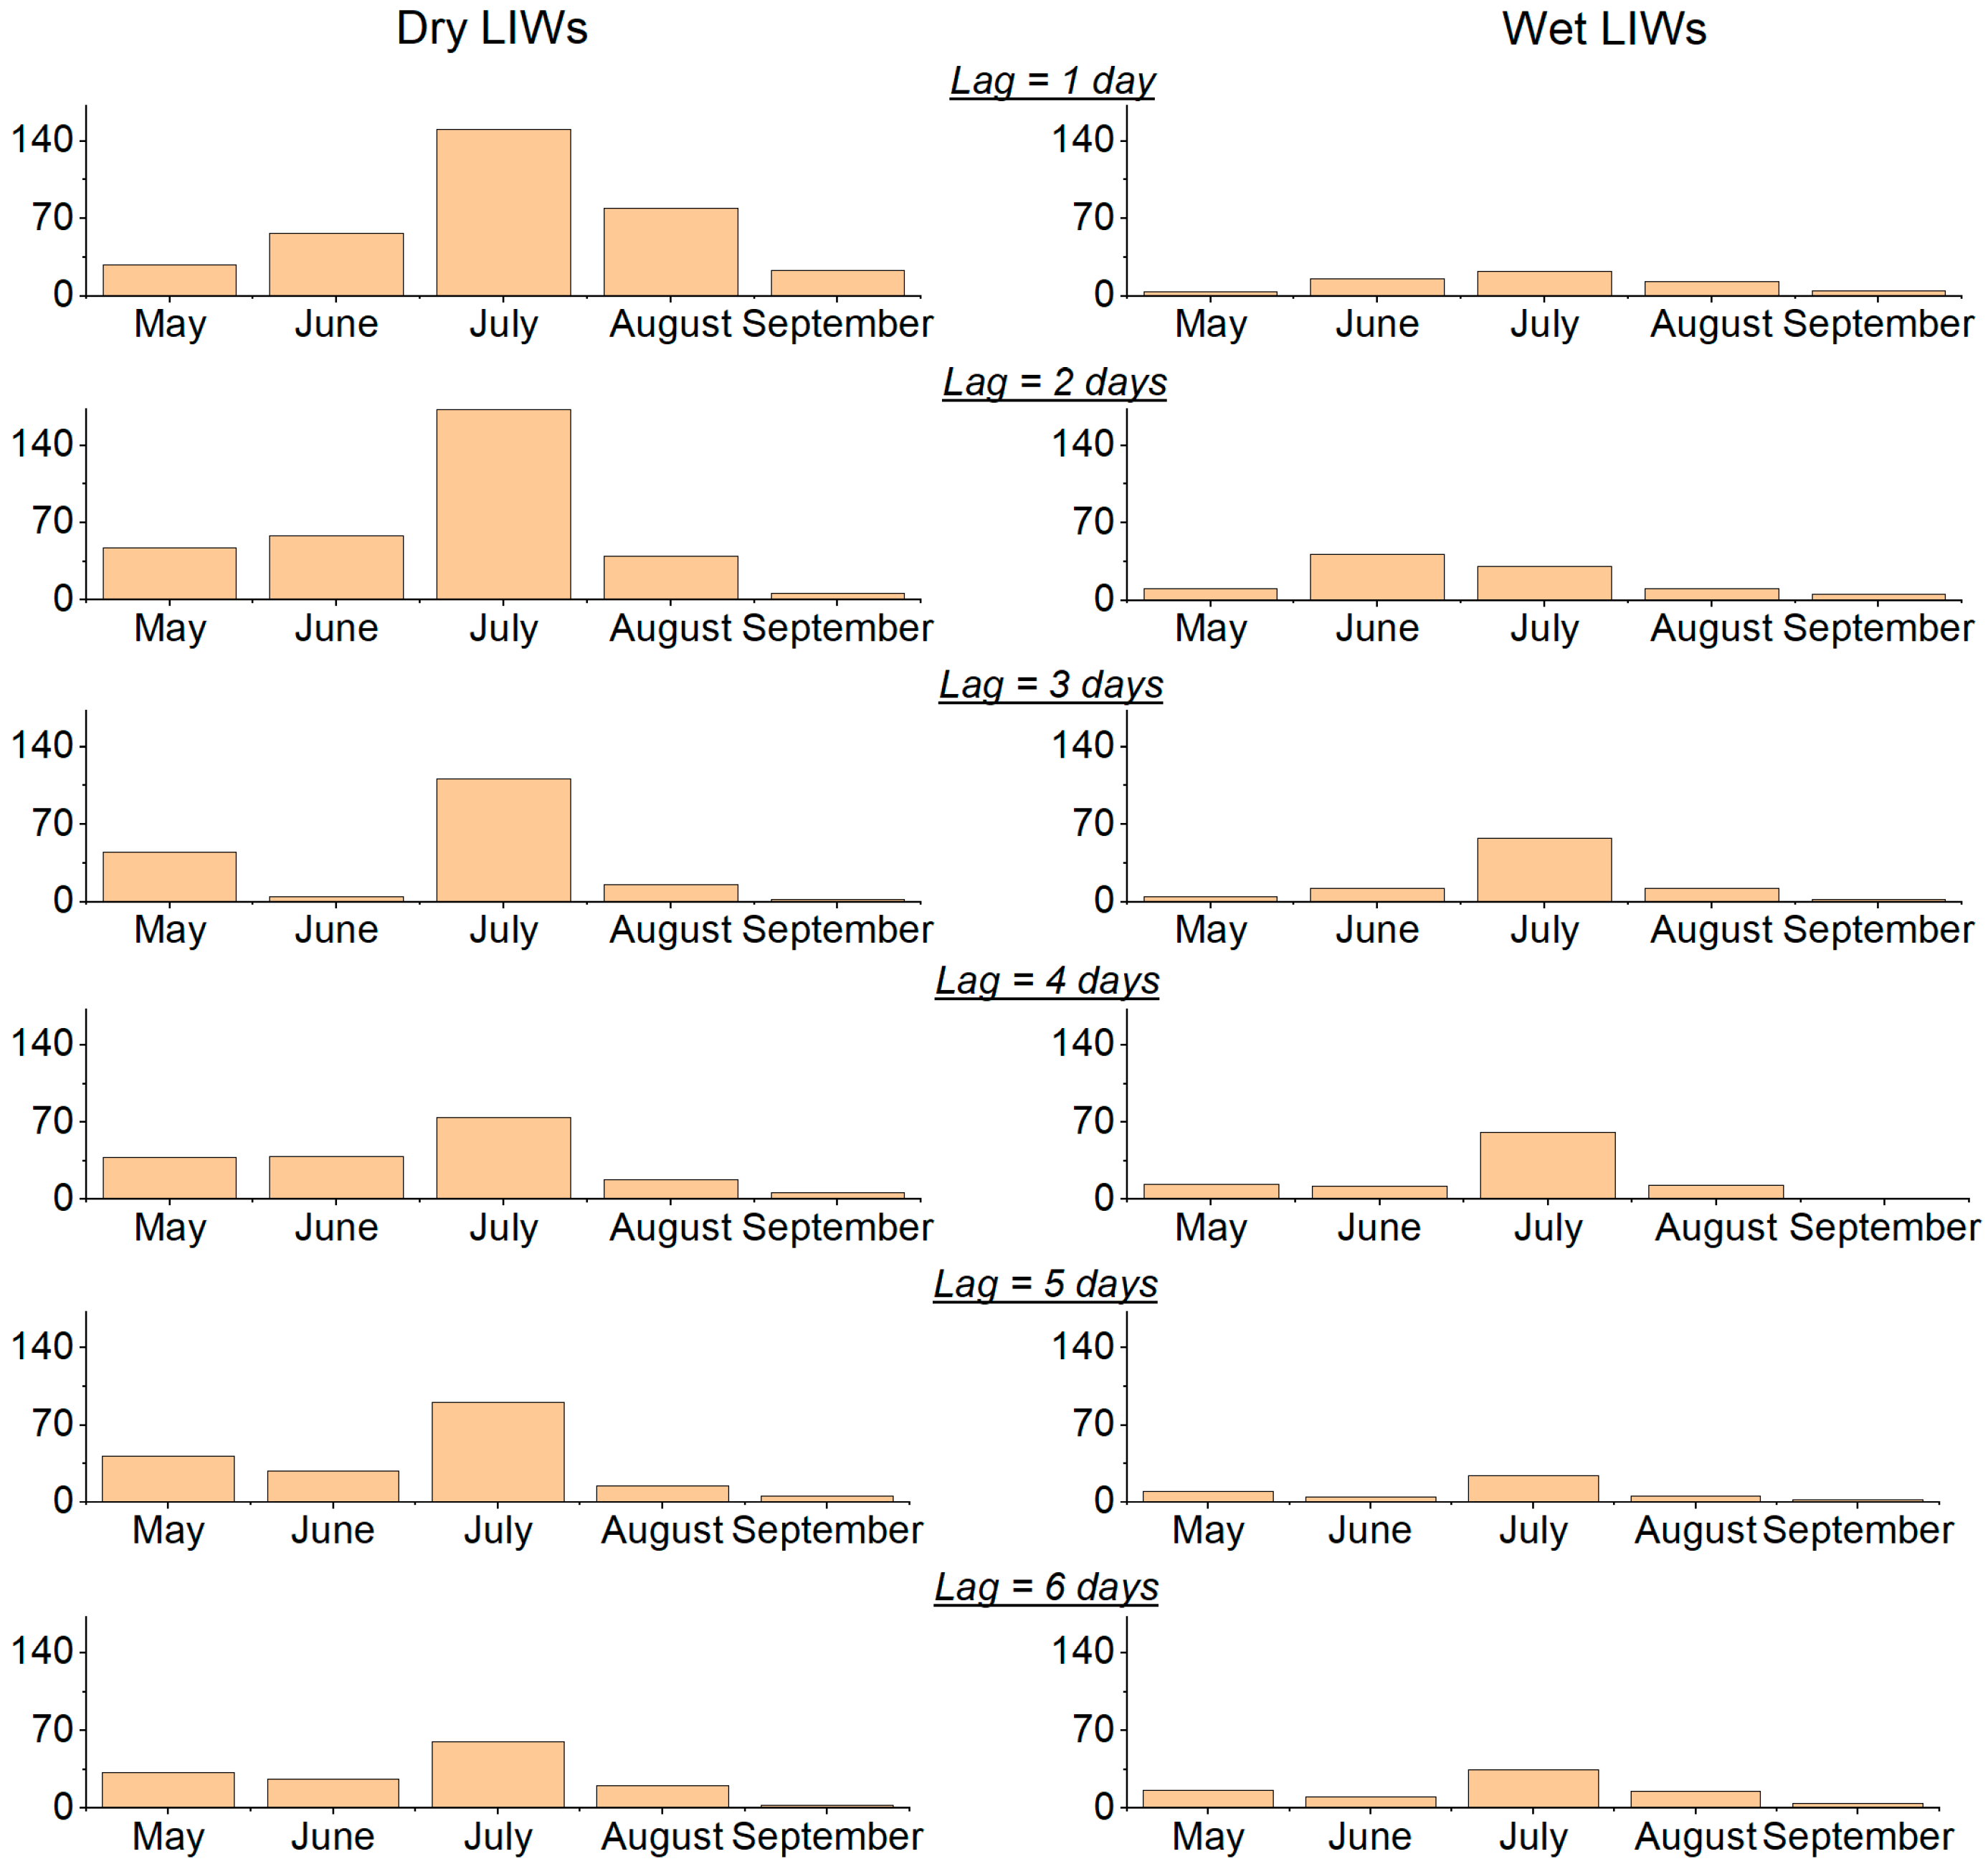
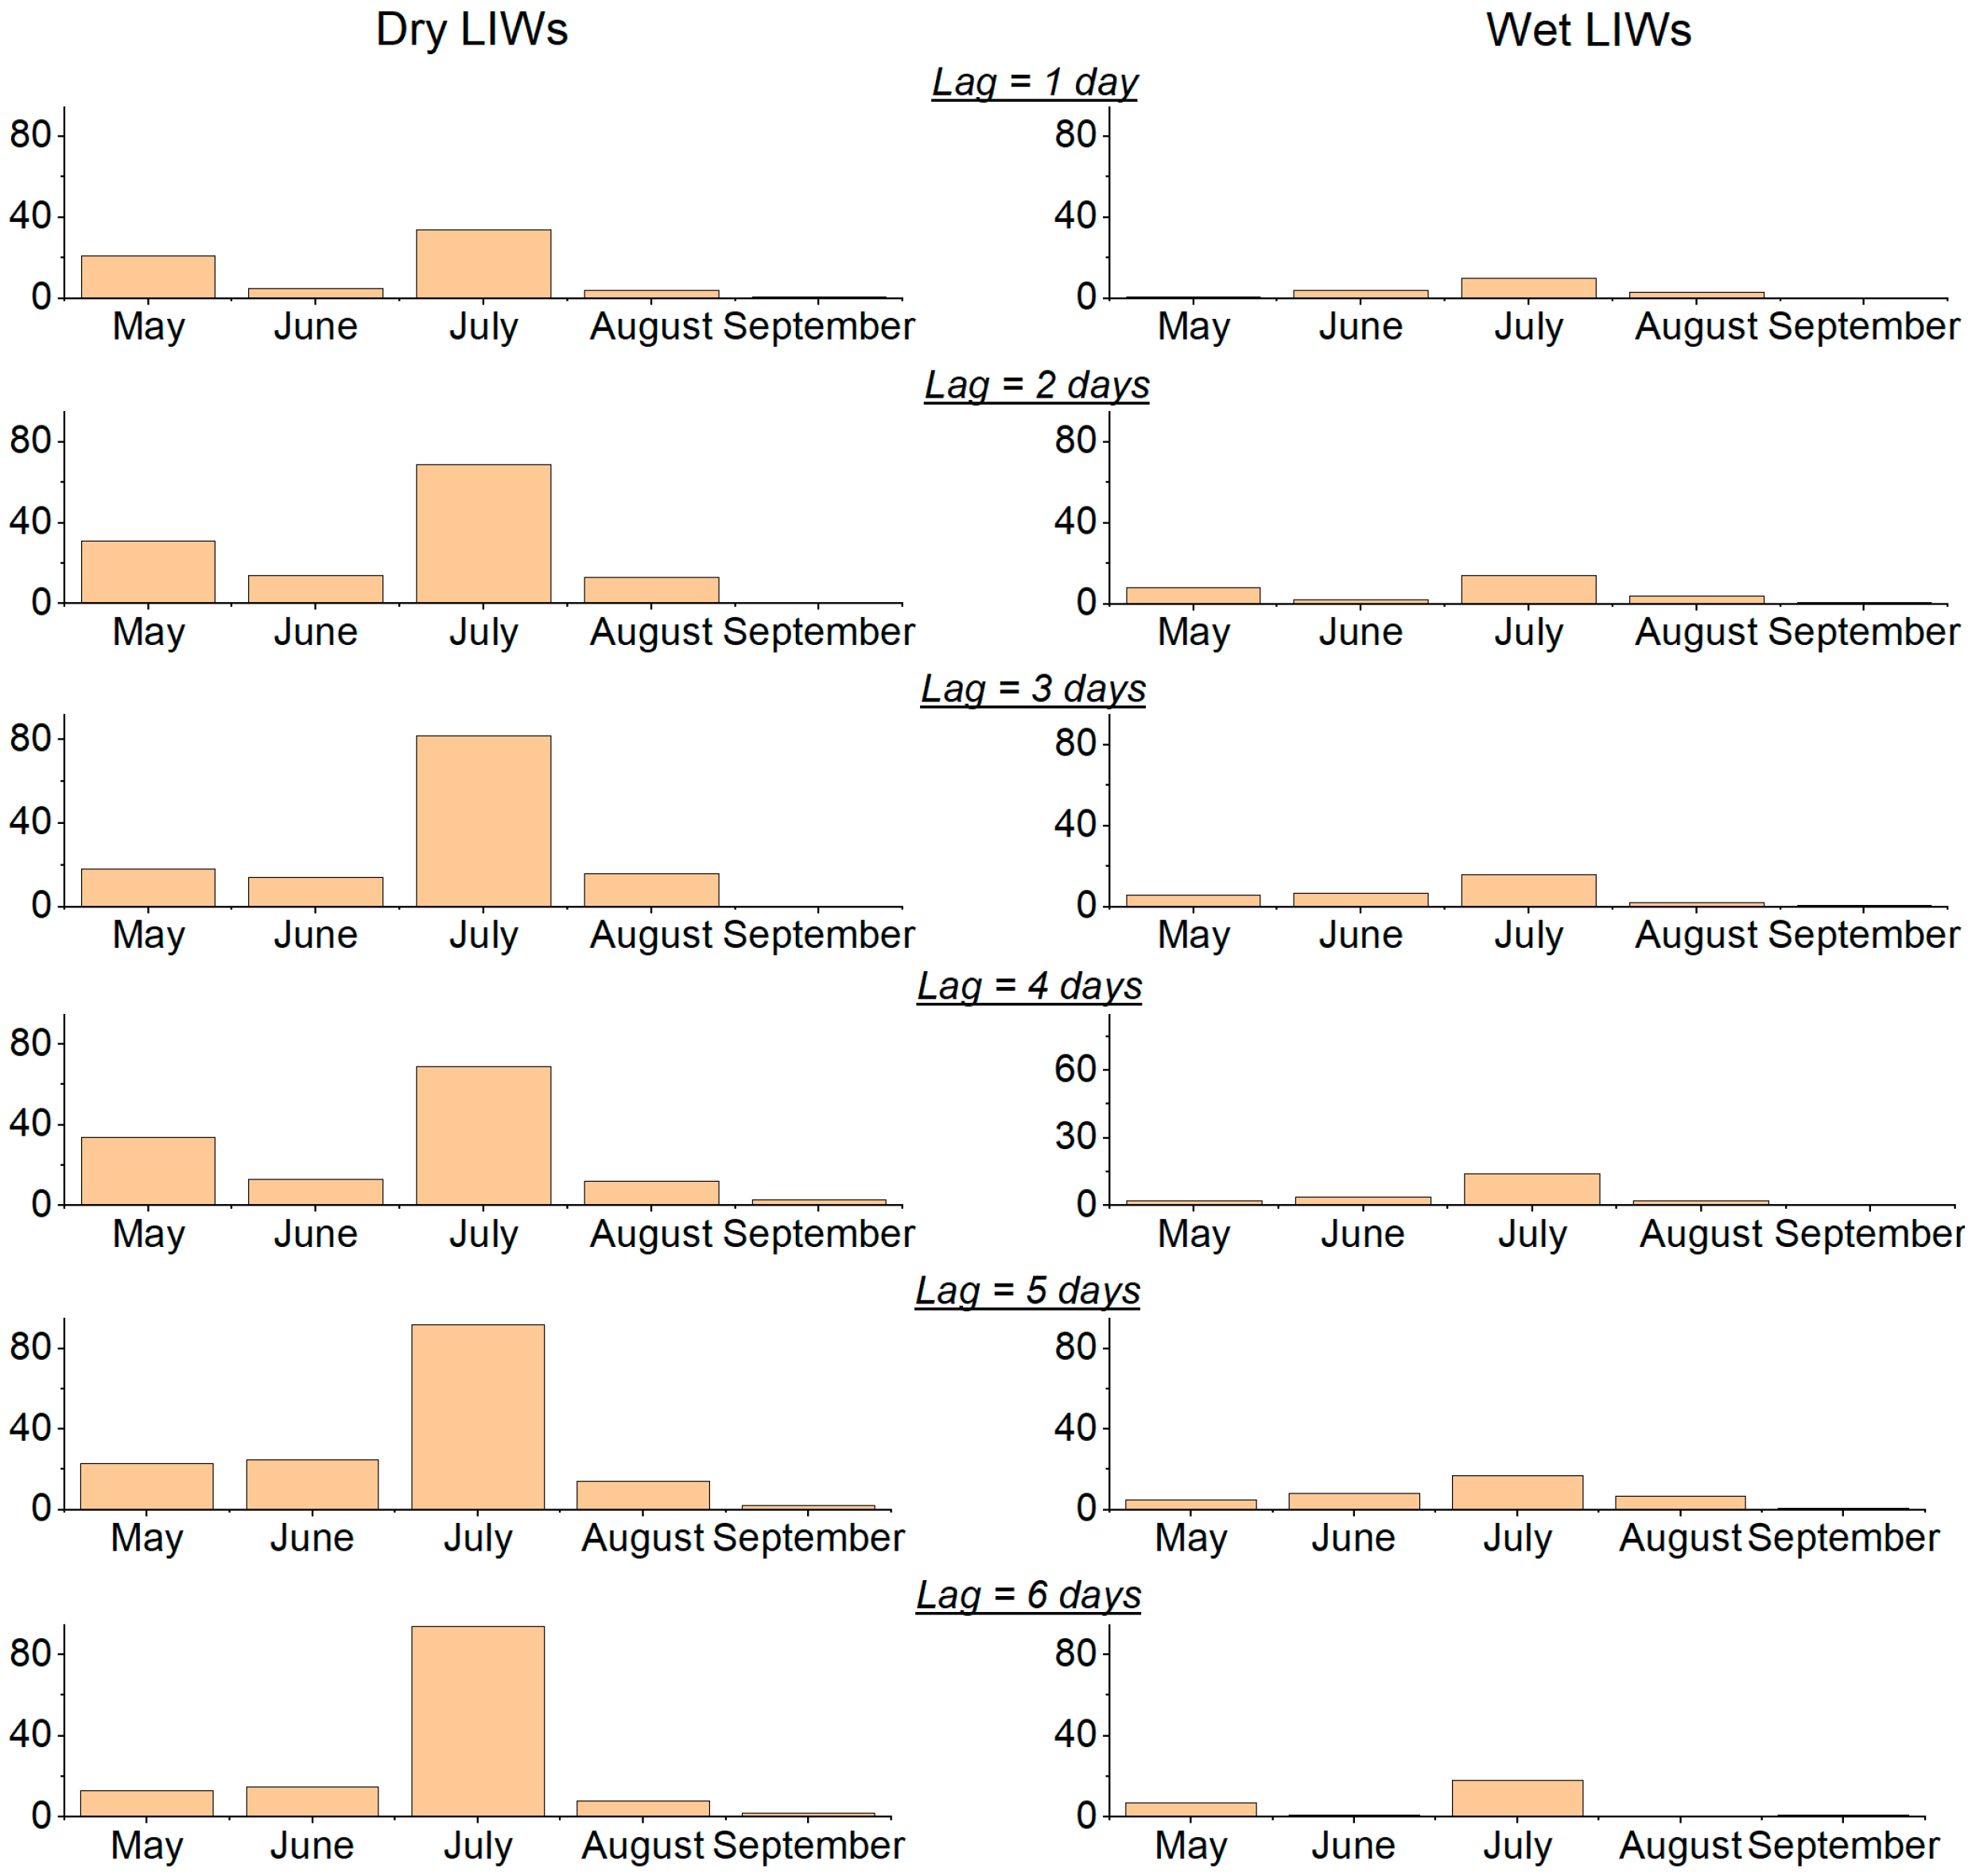
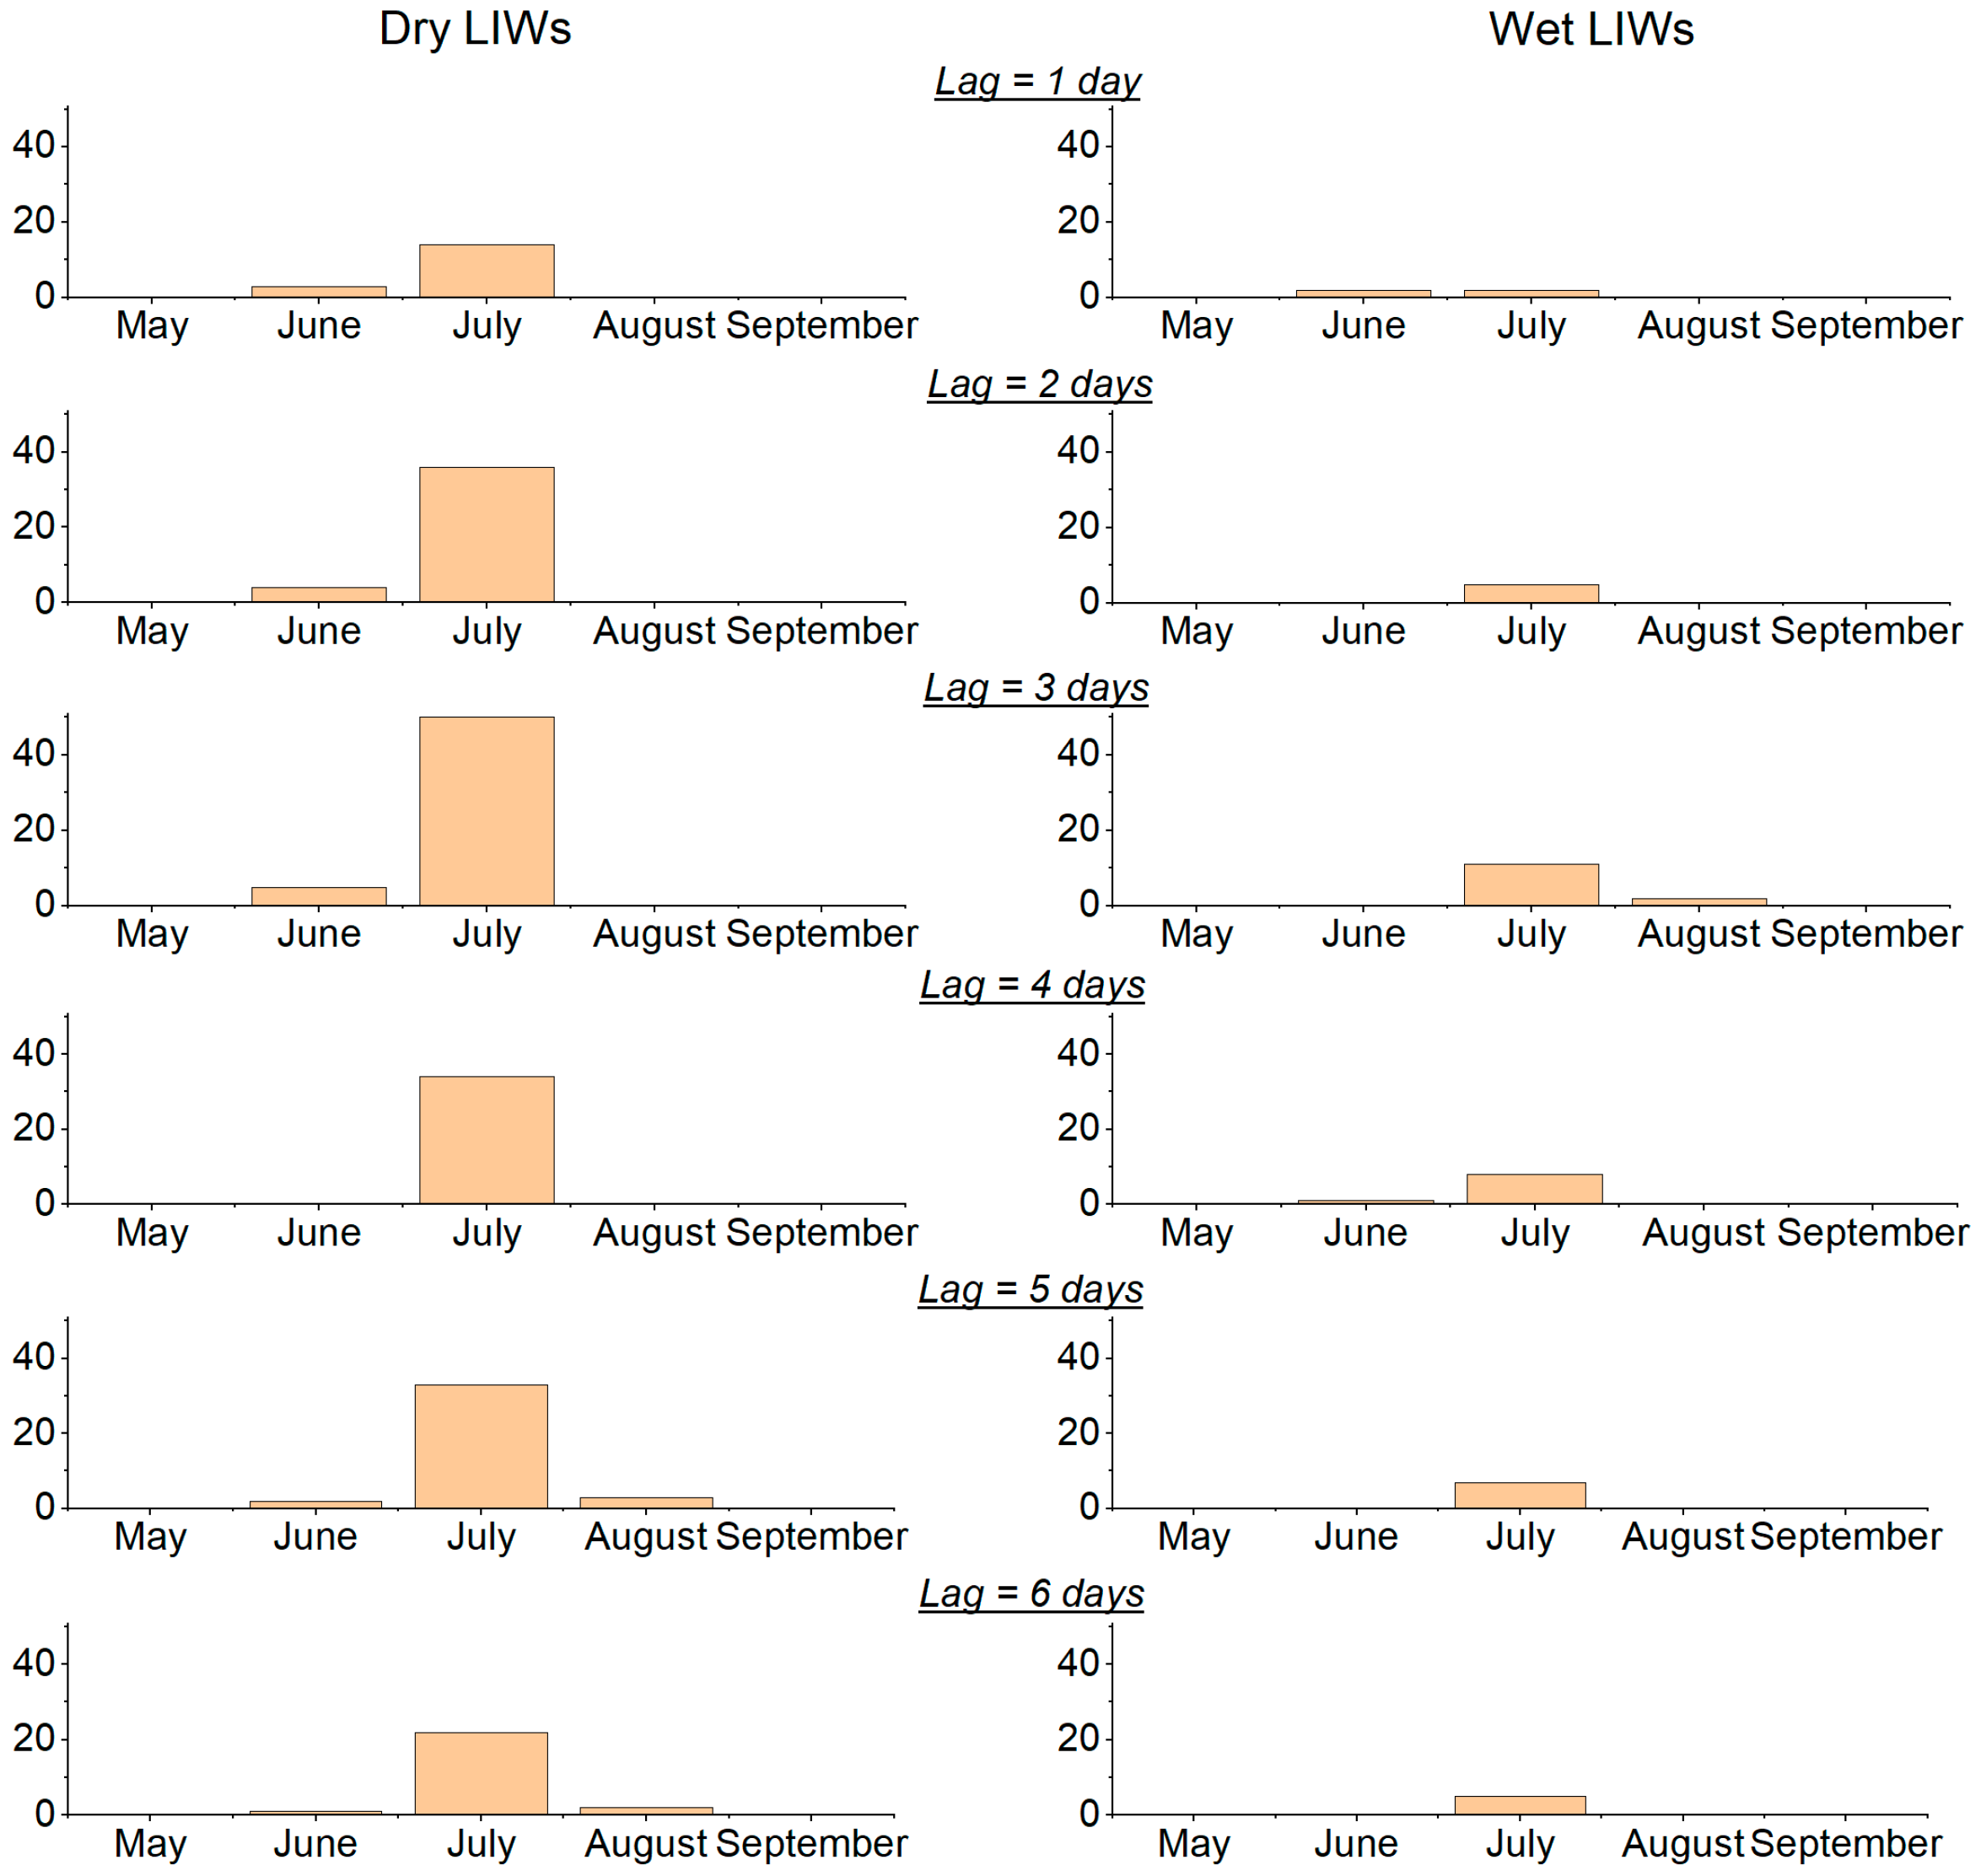
3.1. Spatio-Temporal Variability in the Number of Lightning-Ignited Wildfires

From the analysis of Figure 2, where spatial distribution of all selected LIW cases (B > 0%, holdover period = 6 days) is presented, it follows that, in general, the number of Dry LIWs is less than the number of Wet LIWs when tv = 0.25 mm/day (Figure 2a). When we change tv = 2.5 mm/day, we observe the greatest number of Dry LIWs (Figure 2b). However, in both cases, the LIW maximum is situated in the southwestern part (with savannas, grasslands, and cropland) and in the northwestern part of the region (tundra and permafrost).
To exclude random events for further analysis, we use only the LIW cases with B > 80%. Totally, we revealed 1861 cases of LIWs for SWS, 909 cases for CWS, and 250 cases for NWS within the maximum holdover period of 6 days for the warm seasons of 2016–2021 (Table 1). From Table 1, it also follows that the highest estimates of white noise amplitude are observed for the Arctic zone for tv = 2.5 mm/day, which could be caused by the smaller number of revealed LIWs here than in other areas in Western Siberia. Moreover, LIWs with precipitation less than 2.5 mm/day occur in 74% cases in the south, 81% in the center, and 83% in the north and with precipitation less than 0.25 mm/day in 41%, 55%, and 63%, respectively. Thus, in the Arctic zone of Western Siberia, fires associated with thunderstorm activity are predominantly caused by dry lightning. Then, we calculated the part of Dry LIWs for each day/lag (time between lightning and ignition) from the total Dry LIWs number. Based on the results presented in Table 2, we can conclude that Dry LIWs for each precipitation threshold predominantly occur during the first 3 days after a lightning strike in SWS (63% of cases) and in NWS (56% of cases). Moreover, in the south of the region, the maximum of Dry LIWs is observed during the first 2 days after a lightning strike when tv = 0.25 mm/day (27%) and during the first day when tv = 2.5 mm/day (24%). In the south and in the north of the region, the largest number of Dry LIWs is observed within 3 days after a strike, and in CWS, the maximum shifts to the fifth day when tv = 0.25 mm/day.
According to different studies, the precipitation threshold tv = 2.5 mm/day is quite widespread for dry lightning identification; thus, in the framework of our research, we decided to choose this criterion for further calculation and analysis to make our results more comparable [17,22,23,24].
The maximum number of LIWs (B > 80%) in SWS for the period of 2016–2021 was observed in July (Figure 3). There is an exception for LIWs with precipitation on the second day after the lightning strike, when the maximum is shifted to June. In CWS, the most fire-dangerous month is also July, but the number of fires in the central part is less than in its southern part (Figure 4). At the same time, a longer smoldering is observed here, which is probably due to the fuel characteristics: the holdover period is longer in forest and swamp ecosystems than in steppe landscapes. It is also worth noting that the second maximum is observed in May for Dry LIWs at the third day after the lightning strike (the largest contribution belongs to the second decade in May 2019 in SWS and in May 2021 in CWS, when seasonal changes in the thermobaric field occur).
In contrast to SWS and CWS, there are quite certain tendencies in NWS: the largest number of LIWs is observed in July on the third day after lightning strike (Figure 5). At the same time, the maximum is in 2017 and 2016, which is consistent with [48], when in the northern part of Western Siberia, a high level of smoke aerosol was observed, associated with a large number of fires in the third decade of July 2016. Thus, it can be assumed that most of them were caused by lightning activity.

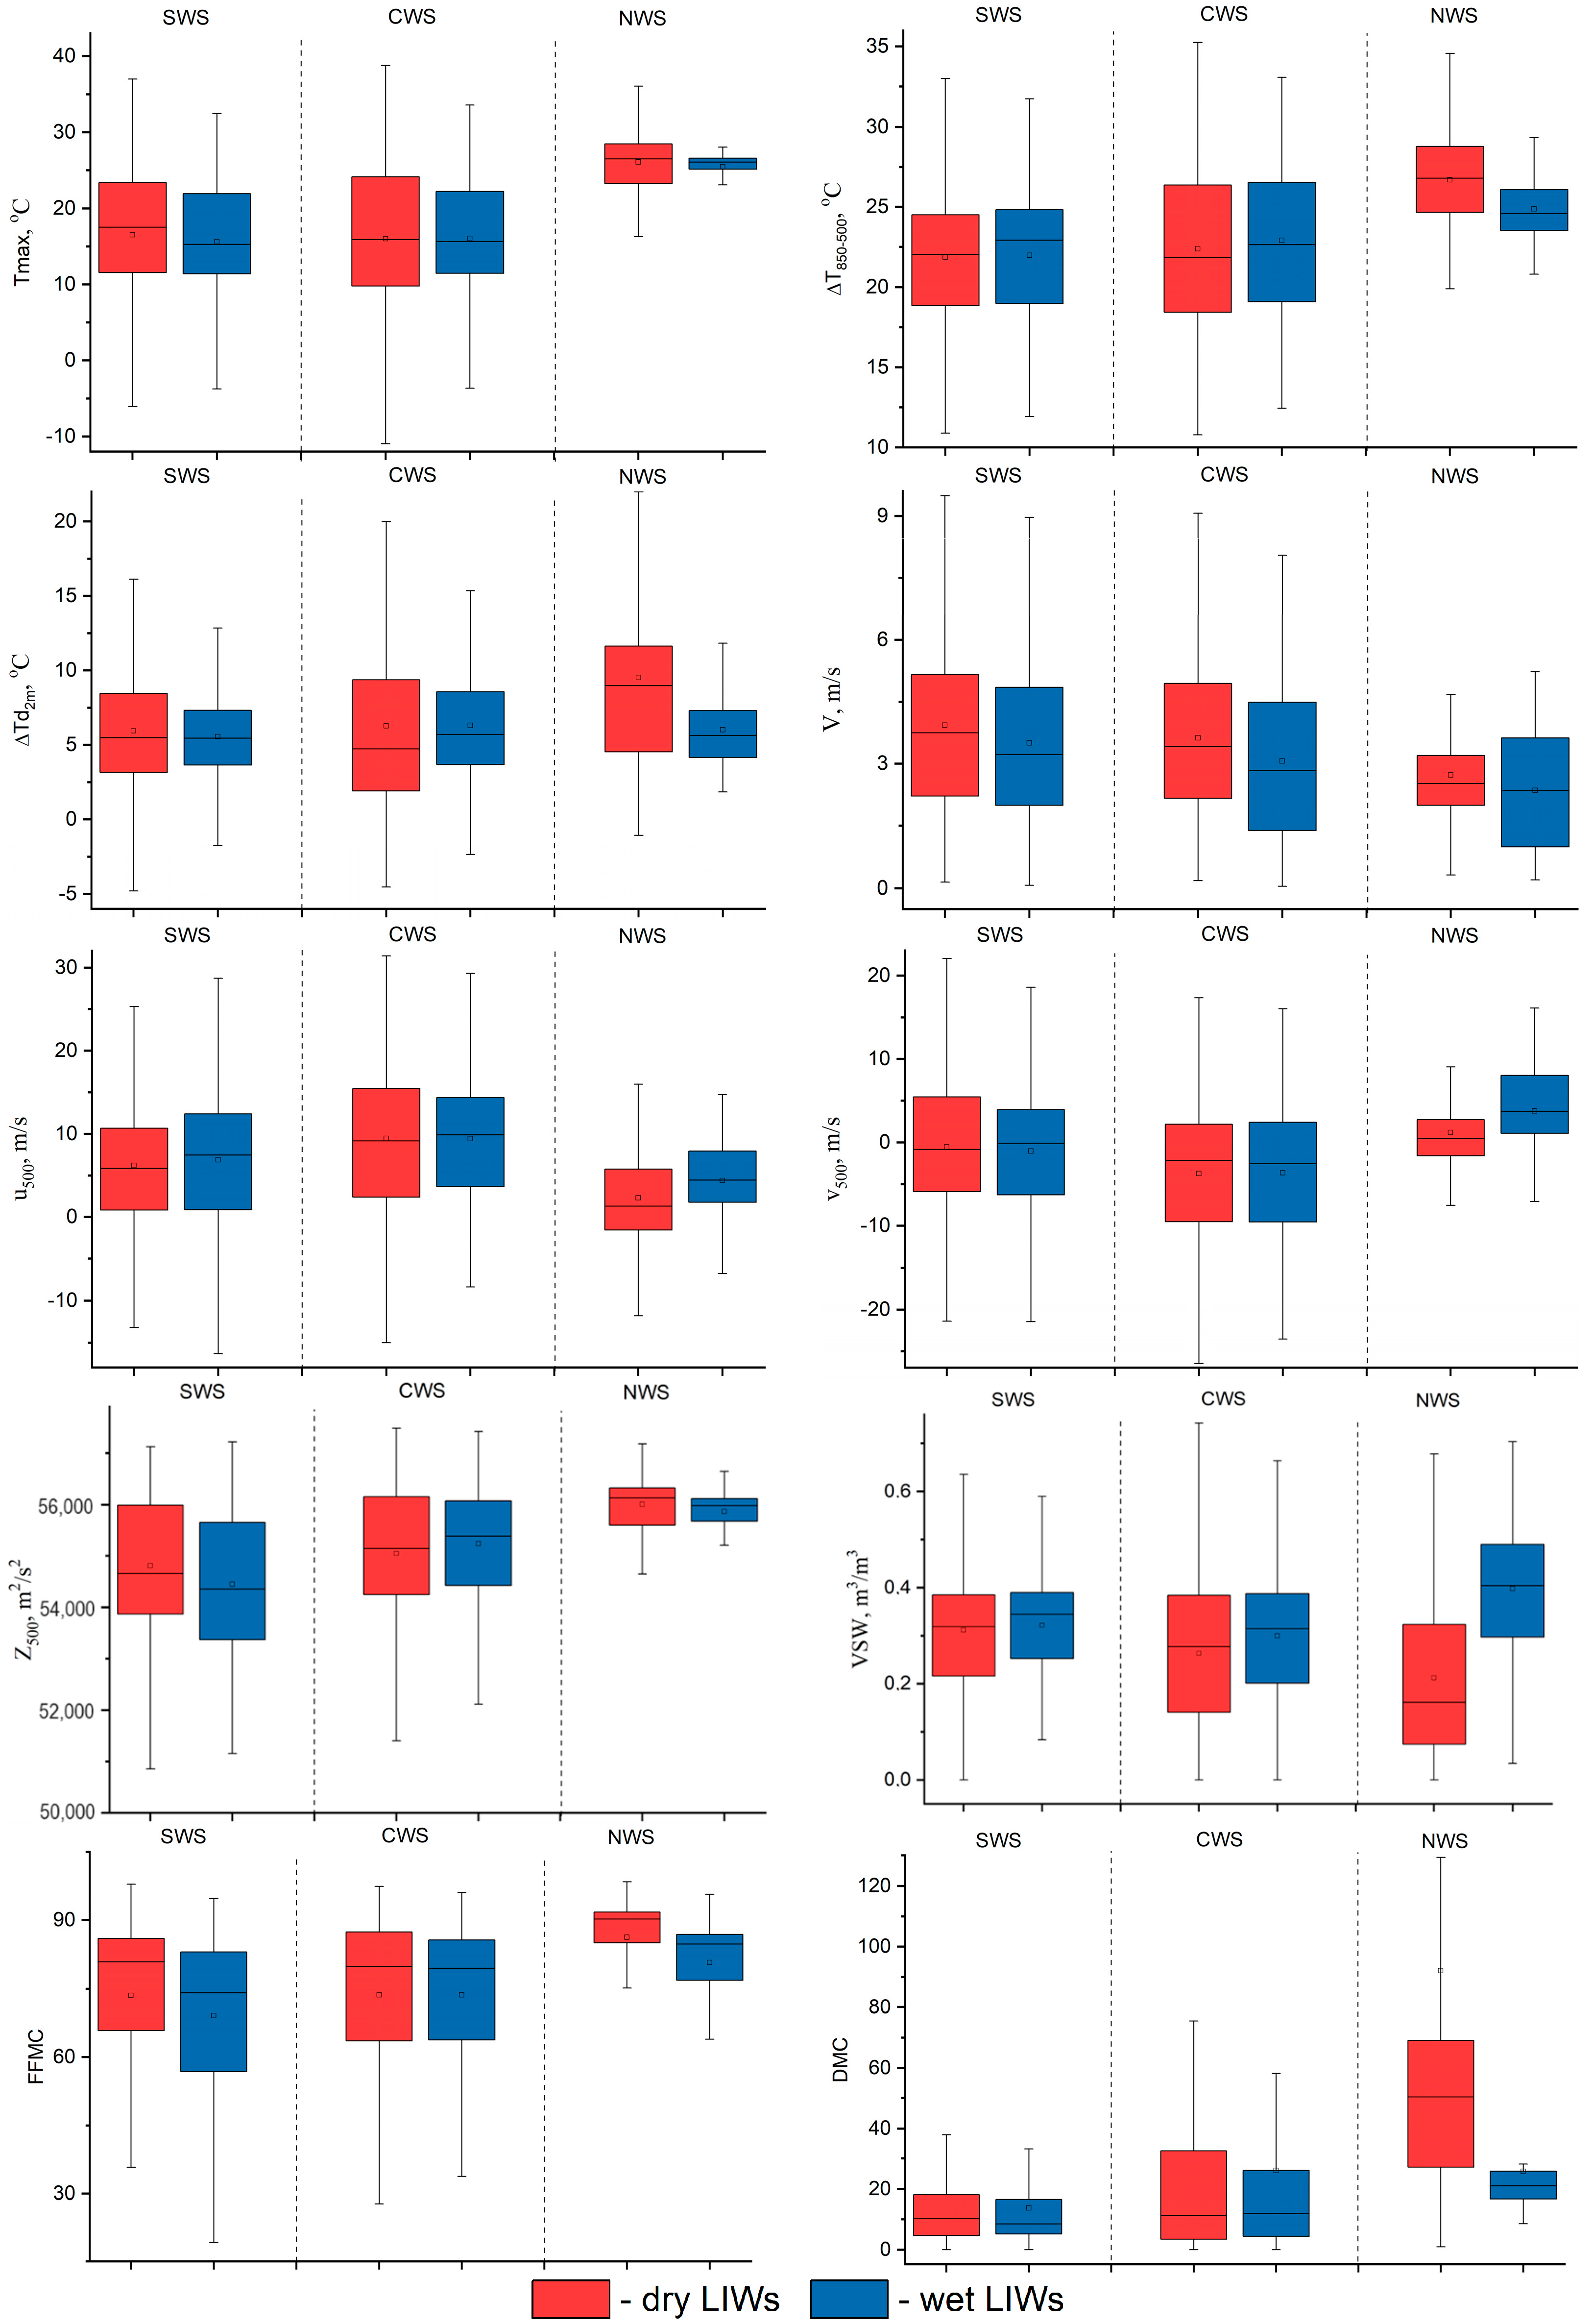
3.2. Meteorological Conditions Preceding Lightning-Ignited Wildfires

The meteorological conditions preceding selected cases of Dry and Wet LIWs for each day before the ignition in Western Siberia for 2016–2021 are presented in Figure 6.
As a rule, changes in meteorological values tendencies are observed 3–4 days before a fire occurrence. Thus, there is a well-pronounced decrease in Tmax and ∆T850-500 in NWS. As in SWS and CWS, there are no significant changes in these meteorological parameters. It should be noted that in the north, LIWs occur with higher surface air temperatures and with higher temperature differences at isobaric layers in the troposphere than in the center and in the south.
The dew point depression (∆Td2m), which is the air temperature minus the dew point temperature (an absolute measure of how much moisture is in the air), has the highest values in NWS and the least in SWS; that is, in the northern regions, the occurrence of LIWs (especially Dry LIWs) occurs in drier air than in the southern ones. As for Wet LIWs, ∆Td2m starts to decrease in NWS at 3 days before the fire (the air contains more moisture), and in CWS and SWS, moisture increases later, immediately before the ignition (1–2 days).
The most significant changes in wind speed (V) are observed in the north of the region—there is an increase at 4 days before the fire, and for Wet LIWs, in contrast to Dry LIWs, this increase in wind speed is most pronounced. From the analysis of Figure 6 (u500 and v500), zonal transfer generally prevails throughout the region during the period from the moment of lightning to an ignition. There is an exception for Wet LIWs in the northern part of WS, where a decrease in zonal transfer from the west and an increase in meridional transfer from the south are observed 3 days before the ignition (Figure 6).
The parameter of geopotential at the level of 500 hPa decreases 3 days before the ignition in the north and 1 day before the ignition in the south and in the center. As usual, the cases of Dry LIWs occur at higher values Z500 than those of Wet LIWs.
The volumetric soil moisture for Wet LIWs increases in the north at 3 days before the ignition, and in the south and center, it increases at 1 day before the ignition (Figure 6). For Dry LIWs, the situation is reversed. The greatest differences between soil moisture content values during Wet and Dry LIWs are observed in the NWS.
The variability of fuel moisture components is in good agreement with changes in soil moisture. The FFMC (characterizes moisture content in the layer up to 1.2 cm) index begins to increase from the fourth day before Dry LIWs, that is, the fuel becomes drier, and, on the contrary, FFMC decreases for Wet LIWs (the fuel becomes wetter). At the same time, fires from dry lightning occur in the north when the fuel moisture content is less than that in other regions (FFMC has maximal values). Almost the same situation is observed for DMC (characterizes moisture content in the layer up to 7 cm). This index has a well-pronounced constant growth in the north during all 6 days before cases of fire from dry lightning (Figure 6).
Further, we calculated the ranges for all parameters we consider for cases of Dry and Wet LIWs (Table 3 and Table 4, Figure 7). Table 3 and Table 4 present the precise threshold values of ranges, and Figure 7 provides a visual demonstration of these results. Based on the values of the interquartile range analysis, we can conclude that Tmax varies significantly (in comparison with other regions) for Dry LIWs in CWS. However, as for average daily temperatures, these values are higher in NWS for cases of ignition from dry lightning, in comparison with Wet LIWs. Moreover, at the day of ignition, averaged Tmax estimates for Dry LIWs are lower than 3 days before the ignition (Table 3); that is also true for Wet LIWs in the north (Table 4). In general, these results are also appropriate for ∆T850-500 estimates.
As for ∆Td850, the greatest values of interquartile ranges are observed for Dry LIWs in CWS, and the smallest for Wet LIWs in NWS (Table 2 and Table 4, Figure 7). Wind speed, on the contrary, has the greatest variability for Wet LIWs, especially in CWS. Estimates of zonal wind component in the middle troposphere (u500 and v500) in SWS and CWS decreases by the day of ignition for Dry LIWs and increases for Wet. However, we should note that statistically significant values for wind components were derived only for Wet LIWs in CWS.
The VSW estimates have the greatest variability before the ignition in CWS with maximum values for Wet LIWs and minimum for Dry LIWs. For the northern part, we can also indicate the highest differences in fuel moisture components for different regions (FFMC and DMC). Significantly, these differences in NWS are well pronounced for the DMC (fuel moisture content in the layer of 7 cm).
In spite of the fact that the spatial distributions of meteorological parameters and fuel moisture characteristics preceding ignitions from dry lightning and from lightning with precipitation are similar, in general, they have some specific features for each group (Figure 8 and Figure 9). The common feature is in the meridional type of spatial distributions for Tmax, ∆T850−500, ∆Td2m, Z500, FFMC, and DMC: areas with maximum values are predominantly situated in the eastern part of WS (mountain regions in the northeast and southeast), and areas with minimum values are situated in the western part (where zones of mixed forests and peatlands are situated). It also coincides with the spatial distribution of fires from dry lightning (Figure 8). However, in the north, we observe that the situation is somehow different: most of revealed cases near the gulf of the Ob River are situated in the areas of Tmax, ∆T850-500, ∆Td2m, and DMC maximum. An opposite situation is observed for wind speed at the surface; it is higher in the western part than in the eastern one. And in the northern part, near the gulf of the Ob River, LIWs occur under the influence of eastern transfer. As for VSW, areas with maximum values are predominantly located in the center parts of SWS, CWS, and NWS, which correspond to peatland and permafrost zones.
The spatial distributions of meteorological values preceding Wet LIWs (Figure 9) are generally the same, however, their variability over the territory is not well pronounced (like in cases of dry lightning). There is one exception for wind speed: the maximum values are higher in the west part of CWS than in cases of Dry LIWs. Moreover, it is difficult to reveal some patterns associated with selected cases of ignition from lightning with precipitation. The cases of Wet LIWs, in contrast to Dry LIWs, are not grouped in some areas, they are scattered throughout the territory and are mostly located in the center and in the south of WS. Probably, such a difference is caused by the origin of dry and wet lightning. We suppose that wet lightning mostly occurs in frontal systems, whereas dry lightning is a result of the intramass convection process.
Thus, based on the comparative analysis, an important role in the occurrence of lightning-ignited wildfires belongs to changes in the thermobaric field in the middle troposphere and fuel moisture, as a rule, 1–3 days before the fire, especially in the Arctic part of the region. This is also confirmed by the obtained significant estimates of the correlation coefficients (r) between the indicated parameters and the number of fires. At the same time, the highest estimates of the relationships are observed with the characteristics of atmospheric circulation—the components of zonal and meridional wind speed at 500 hPa (−0.72 and 0.74, respectively). The negative sign of r for u500 in this case indicates the direction of air transfer, i.e., means that eastern transport prevailed here.

4. Discussion

This research provides the spatio-temporal variability of lightning-ignited wildfires and the meteorological conditions preceding their occurrence from both dry and wet lightning in Western Siberia for 2016–2021.
Firstly, we compared LIW numbers based on two threshold precipitation values and found that in the northern part of the territory, fires from lightning occur in most cases in the absence of precipitation (less than 0.25 mm/day). The total precipitation threshold of 2.5 mm/day (1/10 inch) is widely used in the study of dry thunderstorms in different regions of the world: in the northwestern United States [17], in Alaska and Canada [22], in the North American boreal forests [23], Northern California [24], and Catalonia [21]. Moreover, it is obvious that the lower the amount of precipitation, the higher the probability of fire. For example, [13], using gridded precipitation data, shows that LIWs occur more frequently when daily precipitation is less than 2 mm. According to [44], if less than 1 mm of precipitation fell during a thunderstorm, then the probability of a fire from a lightning strike is approximately four times higher than in the presence of precipitation.
In the framework of this study, we assumed that a forest fire occurs under the condition that the distance between the first hotspot/fire that appears and the lightning discharge should not exceed 10 km (the presence of a lightning discharge within a radius of 10 km from the hotspot/fire). This parameter (10 km) was also used for the territories of Finland [42], the Mediterranean [20], and Yakutia [29]. However, in [49], the authors applied an 8 km radius for the South Brasilia; in [50], 2–5 km for South America; and in [51], 5 and 10 km for the Alps. In this study, we used the distance between the first hotspot/fire that appears and the lightning discharge of 10 km, due to the accuracy of the WWLLN data [20]. We chose this data set because it allows us to assess the spatial distribution of lightning activity in a vast region of Western Siberia [9,52]. In our previous study [43], we revealed that there is a 30% probability of fire occurrence from lightning in the Siberian Arctic. This is the highest value in comparison with the southern parts.
In the current article, we have selected a total of 3020 cases of LIWs in Western Siberia for the warm seasons of 2016–2021, and 2407 of these cases are related to Dry LIWs (threshold precipitation value = 2.5 mm/day). Some studies provide estimates of the LIW numbers for other regions; however, it is not possible to compare these results with our estimates since the regions under study have their own specific geographical and climatic conditions, and these estimates were derived for different time intervals. For example, in Finland, 522 LIWs were revealed for 1992–2001 [42]; in Florida, 230 LIWs for 1998–2002 [53]; in Austria, 573 LIWs for 1993–2010 [54]; in the USA, 905 LIWs for 2012–2015 [55]; in Switzerland, 267 LIWs for 2000–2018 [51], etc.
The influence of meteorological conditions on the occurrence of fires from dry thunderstorms has been studied in a number of studies, and, as a rule, these conditions can differ significantly for each individual territory. Thus, according to [17], it is shown that in the northwest of the Pacific Ocean, dry thunderstorm days occur with low atmospheric stability and low humidity in the lower layers of the atmosphere, and wet thunderstorms are characterized by the opposite conditions. In the United States [14], Australia [18,19], and the Mediterranean basin [20], the characteristic conditions for the occurrence of dry thunderstorms are lower relative humidity and a high temperature difference between values at 850 hPa and at 2 m. These conditions promote the evaporation of precipitated water before it reaches the ground [56]. According to [20], in the Iberian Peninsula and Greece, LIWs typically occur during dry thunderstorms with weak updrafts, in clouds with a high base and vertical moisture content below the climatic value, and also with higher temperatures and less precipitation.
Dry lightning needs three key ingredients: mid-tropospheric moisture, a lifting mechanism, and a sufficiently dry lower troposphere [17]. For example, in Catalonia, LIW episodes tend to be dynamically related to shortwave troughs at 500 hPa. Whereas, in Western Siberia, on the contrary, we observe a high geopotential field.
We also found that values (∆T850-500 and ∆Td2m) for both Wet and Dry LIWs are less than those presented in [17] for the Pacific Northwest of North America; in [18], for southeastern Australia; and in [22], for California. Relatedly, the values are comparable with results for Catalonia in [21]: the average of ∆Td2m for Dry LIWs is approximately 8.9 °C with the 75th percentile close to 10.7 °C. And ∆T850-500 (average value 25.9 °C) can be compared with [17,18] only for the northern (Arctic) part of Western Siberia. However, according to [44], the relationship between dry lightning and the 850–500 hPa temperature lapse and dew point depression at 850 hPa is reasonably similar for different regions and indicates that the physics behind dry lightning may be somewhat universal [18,21]. It should be noted that we carried out the analysis for different latitudinal zones in Western Siberia and can draw the conclusion that the LIWs in the Arctic occur under the most extreme meteorological conditions. For example, for Dry LIW occurrence in the north, daily Tmax values should be in ~1.5 times higher than those for more southern regions (Table 3 and Table 4).
As a parameter of instability, we used the temperature difference at different levels in the troposphere, while some authors use indices of atmospheric instability, for example, CAPE. Thus, in [23], it was found that in Canada and Alaska, cases of wet thunderstorms occur in a wide range of CAPE index values. And, in the case where 500 hPa geopotential heights exceed ~5700 m and CAPE values are close to the maximum observed thresholds, there is a high probability of dry lightning occurrence. In [20], high CAPE values more often correspond lightning to causing a fire in the Mediterranean basin. However, according to [57], thunderstorms in Western Siberia were recorded with CAPE index values up to 1000 J/kg, that is, with a slightly or moderately unstable state of the atmosphere (when CAPE values are up to 2500 J/kg). It is known that the CAPE index is characterized by rapid spatio-temporal fluctuations; therefore, the use of this index to predict the development of thunderstorm activity in our region is recommended only in combination with other indices. Moreover, according to [56], indices describing thunderstorm activity in the lower troposphere, such as CAPE, are insufficient to predict the potential of dry thunderstorms.
Some authors use the soil moisture parameter as a criterion for dry lightning identification due to its lower spatial variability and more higher predictability, in comparison with precipitation [22]. According to [58], indices from the CFFWIS characterized fuel moisture up to 7 cm (DMC) as a standard indicator of a landscape’s susceptibility to fire from lightning. At the same time, the author identified a difference in the rate of increase in the number of fires per lightning strike depending on the type of forest. In [27], we revealed that maximum correlations (r = 0.5–0.6) between number of hotspots and fuel moisture components were observed for DMC and FFMC in the spring and summer months in the south of Western Siberia. Thus, [2,25,26] found that the occurrence of extreme fires in Central Siberia and the Transbaikal region may be associated with anomalies in soil moisture and precipitation. The relative importance and impact of dryness indicators on wildfire vary spatially [59]—it depends on the region and wildfire characteristics [4,60]. In our current research, we have also found an important role in the ignition of fuel moisture components in Western Siberia, especially from dry lightning. According to [21], those ignitions that spread shortly after the lightning strike occur under characteristic environmental conditions, which can be reasonably forecasted using the correct selection of parameters. Based on our results, we suggest that the meteorological conditions play an important role in ignition 3–4 days before it. However, for understanding lightning-caused fires and for attempting to model their occurrence, it is important to remember that a lightning fire can go through a number of phases in its lifetime: it is ignited by a lightning strike, then it can smolder for a time period, spread to a surface fire, and, possibly, transition back to a smoldering one. In this regard, the relationship between lightning flashes and fires will be non-linear, as well as the dependence of fire occurrence on meteorological conditions from lightning activity and the influence of soil moisture on the fire occurrence [26]. Moreover, from the analysis of Figure 8 and Figure 9, it follows that meteorological parameters have large spatial inhomogeneity. That is why, in some cases, threshold values for each latitudinal zone can indicate not the mean values for the region but only a local event. For example, this situation is observed in the north and northeast of WS, where average values for this zone are determined by rare cases of LIWs here. Since we have obtained significant estimates of linear correlation coefficients only for individual meteorological parameters (wind speed in the middle troposphere) and the number of LIWs, we can suppose that the determination of relationships between meteorological parameters and lighting-ignited wildfires is a complicated process (especially for cases of dry lightning) and demands to consider many other factors, such as the characteristics of fires (burned area), lightning discharges (frequency), relief (elevation), and vegetation type. We did not take them into account in the framework of our study, but we plan to do so in future research to reveal cause-and-effect relationships.
Thus, for each individual region, the phenomenon of dry thunderstorms can arise due to different meteorological and geographical conditions, which must be taken into account when identifying and forecasting dry thunderstorms. At the same time, Western Siberia has significant “gaps” in the study of this issue. The novelty of our research is in the analysis of meteorological conditions and characteristics of fuel moisture for cases of fires from dry lightning and thunderstorms with precipitation in a vast territory of Western Siberia, highlighting its regional features, based on derived threshold values that are unique for our region. In the future, the obtained results will make it possible to more accurately describe the risks of fire hazard from thunderstorm activity (in particular from dry lightning), since indices existing at the moment do not take into account its influence. This can be the basis for the development of a regional fire hazard index for various types of underlying surfaces.

5. Conclusions

In the framework of the study, we carried out an analysis of the spatio-temporal variability of lightning-ignited wildfires and the meteorological conditions preceding their occurrence from both dry lightning and lightning with precipitation in Western Siberia for 2016–2021.
Totally, we revealed (with a probability of more than 80%) ~1800 cases of LIWs in the south, ~900 cases in the center, and 250 cases in the north of Western Siberia. LIWs with precipitation less than 2.5 mm/day occur in 74% cases in the south, 81% in the center, and 83% in the north and with precipitation less than 0.25 mm/day in 41%, 55%, and 63%, respectively. Thus, in the Arctic zone of Western Siberia, fires associated with thunderstorm activity are predominantly caused by dry lightning. The shortest holdover period (1–2 days) is observed in the south of the territory, where steppe regions predominate. The longest one (3–5 days) is in the central part, which is probably due to the characteristics of vegetation and soil type (forest zone, peatland area), due to which the smoldering time may increase.
The most significant changes in meteorological conditions before ignition are also revealed in the northern part at 3–4 days before ignition. Among all considered parameters, the important role in dry lightning-ignited wildfire (in contrast to lightnings with precipitation) occurrence belongs to mid-tropospheric instability, lower-tropospheric dryness, and moisture content of the top soil and surface floor layer, which are mostly observed against the background of a high-pressure field.
The obtained results indicate that dry lightning-ignited wildfires, in contrast to the wet thunderstorms, occur under higher temperatures and low-level dry air conditions. Moreover, in the Arctic zone of Western Siberia, more extreme (hotter and drier) meteorological conditions should be observed for the occurrence of ignition from lightning.
Thus, the derived threshold values for the considered meteorological parameters are unique to our region and its separate natural zones. Obtained results can be used in the development of models and regional indices for potential fire hazards prediction in various landscapes, which will have practical applications in various spheres of the national economy.

Author Contributions

Conceptualization, E.K. and E.M.; methodology, E.K., E.M. and K.P.; software, E.M., K.P. and S.L.; formal analysis, E.K. and E.M.; investigation, E.K. and E.M.; resources, and data curation, E.M., K.P. and S.L.; writing—original draft preparation, E.K. and E.M.; writing—review and editing, E.K. and E.M.; visualization, E.M., K.P. and E.K.; supervision and project administration, E.K.; funding acquisition, E.K. All authors have read and agreed to the published version of the manuscript.

Funding

This research is supported by the Russian Science Foundation (RSF), project # 22-27-00494, https://www.rscf.ru/en/project/22-27-00494 (accessed on 27 November 2023).

Institutional Review Board Statement

Not applicable.

Informed Consent Statement

Not applicable.

Data Availability Statement

The data presented in this study are openly available: hotspots in https://firms.modaps.eosdis.nasa.gov/ (accessed on 27 November 2023), reference number [41]; lightning discharges in https://wwlln.net/ (accessed on 27 November 2023), reference number [43]; permanent fires in http://ckp.geosmis.ru/ (accessed on 27 November 2023), reference number [42]; meteorological parameters and fuel moisture components in https://reanalyses.org/atmosphere/era5-references (accessed on 27 November 2023), reference number [47]; and vegetation type in https://worldview.earthdata.nasa.gov/ (accessed on 27 November 2023), reference number [49].

Conflicts of Interest

The authors declare no conflicts of interest.

References

  1. Hantson, S.; Arneth, A.; Harrison, S.P.; Kelley, D.I.; Prentice, I.C.; Rabin, S.S.; Archibald, S.; Mouillot, F.; Arnold, S.R.; Artaxo, P.; et al. The status and challenge of global fire modelling. Biogeosciences 2016, 13, 3359–3375. [Google Scholar] [CrossRef]
  2. Ponomarev, E.I.; Kharuk, V.I.; Ranson, K.J. Wildfires dynamics in Siberian larch forests. Forests 2016, 7, 125. [Google Scholar] [CrossRef]
  3. Bowman, D.M.; Balch, J.; Artaxo, P.; Bond, W.J.; Cochrane, M.A.; D’antonio, C.M.; DeFries, R.; Johnston, F.H.; Keeley, J.E.; Krawchuk, M.A.; et al. The human dimension of fire regimes on Earth. J. Biogeogr. 2011, 38, 2223–2236. [Google Scholar] [CrossRef]
  4. Podschwit, H.; Cullen, A. Patterns and trends in simultaneous wildfire activity in the United States from 1984 to 2015. Int. J. Wild. Fire 2020, 29, 1057–1071. [Google Scholar] [CrossRef]
  5. Veraverbeke, S.; Rogers, B.M.; Goulden, M.L.; Goulden, M.L.; Jandt, R.R.; Miller, C.E.; Wiggins, E.B.; Randerson, J.T. Lightning as a major driver of recent large fire years in North American boreal forests. Nat. Clim. Change 2017, 7, 529–534. [Google Scholar] [CrossRef]
  6. Chen, Y.; Romps, D.M.; Seeley, J.T.; Veraverbeke, S.; Riley, W.J.; Mekonnen, Z.A.; Randerson, J.T. Future increases in Arctic lightning and fire risk for permafrost carbon. Nat. Clim. Change 2021, 11, 404–410. [Google Scholar] [CrossRef]
  7. Kondratyev, K.Y.; Grigoryev, A.A. Forest fires as a component of natural ecodynamics. Atm. Ocean. Opt. 2004, 17, 245–255. [Google Scholar]
  8. Gorbatenko, V.P.; Volkova, M.A.; Nosyreva, O.V.; Zhuravlev, G.G.; Kuzhevskaia, I.V. Influence of climatic conditions on Western Siberian forest fires. In Predicting, Monitoring, and Assessing Forest Fire Dangers and Risks; IGI Global: Tomsk, Russia, 2020; pp. 269–293. [Google Scholar]
  9. Baranovskiy, N.V.; Krechetova, S.; Belikova, M.; Perelygin, A. WWLLN data cluster analysis methods for lightning-caused forest fires monitoring. Int. J. Electr. Comput. Eng. 2017, 6, 3112–3120. [Google Scholar]
  10. Yanko, I.P. Pirologicheskaya Ocenka Territorii Tomskoj Oblasti: Avtoreferat Dis. Kandidata Geograficheskih Nauk: 25.00.23/TGPU.–Tomsk, 2005; 20p. Available online: https://www.dissercat.com/content/pirologicheskaya-otsenka-territorii-tomskoi-oblasti (accessed on 13 December 2023).
  11. Kharuk, V.I.; Dvinskaya, M.L.; Im, S.T.; Golyukov, A.S.; Smith, K.T. Wildfires in the Siberian Arctic. Fire 2022, 5, 106. [Google Scholar] [CrossRef]
  12. Colson, D. High level thunderstorms of July 31–August 1, 1959. Mon. Weather. Rev. 1960, 88, 279–285. [Google Scholar] [CrossRef]
  13. Hall, B.L. Precipitation associated with lightning ignited wildfires in Arizona and New Mexico. Int. J. Wildland Fire 2007, 16, 242–254. [Google Scholar] [CrossRef]
  14. Rorig, M.L.; Mckay, S.J.; Ferguson, S.A.; Werth, P. Model-generated predictions of dry thunderstorm potential. J. Appl. Meteorol. Climatol. 2007, 46, 605–614. [Google Scholar] [CrossRef]
  15. Popov, S.D.; Sinitsyn, V.V.; Tatarinov, V.V.; Karnyushkin, A.I.; Khaustov, V.V.; Sulimenko, V.A. Set of operational serifs coordinate of lightning discharges with “dry thunderstorm” in system engineering activities against landscape fires. Proc. Southwest State Univ. 2014, 4, 69–76. [Google Scholar]
  16. Dorofeev, V.V.; Kuznecov, I.E.; Stepanov, A.V.; Shcherbinin, V.A.; Levchenko, A.V. Modeli diagnoza i prognoza pozharoopasnoj situacii v rajonah lesnyh massivov, obuslovlennoj “Suhimi” grozami. Pozhar. Bezop. Probl. Persp. 2014, 1, 142–146. [Google Scholar]
  17. Rorig, M.L.; Ferguson, S.A. Characteristics of lightning and wildfire ignition in the Pacific Northwest. J. Appl. Meteorol. 1999, 38, 1565–1575. [Google Scholar] [CrossRef]
  18. Dowdy, A.J.; Mills, G.A. Characteristics of lightning-attributed fires in south-east Australia. Int. J. Wildland Fire 2012, 21, 521–524. [Google Scholar] [CrossRef]
  19. Dowdy, A.J. Climatology of thunderstorms, convective rainfall and dry lightning environments in Australia. Clim. Dyn. 2020, 54, 3041–3052. [Google Scholar] [CrossRef]
  20. Pérez-Invernón, F.J.; Huntrieser, H.; Soler, S.; Gordillo-Vázquez, F.J.; Pineda, N.; Navarro-González, J.; Reglero, V.; Montanyà, J.; van der Velde, O.; Koutsias, N. Lightning-ignited wildfires and long-continuing-current lightning in the Mediterranean Basin: Preferential meteorological conditions. Atmos. Chem. Phys. 2021, 21, 17529–17557. [Google Scholar] [CrossRef]
  21. Pineda, N.; Rodríguez, O. ERA5 Reanalysis of Environments Conducive to Lightning-Ignited Wildfires in Catalonia. Atmosphere 2023, 14, 936. [Google Scholar] [CrossRef]
  22. Drohan, J. Predicting Dry Lightning Risk Nationwide. JFSP Briefs 2012, 149, 1–6. [Google Scholar]
  23. Peterson, D.; Wang, J.; Ichoku, C.; Remer, L.A. Effects of lightning and other meteorological factors on fire activity in the North American boreal forest: Implications for fire weather forecasting. Atmos. Chem. Phys. 2010, 10, 6873–6888. [Google Scholar] [CrossRef]
  24. Kalashnikov, D.A.; Abatzoglou, J.T.; Nauslar, N.J.; Swain, D.L.; Touma, D.; Singh, D. Meteorological and geographical factors associated with dry lightning in central and northern. Calif. Environ. Res. 2022, 1, 025001. [Google Scholar] [CrossRef]
  25. Forkel, M.; Thonicke, K.; Beer, C.; Cramer, W.; Bartalev, S.; Schmullius, C. Extreme fire events are related to previous-year surface moisture conditions in permafrost-underlain larch forests of Siberia. Environ. Res. Lett. 2012, 7, 1–9. [Google Scholar] [CrossRef]
  26. Bartsch, A.; Balzter, H.; George, C. The influence of regional surface soil moisture anomalies on forest fires in Siberia observed from satellites. Environ. Res. Lett. 2009, 4, 1–9. [Google Scholar] [CrossRef]
  27. Kharyutkina, E.V.; Moraru, E.I. Spatial and Temporal Variability of Forest Floor Moisture Characteristics and Their Influence on Wildfires in Western Siberia over 2016–2021. Atmos. Ocean. Opt. 2023, 36, 169–175. [Google Scholar] [CrossRef]
  28. Korshunov, N.A. Features of fires from lightning in the Krasnoyarsk Angara region. Bull. Sib. State Technol. Univ. 2002, 2, 23. [Google Scholar]
  29. Vasiliev, M.S.; Boroyev, R.N. Remote method determining the formation of forest fires from thunderstorms on the example of Yakutia. Atmos. Phys. 2020, 11560, 115605O. [Google Scholar] [CrossRef]
  30. Masson-Delmotte, V.; Zhai, A.P.; Pirani, S.L.; Connors, C.; Péan, S.; Berger, N.; Caud, Y.; Chen, L.; Goldfarb, M.I.; Gomis, M.; et al. (Eds.) IPCC, 2021: Climate Change 2021: The Physical Science Basis. Contribution of Working Group I to the Sixth Assessment Report of the Intergovernmental Panel on Climate Change; Cambridge University Press: Cambridge, UK; New York, NY, USA, 2021; p. 2391. [Google Scholar] [CrossRef]
  31. Kharyutkina, E.V.; Loginov, S.V.; Moraru, E.I.; Pustovalov, K.N.; Martynova, Y.V. Dynamics of extreme climatic characteristics and trends of dangerous meteorological phenomena over the Territory of Western Siberia. Atmos. Ocean. Opt. 2022, 35, 394–401. [Google Scholar] [CrossRef]
  32. Kharyutkina, E.V.; Loginov, S.V.; Usova, E.I.; Martynova, Y.V.; Pustovalov, K.N. Tendencies in changes of climate extremality in Western Siberia at the end of the XX century and the beginning of the XXI century. Fund. Prikl. Klimatol. 2019, 2, 45–65. [Google Scholar] [CrossRef]
  33. Ivanov, V.A.; Ponomarev, E.I.; Ivanova, G.A.; Mal’kanova, A.V. Lightning and Forest Fires under Modern Climatic Conditions of Central Siberia. Russ. Meteorol. Hydrol. 2023, 48, 630–638. [Google Scholar] [CrossRef]
  34. Eliseev, A.V.; Mokhov, I.I.; Chernokulsky, A.V. The influence of lightning activity and anthropogenic factors on large-scale characteristics of natural fires. Izv. Atmos. Ocean. Phys. 2017, 53, 1–11. [Google Scholar] [CrossRef]
  35. Fire Information for Resource Management System. Available online: https://firms.modaps.eosdis.nasa.gov/ (accessed on 27 November 2023).
  36. IKI-Monitoring. Available online: http://ckp.geosmis.ru/ (accessed on 27 November 2023).
  37. World Wide Lightning Location Network. Available online: https://wwlln.net/ (accessed on 27 November 2023).
  38. Virts, K.S.; Wallace, J.M.; Hutchins, M.L.; Holzworth, R.H. Highlights of a new ground-based, hourly global lightning climatology. Bull. Am. Meteorol. Soc. 2013, 94, 1381–1391. [Google Scholar] [CrossRef]
  39. Kaplan, J.O.; Lau, K.H.K. The WGLC global gridded lightning climatology and time series. Earth Syst. Sci. Data 2021, 13, 3219–3237. [Google Scholar]
  40. Inchin, A.; Shpadi, Y.; Lozbin, A.; Shpadi, M.; Inchin, P. The initial results of spatial-temporal distribution research of the lightning discharges in Kazakhstan. Curr. World Environ. 2017, 12, 197–203. [Google Scholar] [CrossRef]
  41. Burgesseur, R.E. Assessment of theWorldWide Lightning Location Network (WWLLN) detection efficiency by comparison to the Lightning Imaging Sensor (LIS). Q. J. R. Meteorol. Soc. 2017, 143, 2809–2817. [Google Scholar] [CrossRef]
  42. Larjavaara, M.; Pennanen, J.; Tuomi, T.J. Lightning that ignites forest fires in Finland. Agric. For. Meteorol. 2005, 132, 171–180. [Google Scholar] [CrossRef]
  43. Kharyutkina, E.V.; Pustovalov, K.N.; Moraru, E.I.; Nechepurenko, O. Analysis of Spatio-Temporal Variability of Lightning Activity and Wildfires in Western Siberia during 2016–2021. Atmosphere 2022, 13, 669. [Google Scholar] [CrossRef]
  44. Dowdy, A.J.; Mills, G.A. Atmospheric States Associated with the Ignition of Lightning-Attributed Fires; Centre for Australian Weather and Climate Research: Melbourne, VIC, Australia, 2009; p. 35. [Google Scholar]
  45. The ERA5 Global Reanalysis. Available online: https://reanalyses.org/atmosphere/era5-references (accessed on 27 November 2023).
  46. Von Storch, H.; Zwiers, F.W. Statistical Analysis in Climate Research; Cambridge University Press: Cambridge, UK, 2003; 484p. [Google Scholar]
  47. Worldview. Available online: https://worldview.earthdata.nasa.gov/ (accessed on 27 November 2023).
  48. Gorchakov, G.I.; Sitnov, S.A.; Karpov, A.V.; Gorchakova, I.A.; Gushchin, R.A.; Datsenko, O.I. Eurasian Large-Scale Hazes in Summer 2016. Izv. Atmos. Ocean. Phys. 2019, 55, 261–270. [Google Scholar] [CrossRef]
  49. Menezes, L.S.; de Oliveira, A.M.; Santos, F.L.M.; Russo, A.; de Souza, R.A.F.; Roque, F.O.; Libonati, R. Lightning patterns in the Pantanal: Untangling natural and anthropogenic-induced wildfires. Sci. Total Environ. 2022, 820, 153021. [Google Scholar] [CrossRef]
  50. Morales, C.A.; Neves, J.R.; Moimaz, E.A.; Camara, K.S. Sferics timing and ranging network–STARNET: 8 years of measurements in South America. In Proceedings of the International Conference on Atmospheric Electricity, Norman, OK, USA, 15–20 June 2014; pp. 15–20. [Google Scholar]
  51. Moris, J.V.; Conedera, M.; Nisi, L.; Bernardi, M.; Cesti, G.; Pezzatti, G.B. Lightning-caused fires in the Alps: Identifying the igniting strokes. Agric. For. Meteorol. 2020, 290, 107990. [Google Scholar] [CrossRef]
  52. Kozlov, V.I. Grozovaya aktivnost’ v YAkutii / V.I. Kozlov, V.A. Mullayarov; Ros. akad. nauk. Sib. otd-nie. In-t kosmofiz. issled. i aeronomii.-YAkutsk: YAF Izd-va SO RAN, 2004 (YAkut. fil. Izd-va SO RAN).-103 s.
  53. Duncan, B.W.; Adrian, F.W.; Stolen, E.D. Isolating the lightning ignition regime from a contemporary background fire regime in east-central Florida. USA Can. J. For. Res. 2010, 40, 286–297. [Google Scholar] [CrossRef]
  54. Müller, M.M.; Vacik, H.; Diendorfer, G.; Arpaci, A.; Formayer, H.; Gossow, H. Analysis of lightning-induced forest fires in Austria. Theor. Appl. Climatol. 2013, 111, 183–193. [Google Scholar] [CrossRef]
  55. Schultz, C.J.; Nauslar, N.J.; Wachter, J.B.; Hain, C.R.; Bell, J.R. Spatial, temporal and electrical characteristics of lightning in reported lightning-initiated wildfire events. Fire 2019, 2, 18. [Google Scholar] [CrossRef] [PubMed]
  56. Nauslar, N.J. A Forecast Procedure for Dry Thunderstorms; University of Nevada: Reno, NV, USA, 2010; p. 92. [Google Scholar]
  57. Nechepurenko, O.E.; Gorbatenko, V.P.; Konstantinova, D.A.; Sevastyanov, V.V. Instability indices and their thresholds for the forecast of thunderstorms over Siberia. Hydrometeorol. Res. Forecast. 2018, 2, 44–59. [Google Scholar]
  58. Wotton, B.M. Interpreting and using outputs from the Canadian Forest Fire Danger Rating System in research applications. Environ. Ecol. Stat. 2009, 16, 107–131. [Google Scholar] [CrossRef]
  59. Flannigan, M.D.; Logan, K.A.; Amiro, B.D.; Skinner, W.R.; Stocks, B.J. Future area burned in Canada. Clim. Change 2005, 72, 1–16. [Google Scholar] [CrossRef]
  60. Barbero, R.; Abatzoglou, J.T.; Kolden, C.A.; Hegewisch, K.C.; Larkin, N.K.; Podschwit, H. Multi–scalar influence of weather and climate on very large–fires in the Eastern United States. Int. J. Clim. 2019, 35, 2180–2186. [Google Scholar] [CrossRef]
Figure 1. Scheme that presents the clustering hotspots and the determining of LIWs, where φ1 and λ1—latitude and longitude of fire; φ2 and λ2—latitude and longitude of lightning discharge. Red circle—hotspot, blue circle—lightning, arrows—distance.
Atmosphere 15 00106 g001
Figure 2. Spatial distribution of Dry LIWs and Wet LIWs (B > 0%, holdover period = 6 days) over Western Siberia for the warm seasons of 2016–2021: tv = 0.25 mm/day (a); tv = 2.5 mm/day (b). Color scale—vegetation zones [47]: 1—evergreen needleleaf forests; 2—evergreen broadleaf forests; 3—deciduous needleleaf forests; 4—deciduous broadleaf forests; 5—mixed forests; 6—closed shrublands; 7—open shrublands; 8—woody savannas; 9—savannas; 10—grasslands; 11—permanent wetlands; 12—croplands; 13—urban and built-up lands; 14—croplands/natural vegetation mosaics; 15—permanent snow and ice; 16—barren; 17—water bodies; and 18—unclassified. The black dots are LIWs.
Atmosphere 15 00106 g002
Figure 3. Seasonal variability of Dry LIW (left panel) and Wet LIW (right panel) numbers (B > 80%) in dependence of lag (time between lightning and ignition) over the southern part of Western Siberia for 2016–2021. The precipitation threshold is 2.5 mm/day.
Atmosphere 15 00106 g003
Figure 4. Seasonal variability of Dry LIW (left panel) and Wet LIW (right panel) numbers (B > 80%) in dependence of lag (time between lightning and ignition) over the central part of Western Siberia for 2016–2021. The precipitation threshold is 2.5 mm/day.
Atmosphere 15 00106 g004
Figure 5. Seasonal variability of Dry LIW (left panel) and Wet LIW (right panel) numbers (B > 80%) in dependence of lag (time between lightning and ignition) over the northern part of Western Siberia for 2016–2021. The precipitation threshold is 2.5 mm/day.
Atmosphere 15 00106 g005
Figure 6. Meteorological conditions and fuel moisture components preceding lightning-ignited wildfires (Dry LIWs and Wet LIWs) for each day before the ignition over Western Siberia for 2016–2021 (B > 80%). The precipitation threshold is 2.5 mm/day.
Atmosphere 15 00106 g006
Figure 7. Meteorological conditions preceding lightning-ignited wildfires (Dry LIWs and Wet LIWs) with 3 days lag in Western Siberia for warm seasons the 2016–2021 (B > 80%). The precipitation threshold is 2.5 mm/day.
Atmosphere 15 00106 g007
Figure 8. Spatial distribution of meteorological conditions preceding Dry LIWs (B > 80%) for 3 days lag over Western Siberia for the warm seasons of 2016–2021. Black dots are selected cases of ignitions. The precipitation threshold is 2.5 mm/day.
Atmosphere 15 00106 g008aAtmosphere 15 00106 g008b
Figure 9. Spatial distribution of meteorological conditions preceding Wet LIWs (B > 80%) for 3 days lag over Western Siberia for the warm seasons of 2016–2021. Black dots are selected cases of ignitions. The precipitation threshold is 2.5 mm/day.
Atmosphere 15 00106 g009aAtmosphere 15 00106 g009b
Table 1. Number of Dry LIWs and Wet LIWs (B > 80%) from all revealed cases of LIWs and the estimate of white noise amplitude (α = 0.05) for each day before the ignition (lag) in different regions of Western Siberia for the warm seasons of 2016–2021.
Precipitation Threshold
0.25 mm/Day2.5 mm/Day
Lag, DayDry LIWsWet LIWsDry LIWsWet LIWs
SWS
1142 ± 19256 ± 26338 ± 2960 ± 12
2210 ± 23212 ± 23321 ± 29101 ± 16
3143 ± 19172 ± 21226 ± 2489 ± 15
499 ± 16177 ± 21175 ± 21101 ± 16
5107 ± 17122 ± 18182 ± 2247 ± 11
675 ± 14146 ± 19141 ± 1980 ± 14
Total LIWs1861 ± 691861 ± 69
CWS
137 ± 1046 ± 1165 ± 1318 ± 7
284 ± 1574 ± 14100 ± 1658 ± 12
393 ± 1570 ± 13160 ± 203 ± 3
480 ± 1473 ± 14131 ± 1822 ± 8
5113 ± 1781 ± 14156 ± 2038 ± 10
696 ± 1662 ± 13132 ± 1826 ± 8
Total LIWs909 ± 48909 ± 48
NWS
115 ± 66 ± 417 ± 75 ± 4
230 ± 915 ± 640 ± 105 ± 4
344 ± 1124 ± 856 ± 1212 ± 6
415 ± 626 ± 832 ± 99 ± 5
532 ± 913 ± 638 ± 107 ± 4
622 ± 88 ± 525 ± 84 ± 3
Total LIWs250 ± 25250 ± 25
Table 2. The part (%) of Dry LIWs (B > 80%) from all revealed cases of LIWs for each day before the ignition (lag) from the total Dry LIW number in different regions of Western Siberia for the warm seasons of 2016–2021.
Lag, DayPrecipitation Threshold
0.25 mm/Day2.5 mm/Day
SWS
11824
22723
31816
41313
51413
61010
Total Dry LIWs776 ± 451383 ± 60
CWS
179
21713
31822
41618
52221
61918
Total Dry LIWs503 ± 36744 ± 44
NWS
198
21919
32827
4915
52018
61412
Total Dry LIWs158 ± 20208 ± 23
Table 3. Statistics of meteorological conditions and fuel moisture components preceding Dry LIWs (B > 80%) in the regions of Western Siberia for the warm seasons of 2016–2021. The precipitation threshold is 2.5 mm/day.
RegionsDay of IgnitionLag (3 Days)
Averages0.25 Quantile0.75 QuantileAverages0.25 Quantile0.75 Quantile
Tmax, °C
SWS15.210.622.816.111.623.4
CWS16.49.224.917.09.824.2
NWS24.822.228.126.123.328.5
∆T850−500, °C
SWS21.918.923.821.818.924.5
CWS22.818.826.122.918.426.4
NWS25.923.228.426.724.728.8
∆Td2m, °C
SWS6.13.38.65.83.28.5
CWS6.93.39.66.41.99.4
NWS8.94.110.79.54.511.6
V, m/s
SWS4.02.15.43.92.25.2
CWS3.72.35.23.62.24.9
NWS3.42.54.22.71.93.2
u500, m/s
SWS5.40.110.46.60.810.7
CWS7.31.114.58.62.415.5
NWS2.6−3.88.52.3−1.65.8
v500, m/s
SWS−1.4−6.94.1−0.7−5.95.5
CWS−3.8−10.72.1−3.3−9.52.2
NWS−0.1−2.11.91.2−1.62.7
Z500, 103 m2/s2
SWS54.6353.7155.8854.7653.8755.99
CWS55.0654.2156.0455.1654.2556.15
NWS55.2555.5256.2956.0155.5956.32
VSW, m3/m3
SWS0.300.20.40.310.20.4
CWS0.240.10.40.250.10.4
NWS0.200.10.30.210.10.3
FFMC
SWS73.964.586.579.165.885.9
CWS76.971.187.878.963.587.4
NWS86.084.591.790.284.991.7
DMC
SWS18.24.321.110.24.618.1
CWS29.64.339.910.33.432.6
NWS99.029.277.790.127.269.1
Statistically significant estimates are in bold (significance level α = 0.05).
Table 4. The same as in Table 3, but Wet LIWs.
RegionsDay of IgnitionLag (3 Days)
Averages0.25 Quantile0.75 QuantileAverages0.25 Quantile0.75 Quantile
Tmax, °C
SWS15.511.220.315.311.421.9
CWS16.611.222.116.511.522.2
NWS22.320.423.525.525.126.6
∆T850−500, °C
SWS22.318.824.822.118.924.8
CWS23.220.526.123.019.126.6
NWS23.522.724.224.923.526.1
∆Td2m, °C
SWS2.30.14.65.23.67.3
CWS2.80.35.36.33.68.6
NWS3.52.74.16.04.17.4
V, m/s
SWS3.21.34.43.51.94.9
CWS3.21.84.33.11.44.5
NWS3.42.54.22.40.93.6
u500, m/s
SWS8.91.715.57.10.912.4
CWS11.77.917.89.03.614.4
NWS−0.7−6.64.34.41.87.9
v500, m/s
SWS3.5−1.88.1−1.2−6.33.9
CWS0.6−5.36.1−3.6−9.62.4
NWS2.5−3.68.63.71.18.1
Z500, 103 m2/s2
SWS54.3353.6755.1854.4453.3755.65
CWS55.0654.3955.8155.2554.4256.07
NWS55.0754.7255.3655.8655.6756.11
VSW, m3/m3
SWS0.350.30.40.320.30.4
CWS0.340.30.40.310.20.4
NWS0.460.40.60.380.30.5
FFMC
SWS61.443.179.974.956.883.1
CWS61.946.579.978.763.785.6
NWS58.842.874.685.476.886.9
DMC
SWS11.93.716.910.25.116.5
CWS21.02.922.310.34.326.1
NWS16.37.917.521.216.625.9
Statistically significant estimates are in bold (significance level α = 0.05).
Disclaimer/Publisher’s Note: The statements, opinions and data contained in all publications are solely those of the individual author(s) and contributor(s) and not of MDPI and/or the editor(s). MDPI and/or the editor(s) disclaim responsibility for any injury to people or property resulting from any ideas, methods, instructions or products referred to in the content.

