Article

Analysis of the Triggering and Maintenance Mechanisms of a Record-Breaking Warm-Sector Extreme-Rainfall Process in Front of an Upper-Level Trough in Tianjin, China

1
Tianjin Key Laboratory for Oceanic Meteorology, Tianjin 210074, China
2
Tianjin Meteorological Observatory, Tianjin 210074, China
3
School of Urban and Environmental Sciences, Huaiyin Normal University, Huai’an 223300, China
*
Author to whom correspondence should be addressed.
Atmosphere 2023, 14(5), 808; https://doi.org/10.3390/atmos14050808
Submission received: 22 February 2023 / Revised: 18 April 2023 / Accepted: 19 April 2023 / Published: 28 April 2023
(This article belongs to the Special Issue The Water Cycle and Climate Change (2nd Edition))

Abstract

:
A short-time rainstorm exceeding the extreme historical rainfall occurred in the Jinnan District of Tianjin, China, on 3 July 2022. Due to the concentrated time period of precipitation, it caused serious water accumulation in the Jinnan District. The purpose of this paper is to study the weather mechanism of this extreme rainstorm in the Jinan District of Tianjin. By analyzing the fine observation facts, we can obtain the mesoscale weather characteristics and environmental conditions of the process. The results provide a reference for similar weather forecasting and warning in the future. Based on the 1 min interval precipitation observation data, the ERA5 reanalysis data, the CINRAD-SA radar reflectivity data of Tanggu, the cloud-top brightness temperature data of the Fengyun-4A satellite, and the Variational Doppler Radar Analysis System data, we comprehensively analyzed a record-breaking extreme rainfall process in Tianjin on 3 July 2022. The results show that the extreme rainfall process presents prominent mesoscale weather characteristics, with high precipitation intensity in a short-term period. This process is influenced by multi-scale weather systems, including the 500 hPa upper-level trough and the long-distance water vapor transport by Typhoon Chaba. The rainstorm event is caused by the combined actions of cold pool outflow produced by the upstream precipitation, the easterly disturbance in the boundary layer, the mesoscale temperature front, and the ground convergence line. Specifically, the ground convergence line is formed by the northerly wind of the cold pool outflow and the warm and moist southerly airflow from the ocean, and the temperature front is caused by the horizontal thermal difference of the underlying surface. Both the ground convergence line and temperature front contribute considerably to the triggering of mesoscale convection. The mesoscale secondary circulation is formed in the meridional direction by the meso-γ-scale convergence and its interaction with strong velocity in front of the trough, contributing to the development and maintenance of vertical motion in the Jinnan region of Tianjin and thereby leading to the occurrence and development of this extreme heavy rainfall process.

1. Introduction

Heavy rainfall often causes serious natural disasters such as landslides, debris flows, and flash floods, which seriously affect the safety of people’s lives and property [1] and showed that global rainstorm events have gradually increased in recent years, and rainfall continues to increase as the near-surface temperature rises [2]. Heavy rainfall events have occurred frequently in the central and eastern parts of North China since 2012 [3,4]. For example, an extraordinary rainfall event, i.e., a “7.21” rainstorm, occurred in Beijing on 21 July 2012, with a maximum accumulated rainfall of 460 mm, and an extraordinary rainfall event, namely “7.20” rainstorm, occurred in Hebei on 19–20 July in 2016, with a maximum accumulated rainfall of 783.5 mm [5].
The occurrence of a rainstorm requires three elements: sufficient water vapor supply, favorable dynamic uplift conditions, and a long duration of precipitation [6]. In terms of sufficient water vapor supply, the role of low-level jets cannot be ignored because it establishes a long-distance water vapor channel in the atmosphere to transport sufficient water vapor from the low-latitude ocean to middle and high latitudes, providing indispensable conditions for rainstorms [3,7]. In addition, rainstorms are generally closely related to the changes in meso-α-scale or synoptic-scale systems [8], such as the westward extension and northward jump of the western Pacific subtropical high [9,10], typhoons moving northward [11,12] and the development of synoptic-scale vortices and cyclones [13,14]. Moreover, the development of meso-β-scale or meso-γ-scale convective systems during rainstorms often leads to short-term heavy rainfall [15,16,17]. Therefore, a significant rainstorm is often the result of multi-scale interactions [3,9,18]. In particular, most rainstorms are accompanied by short-term heavy precipitation. Luo et al. showed that North China and South China are the two regions with the most frequent occurrence of short-term heavy precipitation, and there is a type of precipitation without the influence of fronts, typhoons, or other prominent weather systems in these heavy rainfall events [15]. The marine boundary layer jet (BLJ) coupled with a synoptic low-level jet (LLJ) inland played an important role in the formation of an extremely humid environment [18]; the lower-level convergence zone along the coastal region provided favorable dynamic conditions for maintaining convective systems [19]. All these factors resulted in Extreme Warm-Sector Rainfall Event Over Coastal South China.
Huang introduced the concept of a “warm-sector rainstorm” according to the previous rainstorms during the flood season in South China [15]. Studies have indicated that this type of rainstorm is characterized by high intensity, relatively concentrated precipitation period, small range, and strong suddenness [20]. For such rainfall types, the baroclinic forcing is not pronounced, and the precipitation is often closely related to the subtropical high and jets, with abundant water vapor transport. Moreover, this rainfall type in the boundary layer has a complex triggering mechanism and is often affected by topography. Heavy precipitation generally occurs in the warm and moist tongue area at 850 hPa, with environmental conditions of high temperature and humidity, considerable convective effective potential energy, low convective inhibition, and strong upper-level divergence. Such a heavy precipitation type is generally associated with the instability of the warm and moist airflow [21,22,23,24]. Although this concept is proposed for precipitation in South China, in fact, there are also warm-sector rainstorms in North China [25,26,27,28,29,30,31,32]. However, studies on the triggering and maintenance mechanisms of rainstorm processes in North China are relatively few.
Tianjin is located in the eastern part of North China, close to the Bohai Sea, and is often influenced by an easterly wind and sea-breeze fronts that result in heavy rainfall [33,34,35,36,37]. Due to the warm and moist airflow transport of easterly wind, the warm-sector rainstorms in the Tianjin region can cause heavy local precipitation and even serious losses. There were not many cases of extreme weather in North China caused by the warm zone in front of the trough, so observation analysis and mechanism research for this type of weather were not common. The “7.3” rainstorm in Tianjin is a warm-sector rainstorm in front of a trough. In this process, the influence of upper-level cold air is not noticeable, the atmospheric baroclinity is weak, and the forecast for it is difficult. The short-term rainfall intensity shows low forecast skills, and the rainstorm process is missed. Tao pointed out that warm-sector rainstorms are dominated by convective precipitation, and the atmospheric baroclinic characteristics are not apparent [38]. It is difficult to capture the influencing weather systems under unforced conditions, and the forecast signal is weak. Therefore, it is necessary to investigate the characteristics and causes of warm-sector rainstorms and summarize the key factors for refined forecasts. We not only analyzed the observed facts of this process based on the minute-level observation data and the high spatial-temporal resolution Vdras data but also studied the weather mechanism of the warm region storm in front of the trough. These research results can provide technical support for weather forecasting in the future.
The remainder of this paper is organized as follows. Section 2 introduces the data used in this study. Section 3 presents the overview of the rainfall event. Section 4 analyzes the circulation situation. Section 5 reveals the occurrence and development of mesoscale convective systems. The main conclusions are shown in Section 6.

2. Data Introduction

The data used in this research include the ERA5 global reanalysis data, ground-based observation data, radar data, the black body temperature (TBB) data of the Fengyun-4A satellite from the National Satellite Meteorological Center of the China Meteorological Administration (0.1° × 0.1° horizontal resolution), and the Variational Doppler Radar Analysis System (VDRAS) data (5 km × 5 km horizontal resolution).
The spatiotemporal resolutions of the ERA5 reanalysis data are 0.25° × 0.25° and 1 h, with 37 layers in the vertical direction [39]. This dataset is available at https://cds.climate.copernicus.eu/cdsapp#!/search?type=dataset&text=ERA5 accessed on 12 December 2022.The meteorological elements of the ground-based observation data used in this study (Figure 1) from automatic stations provided by the Tianjin Meteorological Information Center, which include precipitation, wind velocity, and dew point temperature with a temporal resolution of 1 min. The station data are interpolated into the grid of 0.1° × 0.1° by the inverse distance weight method to draw contour or color maps. The radar data used in this research is the SA-band Doppler radar data of Tanggu (117.72° E, 39.04° N), and the radar location is shown in Figure 1. The TBB data of the Fengyun-4A satellite are the full-disk 4KM-L1 data, which are the product data obtained from the source packet data of the scanning imaging radiometer in the 12th channel after quality checking, geographical positioning, and radiometric calibration processing, with a horizontal resolution of 4 km.
The VDRAS is a rapid-updating four-dimensional variational analysis system focusing on convective-scale numerical simulation for nowcasting convective storms, which has been preliminarily set up and debugged. This system is based on rapid-updating four-dimensional variational assimilation (RR4DVar) techniques for Doppler radar observations, a three-dimensional cloud-scale numerical model with simplified microphysics parameterization schemes (including rainwater evaporation, cooling, and precipitation processes), and an adjoint model. The RR4DVar scheme is used to assimilate the reflectivity and radial velocity observations from six CINRAD Doppler radars in the Beijing–Tianjin–Hebei region in order to quickly obtain the low-level three-dimensional analysis fields (including convective-scale dynamics, thermal dynamics, and microphysical structures) with an update cycle of 12–18 min. Additionally, this scheme also integrates the 5 min observations from regional automatic weather stations and the forecast results from a mesoscale numerical model. VDRAS data have a horizontal resolution of 5 km and 15 layers in the vertical direction.

3. Overview of the Rainfall Event

A heavy rainstorm exceeding the historical record value occurred in the Jinnan District of Tianjin on 3 July 2022. Figure 2 presents the accumulated rainfall from 20:00 BJT (Beijing time, the same as below) on 2 July to 20:00 BJT on 3 July 2022. This rainfall process is characterized by short duration and strong intensity. The rain in the Jinnan District lasted from 04:00 on 3 July 2022, to 11:00 on 3 July 2022. In Tianjin, there are 68 stations with accumulated rainfall of more than 50 mm and 12 stations with accumulated rainfall of more than 100 mm. Two heavy rainfall centers appear in the heavy rainstorm area, namely Jinnan District in the south of Tianjin and Baodi District in the north of Tianjin. Specifically, the rainfall intensity in Jinnan District is larger, and the maximum rainfall appears at Jinnan–Yuanqu station (YQ). At this station on 3 July, the 6 h accumulated rainfall is 165.1 mm from 04:00 to 10:00, the 3 h accumulated rainfall is 145.1 mm from 04:00 to 07:00, and the maximum hourly rainfall intensity is 76.6 mm (Figure 3a). Meanwhile, at Jinnan national weather station (JN), the 6 h accumulated rainfall is 139.1 mm, the 3 h accumulated rainfall is 125 mm, and the maximum hourly rainfall intensity is 96.3 mm h−1 (Figure 3a). The hourly rainfall intensity and 3 h rainfall of JN station all exceed the historical records since the station was established. The second and third hourly rainfall was 65.6 mm at 15:00 on 2 July 2013, and 65.4 mm at 09:00 on 15 July 2012. The second record of 3 h rainfall of JN was 124.1 mm at 14:00–17:00 on 3 July 2011, and the third record was 118.2 mm at 08:00–10:00 on 26 July 2012. The 6 h rainfall of JN station ranked second in this rainfall process, and the maximum 6 h rainfall was 184.1 mm that occurred from 07:00 to 13:00 on 26 July 2012. Figure 3b shows the 1 min rainfall series of JN and YQ stations during 04:00–08:00 on 3 July 2022. It can be found that the main concentrated rainfall period during this precipitation process is between 04:30 and 07:30. According to the changes in the rainfall period of the two representative stations, this heavy precipitation process can be divided into two main stages. The first stage is from 04:30 to 05:15 on 3 July. The 10 min accumulated rainfall from 05:04 to 05:13 is 30.7 mm at this stage in YQ station. The second stage is from 05:15 to 05:35 on 3 July, and the rainfall mainly occurs in JN station. The 10 min accumulated rainfall reaches 32.6 mm from 05:24 to 05:33. The 1 min rainfall intensity at JN station is 3.9 mm (min)−1, 4.6 mm (min)−1, and 4.6 mm (min)−1 at 05:26, 05:27, and 05:28, respectively. The 1 min precipitation efficiency is close to 4.7 mm (min)−1 of the rare “7.20” rainstorm in Zhengzhou in 2021 [40].

4. Analysis of Circulation Situation

From early to middle July, the western Pacific subtropical high starts to extend westward and northward, and North China gradually enters the rainy season [8]. At 500 hPa, the rainstorm center is affected by the warm and moist air in front of the westerly trough, located in the western part of Shanxi (38° N–45° N) Below 700 hPa, it is controlled by southerly airflow. Due to the influence of southeasterly wind, the 2 m dew point temperature in the southeastern plain of Tianjin ranges from 27 °C to 28 °C, and the daily highest temperature in Tianjin is 31–32 °C, which indicates a remarkable high-temperature and high-humidity environment. At 20:00 on 2 July, Tianjin is located on the right side of the entrance region of the 200 hPa upper-level jet. With the eastward movement of the 500 hPa upper-level trough (Figure 4a), the low-level jet at 850 hPa (Figure 4c) and 925 hPa (Figure 4d) establishes and strengthens. In addition, southerly airflows both at 850 hPa and 925 hPa are accompanied by southeasterly airflow from the northeastern side of Typhoon Chaba, which provides a favorable water vapor condition and the warm and humid environment for the rainstorm in Tianjin. The surface pressure shows a pattern of high in the east and low in the west (Figure 4b).
There was no local sounding station in Tianjin, but the convective available potential energy (CAPE) at upstream Beijing station (54511) was as high as 1565 J (kg)−1 at 14:00 on 2 July, and the convective inhibition was low (Figure 4e). Under the influence of low-level jets, the CAPE at Beijing station increased, and the free convective height decreased before the heavy rainfall. At 20:00 on 2 July, the CAPE was 1949 J (kg)−1, providing convective conditions for short-term heavy precipitation. The above circulation situation indicates that the baroclinic forcing was not noticeable in the warm sector in front of the upper-level trough, and the low-level jet increased in the environment with notably high temperature, humidity, and energy. These conditions resulted in heavy rainfall with high precipitation efficiency in Tianjin from the night of 2 July to the morning of 3 July.

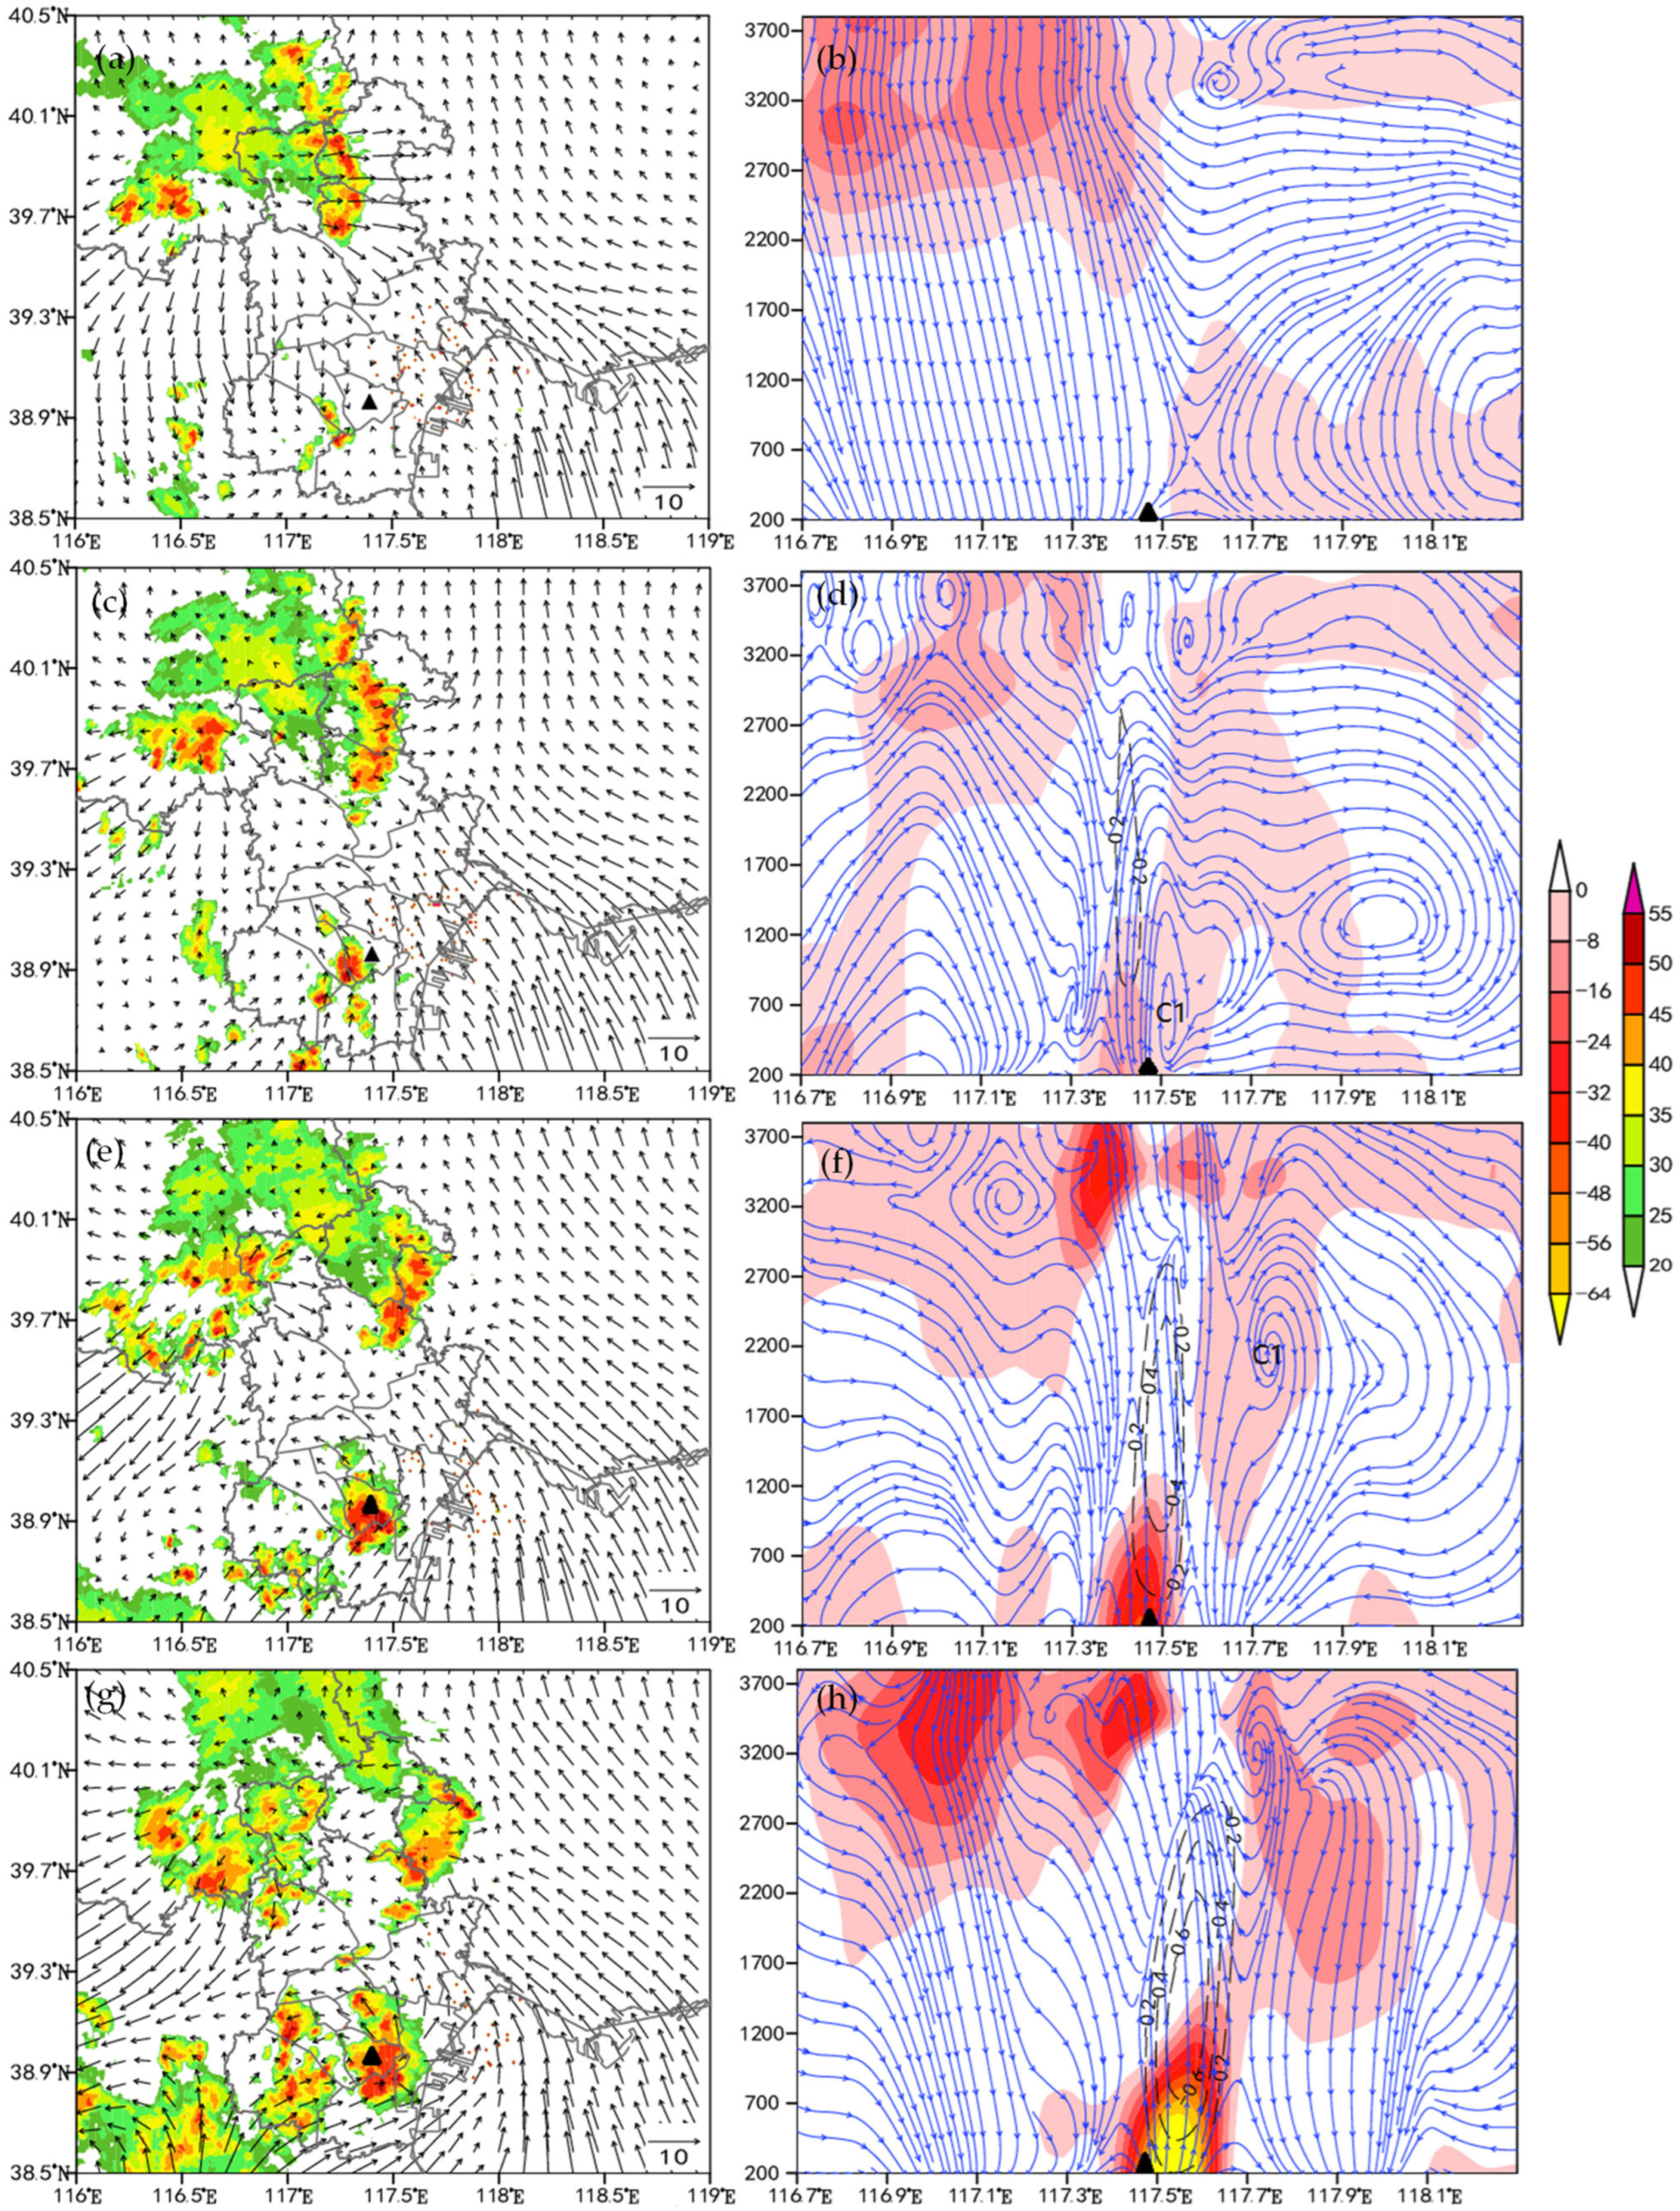
5. Occurrence and Development of Mesoscale Convective Systems

The warm-sector mesoscale convection in the south of Tianjin has two development stages. The first stage (04:00–05:00 on 3 July) is characterized by the establishment of convection in Jinghai District and the influence of cloud clusters of local heavy rainfall. The second stage (05:00–06:00 on 3 July) shows a “train effect” in the Jinnan District, and the outflow from the cold pool causes convection to strengthen and move at this stage. Further analysis of the evolution of the echoes above 45 dBz indicates that it presents a process of merge-northeastward moving development (Figure 5).

5.1. Occurrence and Development of Local Heavy Rainfall Clusters

At 03:48 on 3 July, convective cell 1 (Figure 6a) is first triggered at the junction of Jinghai and Xiqing Districts, and subsequently, there are several local nascent convective systems on the southeastern side of this convective cell (Figure 6b). The largest cell is meso-γ-scale convective cell 2. Around 04:12, convective cells 1 and 2 merge into convective cell 3 (Figure 6c), and new convective cells are continuously generated on its southwestern side. It is worth paying special attention that new cells continuously appear on the rear side of the convective system in the junction area of Xiqing and Jinghai in the southwest of Tianjin with the continuous development of the convective cell 3. Guided by the middle-level southwesterly wind, the new convective system moves northeastward and merges into convective cell 3, resulting in an expansion in the size of cell 3. Moreover, the convective system is stable and rarely moves, which indicates the backward propagation of thunderstorms and the “train effect” (Figure 6d,f). The strong echo above 50 dBz is below the height of 10 km (Figure 7a), but the precipitation efficiency is high (Figure 3b). From 04:00 to 05:00 on 3 July, the rainfall clusters in the southwest of Tianjin resulted in short-term heavy rainfall at two stations (Figure 8a).
Due to the continuous development of the convective system, its organization is continuously strengthened, and the heavy rainfall is more concentrated in location and localized. At the first development stage of convection, YQ and JN stations are successively affected by about nine convective cells (Figure 6g,h and Figure 7b), which results in short-term heavy rainfall lasting for a total of 3–4 h (Figure 3), with the maximum rainfall of greater than 30 mm within 10 min. Under the influence of the convective system, the rainfall clusters in the south of Tianjin cause heavy rainfall of more than 50 mm in a certain range from 05:00 to 06:00 on 3 July (Figure 8b). The large rainfall intensity and the certain rainfall duration led to heavy rainfall appearing at eight stations, including JN and YQ stations (Figure 3a).

5.2. Evolution Characteristics of the Meso-γ-Scale Convective System

Hourly TBB evolution can directly reflect the occurrence and development process of mesoscale convection and its characteristics at each stage (Figure 9). From 00:00 to 03:00 on 3 July (figure omitted), the rainfall cloud clusters are mainly located near the junction of Beijing and Tianjin and the southwest of Tianjin. Among them, convective cloud cluster A in Beijing shows the characteristics of small scale and long duration. Convective cloud cluster B in the north of Tianjin is continuously strengthened and stable with little movement, while the weak cloud cluster in the southwest of Tianjin develops slowly during northeastward movement. At 04:34 on 3 July (Figure 9a), smaller convective cloud cluster C is generated at the junction of Jinnan and Xiqing and develops after merging with the weak convective cloud at the southwestern border of Tianjin (Figure 9b), which promotes cloud cluster C to strengthen and develop rapidly. The cold cloud area expands eastward, the intensity and range of cold clouds with TBB ≤ −32 °C gradually increase, and cold clouds with TBB ≤ −47 °C appear. Accordingly, the rainfall intensity at JN station strengthens (61 mm h−1 at 05:00). At 05:30 on 3 July (Figure 9c), the western end of cloud cluster C is highly convective and gradually develops into a mesoscale convective system. Jinnan is located in the cold cloud area with TBB ≤ −52 °C, and the cold cloud area is quasi-circular with the maximum rainfall intensity. With the slow eastward movement of cloud cluster C, Jinnan is located in the area with a large TBB gradient on the western side of the cloud cluster, and the rainfall intensity reaches the maximum (96.3 mm h−1 during 05:00–06:00). At 08:00 on 3 July (figure omitted), the cold cloud center of cloud cluster C continues to move eastward and gradually moves away from Jinnan, and the heavy rainfall ends in this region. Overall, the heavy precipitation at JN station is triggered due to quasi-circular mesoscale cloud clusters, which are generated by the development of new convection. The development of cloud clusters is caused by the nascent and merging of convective clouds. With reference to the location of JN station, the convective cloud cluster is quasi-stationary (Figure 9d), resulting in long duration and large accumulated rainfall of heavy precipitation.

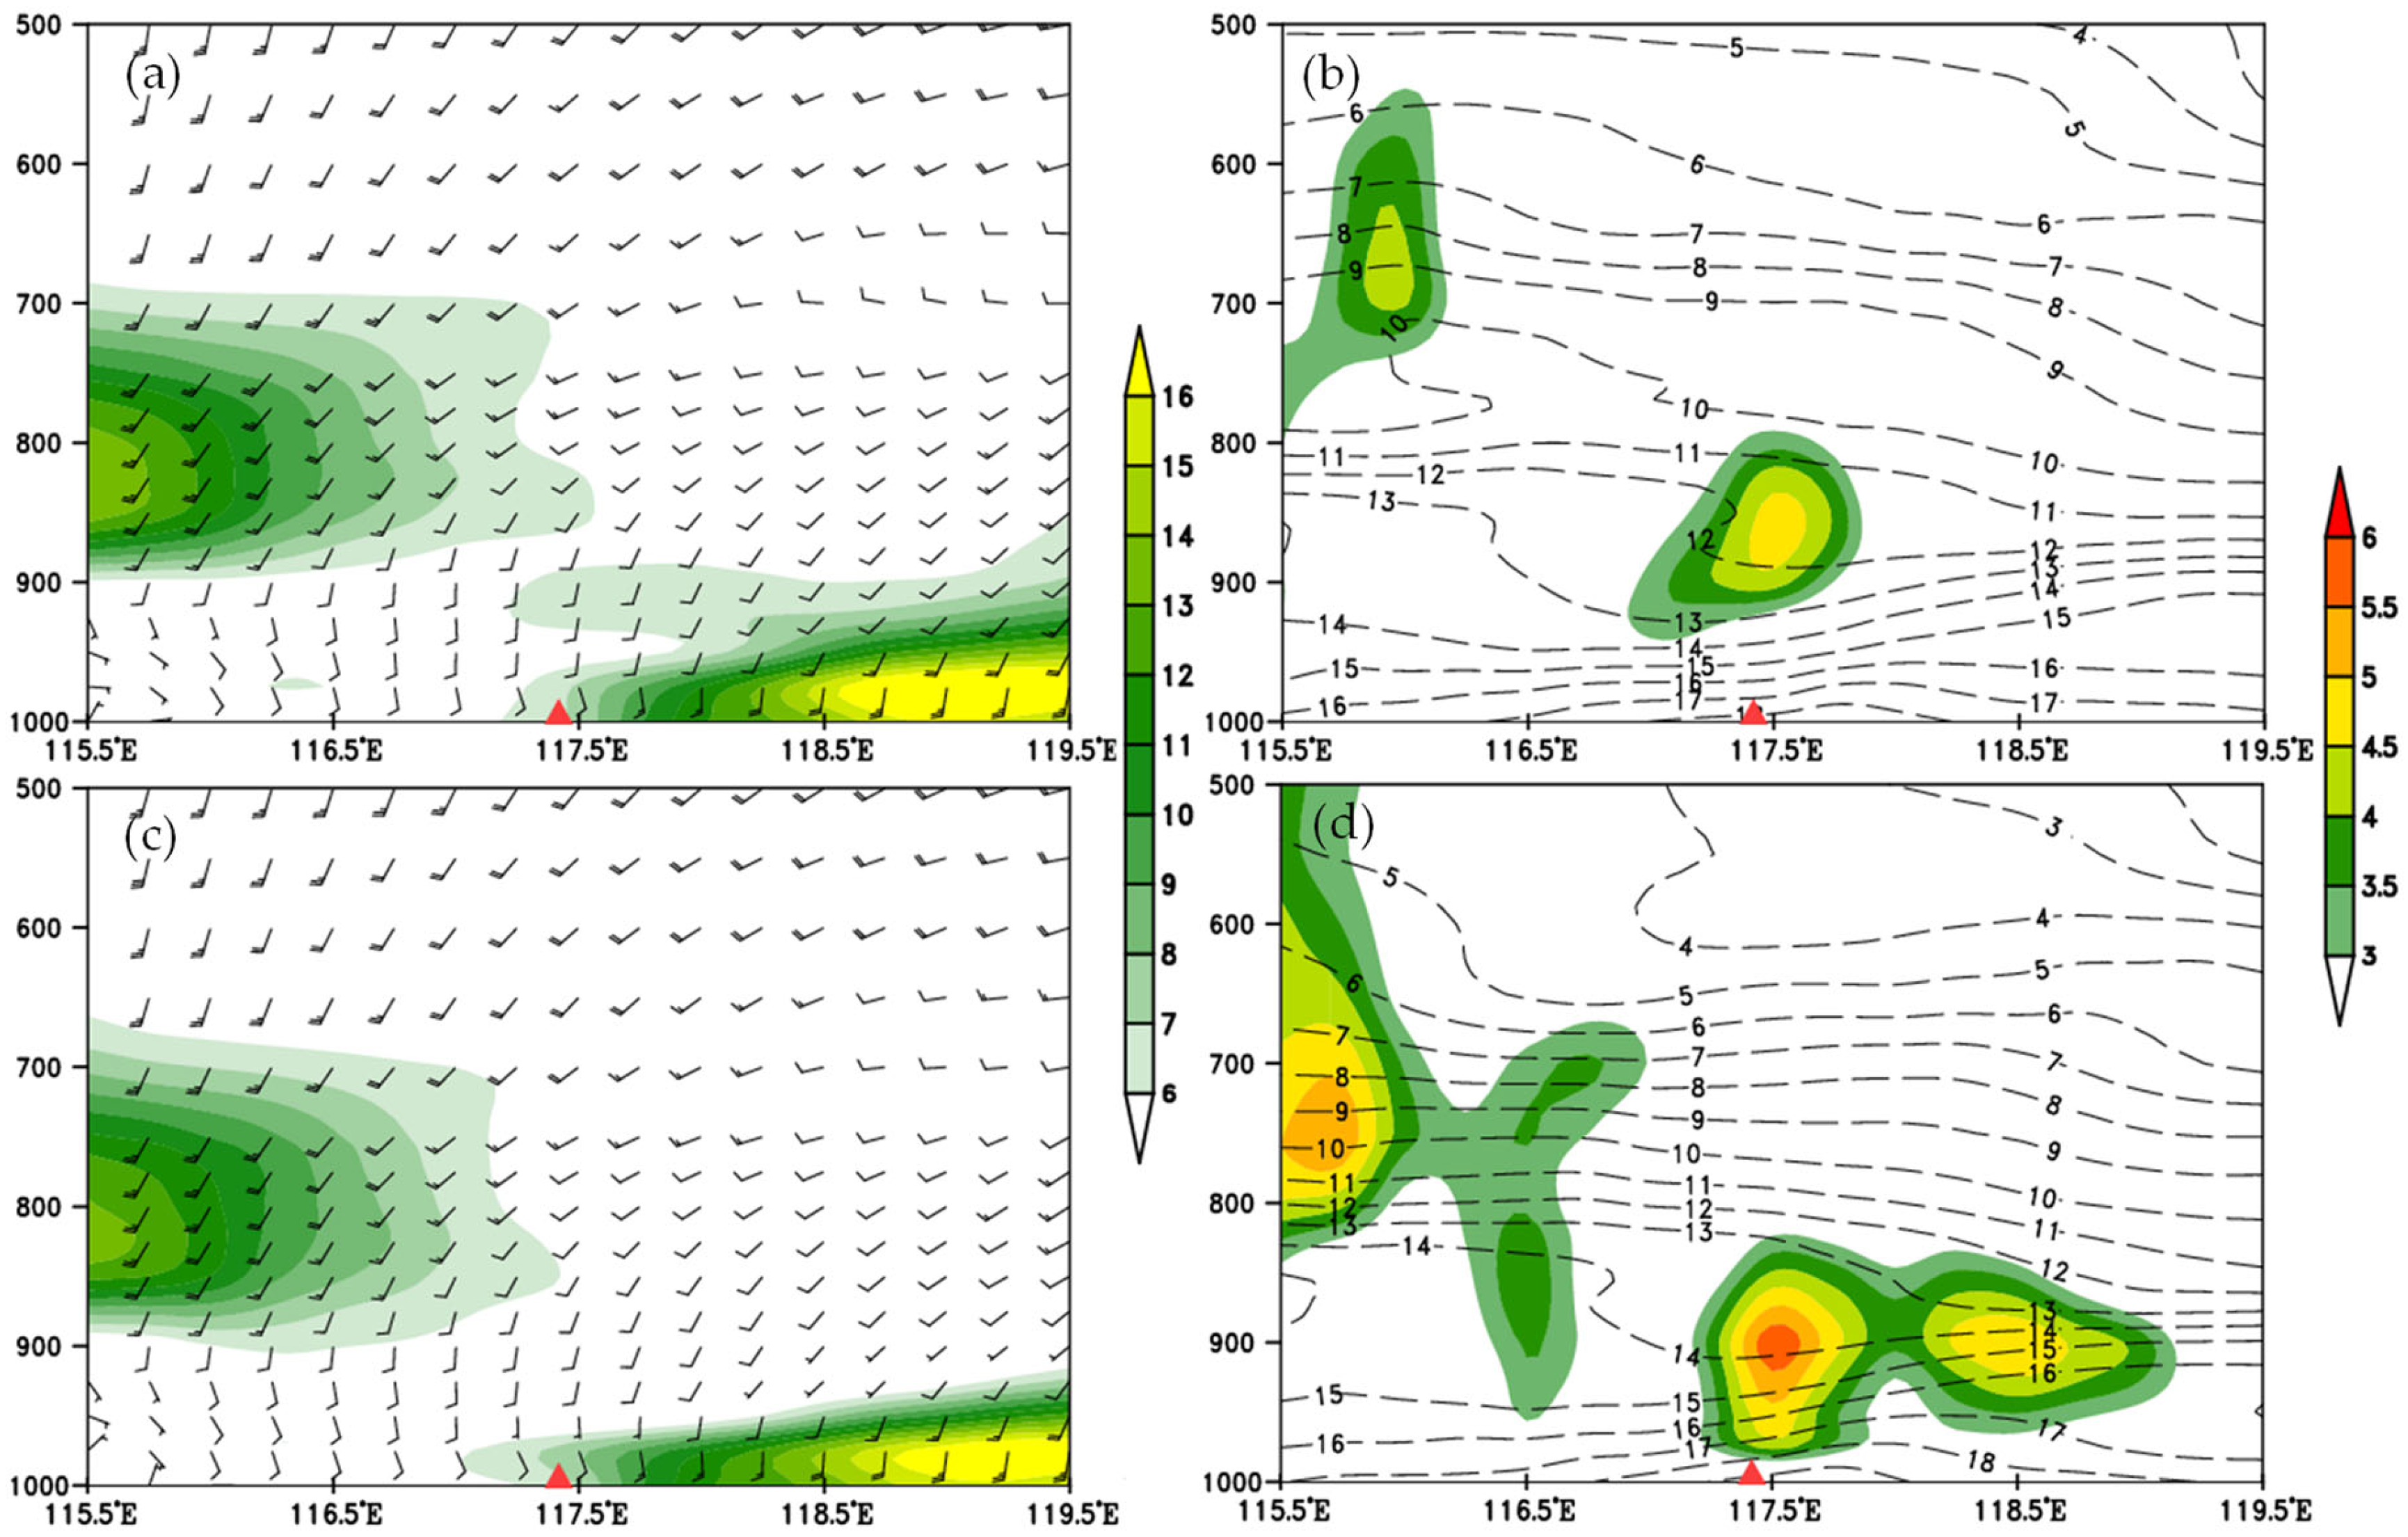
5.3. Development Mechanisms of the Convective System

At 03:00 on 3 July, the convective system in the southwest of Beijing is dramatically strengthened, and the height of the strong echo center above 50 dBz extends to the height above 0 °C layer (figure omitted), showing the echo pattern of “continental” strong convection with a high echo center. At 03:30, the convective system in Beijing moves eastward, and a cold pool is generated near the surface. The cold pool outflow appears in front of the convective system (Figure 10a), and it merges with the southeasterly airflow to generate two convective convergence centers in Jinghai and Xiqing. Among them, the convective convergence in Jinghai is more pronounced, and thus, convective cell 1 is first triggered (Figure 6a). At 03:42, the cold pool outflow maintains in the southwest of Beijing (Figure 10b), and the convective system in the Xiqing region also has some outflow effects after the occurrence of precipitation. The two westerly airflows cause the convective system in Xiqing to move eastward and gradually enter the Jinnan District. At the same time, the convective system in the Jinghai region continues to move northeastward, guided by the southwesterly airflow at 200 m height, and evolves into a convergence line; the cold pool outflow results in two convective systems moving closer together. At 04:00 (Figure 10c), the convective system moving eastward and the convergence line moving northeastward merge into convective cell 3 in the south of Jinnan (Figure 6c). The cold pool outflow from the boundary layer and the southeasterly airflow from the Bohai Sea jointly cause the convective system to be stable and less moving, thereby resulting in heavy hourly rainfall of more than 70 mm at many stations.
The mesoscale temperature front is conducive to triggering the convective system. Around 04:00 on 3 July, northerly airflows converge into the Jinghai area (Figure 11c), and the velocity fluctuation of easterly wind appears in the east of Jinghai. The near-surface northerly wind and the southerly wind from the Bohai Sea converge obviously in the Jinghai area. This situation leads to Jinghai developing into a mesoscale convergence area, and the convergence is further strengthened. Simultaneously, with the strengthening of the low-level jet, the lower-level warm center is maintained, and airflow accumulates near the Jinghai–Xiqing–Jinnan area. In addition, the surface temperature is above 27 °C, and there is a temperature gradient near the mesoscale convergence line (Figure 11a). The convergence of wind velocity results in strong uplifting motion, and the mesoscale temperature gradient is favorable for strengthening the ascending motion of warm air and the descending motion of cold air, thus enhancing the ascending motion in the high-temperature gradient region. Under these conditions, convection in the Jinghai area is prone to trigger, resulting in heavy local precipitation. At 04:50, the precipitation near Jinghai causes a sudden drop in temperature, and the 50 min temperature decrease reaches 4 °C, forming a mesoscale temperature gradient area of cold in the west and warm in the east. The temperature gradient in this temperature gradient area continues to strengthen, with a horizontal gradient reaching 0.42 °C (km)−1 (Figure 11b).
Combined with the analysis of surface dew point (Figure 11c,d), a high-value belt of dew point in the south-northwest trend was formed in the south of Jinghai–Xiqing–Jinnan at 04:00 (Figure 11c), and the easterly wind continuously transported the air of high temperature and humidity to the border of Jinghai–Xiqing–Jinnan, providing favorable environmental conditions for the convective system to enter this area and strengthen its development after moving eastward. At 05:00, the dew point temperature center reached 28.2 °C (Figure 11d). Although the precipitation in the Jinnan region had already started, the southeast wind still transported hot and humid water vapor to the region, which maintained the mesoscale convective system. In the warm sector of the mesoscale temperature frontal zone, there is convergence due to the influence of wind velocity fluctuation near the surface (Figure 11d), which is conducive to ascending motion. Therefore, the development of convection is vigorous at JN station in the warm sector around 04:50. The triggering mechanism of convective initiation is summarized as follows. Southeasterly or southerly airflow from the ocean, passing through the warm region, turns into a warm southerly airflow and converges with the cold airflow from the southwest of Beijing to form a horizontal wind field convergence zone in the Jinghai–Xiqing–Jinnan area. The convergence of the wind field and the horizontal temperature gradient jointly trigger the convection.
At 04:00, two convective systems are located at the junction of Xiqing, Jinghai, and southern Jinnan (Figure 12a), and the easterly wind begins to appear in the lower layers on the eastern side of JN station (Figure 12b). At this time, updrafts are weak. At 04:36, the convective system gradually develops, and the westerly airflow in the west of Jinnan is strengthened, which further promotes the development of the convective system. Two convective cells merge and strengthen (Figure 12c). The westerly airflow in the west of Jinnan is strengthened, which further promotes the development of the convective system. The easterly airflow is strengthened, with a thickness of 500 m (between 200 m and 700 m height). The westerly and easterly airflows produce ascending motion in the east of Jinnan. This updraft flows out of clouds at the height of 1700 m and forms clockwise vertical circulation C1 along the direction of the convective cell. The horizontal scale of this circulation is 20 km, and the circulation center is located at 400–800 m height. The middle-level inflow on the front side enters clouds, which are divided into outflows on the front and rear sides at upper levels. The outflow on the front side and the warm and moist easterly airflow forms strong convergence in front of the convective system. There is obvious vertical ascending velocity over Jinnan, with a value of about 0.2 Pa s−1. The rainfall at YQ station (west of JN station) increases, with hourly rainfall intensity reaching 76.6 mm h−1. At 05:06, vertical circulation C1 on the eastern side of the convective system (Figure 12e) rises and moves eastward (Figure 12f) with increased thickness and intensity. The outflows from the eastern and western sides cause a strengthening of ascending motion in eastern Jinnan. In the vertical direction, the two updrafts in front of the convective system merge, and the cold pool outflow on the western side and the inflow on the front side converge below 1200 m. This situation results in a more intense ascending motion at the height of 800–2700 m, and the intensity of the ascending motion reaches 0.4 Pa s−1. At 05:42, the convective system gradually moves eastward (Figure 12g) and promotes the vertical circulation to move eastward and rise (Figure 12h). At this time, the intensity of the ascending motion in the Jinnan District reaches the maximum (−64 × 10−5 s−1), which provides favorable conditions for continuous heavy precipitation.

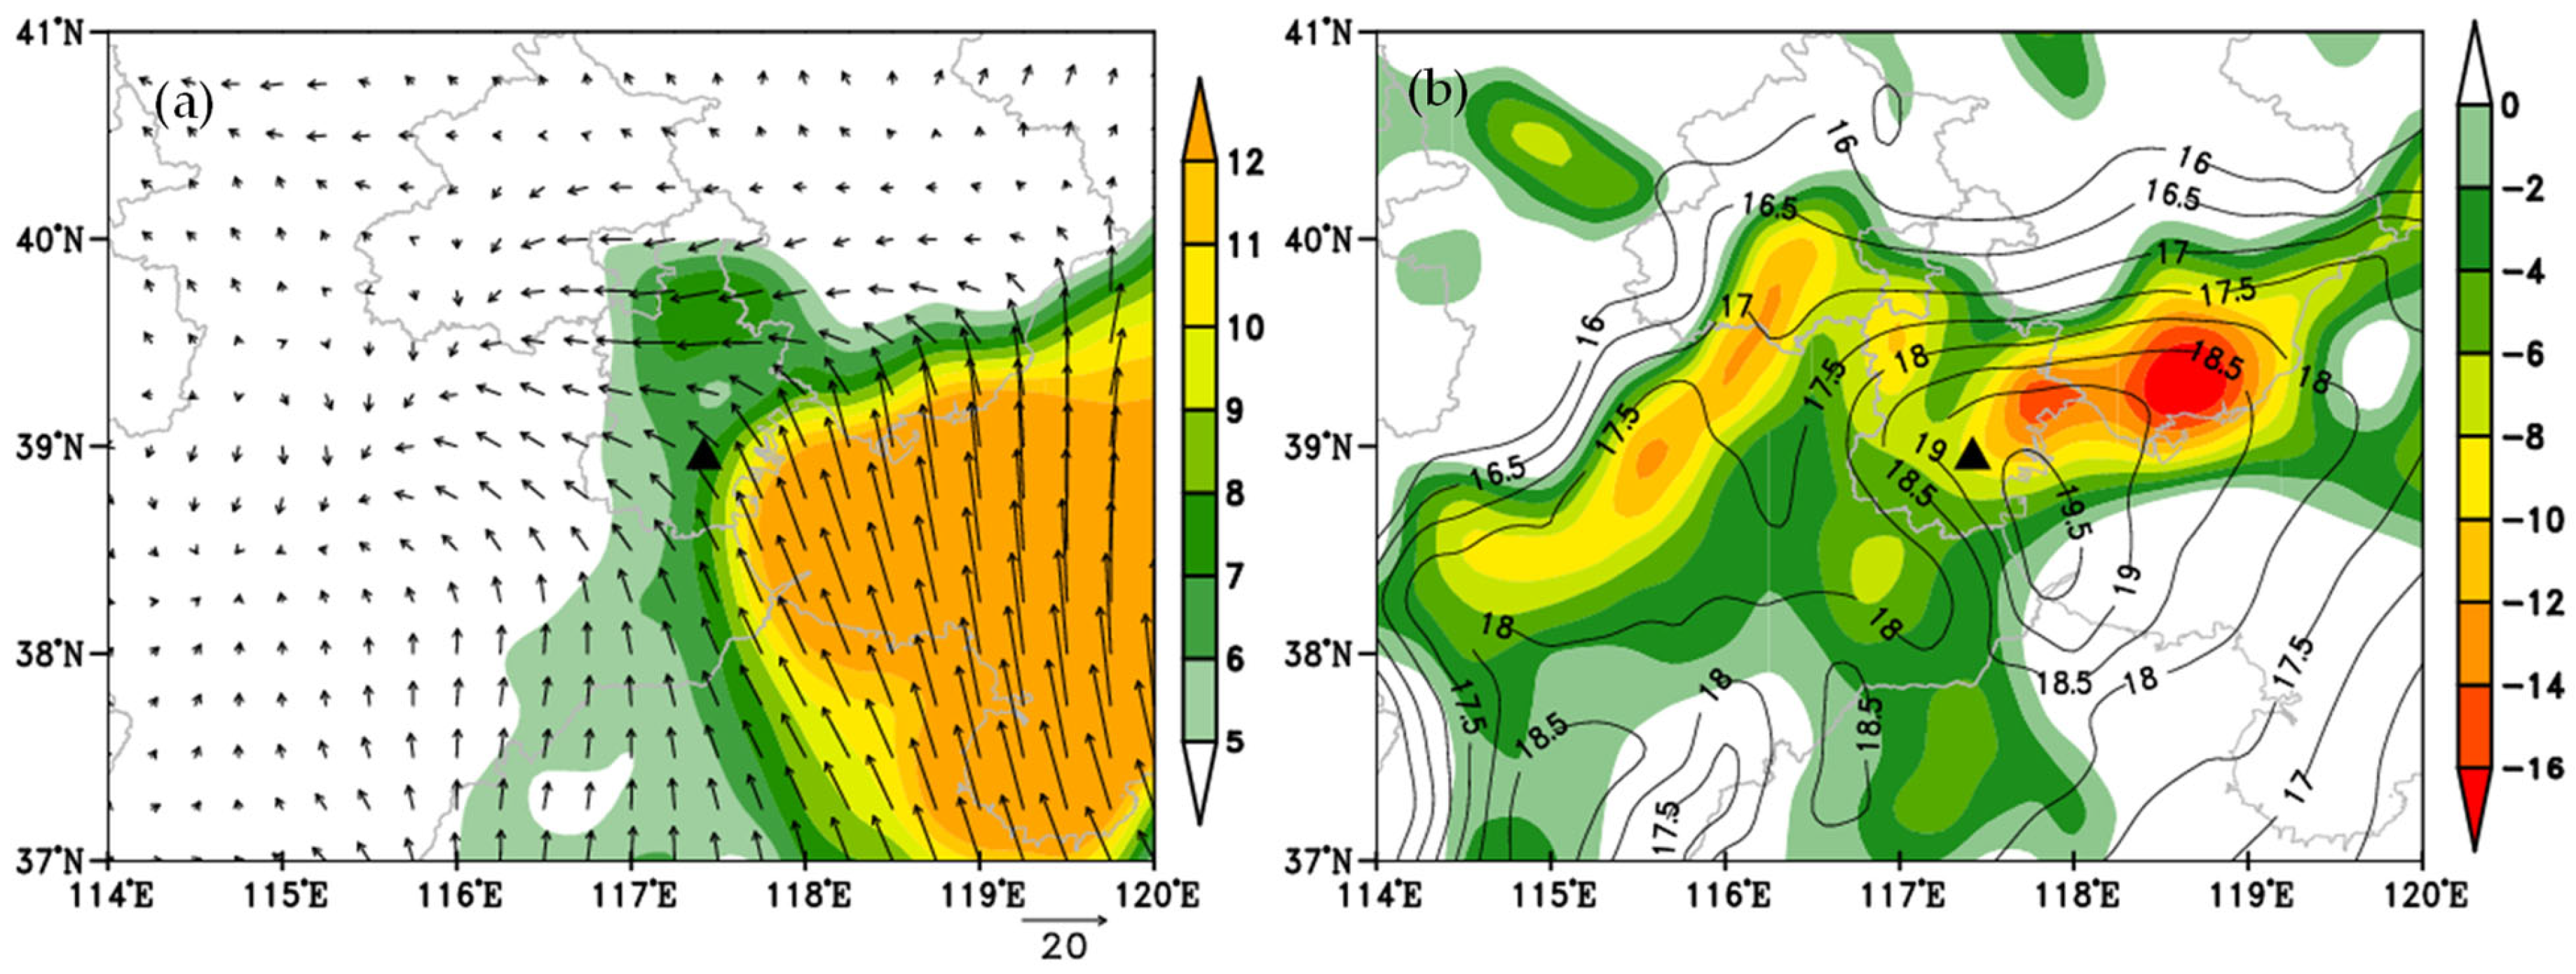
5.4. Water Vapor Characteristics

During this heavy precipitation event, the maximum specific humidity at 975 hPa, 925 hPa, and 850 hPa at Jinnan station reaches 19 g (kg)−1, 16 g (kg)−1, and 14 g (kg)−1, respectively. The water vapor originates from Bohai Bay and is transported by the near-surface easterly airflow and the southerly low-level jet in front of the upper-level trough. From the water vapor transport flux and wind field profile at 04:00 on 3 July (Figure 13a), JN station is located on the western side of the large-value area of water vapor transport flux, and the water vapor transport is mainly distributed below 900 hPa in the boundary layer. There is a large-value center of water vapor transport flux in the eastern part of Jinnan, where water vapor is transported to the Jinnan District through the weak easterly wind at lower layers, with a water vapor transport flux of 6 g s−1 (hPa)−1 (cm)−1. Meanwhile, at the station, the specific humidity below 850 hPa is greater than 12 g (kg)−1. The specific humidity is transported upward from lower layers, and the maximum value of vertically transported specific humidity is located near 850 hPa. Thus, the water vapor in lower layers is supplemented and accumulated upward. At 05:00 on 3 July, the easterly wind slightly strengthened, leading to a certain increase in the water vapor transport flux at JN station (Figure 13c). The specific humidity below 900 hPa is greater than 13 g (kg)−1 (Figure 13d), and the maximum upward transport of specific humidity can be found near 900 hPa. Moreover, the diagnostic analysis indicates that the water vapor transport above 850 hPa is not remarkable, while it has an essential contribution to the occurrence of extreme rainstorms, especially in 975–1000 hPa (Figure 13a,b). The water vapor transport flux field at 975 hPa at 05:00 on 3 July (Figure 14a) shows that the southeasterly airflow continuously transports water vapor from the Bohai Sea to the heavy rainfall area, and Jinnan is located at the edge of the high gradient of water vapor transport flux. Further analysis of the water vapor convergence (Figure 14b) suggests that the water vapor convergence center in the eastern part of Jinnan is particularly pronounced. JN station is located in the convergence zone of water vapor transport at 975 hPa, where the specific humidity is greater than 19 g (kg)−1 and water vapor is abundant. Such a humid environment provides sufficient water vapor for the local hourly rainfall.

6. Conclusions

A heavy rainstorm exceeding the historical record value occurred in the Jinnan District of Tianjin on 3 July 2022. We analyzed the occurrence and development mechanism of this process, and the main conclusions are as follows.
This extreme rainfall process shows obvious mesoscale weather characteristics, such as high short-term rainfall intensity, short life history, and strong locality. The precipitation process is influenced by multi-scale weather systems such as the 500 hPa upper-level trough and the long-distance water vapor transport by Typhoon Chaba. The southwesterly airflow in front of the low-level trough and the southwesterly airflow on the northern side of Typhoon Chaba control the Tianjin area, and the easterly wind from the Bohai Sea supplies abundant water vapor to the Tianjin area.
The 2 m temperature and the dew point temperature in the southeast of the heavy rainfall area were higher than 27 °C; the easterly flow transported air with higher temperature and humidity to the heavy rainfall area. The rainstorm process is caused by the cold pool outflow produced by the upstream precipitation, the easterly disturbance in the boundary layer, the mesoscale temperature front, and the ground convergence line. The mesoscale secondary circulation is formed in the meridional direction by the mesoscale convergence and its interaction with the strong velocity in front of the trough, leading to the development and maintenance of the vertical motion in the Jinnan region and thereby resulting in the occurrence and development of this extreme rainfall process.
The water vapor transport from the lower troposphere to the surface plays an essential role in the occurrence of the extreme rainstorm process, especially in 975–1000 hPa. The southeasterly airflow continuously transports water vapor from the Bohai Sea to the heavy rainfall area, and the southern part of Tianjin is located at the edge of the high gradient of water vapor transport flux.

Author Contributions

Conceptualization, H.C. and Y.Z.; methodology, Y.W. (Yinghua Wei); software, H.C., X.L. and Y.Y.; formal analysis, H.C. and X.L.; writing—review and editing, H.C., Y.W. (Yinghua Wei) and Y.Z.; data collection and curation curation, Y.W. (Yanchun Wang) and Y.Y.; supervision, Y.W. (Yinghua Wei); visualization, Y.W. (Yanchun Wang) and N.Z.; funding acquisition, H.C. All authors have read and agreed to the published version of the manuscript.

Funding

This study was jointly supported by the National Natural Science Foundation of China (Grant No. 41575049), the Tianjin Meteorological Bureau Fund (Grant No. 202202ybxm01), and the Weather forecast recovery project of China Meteorological Administration (Grant No. FPZJ2023-009, Grant No. FPZJ2023-005).

Institutional Review Board Statement

Not applicable.

Informed Consent Statement

Not applicable.

Data Availability Statement

The data that support our research findings are available from the corresponding author on request.

Acknowledgments

Thanks for the experimental data provided by the National Meteorological Center of the China Meteorological Administration. We thank Nanjing Hurricane Translation for reviewing the English language quality of this paper.

Conflicts of Interest

The authors declare no conflict of interest.

References

  1. Gu, X.; Ye, L.; Xin, Q.; Zhang, C.; Zeng, F.; Nerantzaki, S.D.; Papalexiou, S.M. Extreme Precipitation in China: A Review on Statistical Methods and Applications. Adv. Water Resour. 2022, 163, 104144. [Google Scholar] [CrossRef]
  2. Allen, M.; Ingram, W. Constraints on future changes in climate and the hydrologic cycle. Nature 2002, 419, 224–232. [Google Scholar] [CrossRef] [PubMed]
  3. Sun, J.S.; He, N.; Wang, G.R.; Chen, M.X.; Liao, X.N.; Wang, H. Preliminary analysis on synoptic configuration evolvement and mechanism of a torrential rain occurring in Beijing on 21 July 2012. Torr. Rain Dis. 2012, 31, 218–225. (In Chinese) [Google Scholar]
  4. Li, Z.; Gao, Y. Impact of Interaction between Metropolitan Area and Shallow Lake on Daily Extreme Precipitation over Eastern China. Atmosphere 2022, 13, 306. [Google Scholar] [CrossRef]
  5. Zhang, Y.; Sun, X.; Chen, C. Characteristics of concurrent precipitation and wind speed extremes in China. Weather Clim. Extrem. 2021, 32, 100322. [Google Scholar] [CrossRef]
  6. Doswell, C.A., III; Brooks, H.E.; Maddox, R.A. Flash Flood Forecasting: An Ingredients-Based Methodology. Weather Forecast. 1996, 11, 560–581. [Google Scholar] [CrossRef]
  7. Liao, X.N.; Ni, Y.Q.; He, N.; Song, Q.Y. Analysis of the synoptic-scale dynamic process causing the extreme moisture environment in the “7.21” heavy rain case. Acta Meteorol. Sin. 2013, 71, 997–1011. [Google Scholar]
  8. Lau, K.-M.; Zhou, Y.P.; Wu, H.-T. Have tropical cyclones been feeding more extreme rainfall? J. Geophys. Res. 2008, 113, D23113. [Google Scholar] [CrossRef]
  9. Tao, S.Y. Heavy Rainfalls in China; Science Press: Beijing, China, 1980; pp. 1–225. (In Chinese) [Google Scholar]
  10. Tao, S.Y.; Zhao, S.X.; Zhou, X.P.; Ji, L.R.; Sun, S.Q.; Gao, S.T.; Zhang, Q.Y. The research progress of the synoptic meteorology and synoptic forecast. Chin. J. Atmos. Sci. 2003, 27, 451–467. [Google Scholar]
  11. Bian, Q.H.; Ding, Z.; Wu, M.Y. Statistical analysis of typhoon heavy rainfall in North China. Meteorol. Mon. 2005, 31, 61–65. [Google Scholar]
  12. Sun, J.H.; Qi, L.L.; Zhao, S.X. A study on mesoscale convective systems of the severe heavy rainfall in North China by “9608” typhoon. Acta Meteorol. Sin. 2006, 64, 57–71. [Google Scholar]
  13. Lei, L.; Sun, J.S.; He, N.; Liu, Z.; Zeng, J. A study on the mechanism for the vortex system evolution and development during the torrential rain event in North China on 20 July 2016. Acta Meteorol. Sin. 2017, 75, 685–699. [Google Scholar]
  14. Zhao, S.X.; Sun, J.H.; Lu, R.; Fu, S. Analysis of the 20 July 2016 unusual heavy rainfall in North China and Beijing. Meteorol. Mon. 2018, 44, 351–360. [Google Scholar]
  15. Zhang, D.L.; Lin, Y.H.; Zhao, P.; Yu, X.; Wang, S.; Kang, H.; Ding, Y. The Beijing extreme rainfall of 21 July 2012: “Right results” but for wrong reasons. Geophys. Res. Lett. 2013, 40, 1426–1431. [Google Scholar] [CrossRef]
  16. Luo, Y.L.; Gong, Y.; Zhang, D.L. Initiation and organizational modes of an extreme-rain-producing mesoscale convective system along a Mei-Yu front in East China. Mon. Weather Rev. 2014, 142, 203–221. [Google Scholar] [CrossRef]
  17. Luo, Y.L.; Wu, M.W.; Ren, F.M.; Li, J.; Wong, W.K. Synoptic situations of extreme hourly precipitation over China. J. Clim. 2016, 29, 8703–8719. [Google Scholar] [CrossRef]
  18. Pu, Y.; Hu, S.; Luo, Y.; Liu, X.; Hu, L.; Ye, L.; Li, H.; Xia, F.; Gao, L. Multiscale Perspectives on an Extreme Warm-Sector Rainfall Event over Coastal South China. Remote Sens. 2022, 14, 3110. [Google Scholar] [CrossRef]
  19. Ye, L.; Liu, X.; Pu, Y.; Li, H.; Xia, F.; Xu, B. Contrasts in the Evolution and Microphysical Features of Two Convective Systems during a Heavy Rainfall Event along the Coast of South China. Atmosphere 2022, 13, 1549. [Google Scholar] [CrossRef]
  20. Huang, S. Heavy Rain in South China during Pre-Flood Season; Guangdong Science and Technology Press: Guangzhou, China, 1986; pp. 94–95. [Google Scholar]
  21. He, L.F.; Chen, T.; Kong, Q. A review of studies on prefrontal torrential rain in South China. J. Appl. Meteorol. Sci. 2016, 27, 559–569. [Google Scholar]
  22. Chen, J.; Xue, J.S.; Yan, H. The impact of physics parameterization schemes on mesoscale heavy rainfall simulation. Acta Meteorol. Sin. 2003, 6, 203–218. [Google Scholar]
  23. Xia, R.D.; Zhao, S.X.; Sun, J.H. A study of circumstances of meso-β-scale systems of strong heavy rainfall in warm sector ahead of fronts in South China. Chin. J. Atmos. Sci. 2006, 30, 988–1008. [Google Scholar]
  24. Zhao, Y.C.; Li, Z.C.; Xiao, Z.N. Comparison analysis of South China front and warm-area heavy rain systems in June 2006. Meteorol. Sci. Technol. 2008, 36, 47–54. [Google Scholar]
  25. Liu, R.X.; Sun, J.H.; Fu, S.M. Comparison of Synoptic Circulation Characteristics in Different Types of Warm-Sector Heavy Rainfall Events over South China. Clim. Environ. Res. 2021, 26, 359–373. [Google Scholar]
  26. Duan, L.; Bian, S.F.; Yu, X.D.; Cui, Y.Y. Comparative analysis of CINRAD SA doppler radar product in three local torrential rains in the West of Beijing. Meteorol. Mon. 2009, 35, 21–28. [Google Scholar]
  27. Chen, Y.; Lv, W.Q.; Yu, C.; Li, S.Q.; Yang, S.N.; Zhu, W.J.; Gong, Y. Analysis of a forecast failure case of warm sector torrential rainfall in North China. Meteorol. Mon. 2018, 44, 15–25. [Google Scholar]
  28. Chen, Y.; Chen, T.; Wang, L.Y.; Li, S.Q.; Xu, J. A review of the warm-sector rainstorms in China. Torr. Rain Dis. 2019, 38, 483–493. [Google Scholar]
  29. Xu, L.Z.; Lv, J.J.; Xu, C.Y. Fluctuation characteristics of Tianjin rainstorm in late July 2012. Trans. Atmos. Sci. 2014, 37, 613–622. [Google Scholar]
  30. Duan, B.L.; Zhang, W.L.; Liu, H.W.; Wang, X.Y. The spatial and temporal distributions of warm sector rainfall and frontal rainfall for the torrential rain event in Beijing on 21 July 2012. Torr. Rain Dis. 2017, 36, 108–117. [Google Scholar]
  31. Lei, L.; Xing, N.; Zhou, X.; Sun, J.; Zhai, L.; Jing, H.; Guo, J. A study on the warm-sector torrential rainfall during 15–16 July 2018 in Beijing area. Acta Meteorol. Sin. 2020, 78, 1–17. [Google Scholar]
  32. Zhang, N.; Wang, Y. Mechanisms for the isolated convections triggered by the sea breeze front and the urban heat Island. Meteorol. Atmos. Phys. 2021, 133, 1143–1157. [Google Scholar] [CrossRef]
  33. Zhang, N.; Wang, Y.; Lin, X. Mesoscale Observational Analysis of Isolated Convection Associated with the Interaction of the Sea Breeze Front and the Gust Front in the Context of the Urban Heat Humid Island Effect. Atmosphere 2022, 13, 603. [Google Scholar] [CrossRef]
  34. Xu, J.; Yang, S.N.; Sun, J.; Zhang, F.; Chen, Y. Discussion on the formation of a warm sector torrential rain case in North China. Meteorol. Mon. 2014, 40, 1455–1463. [Google Scholar]
  35. Zhang, N.; He, Q.Y.; Liu, B.X.; Wu, Z.L.; Liu, Y.W. Analysis on the mesoscale characteristics of a local rainstorm event under a typical circulation situation in Tianjin. Torr. Rain Dis. 2018, 37, 230–237. [Google Scholar]
  36. Wei, Y.H.; Chen, H.; He, Q.Y.; Lin, X.M.; Zhang, H. Influence of easterly winds from west coast of Bohai sea on local heavy rainfall in Tianjin. Meteorol. Mon. 2019, 45, 61–72. [Google Scholar]
  37. Wang, Y.; Dong, C.; YI, X.Y.; Zhang, W.L.; Xu, M. The Thermal and Dynamic Environmental Field Analysis of a Meso-γ Scale Short-Time Rainstorm in Tianjin. Meteorol. Mon. 2021, 47, 398–411. [Google Scholar]
  38. Tao, S.Y.; Wei, J. The westward, northward advance of the subtropical high over the West Pacific in Summer. J. Appl. Meteorol. Sci. 2006, 17, 513–525. [Google Scholar]
  39. Hersbach, H.; Bell, B.; Berrisford, P.; Hirahara, S.; Horányi, A.; Muñoz-Sabater, J.; Thépaut, J.N. The ERA5 global reanalysis. Q. J. R. Meteorol. Soc. 2020, 146, 1999–2049. [Google Scholar] [CrossRef]
  40. Chyi, D.N.; He, L.F.; Wang, X.M.; Chen, S. Fine observation characteristics and thermodynamic mechanisms of extreme heavy rainfall in Henan on 20 July 2021. J. Appl. Meteorol. Sci. 2022, 33, 1–15. [Google Scholar]
Figure 1. Spatial distribution of automatic weather stations (dots) and Tanggu Doppler Radar (TG; red triangle) in Tianjin. “XQ”, “JN”, and “JH” denote Xiqing, Jinnan, and Jinghai Districts of Tianjin, respectively. “Jinnan” is the main study region in the red circle.
Atmosphere 14 00808 g001
Figure 2. Spatial distribution of the accumulated rainfall in Tianjin from 20:00 on 2 July to 20:00 on 3 July 2022. “BD”, “JN”, and “YQ” denote Baodi District, Jinnan national weather station, and Jinnan Yuanqu station.
Atmosphere 14 00808 g002
Figure 3. Time series of (a) hourly and (b) 1 min rainfall at JN and YQ stations from 04:00 to 08:00 on 3 July 2022. “JN” and “YQ” denote Jinnan national weather station and Jinnan Yuanqu station.
Atmosphere 14 00808 g003
Figure 4. (a) Geopotential height (solid black lines; dagpm), wind field (wind barbs) and temperature field (red dashed lines; °C) at 500 hPa, (b) sea level pressure, (c) geopotential height (solid black lines, dagpm) and wind field (wind barbs) at 850 hPa, (d) geopotential height (black solid lines, dagpm) and wind field (wind barbs) at 925 hPa and (e) T-logp of Beijing at 20:00, on 2 July 2022. The red triangle and the blue typhoon symbol indicate the locations of Jinnan and the typhoon, respectively. The red-shaded part of the T-logp diagram represents the potential energy.
Atmosphere 14 00808 g004aAtmosphere 14 00808 g004b
Figure 5. Distribution of echo cells above 45 dBz at 04:00 (red), 04:30 (green), 05:00 (dark blue), and 05:30 (light blue) on 3 July 2022. “XQ”, “JN”, and “JH” denote Xiqing, Jinnan, and Jinghai Districts of Tianjin, respectively. The arrow indicates the direction of travel of the echo.
Atmosphere 14 00808 g005
Figure 6. Radar composite reflectivity from Tanggu station at (a) 3:48, (b) 4:00, (c) 4:12, (d) 4:24, (e) 4:36, (f) 4:48, (g) 5:00, and (h) 5:12 on 3 July 2022. “XQ”, “JN”, and “JH” denote Xiqing, Jinnan, and Jinghai Districts of Tianjin, respectively. Black lines in (e,h) correspond to the position of the profiles in Figure 7a,b, respectively. The black triangle and the number indicate the locations of Jinnan and the convective cell, respectively.
Atmosphere 14 00808 g006
Figure 7. Profiles of the composite radar reflectivity from Tanggu station at (a) 04:36 and (b) 05:12 on 3 July 2022.
Atmosphere 14 00808 g007
Figure 8. Hourly rainfall (dots) and 10 m wind field (arrows) at (a) 04:00–05:00 and (b) 05:00–06:00 on 3 July 2022. “XQ”, “JN”, and “JH” denote Xiqing, Jinnan, and Jinghai Districts of Tianjin, respectively. The solid black line indicates the ground convergence line.
Atmosphere 14 00808 g008
Figure 9. Spatial distributions of cloud-top brightness temperature (unit: °C) from the Fengyun-4A satellite at (a) 04:34, (b) 04:38, (c) 05:30, and (d) 05:38 on 3 July 2022. “A”, “B”, and “C” represent convective clouds, respectively.
Atmosphere 14 00808 g009
Figure 10. The wind velocity (arrows) and disturbance temperature (colored areas; °C) at 200 m from the VDRAS data at (a) 03:30, (b) 03:42, (c) 04:00, and (d) 04:48 on 3 July 2022. “XQ”, “JN”, and “JH” denote Xiqing, Jinnan, and Jinghai Districts of Tianjin, respectively.
Atmosphere 14 00808 g010
Figure 11. (a,b) 2-m temperature (shadow, unit: °C), and (c,d) 10 m wind velocity (wind barbs) and 2 m dew point temperature (colored areas; °C) at (a,c) 04:00 and (b,d) 05:00 on 3 July 2022. “XQ”, “JN”, and “JH” denote Xiqing, Jinnan, and Jinghai Districts of Tianjin, respectively.
Atmosphere 14 00808 g011
Figure 12. (a,c,e,g) The spatial distributions of the 200 m wind field and radar-composite reflectivity (dBz) and (b,d,f,h) the height–latitude profiles of wind vector (vertical velocity multiplied by 50 times), divergence (shaded areas; ×10−5 s−1), and vertical velocity (contour lines; Pa s−1) along 38.95° N at (a,b) 04:00, (c,d) 04:36, (e,f) 05:06, and (g,h) 05:42 on 3 July 2022.
Atmosphere 14 00808 g012
Figure 13. (a,c) Distributions of the wind field (wind barbs) and water vapor flux (contours; g s−1 (hPa)−1 (cm)−1), and (b,d) height–latitude profiles of the specific humidity (contours; g (kg)−1) and vertical-specific humidity transport (q × w, shaded areas) at Jinnan station at (a,b) 04:00 and (c,d) 05:00 on 3 July 2022.
Atmosphere 14 00808 g013
Figure 14. (a) Distribution of the water vapor flux (shaded areas; g s−1 (cm)−1 (hPa)−1) and water vapor flux vector, and (b) distribution of the water vapor flux divergence (shaded areas; ×105 g (cm)−2 (hPa)−1 s−1) and 975 hPa specific humidity (contours; g (kg)−1) at 04:00 on 3 July 2022.
Atmosphere 14 00808 g014
Disclaimer/Publisher’s Note: The statements, opinions and data contained in all publications are solely those of the individual author(s) and contributor(s) and not of MDPI and/or the editor(s). MDPI and/or the editor(s) disclaim responsibility for any injury to people or property resulting from any ideas, methods, instructions or products referred to in the content.

