Abstract
The plasma in situ detector is a multi-sensor package designed to in situ measure the bulk parameters of the local ionospheric plasma. The plasma in situ detector is comprised of three sensors: Langmuir probe (LP), retarding potential analyzer (RPA) and ion drift meter (IDM). LP measures electron density and temperature. RPA measures ion density, temperature and ion horizontal velocity. IDM measures the transverse horizontal component of the ram velocity. The plasma in situ detector has been installed outside the wentian module cabin, and the boom has been successfully deployed which extends the spherical sensor of LP beyond the sheath of the cabin. RPA and IDM were installed at the front of the experiment package, with the horizontal axis direction along the forward flight direction of the space station. This paper discusses the general performance characteristics of the in situ detector, the functional performance of each sensor, and initial results of some classical ionospheric features being observed.
1. Introduction
The ionosphere is an important component of the near-Earth space environment. The orbit of the Chinese space station is 340–450 km located in the ionospheric F-layer region. The inclination angle of the orbit is 42–43°, covering the middle and low latitudes where the ionospheric physical phenomena occur significantly. The special phenomena include equatorial ionization anomaly (EIA), equatorial plasma fountain (EPF) and ionospheric irregularities [1,2].
EIA is a phenomenon in which the uplifted equatorial ionospheric plasma diffuses towards higher latitudes along the geomagnetic field lines during the day, resulting in a bimodal structure on both sides of the geomagnetic equator [3,4]. The process of plasma electrodynamic drift and diffusion is called the equatorial fountain effect [5,6]. EPF is related to local time, as upward drift increases with local time in the morning and generally peaks before noon, then decreases with local time in the afternoon. This local temporal evolution of equatorial upward plasma drift affects the plasma density profile of the low-latitude ionosphere [7,8].
The ionosphere has a continuous density distribution during daytime. However, after sunset, plasma irregularities of various sizes will occur. Plasma irregularities generally occur at the bottom of the F layer (approximately 350–400 km) in low latitude regions, gradually spread and reach the topside ionosphere altitudes [9,10], even 3500 km altitude [11], while forming equatorial plasma bubbles [12]. The scale of plasma bubbles ranges from centimeters to hundreds of kilometers. Radio waves propagating through plasma bubbles undergo sporadic enhancement and fading known as scintillations [13]. When sufficiently intense, scintillations disturb the amplitude and phase of propagating radio signals, and affect communication and navigation systems [14,15]. The occurrence of plasma bubbles is related to solar activity, geomagnetic activity, seasonal variation, and diurnal changes [16,17].
The special physical phenomena of the ionosphere are currently unpredictable, so comprehensive detection data is necessary for deeper research. The scientific objectives of plasma in situ detector onboard China’s space station wentian module is to carry out comprehensive detection of ionospheric plasma, and to study the characteristic and physical phenomenon in the middle and low latitude through long-term observation. Table 1 shows the performance of plasma in situ detector.
Table 1.
The performance of plasma in situ detector.
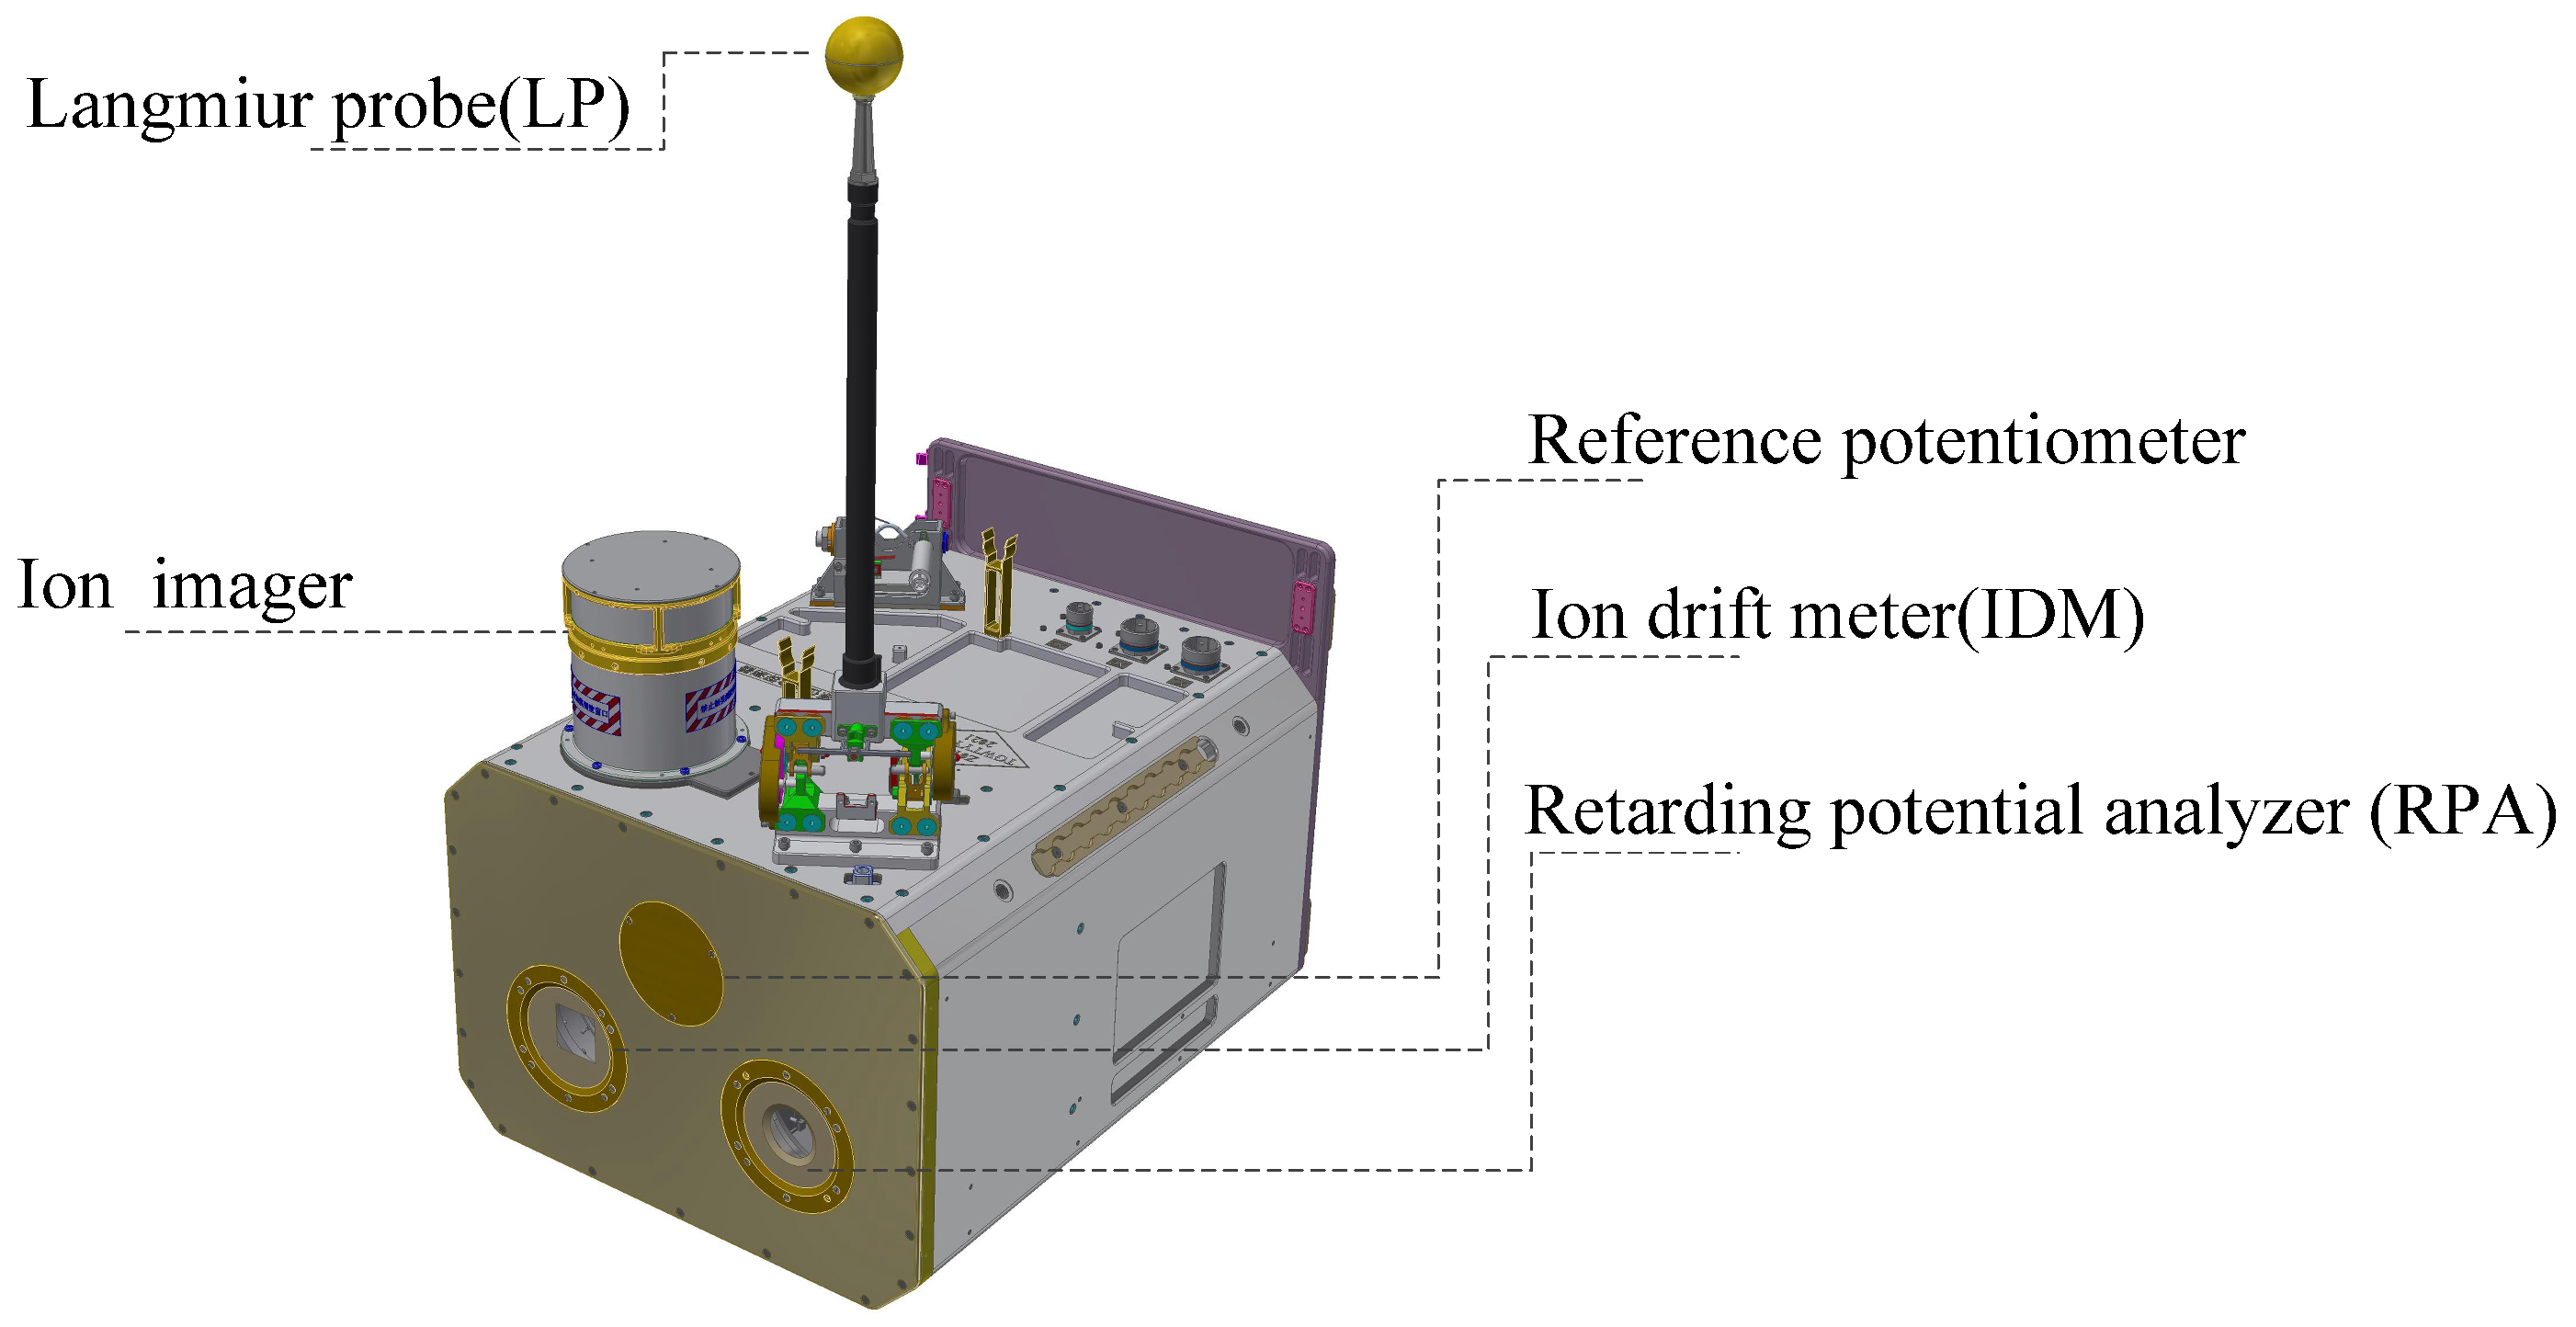
2. Instrument Description
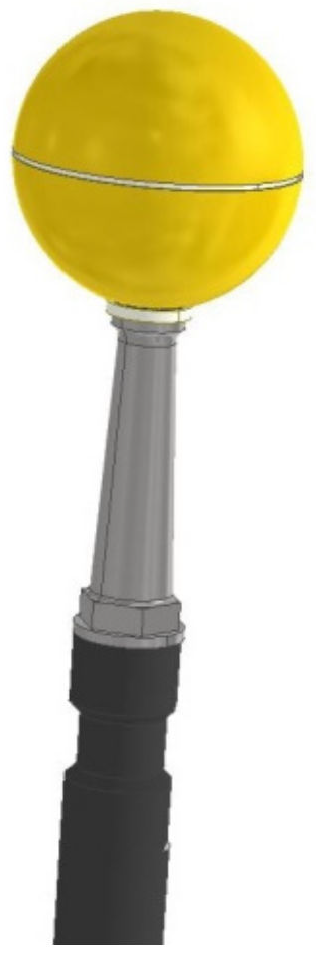
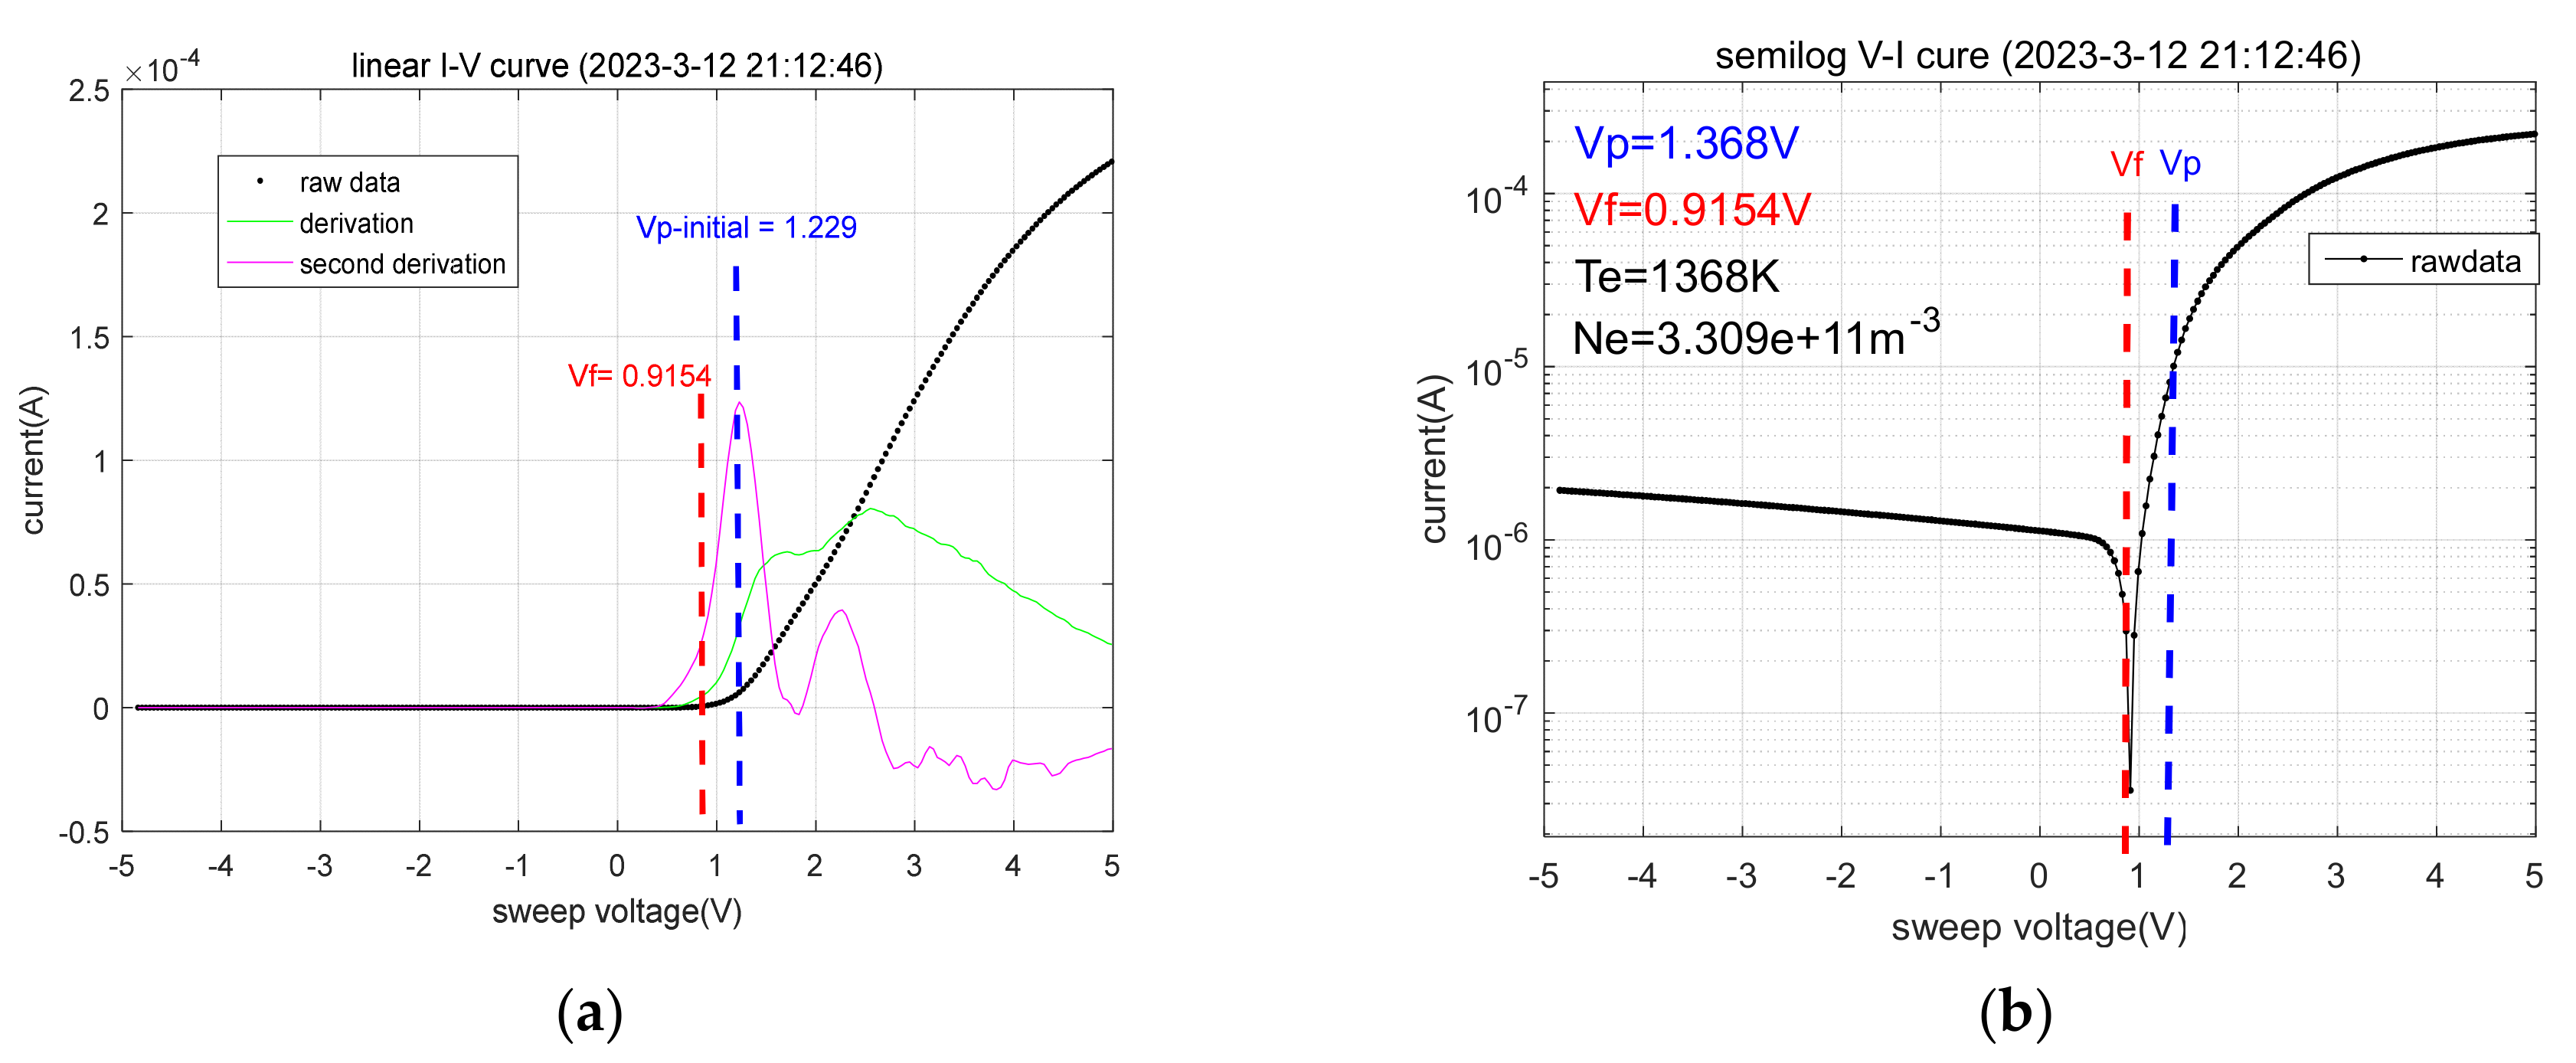
The plasma in situ detector is a part of the plasma experiments package, as shown in Figure 1. The plasma in situ detector includes Langmuir probe (LP), retarding potential analyzer (RPA) and ion drift meter (IDM). In Figure 1, the reference potential meter is available to provide measurements of charging potential of the wentian module. The ion imager is available to image the ion energy and ion velocity direction. The following sections will describe the plasma in situ detector, but the reference potential meter and ion imager will not be introduced.
Figure 1.
Overview of the China space station plasma experiments package, plasma in situ detector is a part including LP, RPA and IDM.
2.1. Langmuir Probe
The principle of LP is to immerse a probe in plasma, vary the bias voltage and measure the collected current that varies with the applied voltage. When the bias voltage is negative, the probe collects an ion current and repels electrons from the ambient plasma. Conversely, for a positive voltage, it collects an electron current and repels ions. The current-voltage (I–V) characteristic of the probe is acquired. The analysis of the I–V characteristic provides the plasma parameters including the electron density and electron temperature [18,19]. The sensor of the LP is shown in Figure 2. The probe is a spherical sensor with a diameter of 50 mm, which is divided into the upper and lower hemispheres. The upper hemisphere is the collector, and the lower hemisphere is the protector: both are loaded with the same sweep voltage. The lower hemisphere is designed to eliminate the terminal effect of the traditional spherical structure, so that the upper hemisphere has an ideal spherical model [20].
Figure 2.
Sensor of the Langmuir probe.
The spherical sensor is built with titanium, and coated with titanium nitride (TiN). TiN is considered as an excellent coating that provides a good uniformity of the probe’s material work function over the entire surface of the spherical sensor [21,22].
The LP is typically biased within the range ±5 V with respect to the wentian module body. The sweep which lasts 1 s is divided into 250 bias voltage steps, the collected current is measured at each step. Each step size is 40 mV, which can be adjusted by command.
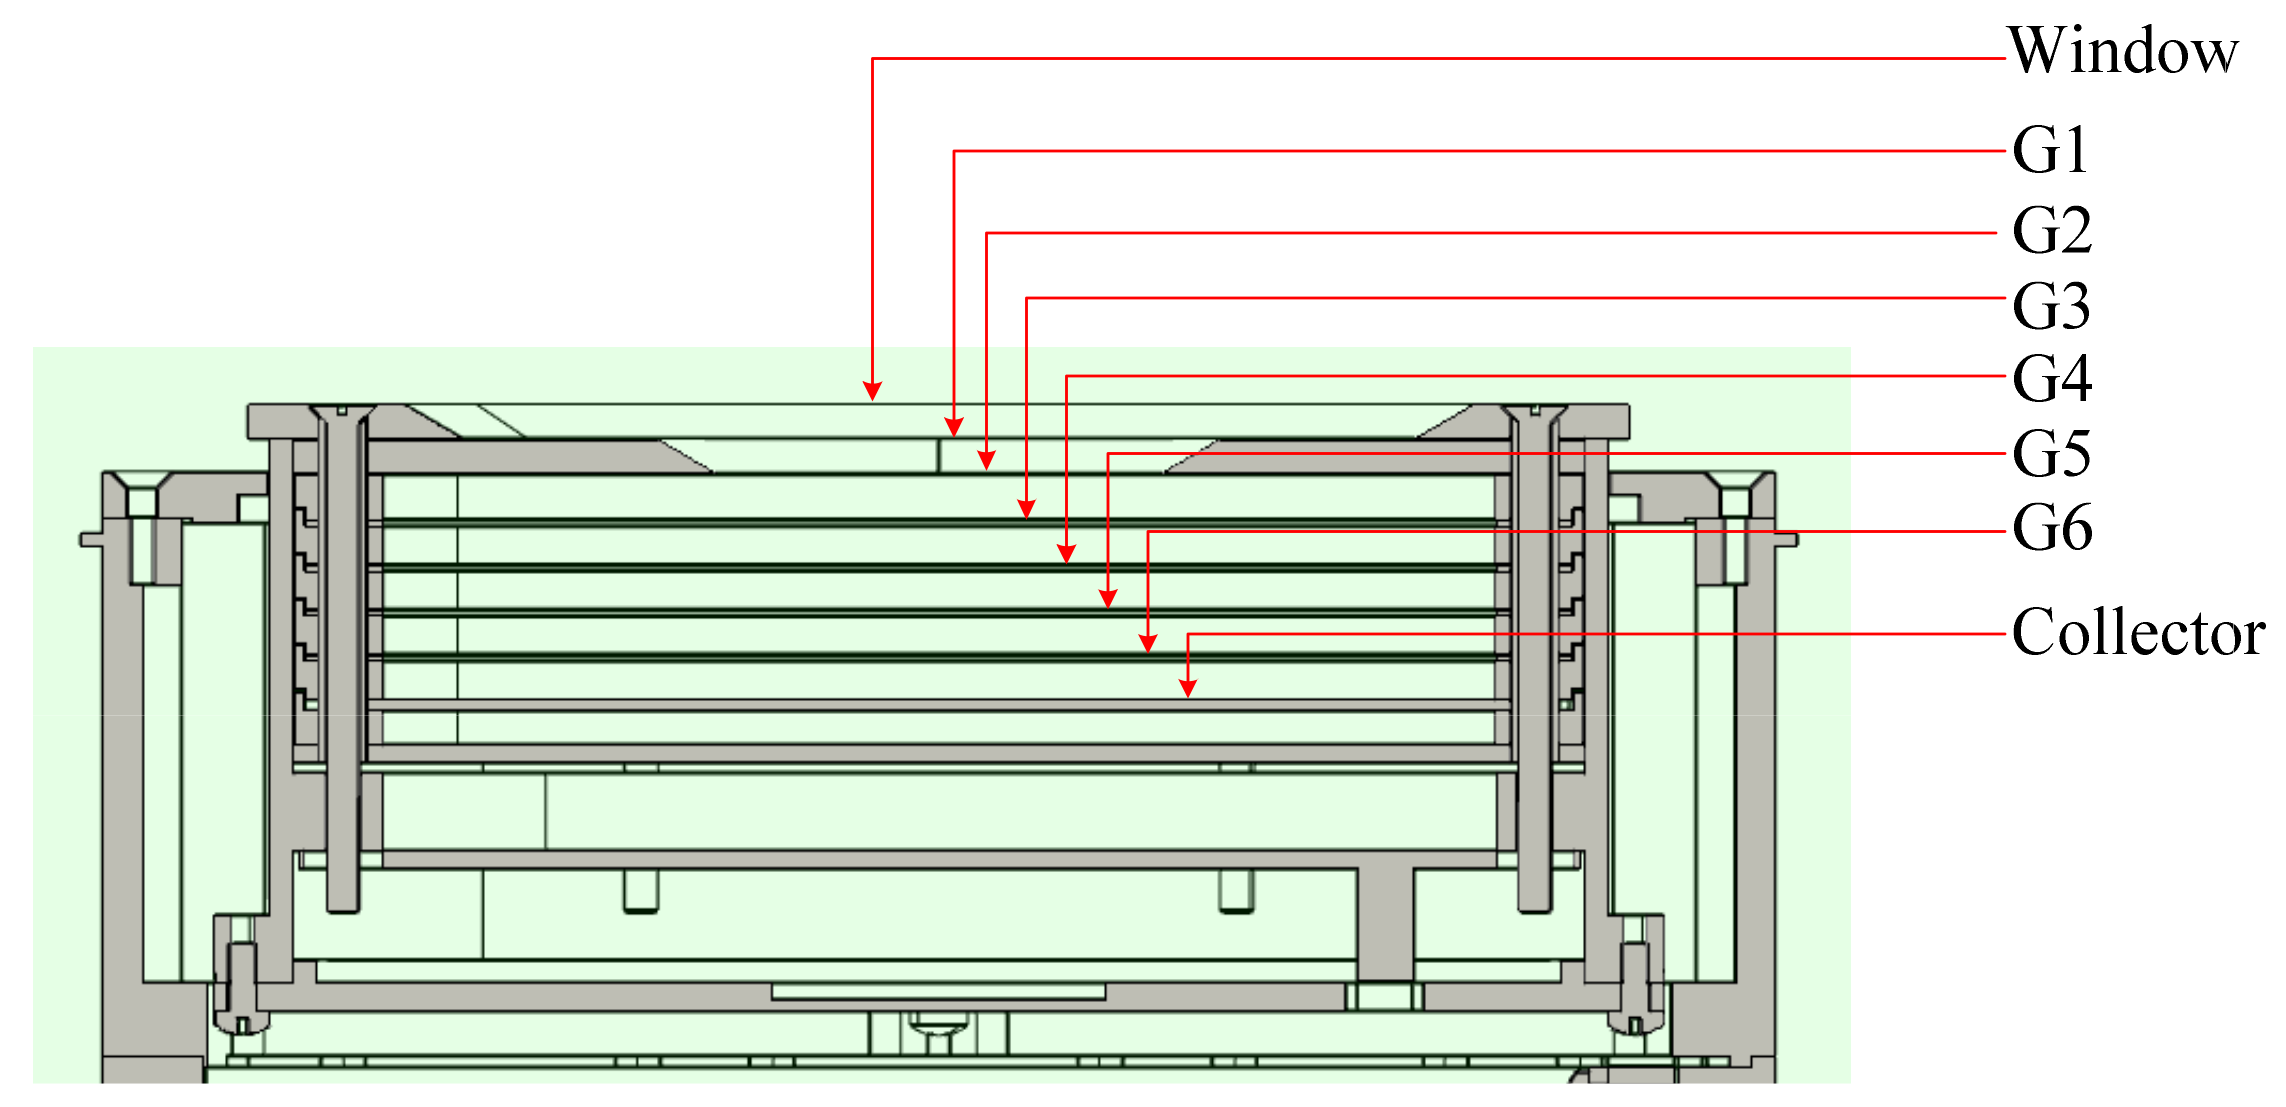
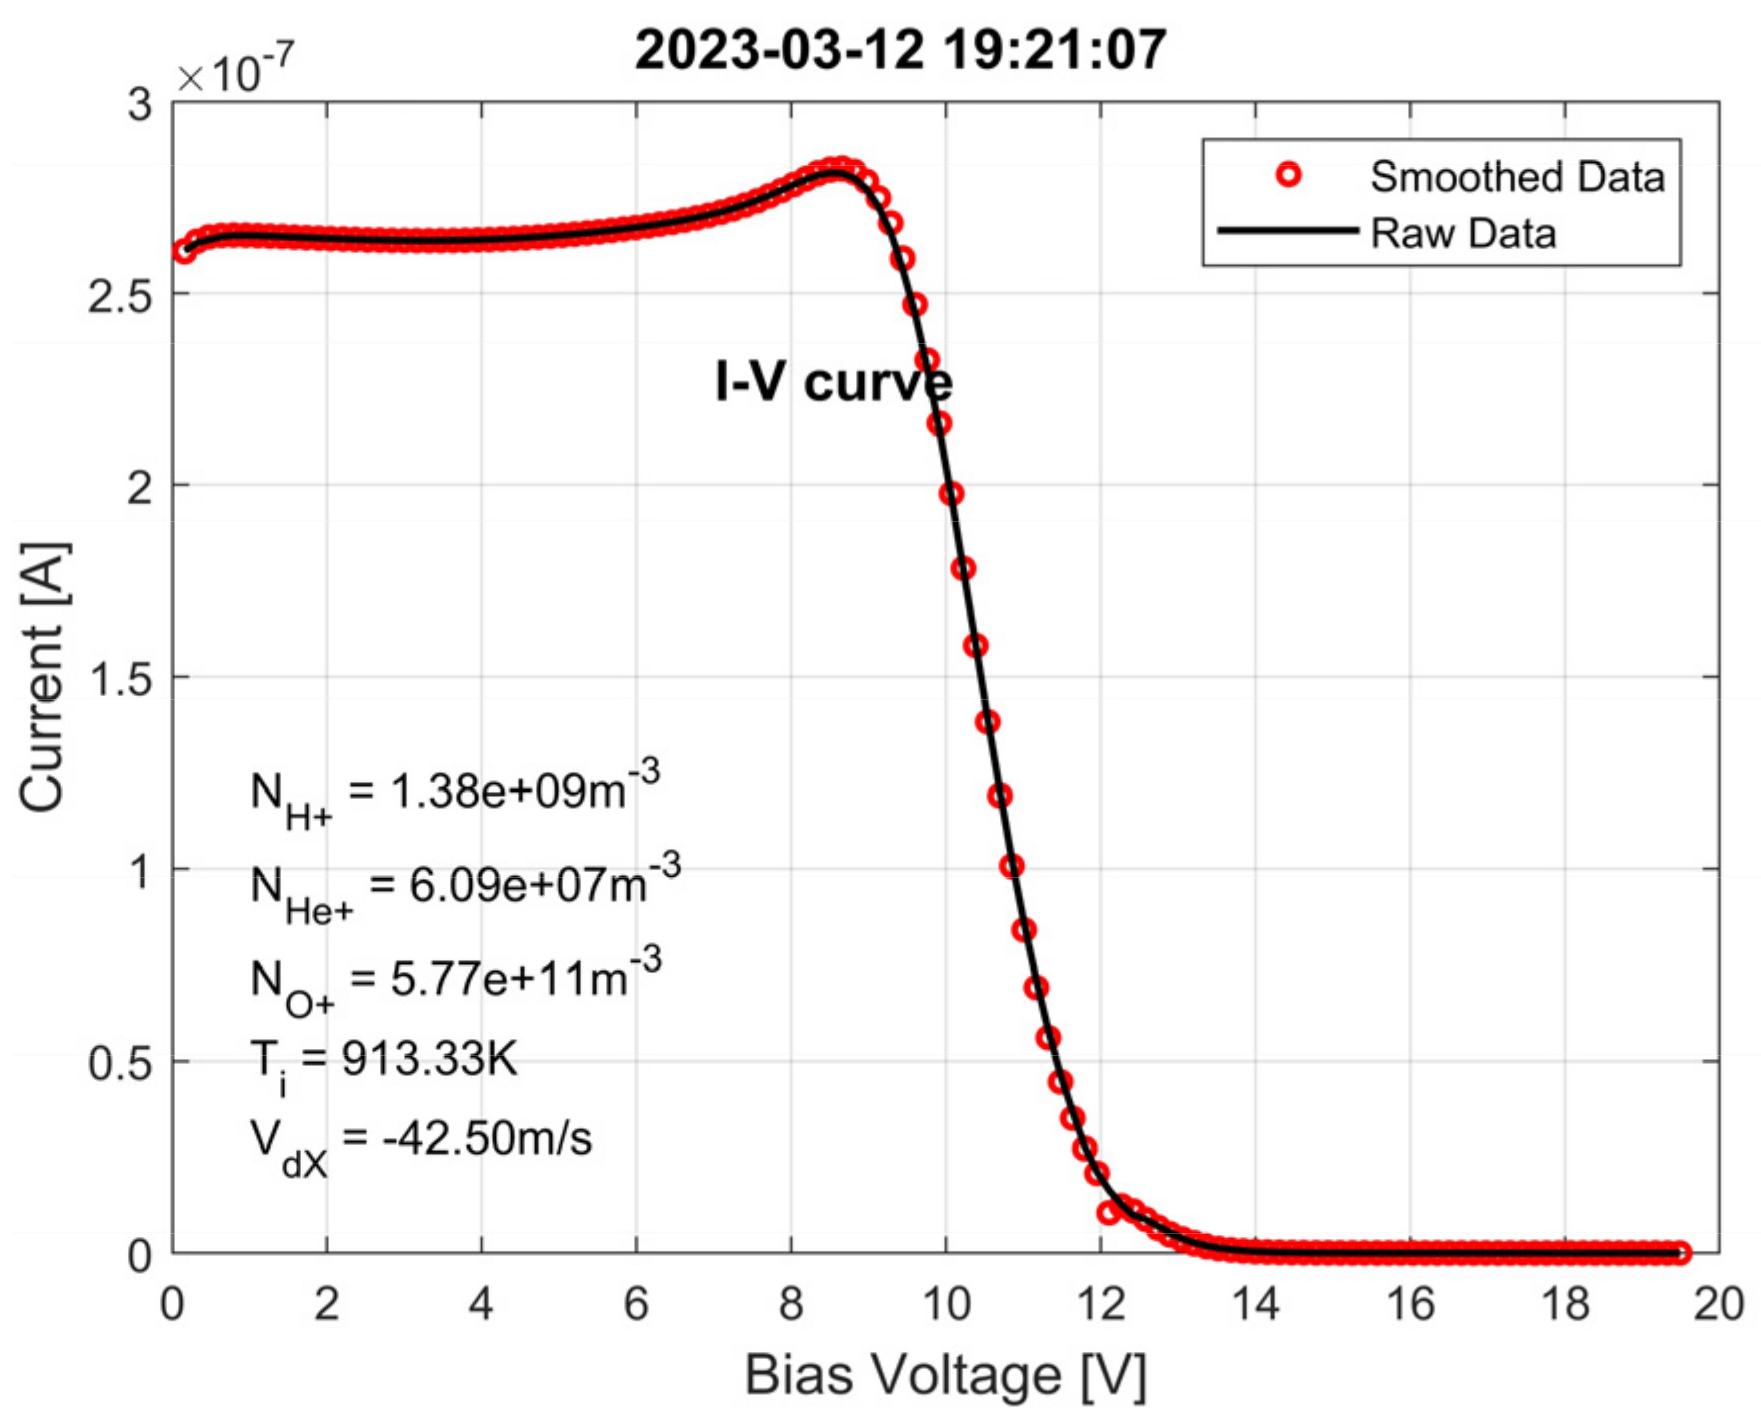
2.2. Retarding Potential Analyzer
RPA is a common measurement technique in space plasmas [23]. The RPA is designed as a cylindrical shape with a round opening and multilayer inside grids, as shown in Figure 3. These grids are built in brass, coated with gold, and divided into mesh arrays whose size is 1 mm × 1 mm. In the initial state, grid G1, G2 and G5 all are loaded with the ground potential to resist external interference. The grid G6 is loaded with a negative potential to prevent the interference of plasma electrons and secondary electrons. The G3 and G4 grids are the “retarding grids” which are loaded the same sweep voltage. The collected current varies with the sweep voltage. The I–V characteristic of the RPA is acquired. The ion density, ion temperature, ion component and ion drift horizontal velocity (parallel to orbit direction) of the plasma can be obtained by analyzing the I–V characteristic curve [24].
Figure 3.
Structural diagram of RPA sensor.
The retarding sweep which lasts 1 s, 125 bias voltage steps are applied to the retarding grids and the current of the collector is measured at each step. Each step size is 156.8 mV, which also can be adjusted by command. At present, the sweep voltage range is from 0 V to +19.6 V with respect to the wentian module body.
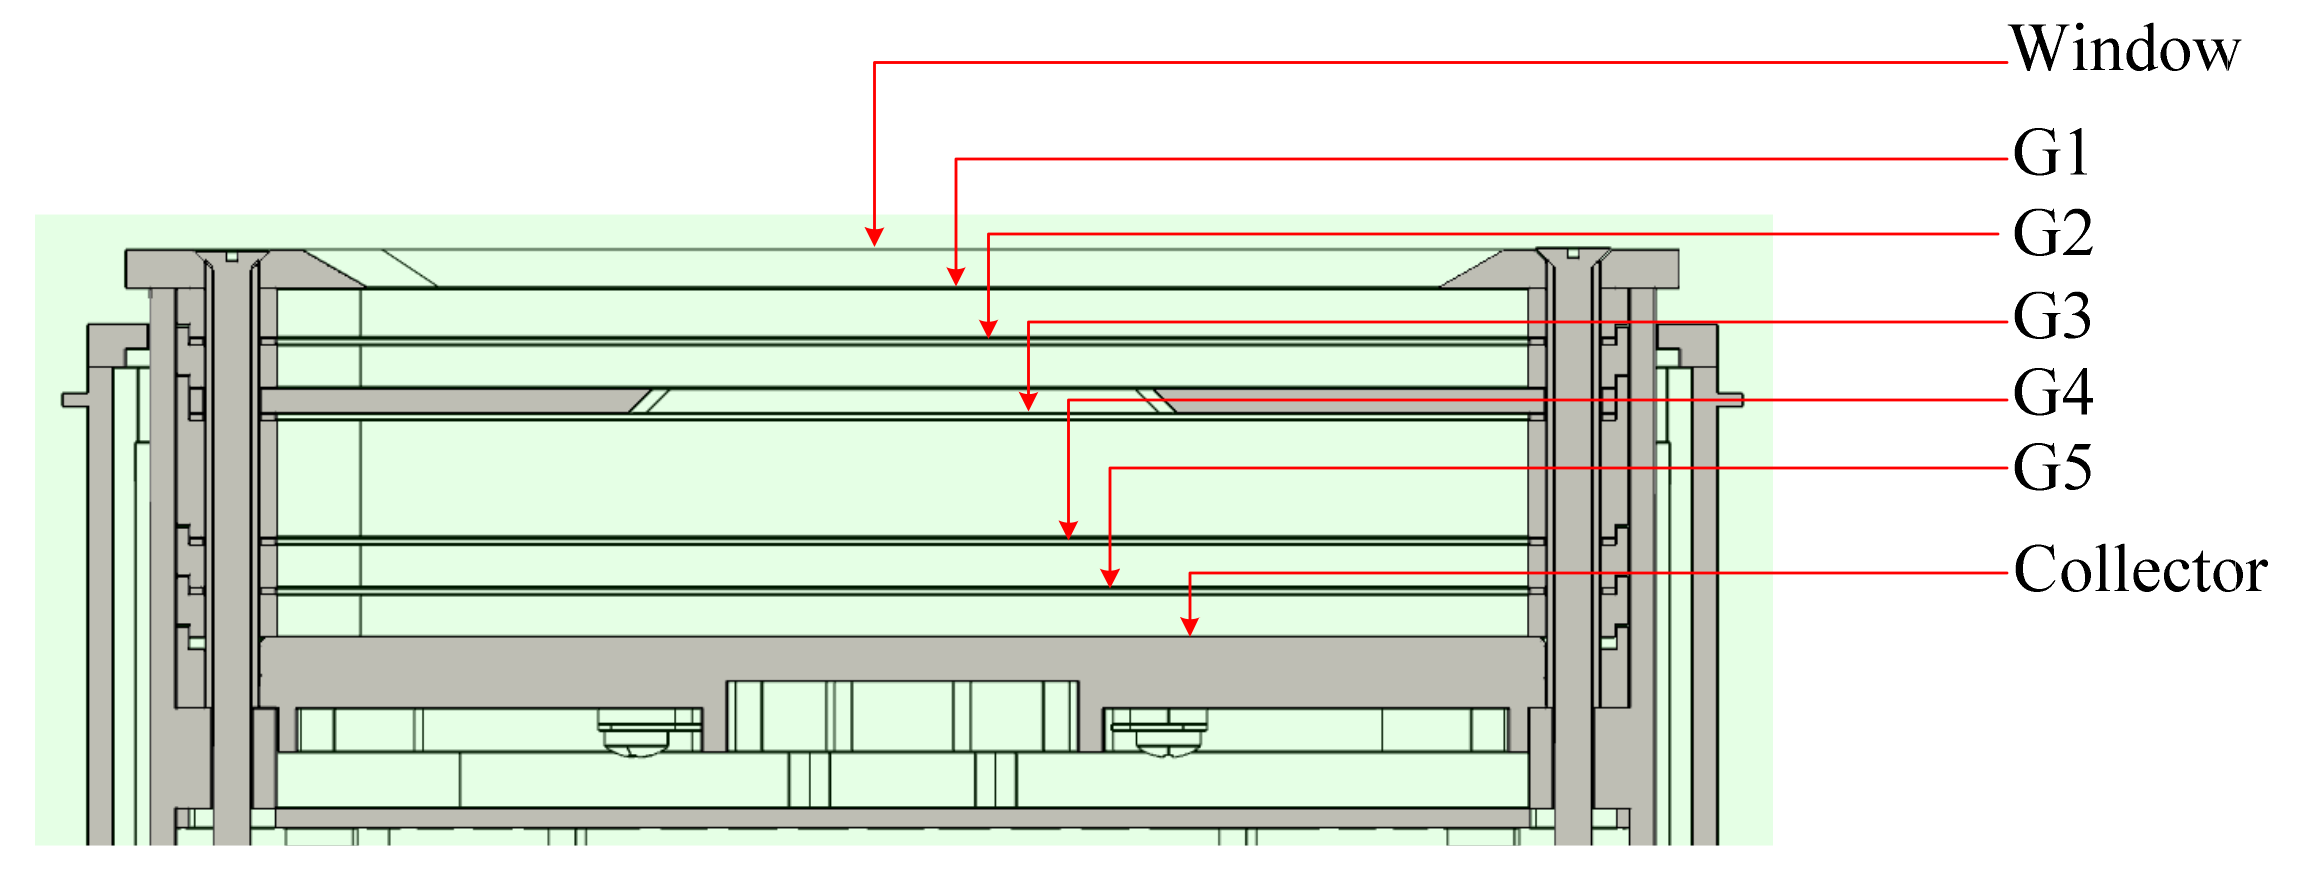
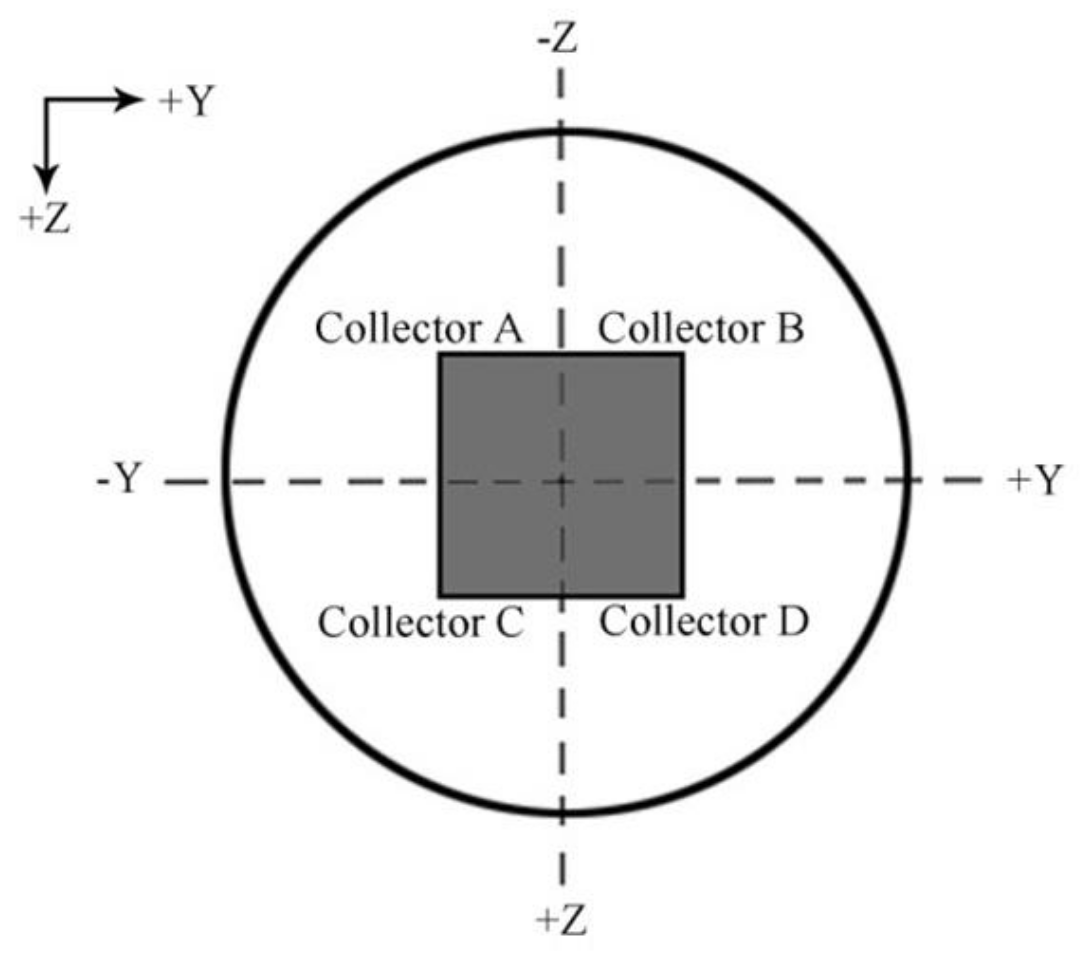
2.3. Ion Drift Meter
The IDM is designed to measure the drift velocity of ions, with a cylindrical shape and multilayer grids inside [25,26]. These grids are also built in brass, coated with gold, and divided into mesh arrays which size is 1 mm × 1 mm. The sensor window of the IDM is square, as shown in Figure 4. In the initial state, G1, G3 and G4 all are the grids with ground potential. The grid G2 is designed with +2 V to block H+ into the sensor. Because of light mass, high thermal velocity and divergent motion inside the sensor, the H+ will affect detection. The grid G5 is designed with a negative potential to prevent the interference from plasma electrons and secondary electrons. The collector is divided into four equal parts which are all connected to ground, as shown in Figure 5, where the Y axis and Z axis are identical to the Y axis and Z axis of the wentian module and the X axis is identical to the forward flight direction of the space station.
Figure 4.
Structural diagram of the IDM sensor.
Figure 5.
Collector of the IDM sensor.
The current of each collector is collected separately. During the data processing, these four collectors can be associated in pairs, featuring two different configurations. In the first one, the collectors are associated in such a way that IAC = IA + IC and IBD = IB + ID, IAC/IBD corresponds to the ion incident angle of the velocity with respect to the vertical (Y, Z) plane, which is the transverse horizontal component of the ram velocity along the spacecraft Y axis. In the second configuration, the collectors are associated in such a way that IAB = IA + IB and ICD = IC + ID, IAB/ICD is corresponds to the ion incident angle of the velocity with respect to the vertical (Z, X) plane, which is the transverse vertical component of the ram velocity along the spacecraft Z axis [23].
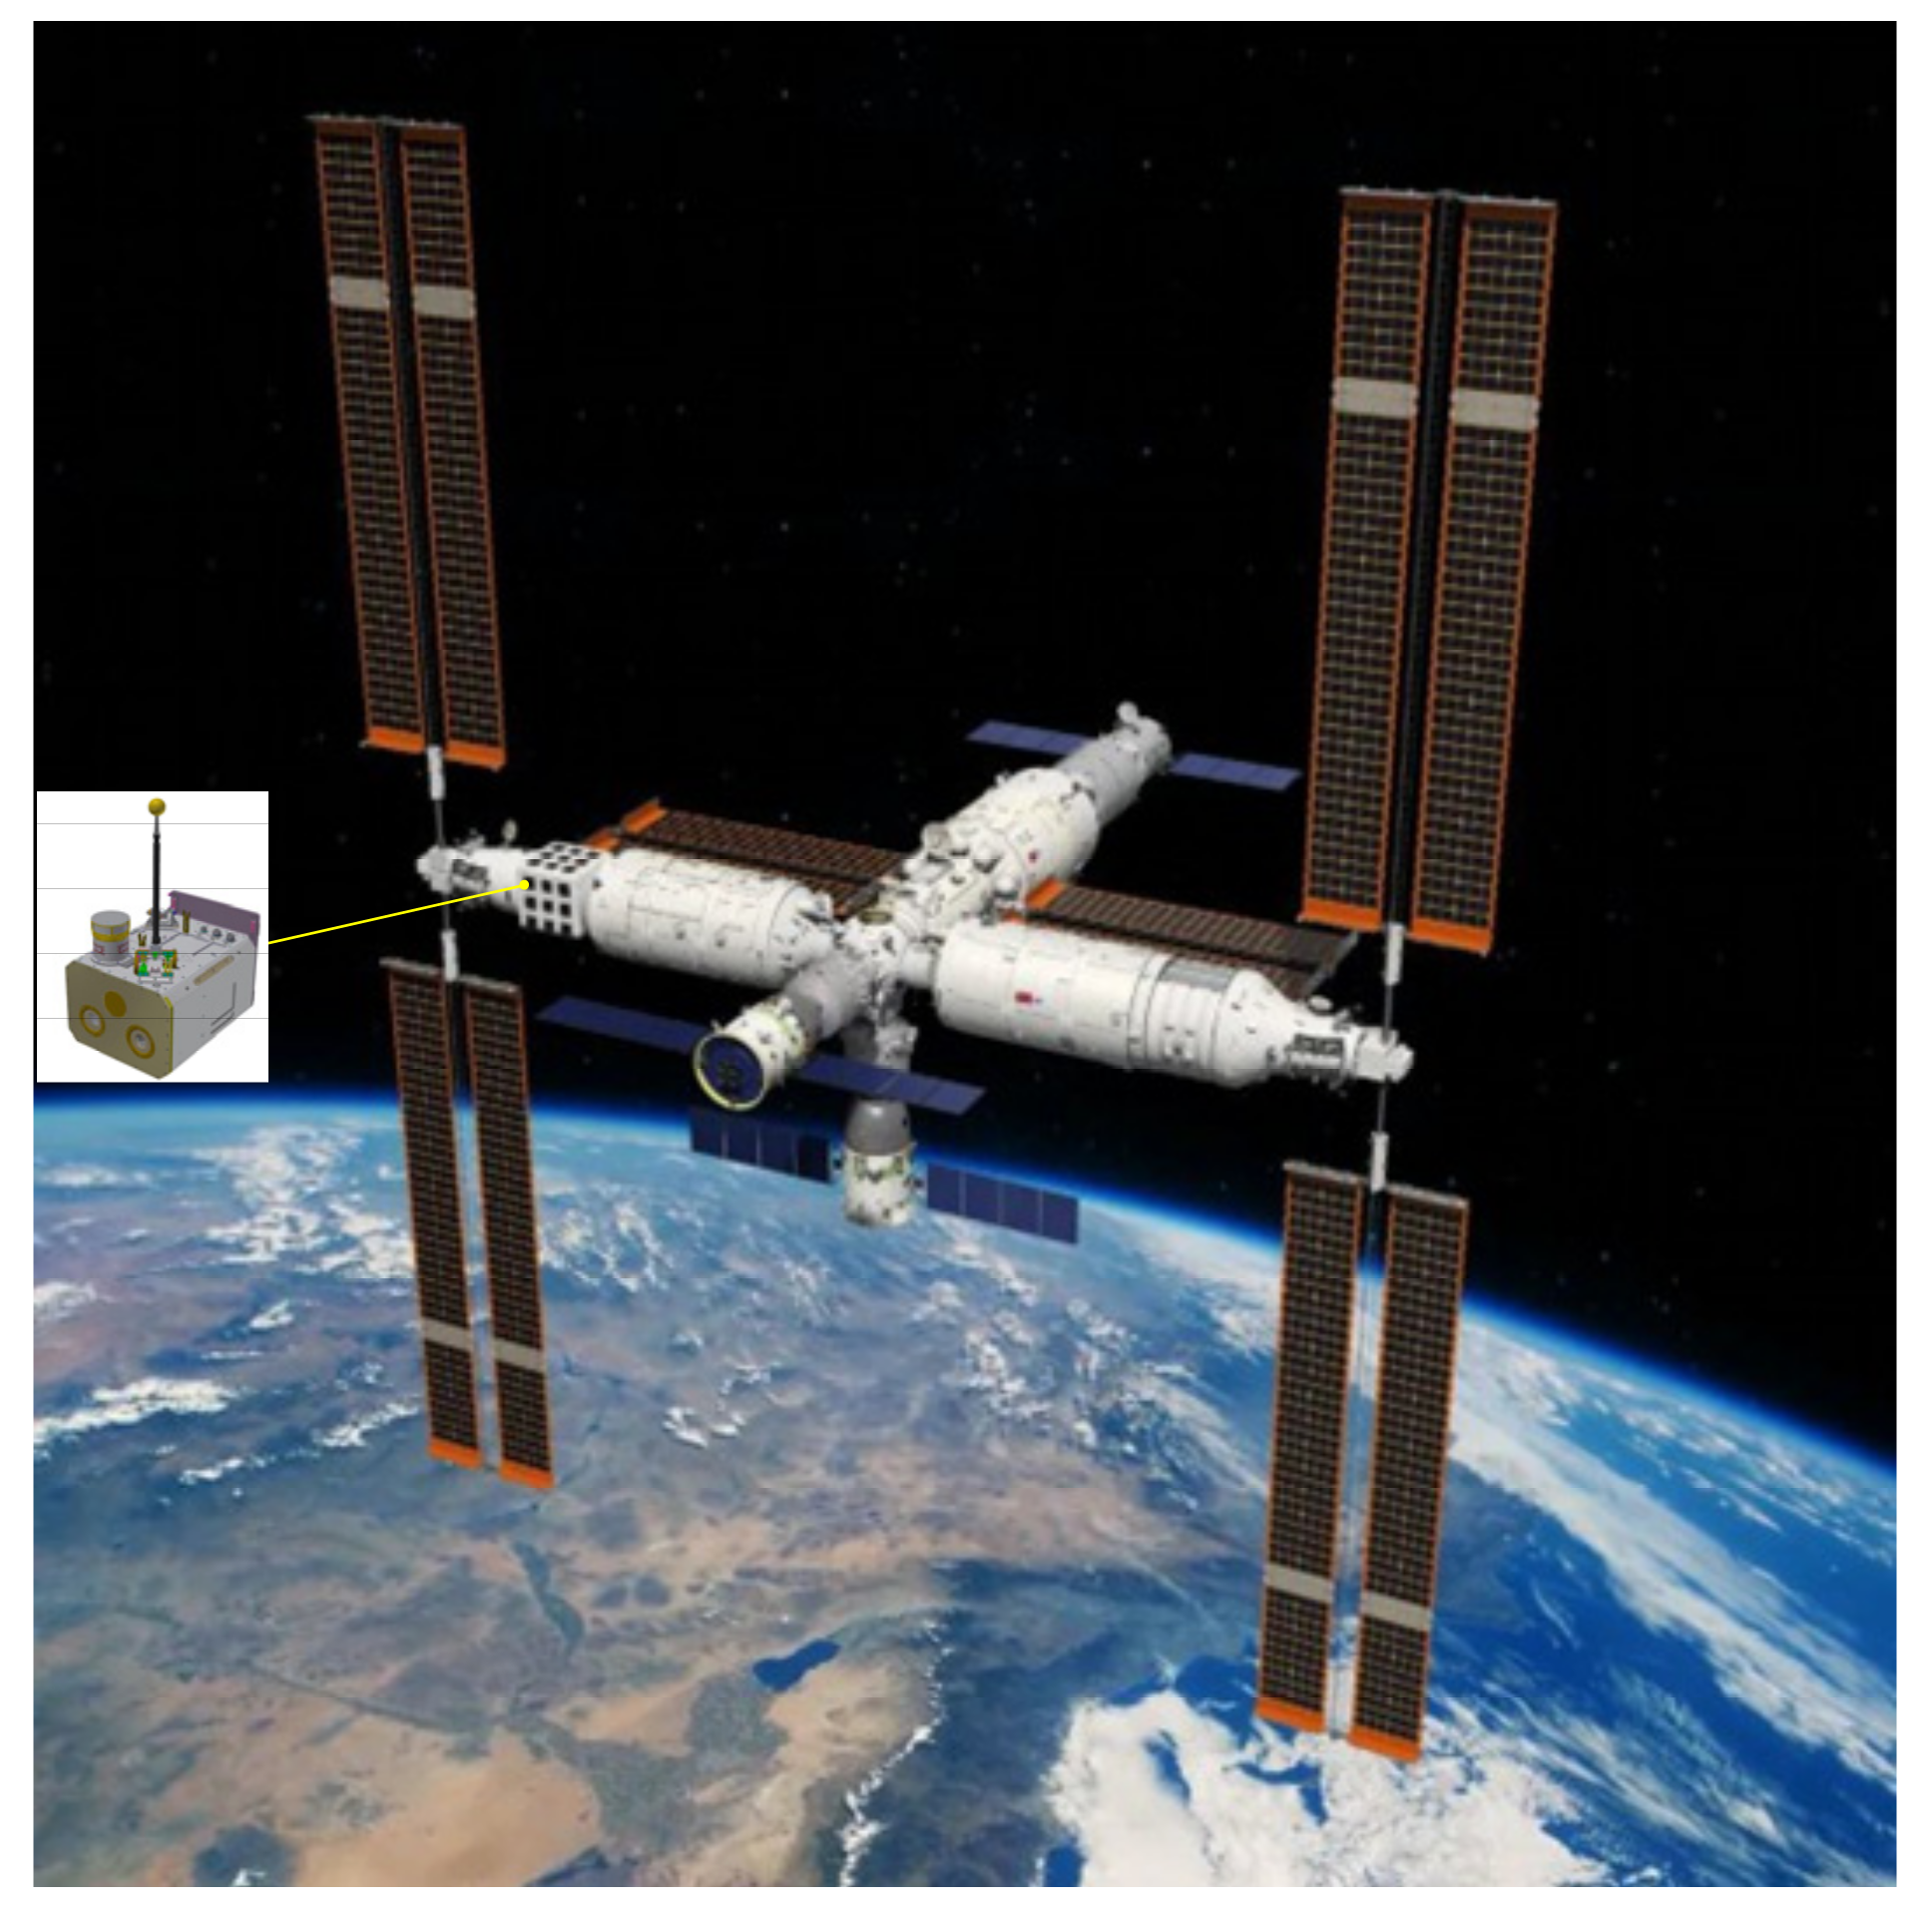
3. Installation Design
The plasma experiments package is installed on the outside platform of the wentian module, with the horizontal axis direction parallel to the forward flight direction of the space station, as shown in Figure 6. Figure 6 is the in orbit configuration diagram of the Chinese space station, including the core module, wentian module, mengtian module, as well as two manned spacecraft and a cargo spacecraft.
Figure 6.
Installation position on the configuration of the Chinese space station.
RPA and IDM are installed at the front of the experiments package, with the horizontal axis direction also parallel to the forward flight direction of the space station. The front panel of the experimental device is an equipotential plate, providing a uniformly distributed electric field.
In order to reduce the influence of the cabin body on plasma detection, the sensor of LP needs to extend beyond the sheath of the cabin. The length of the extension boom is greater than 500 mm, which is sufficient to avoid the influence of the space station sheath [27]. The probe sensor is mounted on the top of the deployable boom, which is in the stowed position during the launch phase. After the launch, the boom has been successfully deployed, and locked in the vertical position, as shown in Figure 7.
Figure 7.
Overview of the installation on wentian module.
4. Preliminary Science Results
4.1. Data Processing
To illustrate the LP data processing, an analysis of an I–V curve for probe is featured. Figure 8 shows the result. Part (a) of the figure shows the linear I–V curve. Second derivation is performed on the raw data, the preliminary results of plasma potential ( in the figure) and floating potential ( in the figure) were obtained. Part (b) of the figure shows the semilog I–V curve. The electron density (), temperature (), floating potential () and plasma potential () were obtained by fitting the semilog I–V curve. In each figure, the bias voltage is swept from −5 V to +5 V, divided into 250 equal voltage steps, with each sweep voltage corresponding to a collected current value.
Figure 8.
LP analysis for 12 March 2023, 21:12:46, (a) the I–V curve in a linear coordinate system; (b) the I–V curve in a Logarithmic coordinate system.
Figure 9 shows the data processing of RPA. The bias voltage is swept 0 V to +19.6 V, divided into 125 equal voltage steps, with each sweep voltage corresponding to a collected current value. The H+ density (), He+ density (), O+ density (), and ion temperature () were obtained by fitting the measured I–V characteristic curve. The ion drift horizontal velocity () was also obtained, which is the result after removing the orbital speed. The orbital speed is 7680 m/s, which is calculated from the space station orbit parameters.
Figure 9.
RPA analysis for 12 March 2023, 19:21:07.
The data processing of drift velocity is to calculate the ratio of IAC/IBD and IAB/ICD to obtain the projection angle of the ram velocity and . Then, the ram velocity is set as the space station flight velocity, which can be obtained from real-time orbit parameters of the space station. and are obtained by calculating the ram velocity and projection angle. Figure 10 shows the ratio of IAC/IBD and IAB/ICD. The value of is −95.88 m/s and the value of is 65.99 m/s by calculating the data presented in Figure 10. The value of is 13.23 m/s, which be calculated from RPA data at the same time. The error of the measurement data is less than 10%, for which the calibration test has been done before launch.
Figure 10.
IDM analysis for 12 March 2023, 19:15:17.
4.2. Preliminary Results
Figure 11 gives an example of combining level results. Panel (a) represents the plasma potential (), panel (b) and panel (c) respectively represents the electron density () and electron temperature (). Panel (d) represents the ion density including H+ density (), He+ density (), O+ density (). Panel (e) represents ion temperature (), and panel (f) represents the three components of ion drift velocity which are , and in the coordinate system of the instrument installation position. The derived electron density and ion density are comparable as expected, within the measurement accuracy. The color area shows a bimodal structure on both sides of the geomagnetic equator.
Figure 11.
All parameters recorded by the plasma in situ detector on 12 April 2023, (a) the result of ; from LP; (b) the result of from LP; (c) the result of from LP; (d) the result of from RPA, including , and ; (e) the result of from RPA; (f) the result of from RPA, including , and .
The data detected from March to April 2023 were statistically processed to obtain the global view of the plasma environment variation along the Chinese space station’s orbit. The processing method is to accumulate data of the same latitude and longitude, then average it. Figure 12 and Figure 13 represent the global distribution of electron density and O+ ion density, respectively. The time range of the data in two figures is from 1 March to 29 April 2023, and does not include the two intensive magnetic storms on March 2023 and April 2023. The two figures observe obvious EIA structures which illustrate the measurement capabilities of plasma in situ detector.
Figure 12.
The global view of along the Chinese space station’s orbit (data from 1 March to 29 April 2023, not including two intensive magnetic storms in March 2023 and April 2023).
Figure 13.
The global view of along the Chinese space station’s orbit (data from 1 March to 29 April 2023, not including two intensive magnetic storms in March 2023 and April 2023.).
Using the same statistical averaging method, the data from 21–29 March 2023 were analyzed. As shown in Figure 14, during the magnetic storm, electron density and O+ ion density both increased significantly.
Figure 14.
Analysis for magnetic storm on 21–29 March 2023, (a) The view of ; (b) The view of .
5. Conclusions
The plasma in situ instrument has been described in detail and has operated normally since launch. The main plasma parameters can be reliably obtained from the LP, RPA and IDM with a time resolution of 1 s. The preliminary results of ionospheric phenomena observed in orbit have been shown to illustrate the instrument’s capability. The plasma in situ instrument will operate in the space station for ten years, and the amassed data will be acquired over the lifetime of the mission that will allow for addressing the scientific objectives through statistical studies.
The results of space station cabin charging potential and the ion imager are also being processed. Work is in progress to derive the complete data which will be published on the website of the Space Science and Application Data Service Platform for China Manned Space Engineering.
Author Contributions
Conceptualization, X.Z. (Xianguo Zhang) and A.Z.; methodology, C.L.; validation, Y.G., W.W. and X.Z. (Xiangzhi Zheng); data curation, B.L.; writing—original draft preparation, C.L. and B.L.; writing—review and editing, C.L; project administration, Y.S. All authors have read and agreed to the published version of the manuscript.
Funding
This research was supported by the National Science and Technology Major Project of the Ministry of Science and Technology of China, the national science and technology major project: space station space environment element detection system-plasma in situ and imaging detector (Grant No. Y79002AH40).
Institutional Review Board Statement
Not applicable.
Informed Consent Statement
Not applicable.
Data Availability Statement
The data presented in this study are available in the Space Science and Application Data Service Platform for China Manned Space Engineering at http://www.msadc.cn/main/product (accessed on 1 December 2023).
Conflicts of Interest
The authors declare no conflict of interest.
References
- Balan, N.; Liu, L.B.; Le, H.J. A brief review of equatorial ionization anomaly and ionospheric irregularities. Earth Planet. Phys. 2018, 2, 257–275. [Google Scholar] [CrossRef]
- Abdu, M.A. Equatorial ionosphere–thermosphere system: Electrodynamics and irregularities. Adv. Space Res. 2005, 35, 771–787. [Google Scholar] [CrossRef]
- Appleton, E.V. Two anomalies in the ionosphere. Nature 1946, 157, 691. [Google Scholar] [CrossRef]
- Liang, P.H. F2 ionization and geomagnetic latitudes. Nature 1947, 160, 642–643. [Google Scholar] [CrossRef]
- Hanson, W.B.; Moffett, R.J. Ionization transport effects in the equatorial F region. J. Geophys. Res. 1966, 71, 5559–5572. [Google Scholar] [CrossRef]
- Chen, Y.D.; Liu, L.B.; Le, H.J.; Wan, W.X.; Zhang, H. Equatorial ionization anomaly in the low-latitude topside ionosphere: Local time evolution and longitudinal difference. J. Geophys. Res. 2016, 121, 7166–7182. [Google Scholar] [CrossRef]
- Fejer, B.G.; de Paula, E.R.; González, S.A.; Woodman, R.F. Average vertical and zonal F region plasma drifts over Jicamarca. J. Geophys. Res. 1991, 96, 13901–13906. [Google Scholar] [CrossRef]
- Fejer, B.G.; Jensen, J.W.; Su, S.-Y. Quiet time equatorial F region vertical plasma drift model derived from ROCSAT-1 observations. J. Geophys. Res. 2008, 113, A05304. [Google Scholar] [CrossRef]
- Sidorova, L.N.; Filippov, S.V. Plasma bubbles in the topside ionosphere: Estimations of the survival possibility. J. Atmos. Terr. Phys. 2014, 119, 35–41. [Google Scholar] [CrossRef]
- Huang, C.Y.; Burke, W.J.; Machuzak, J.S.; Gentile, L.C.; Sultan, P.J. DMSP observations of equatorial plasma bubbles in the topside ionosphere near solar maximum. J. Geophys. Res. Space Phys. 2001, 106, 8101–8491. [Google Scholar] [CrossRef]
- Burke, W.J.; Donatelli, D.E.; Sagalyn, R.C.; Kelley, M.C. Low density regions observed at high altitudes and their connection with equatorial spread F Planet. Space Sci. 1979, 27, 593–601. [Google Scholar] [CrossRef]
- Smith, J.; Heelis, R.A. Equatorial plasma bubbles: Variations of occurrence and spatial scale in local time, longitude, season, and solar activity. J. Geophys. Res. Space Phys. 2017, 122, 4875–5834. [Google Scholar] [CrossRef]
- Booker, H.G. Turbulence in the ionosphere with applications to meteor-trails, radio-star scintillation, auroral radar echoes, and other phenomena. J. Gephys. Res. 1956, 61, 673–705. [Google Scholar] [CrossRef]
- Kintner, P.M.; Ledvina, B.M.; De Paula, E.R. GPS and ionospheric scintillations. Space Weather 2007, 5, S09003. [Google Scholar] [CrossRef]
- Alison, O.M.; Paula, E.R.; Waldecir, J.P.; da Silveira Rodrigues, F. On the distribution of GPS signal amplitudes during low-latitude ionospheric scintillation. GPS Solut. 2013, 17, 499–510. [Google Scholar]
- Abdu, M.A. Outstanding problems in the equatorial ionosphere–thermosphere electrodynamics relevant to spread F. J. Atmos. Terr. Phys. 2001, 63, 869–884. [Google Scholar] [CrossRef]
- Timoçin, E.; Inyurt, S.; Temuçin, H.; Ansari, K.; Jamjareegulgarn, P. Investigation of equatorial plasma bubble irregularities under different geomagnetic conditions during the equinoxes and the occurrence of plasma bubble suppression. Acta Astronaut. 2020, 177, 341–350. [Google Scholar] [CrossRef]
- Mott-Smith, H.M.; Langmuir, I. The theory of collectors in gaseous discharges. Phys. Rev. 1926, 28, 727–763. [Google Scholar] [CrossRef]
- Lebreton, J.-P.; Stverak, S.; Travnicek, P.; Maksimovic, M.; Klinge, D.; Merikallio, S.; Lagoutte, D.; Poirier, B.; Blelly, P.-L.; Kozacek, Z.; et al. The ISL Langmuir probe experiment processing onboard DEMETER: Scientific objectives, description and first results. Planet. Space Sci. 2006, 54, 472–486. [Google Scholar] [CrossRef]
- Guan, Y.; Wang, S.; Liu, C. Design and simulation for the sensor of the space based Langmuir probe. Chin. J. Space Sci. 2012, 32, 750–756. [Google Scholar] [CrossRef]
- Gurnett, D.A.; Kurth, W.S.; Kirchner, D.L.; Hospodarsky, G.B.; Averkamp, T.F.; Zarka, P.; Lecacheux, A.; Manning, R.; Roux, A.; Canu, P.; et al. The Cassini radio and plasma wave investigation. Space Sci. Rev. 2004, 114, 395–463. [Google Scholar] [CrossRef]
- Wahlstrom, M.K.; Johansson, E.; Veszelei, E.; Bennich, P.; Olsson, M.; Hogmark, S. Improved Langmuir probe surface coatings for the Cassini satellite. Thin Solid Film. 1992, 220, 315–320. [Google Scholar] [CrossRef]
- Heelis, R.A.; Hanson, W.B. Measurements of thermal ion drift velocity and temperature using planar sensors. In Measurement Techniques in Space Plasmas: Particles; Pfaff, R.F., Borovsky, J., Young, D.T., Eds.; American Geophysical Union: Washington, DC, USA, 1998; Volume 102, pp. 61–71. [Google Scholar]
- Marrese, C.M.; Majumdar, N.; Haas, J.M.; Williams, G.; Ring, L.B.; Gallimore, A.D. Development of a Single-orifice Retarding Potential Analyzer for Hall Thruster Plume Characterization. In Proceedings of the 25th International Electric Propulsion Conference, Cleveland, OH, USA, 24–28 August 1997; Volume 24, pp. 397–404. [Google Scholar]
- Berthelier, J.J.; Godefroy, M.; Leblanc, F.; Seran, E.; Peschard, D.; Gilbert, P.; Artru, J. IAP, the thermal plasma analyzer on DEMETER. Planet. Space Sci. 2006, 54, 487–501. [Google Scholar] [CrossRef]
- Zheng, X.Z.; Zhang, A.B.; Guan, Y.B.; Liu, C.; Sun, Y.Q.; Wang, W.J.; Tian, Z.; Kong, L.G.; Ding, J.J. Ion drift meter aboard China seismo-electromagnetic satellite. Acta Phys. Sin. 2017, 66, 295–303. [Google Scholar]
- Liu, C.; Zhang, A.B.; Sun, Y.Q.; Kong, L.G.; Wang, W.J.; Guan, Y.B.; Wang, Y.S.; Zheng, X.Z.; Tian, Z.; Gao, J. Plasma in-situ imaging detection technology on China’s Space Station Wentian module. Acta Phys. Sin. 2023, 72, 049401. [Google Scholar] [CrossRef]
Disclaimer/Publisher’s Note: The statements, opinions and data contained in all publications are solely those of the individual author(s) and contributor(s) and not of MDPI and/or the editor(s). MDPI and/or the editor(s) disclaim responsibility for any injury to people or property resulting from any ideas, methods, instructions or products referred to in the content. |
© 2023 by the authors. Licensee MDPI, Basel, Switzerland. This article is an open access article distributed under the terms and conditions of the Creative Commons Attribution (CC BY) license (https://creativecommons.org/licenses/by/4.0/).