Abstract
The ubiquity of soil water erosion in the Yarlung Tsangpo River Basin leads to a series of natural hazards, including landslides, debris flows and floods. In this study, the Revised Universal Soil Loss Equation model (RUSLE) was used to quantify potential soil water erosion, while the Height Above Nearest Drainage model (HAND) was used to delimit potential flood hazard zones. Remote sensing and geographic information system technologies were employed to spatialize the results, which showed that the annual soil loss from water erosion was less than 1239 t ha−1 y−1. The total soil loss was estimated to be over 108 × 106 tons, of which about 13 × 106 tons (12.04% of the total) occurred from the agricultural land in the downstream valley. Soil erosion mapping was performed using six levels of soil erosion intensity and the effects of precipitation, land use/land cover and topography on soil erosion were revealed. Increases in precipitation and slope gradient significantly increased the soil loss rate, while the maximum rate of soil loss occurred from densely vegetated land, reaching 9.41 t ha−1 y−1, which was inconsistent with erosion preconceptions for this land type. This may be due to a combination of the region’s unique climate of high intensity rainfall and steep slopes. Flood hazard mapping showed that all regional cities were located in a flood hazard zone and that, within the total basin area (~258 × 105 ha), 9.84% (2,537,622 ha) was in a high flood occurrence area, with an additional 1.04% in aa vulnerable to moderate flood hazard area. Approximately 1.54% of the area was in a low flood risk area and 4.15% was in a very low flood risk area. The results of this study provide an initial identification of high-risk soil water erosion and flood hazard locations in the basin and provide a foundation upon which decision-makers can develop water and soil conservation and flood prevention policies.
1. Introduction
Soil erosion is an important environmental issue related to global ecology, environment, economy and security. Soil erosion reduces soil productivity and water quality, threatens food security and the future development of agriculture, increases sediment accumulation and leads to the possibility of floods [1]. Severe soil erosion eventually leads to frequent natural disasters such as siltation in rivers, lakes, weirs, ponds, floods, landslides and debris flows [2,3]. The accumulation of sediments caused by soil erosion is an important factor causing flood disasters. Since the 21st century, about 74% of natural disasters were related to water disasters [4] and the frequency of global floods has increased significantly, for example India is a region prone to chronic floods [5]. Ethiopia, one of the countries with the highest erosion risk in the world and is also prone to flooding. Developing countries, with more fragile soils and often very sensitive to climate change, often face more serious human and financial consequences and post-disaster reconstruction problems brought about by floods and related land disasters. Therefore, the control of soil erosion and avoidance of geological disasters caused by soil erosion is the focus of current research.
Against the background of global encouragement of preventing soil erosion and protecting the soil environment, the Yarlung Tsangpo River Basin (YTRB) [6], as a soil environment sensitive area and an area with strong physical freeze–thaw erosion, is located in the southern part of the Qinghai-Tibet Plateau, with high altitude and complex terrain. Its unique geographical features such as loose soil, high precipitation intensity and obvious climate change lead to various forms of soil erosion that are prone to occur widely [3]. Among them, the main type of soil erosion is freeze–thaw erosion, although water erosion cannot be ignored [7]. Therefore, quantitative evaluation of soil erosion in the Yarlung Zangbo River Basin, identification and analysis of soil erosion sensitive areas and their spatial and temporal patterns will bring important scientific guidance to the protection of soil environment and the reduction of natural disasters.
At present, soil erosion research methods have been widely investigated, mainly in the form of control simulation experiments, field fixed-point observations, remote sensing image analysis, soil erosion model simulation and sediment element tracer methods [2,8]. At present, many scholars are conducting research on different spatial and temporal scales based on different soil erosion models. The widely used models include the Revised Universal Soil Loss Equation (RUSLE), the US Universal Soil Loss Model (USLE), the Chinese Soil Loss Model (CSLE), Soil and Water Assessment Tool (SWAT), etc. [9]. Compared with the methods that rely on long-term soil survey data and parameters that are difficult to collect and calculate, the RUSLE model has more obvious advantages in data operability, high precision and a wide application range [10]. Combining remote sensing (RS) and geographic information system (GIS) technologies, the RUSLE model is widely used in complex areas of various terrain types and in the study of spatial pattern characteristics of soil erosion at different scales [11,12]. However, the application of the model has obvious regional characteristics, so it is necessary to comprehensively consider the regional characteristics and select a reasonable calculation method for the parameter localization calculation.
The Relative Altitude to Nearest Neighbor Channel (HAND) model is a quantitative terrain model based on the Shuttle Radar Terrain Mission-Digital Elevation Model (SRTM-DEM) [13]. The local relative terrain with reference to the river network water system is defined mathematically as the elevation difference between any position on the surface and the point where it enters the river network from the hillside along the flow of water and describes the relative height of any position on the surface compared to the local water system [14,15]. Compared with the classic DEM method, HAND can provide supplementary local terrain information. The flood mapping method based on HAND is feasible and reasonable; it can highlight local terrain features and reflect the water flow path of the hillside-valley, which is more conducive to establishing the relationship between local topography and hydrological response [15]. Many scholars have carried out research based on the HAND model. Zheng et al. developed a synthetic rating curve based on flow and water level [16] and Chow et al. created an exclusion mask that can improve the accuracy of flood mapping [17]. Liu et al. and Speckhann et al. demonstrated the applicability of the HAND model for flood mapping over large areas [18,19]. Therefore, this paper will use the DEM-based HAND model to draw flood hazard maps. However, it cannot dynamically show the inundation changes in the process of flood evolution and the influence of river network density on the accuracy of flood mapping cannot be ignored.
Soil erosion is caused by multiple factors, including rainfall intensity, soil characteristics, topography, runoff, land use type, vegetation coverage and human activities [20,21]. Although precipitation and topography are the dominant factors of soil erosion, human activities such as rapid population growth, deforestation, land plowing and overgrazing have also been reported to accelerate soil erosion globally [22]. In terms of factors affecting soil erosion, scholars have carried out much research mainly from two aspects: natural factors and human factors [23,24,25]. Studies have shown that climate change and human activities have a dual impact on soil erosion, which will lead to significant changes in land use/cover, causing drastic fluctuations in the soil erosion modulus [8].
Based on the research scale/region aspect of the RUSLE model, its feasibility has been effectively verified in different regions and research areas at multiple scales around the world. Global research involves areas such as Rondonia in Brazil, Ethiopia and so on [26]. However, scholars in China often conduct research on the influencing factors of soil erosion spatio-temporal differentiation feature sets, involving various spatial scales. These include Chengde City, Taihang Mountains, Dianchi Lake Basin, Maotiao River Basin, typical small watersheds in the middle reaches of the Yellow River, small watersheds in sugarcane fields, etc. [2,4,6,8,9,27,28,29,30,31,32,33,34,35,36]. The research on soil erosion in the source area of the Yarlung Tsangpo River based on the RUSLE model usually focuses on a small watershed, such as the Maquan River Basin [37,38,39] and the assessment of sudden soil erosion for the entire source area has not yet been carried out. Studies have shown that freeze–thaw erosion is the main form of soil erosion in this watershed. Overgrazing is common in the upper and middle reaches of the watershed and the middle and lower reaches are the main planting areas. Long-term grazing and farming activities will accelerate soil erosion. Furthermore, estimating the scale and distribution of soil erosion and flood hazards at different spatio-temporal scales should be undertaken to focus on environmental management and flood control in larger river basins [40,41].
Although research on soil erosion has received considerable attention, the exploration of the relationship between soil erosion and flood disasters has been neglected. In view of this, based on the RUSLE and HAND models, this paper uses RS and GIS spatial information analysis techniques to quantitatively analyze the spatial distribution patterns of soil erosion and potential flood disasters in the YTRB, aiming to provide planners and decision makers with the data to implement soil and water conservation and flood control policies. Another aim is to provide reliable information in order to assist the area’s soil and water conservation projects, disaster prevention tasks and ecological restoration.
2. Study Area
The YTRB is located in Tibet, SW China, between 27°49 and 31°16 N and 81°57 and 7°6 E (Figure 1). The basin lies at the northern foot of the Himalayas, with an average altitude of 4500 m and an area of ~ 25.8 × 10⁶ ha. The Yarlung Tsangpo (YT) river originates in the Angsi Glacier in the SW of the Tibetan Plateau; it has an annual flow of 1.359 × 10¹¹ m3 and flows for 2057 km into Assam, India [42].
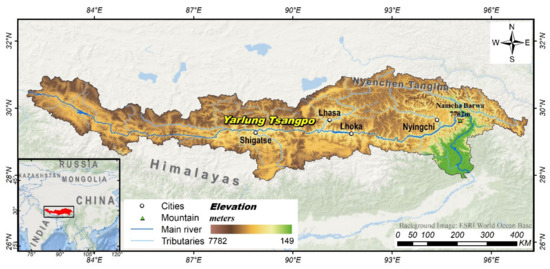
Figure 1.
Yarlung Tsangpo river basin location, including major cities, mountains and rivers.
The plateau valley in the upper reaches has the typical semiarid climate of a plateau cold temperate zone, with an annual average precipitation of 300 mm. The floodplain in the middle is approximately 1200 × 300 km in extent and there are numerous tributaries here—including the Lhasa, Parlung Tsangpo, Nyang, Nyang Qu and Dkzhung Tsangpo as the main five—which provide water for crop cultivation. The middle reaches, including 153,300 ha of agricultural land, with an annual precipitation of 300–600 mm, enjoy a plateau temperate climate and constitute the most developed agricultural region in Tibet. The downstream YT Grand Canyon is the deepest valley in the world, where the river flows around the Namcha Barwa peak and arrives at Pasighat (India) through a large, horseshoe bend. In this region, large altitudinal variations provide adequate hydraulic resources. The YTRB reaches its lowest temperatures in January and its highest in June and July, with annual average temperatures ranging from 4.3–8.3 ℃. Precipitation in the basin gradually increases from the NW to the SE, reaching 600–800 mm y−1 in the lower reaches [43].
3. Materials and Methods
3.1. Data Sources
Weather stations are sparsely distributed in the YTRB and in their absence, widely used interpolation methods could obscure regional-level precipitation characteristics. For this reason, Chinese monthly precipitation data for the period 1901–2017, at a spatial resolution of 1 km and using 0.1 mm precipitation units were used in this study. These data were provided by the National Tibetan Plateau Data Center (http://www.data.tpdc.ac.cn (accessed on 8 March 2022)), based on the global 0.5° climate dataset published by CRU and the global high-resolution climate dataset published by WorldClim and obtained by the Delta spatial downscaling scheme [44,45,46,47,48]. Soil map information (at a 1 km spatial resolution) was extracted from the China Soil Map, which originated from data held in the Harmonized World Soil Database (HWSD) (version 1.1) [49,50]. Imagery of 30 × 30 m from Landsat 8 OLI was downloaded from the USGS (http://www.earthexplorer.usgs.gov (accessed on 13 March 2022)) to generate land use/land cover (LULC) study area mapping and 90 × 90 m SRTM3 DEM datasets from the USGS were also applied. The Chinese Vegetation Dataset and the YTRB outer cadaster were both downloaded from the Data Center for Resources and Environmental Sciences (RESDC) of the Chinese Academy of Sciences (http://www.resdc.cn (accessed on 15 March 2022)).
3.2. Revised Universal Soil Loss Equation
Soil water erosion was estimated using the RUSLE model. RS technology was used for LULC classification and GIS technology was employed to compute various factors (Figure 2).
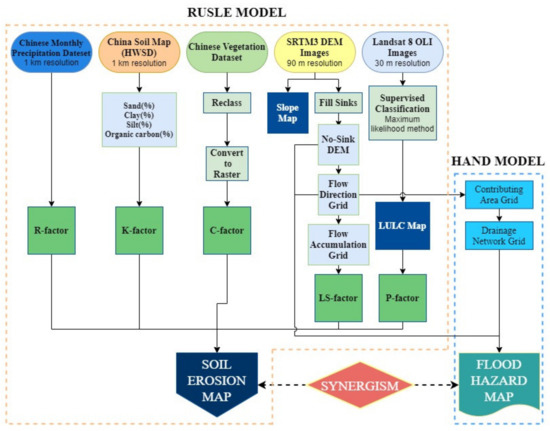
Figure 2.
RUSLE model methodology flow chart, as used in this study.
The RUSLE model is empirically expressed as shown in Equation (1):
where indicates the average annual soil erosion per unit area (t ha−1 y−1); represents the rainfall erosivity factor (MJ mm ha−1 h−1 y−1); denotes the soil erodibility factor (t ha h MJ−1 ha−1 mm−1); stands for the combination of slope length and slope steepness (dimensionless); represents the cover management factor (dimensionless); and indicates the support practice factor (dimensionless).
3.2.1. Precipitation Erosivity (R) Factor
Precipitation is the direct driver of soil erosion because splashing raindrops separate soil particles and runoff from rainfall can further wash away and carry soil, causing soil erosion [11]. Thus, the precipitation erosion force factor reflects the ability of raindrops to separate and transport soil particles. Primarily, the R factor consists of the multiplication of total rainfall kinetic energy and maximum rainfall intensity for 30 consecutive minutes. Since intensity data were not available for the YTRB, a regression equation based on monthly precipitation data was applied [51], as shown in Equation (2):
where indicates the precipitation erosivity factor (MJ mm ha−1 h−1 y−1); represents monthly precipitation (mm month−1); and shows annual precipitation (mm y−1). R-factor mapping was generated with the ArcGIS (version 10.2, ESRI, Redlands, CA, USA) software raster calculator, using Equation (2).
3.2.2. Soil Erodibility (K) Factor
Soil erodibility is a measure of the inherent sensitivity of a standard plot to precipitation erosivity. The K factor demonstrates the inherent resistance of soil particles to the separation and transport capacity of precipitation and runoff [11]. In this study, K-factor estimation was carried out using the Erosion Productivity Impact Calculator (EPIC) empirical model, as developed by Williams [52] and represented by Equation (3):
where indicates the soil erodibility factor (t ha h MJ−1 ha−1 mm−1); SAN represents the percentage of sand (0.1–2 mm diameter) (%); CLA represents the percentage of clay (0.002–0.1 mm diameter) (%); SIL denotes the percentage of silt (diameter < 0.002 mm) (%); C shows the percentage of organic carbon (%); and SN1 = 1 − SAN/100. The soil types and respective characteristic values in the YTRB were acquired from the China Soil Map, while K-factor mapping was generated according to Equation (3), in the spatial raster layer (Figure 3).
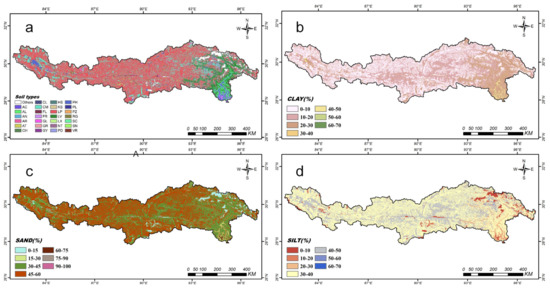
Figure 3.
Yarlung Tsangpo soil data. (a) soil types; (b) percentage of clay; (c) percentage of sand; (d) percentage of silt.
3.2.3. Slope Length and Slope Steepness (LS) Factor
The LS factor consists of the ratio of soil loss per unit area of a field slope to that of the RUSLE standard slope, with a slope length of 22.13 m and a slope steepness of 9°, under the same conditions [11]. The effect of topography on soil erosion is mainly reflected in the movement and flow of sediment and water, as driven by gravity. The LS factor is made up of the slope length (L) and slope steepness (S) factors. Slope length refers to the distance from the initiation point of overland flow to the designated receiving channel along the flow route, while slope steepness is the ratio of the vertical height of the slope surface to the horizontal distance. Therefore, Equations (4) and (5) were used to calculate the LS factor [53,54]:
where indicates the slope length and steepness factor; represents slope length (m); shows the grid slope in percentage; and denotes the slope (°). According to the above paragraph, is taken as 0.5. SRTM-DEM imagery, with a 90 m spatial resolution, was used to identify filled sinks, which allowed flow direction and accumulation grids to be deduced. LS-factor mapping was computed using ArcGIS 10.2 software.
3.2.4. Cover Management Factor
The cover management factor is the ratio of soil loss from a specific land area to that from continuous fallow land under certain environmental conditions [42]. The C factor, which indicates the influence of surface vegetation, land use and agricultural activities on soil erosion, is an important factor in soil erosion assessment and can be estimated using several methods. In this study, the authors determined C-factor values for different vegetation types in the Chinese vegetation dataset (Figure 4), which, when combined with previous research results (Table 1), facilitated C-factor map development.
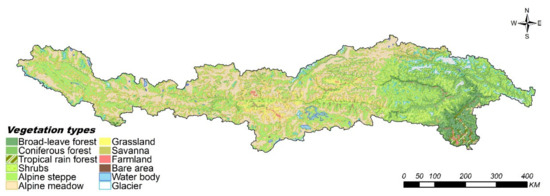
Figure 4.
Yarlung Tsangpo river basin vegetation types.

Table 1.
Yarlung Tsangpo river basin vegetation types and their C values.
3.2.5. Support Practice Factor
The support practice factor is the ratio of soil loss to soil erosion on upslopes and downslopes under the influence of specific support measures [11]. Large-scale P-factor mapping was performed using the method provided by the USDA handbook for LULC types, as classified using satellite images (Table 2) [57]. LULC mapping was generated using supervised classification of Landsat 8 OLI imagery and applying maximum likelihood settings in ENVI (version 5.1, Exelis Visual Information Solutions Inc., Boulder, CO, USA) software (Figure 5). For the classification accuracy of LULC data, a 2m GF image was used to evenly select 30 points for each of the ten land use types for verification and the results showed that the accuracy rate was about 88%.
Table 2.
Yarlung Tsangpo river basin land use types and their P values.
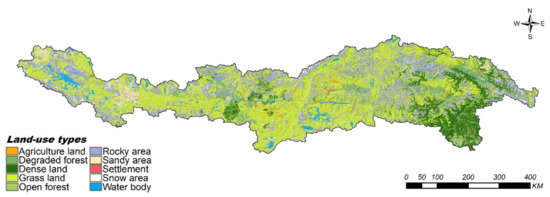
Figure 5.
Yarlung Tsangpo river basin land use/land-cover map.
3.3. Using the Height above Nearest Drainage Model
The elevation from each raster cell above the nearest catchment unit can be described using the HAND model [13], which can separate flood-prone areas from areas with lower flood occurrence probability [17]. Topography is an influencing factor on hydrology, which determines the water flow direction and rate; thus, in order to establish a drainage network, it is necessary to maintain flow direction topological continuity.
The actual topography represented in SRTM data approximates the upper canopy [58] so that, for areas covered by dense or tall vegetation, a variable degree of relief masking occurs in SRTM data, producing depressions and pits. This causes inconsistencies between local drainage directions calculated using topography data (LDD) and actual flow paths. For this reason, in order to calculate a corrected LDD for this study, the original SRTM-DEM data were filled by raising the heights of pits to those of their pour points, in a procedure performed using ArcGIS 10.2. The contribution area grid was then determined using the D8 method proposed by Mark [59]. Then, since normalized terrain heights had been calculated using drainage network pixel elevations, the drainage network needed to be correctly defined by the contribution area threshold [19]. The HAND model, which was integrated into TerraHidro software, was applied by inputting the no-sinks DEM, the D8 flow grid and the drainage network grid (Figure 2), which allowed the HAND model nearest drainage mapping to be generated.
4. Results
4.1. Soil Loss Assessment Using the RUSLE Model
The method of combining GIS with the RUSLE model was used to determine the amount and spatial distribution of soil loss in the study area, including the following five erosion risk factors: rainfall erosivity, soil erosivity, slope length and steepness, soil cover management and soil conservation.
High-intensity precipitation is more likely to cause severe soil erosion and flood hazards. The R factors estimated for this study ranged from 38–4857 MJ mm ha−1 h−1 y−1, with an average of 658 MJ mm ha−1 h−1 y−1 (Figure 6a). Actual weather station rainfall data were used to verify the accuracy of the R-factor estimation process. Data from five weather stations were compared with that of the Chinese Monthly Precipitation Dataset (Table 3), with the results showing that the latter were generally lower, with relative errors ranging between −17.88% and 5.03%.
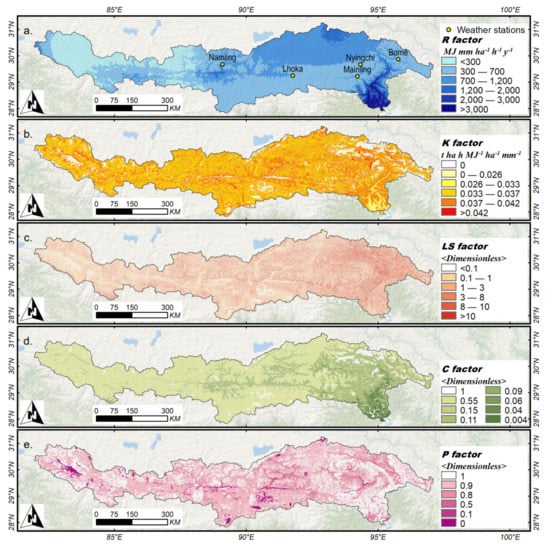
Figure 6.
The RUSLE model factor maps: (a). R factor (precipitation erosivity), including locations of five weather stations used for verification; (b). K factor (soil erodibility); (c). LS factor (slope length and slope steepness); (d). C factor (cover management); (e). P factor (support practices).
Table 3.
Validation of R-factor estimation using the Chinese Monthly Precipitation Dataset.
The relative errors for the R-factor estimates ranged from −19.33% to 9.40%, which was very consistent. The YTRB is very broad and also has elevation differences of > 7000 m (149–7782 m). These unique geographical conditions give rise to very large precipitation differences, with rainfall increasing from upstream to downstream, reaching a maximum of 2357 mm y−1. The 490 mm month−1 peak in the downstream monthly average occurs in June (Figure 7). It was found that the R value was higher in areas with large rainfall and intensity and vice versa. However, a single R value cannot satisfactorily prove the change of rainfall distribution in the study area. Rainfall erosivity is an important factor in assessing soil erosion risk for future land use and climate change.
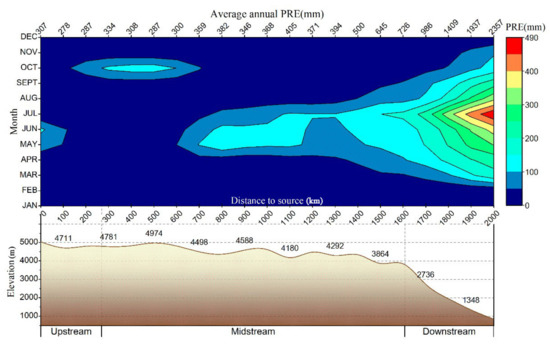
Figure 7.
Spatial distribution of average monthly and annual precipitation. The bottom axis shows the distance to the river source and the top axis shows the average annual precipitation in each distance range. Blue (red) indicates low (high) precipitation. The lower panel indicates topography and elevation along the river.
The K factor shows the resistance of different soil types to runoff erosion and raindrop impact, with higher K values indicating lower resistance to soil erosion and vice versa [60]. According to the percentages of sand, silt, clay and organic carbon in different soils, the K values in the YTRB varied from 0 to 0.049 t ha h MJ−1 ha−1 mm−1. The average K value was 0.034 t ha h MJ−1 ha−1 mm−1 (Figure 6b). Since settlements, glaciers and water bodies were not considered, they were assigned zero values.
The LS factor reveals the influence of topography on surface runoff and soil particle transport and in this study, its values increased gradually from the NW of the YTRB to the SE, with an average of 1.54 (Figure 6c). In several individual mountain areas, the values grew gradually from the valley to the peak, generally reaching > 5 at the ridges. In the Nyenchen Tanglha Mountains, for example, LS-factor values reached 43.78 at Namcha Barwa inside the horseshoe bend in the SE Nyenchen Tanglha, which constituted the largest elevation difference in the lower reaches. In such areas, the steep terrain makes the region vulnerable to soil erosion.
Vegetation coverage and the depth of plant roots affect resistance to soil erosion. Vegetation types in the Chinese vegetation dataset were reclassified to obtain the C factor map; here, higher C factor values indicate a higher susceptibility to soil erosion and vice versa. Most of the YTRB is covered by alpine steppe and alpine meadow (64.84% of the total basin), with C-factor values here being 0.15. In contrast, values of 0.11 were observed in grasslands on hillsides (Figure 6d), while the middle and lower YTRB reaches were mostly covered by shrubs and coniferous forests (21.18% of the total basin), where C values were 0.09. Values of 0.06 were noted for those hillsides where the land coverage was characterized by broad-leaved forests. Tropical rain forests in the valley regions have high soil and water conservation, while agricultural land in the middle and lower reaches exhibited C-factor values of 0.55, showing that they are highly susceptible to soil erosion.
P factor values range from zero to one, where zero indicates effective manmade erosion resistance and one indicates that there is no resistance [12]. P values of 0.9 were observed in grassland and values of 0.5 were noted for riparian areas, where a large portion of the land was characterized as farmland (Figure 6e). Rocky and sandy areas were found to be widely distributed on high altitude mountains and forest coverage in the downstream canyons reached > 79.2%, with P values of 1. P values of 0.1 were observed for settled areas, reflecting their good manmade erosion resistance. Manmade erosion resistance was not considered to be a factor for water bodies, so they were assigned P factor values of zero.
4.2. Soil Erosion in the YTRB
Estimates for the annual YTRB soil erosion ranged from 0–1239 t ha−1 y−1 (Figure 8) and these results are consistent with the soil erosion spatial distribution estimates reported by Yang et al. The soil erosion average was estimated to be 4.21 t ha−1 y−1, which was lower than the 5.43 t ha−1 y−1 estimated by Yang et al.; their higher figure was caused by an overestimation of the R value [61].
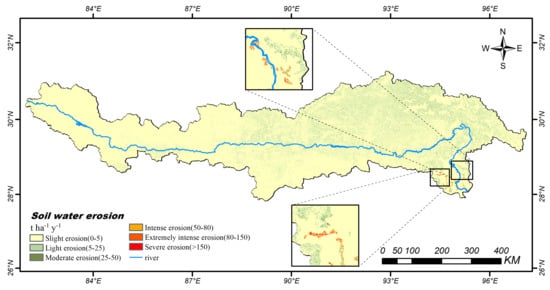
Figure 8.
Yarlung Tsangpo river basin soil erosion; yellow (red) indicates slight (severe) soil erosion.
In order to map soil erosion susceptibility, the YTRB water soil erosion was mapped using six grades: slight (< 5 t ha−1 y−1), light (5–25 t ha−1 y−1), moderate (25–50 t ha−1 y−1), intense (50–80 t ha−1 y−1), extremely intense (80–150 t ha−1 y−1) and severe (> 150 t ha−1 y−1), as shown in Table 4. Erosion susceptibility rated as slight covered most of the study area (20,452,950 ha or 79.46% of the total basin), occurring mainly in the plateau of the upper and middle–upper reaches. Total soil loss in this region was estimated to be 28,272,583 t y−1, accounting for 26.07% of the YTRB basin total. Due to the prevalence of low-intensity precipitation in these regions, it is difficult for soil particles to be transported by surface runoff, making local soil loss here easily sustainable.
Table 4.
Yarlung Tsangpo river basin soil erosion rates and coverage.
Erosion susceptibility rated as light covered 4,543,179 ha and accounted for 46,992,121 tons of soil loss. Much of this erosion susceptibility could be attributed to large terrain fluctuations, which amplify the effect of gravity on sediment. Moderate erosion susceptibility ratings, which occurred mostly on ridges, covered 614,943 ha and the soil loss from these areas was estimated to be 20,107,953 tons (18.54% of the total). This erosion was thought to be due mostly to the presence of Haplic Greyzems and Dystric Podzoluvisols, which are susceptible to soil erosion.
Farmland in the downstream valley had intense, extremely intense and severe water soil erosion susceptibility ratings, ranging from 50 to 1239 t ha−1 y−1. In these regions, 13,056,023 tons (12.04% of the basin total) of soil erosion occurred over a land area of 130,476 ha (0.51% of the total) at a rate much greater than the sustainable soil loss rate. These figures showed that frequent agricultural activities have seriously damaged soil stability here, with surface runoff formed by high-intensity precipitation events upstream taking away large amounts of loose soil, resulting in severe soil loss.
4.3. Effects of Precipitation, LULC and Topography on Soil Erosion
The relationship between precipitation and soil erosion is illustrated in Figure 9a, with the results showing that soil loss rates were positively correlated with precipitation. The soil loss rate varied from 0.71 to 15.69 t ha−1 y−1, with precipitation from < 200 mm to > 2000 mm, which indicated the predominant influence of precipitation on soil erosion. Precipitation in 60.23% of the basin ranged from 200 to 500 mm, especially in the middle-upper reaches, which accounted for 39.83% of the soil loss total. In contrast, regions with precipitation levels between 500 and 1000 mm (28.80% of the study area) were estimated to be responsible for 43.18% of the soil loss total. The lowest soil loss—1.11% of the annual total—was found in the arid plateau regions which experienced an annual average precipitation of <200 mm.
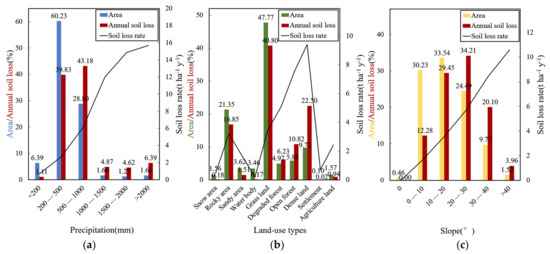
Figure 9.
(a) Soil erosion associated with different precipitation ranges; (b) soil erosion in different land use types; and (c) soil erosion in different slope ranges. Blue, green and yellow columns represent area percentages in various precipitation ranges, land use types and slope ranges, respectively; red columns represent annual soil loss percentages.
Soil erosion rates and the annual soil losses associated with different land use types are mapped in Figure 9b. Open forests and densely vegetated land in the lower reaches had the highest soil erosion rates. The data show that although dense vegetation has a positive effect on soil conservation, the high precipitation downstream of the study area leads to its high erosion (33.32% of the total). The figures also showed that 16.85% of the soil erosion total occurred in rocky areas, which occupy 21.35% of the YTRB area. Grasslands constitute the main grazing areas in the basin; this is the land use that directly promotes sediment transfer and transportation and indirectly contributes to soil erosion by exposing fresh soil through grazing, trampling and digging. Thus, the soil erosion rate in these areas was higher than that estimated for agricultural land and as these areas are widespread throughout the study area, covering nearly half of the basin, they were a source of significant soil loss (40.80% of the total).
Overall, our estimates showed that 80% of the study area soil erosion occurred from grasslands, rocky areas and densely vegetated land, strongly indicating that these are the three land use types where soil loss protection measures should be focused. The influence of topography on soil erosion can be seen in Figure 9c, which shows that the soil loss rate estimate was significantly lower for flat terrain. The YTRB consists mostly of slopes between 10 and 20°, from which 29.45% of the soil erosion total was derived. It was also seen that, although the area with slopes between 20 and 30° was found to cover less area, its soil loss estimates were more greater, accounting for 34.21% of the total. Very steep regions, with 30–40° slopes, accounted for only 9.8% of the total area, but incurred 20.10% of the total soil loss. The significant effect of gravity on YTRB soil erosion was thus clearly evident.
4.4. Flood Hazard Mapping Using the HAND Model
The flood-risk map created using HAND model computations can be seen in Figure 10. In the absence of hydrological data, the model produced potential flood hazard zones with different flood risk levels, namely: none (>100 m depth), very low (15–100 m), low (10–15 m), moderate (5–10 m) and high (<5 m). The HAND model estimates suggested that approximately 9.84% (2,537,622 ha) of the area is vulnerable to high flood occurrence, with 1.04% located in a moderate hazard zone, as can be seen in Table 5. Approximately 1.54% of the area was found to have a low flood risk and 4.15% had a very low flood risk. With an area of 21,525,909 ha, the ‘no flood risk’ zone covered most of the basin, a total of 83.43%.
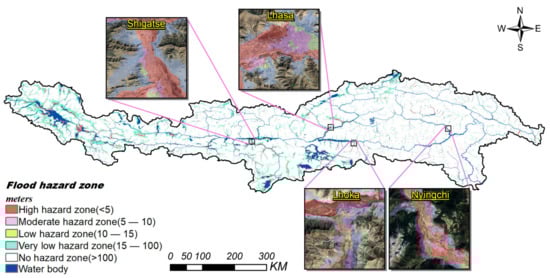
Figure 10.
Yarlung Tsangpo river basin flood hazard zones. Satellite images of major cities are from Google Maps. White (red) indicates no (high) flood risk.
Table 5.
Yarlung Tsangpo river basin flood hazard zones and coverage.
4.5. Soil Erosion and Flood Hazard Synergies
Examining the potential soil erosion and flood hazard zones in areas with different slopes revealed contrasting scenarios. Most of the extreme and severe soil erosion estimates occurred in areas with 20–30° slopes, as shown in Table 6, with steeper regions indicating higher soil loss rates. Conversely, most moderate and high potential flood risk zones occurred in the areas with slopes of 0–10°, which only covered ~ 30% of the total basin, as can be seen in Table 7. It was also noted that moderate and high flood hazard zones were found to be prevalent in areas that included major basin cities and towns (including Lhasa, the Tibetan capital), with their highly concentrated populations, buildings and facilities. These cities are located in plain and terrace areas with slopes of 0-10°, with little topographic relief and are low-lying flood-prone areas within the watershed. Additionally, the increase in surface imperviousness due to urbanization makes surface runoff higher and increases the likelihood of flooding.
Table 6.
Areas of soil erosion under different Yarlung Tsangpo river basin slope ranges.
Table 7.
Flood hazard zone areas under different Yarlung Tsangpo river basin slope ranges.
Various scenarios present a synergy between soil erosion and flood hazard. For example, the flood disaster areas are mainly distributed in the relatively low and gentle areas of the study area. The process of soil erosion mainly occurs on steep hillsides and a high slope gradient produces significant water impact forces, which in turn cause sediments to accumulate in sinks between slopes and floodplains. In spring and autumn, the temperature changes frequently, the freeze–thaw erosion is strong and the broken material erodes under the action of snow (ice) meltwater or gravity and accumulates in the gentle slope area to form an alluvial fan (alluvial skirt) [6]. Whenever a sink is filled, the material will overtop and be stored again at the next downslope opportunity, doing this repeatedly until it reaches the floodplain, where its presence results in a rise in the potential flood incidence level [62]. This indicates that the increase in sediment content in surface runoff and flooding during soil erosion in flood season may increase the possibility of a flood disaster. On the contrary, heavy rainfall and floods will lead to serious soil erosion. It is obvious that soil loss and flood incidence will have a synergistic impact on the environmental degradation of the catchment area. During the flood season, higher sediment concentrations in surface runoff prevent surface runoff from being used efficiently; the runoff cannot be taken from the river and is forced to discharge to the lower reaches of the river, increasing the flood risk [63,64].
5. Conclusions
Soil erosion prevention planning and decision making require potential soil loss to be quantified. In this study, RS and GIS technologies were employed in the RUSLE and HAND model calculation processes to describe the scale and spatial distribution of soil erosion and flood hazards in the YTRB. This resulted in soil erosion estimates ranging from 0 to 1239 t ha−1 y−1, with an average of 4.21 t ha−1 y−1. Very intense and severe soil erosion was found to occur in downstream valleys, where frequent and high precipitation combined with agricultural land uses aggravate erosion.
Slight levels of erosion, which covered most of the basin, were spatially distributed in the upper and middle–upper reaches, where there was low precipitation. Contrary to previous findings, this study found that dense forests had the highest soil loss rate, which may result from the combined effects of high precipitation and steep slopes in these regions. It was also shown that the soil loss rate increased with slope gradient, confirming a high correlation between soil erosion intensity and topographic relief.
Flood hazard prediction showed that approximately 17% of the YTRB was threatened by flood hazards, with the high flood hazard rating covering 2,537,622 ha of the basin, with an additional 268,151 ha vulnerable to moderate floods. Approximately 397,292 ha of the basin was found to be in a low hazard zone, while 1,071,023 ha was found to be in the very low hazard zone. The most flood-fragile areas were mostly distributed in riverside valleys and plains and in areas with high concentrations of residents and buildings. Thus, enhancing flood warnings and protection measures in these regions should be considered a priority.
6. Discussion
We calculated the soil erosion intensity of the Yarlung Tsangpo River basin using the RUSLE model, considering precipitation erodibility, different land use types, physical and chemical properties of soil and topographic factors. In the calculation of the R factor, we used the R factor based on monthly precipitation, pi and annual rainfall, p, due to the lack of data on rainfall intensity. This resulted in the same R factor for high-intensity rainfall over multiple consecutive days and scattered over a month, which is usually different from the actual situation [65]. Additionally, due to the large scale of the study, we assigned the same P value to the same LULC type in the calculation of the P factor. However, in areas where human interventions are present, P factor values for the same land use types should take into account for the effect of a slope [66,67,68]. At the same time, field-based soil loss measurements are not currently available for the YTRB and so we have been unable to verify the results of our study using field data. Therefore, it is suggested that government and policy makers conduct field surveys in the regions identified as being susceptible to soil erosion and establish soil loss measurement stations, so that accurate and real-time soil loss information can be captured.
Author Contributions
Conceptualization, S.C., S.Z, X.W., H.S. and J.Q.; formal analysis, S.C., S.Z., X.W. C.H. and S.L.; funding acquisition, S.Z. and H.S.; investigation, S.C., S.Z., X.W., C.H. and L.L.; methodology, S.C., S.Z. and X.W.; validation, S.C., X.W., C.H. and L.H.; writing—original draft, S.C., S.Z. and X.W.; writing—review and editing, H.S., J.Q., L.L., L.H. and S.L. All authors have read and agreed to the published version of the manuscript.
Funding
This research was funded by the National Natural Science Fund of China (Grant No.41302282; Grant No.41401659), the Science & Technology Department of Sichuan Province (Grant No. 2015JY0145), the Remote sensing monitoring of water conservation response to vegetation cover change in alpine wetlands in northwest Sichuan (Grant No.202110616001), the Quantitative Study on Evapotranspiration Emission in Zoige Wetland in the Upper Reaches of the Yellow River (Grant No. s202210616002).
Data Availability Statement
The data presented in this study are contained within the article.
Acknowledgments
We greatly appreciate the support of Key Lab of Earth Exploration & Information Techniques of Chinese Ministry Education and are thankful for the support of the Scientific Innovation Team of Remote Sensing Science and Technology of Chengdu University of Technology. We are also grateful for the anonymous reviewer for their insight and critical review of the manuscript.
Conflicts of Interest
The authors declare no conflict of interest.
References
- Zhou, P.; Luukkanen, O.; Tokola, T.; Nieminen, J. Effect of vegetation cover on soil erosion in a mountainous watershed. Catena 2008, 75, 319–325. [Google Scholar] [CrossRef]
- Xiaoping, Y.; Leixiang, W.; Jun, X.; Yongqian, W. Assessment of soil erosion sensitivity and response analysis of soil erosion sensitivity to land use change in Chengde City. Water Resour. Hydropower Eng. 2021, 52, 221–232. [Google Scholar] [CrossRef]
- Zhang, X.Y.; Wang, J.Q.; Wang, T.Q. Water and soil loss in Tibet and measures for conservation. Adv. Sci. Technol. Water Resour. 2005, 45–48. [Google Scholar]
- Fang, L.; Huang, J.; Cai, J.; Nitivattananon, V. Hybrid approach for flood susceptibility assessment in a flood-prone mountainous catchment in China. J. Hydrol. 2022, 612, 128091. [Google Scholar] [CrossRef]
- Gupta, S.; Javed, A.; Datt, D. Economics of flood protection in India. Nat. Hazards 2003, 28, 199–210. [Google Scholar] [CrossRef]
- Haidong, L.; Weishou, S.; Changxin, Z.; Lei, Y. Soil Erosion in the Source Area of the Yarlung Zangbo in China. J. Ecol. Rural. Environ. 2010, 26, 25–30. [Google Scholar]
- Liu, S.Z.; Zhang, J.G.; Gu, S.X. Study on the soil erosion types in Tibet. Mt. Res. 2006, 24, 592–596. [Google Scholar] [CrossRef]
- Xingmin, M.; Pengfei, L.; Bintao, L.; Guangju, Z.; Peng, G.; Wenyi, S. Spatial-Temporal Development and Driving Mechanisms of Erosion on the Chinese Loess Plateau Between 1901 and 2016. Yellow River 2022, 44, 36–45. [Google Scholar] [CrossRef]
- Weili, H.; Junqing, Z.; Zhibo, W.; Zhenting, W.; Gaowa, B. Research Progress of Domestic Soil Erosion Prediction Model. J. Inn. Mong. For. Sci. Technol. 2022, 48, 55–59. [Google Scholar]
- Shuihong, S.; Hengkai, L.; Zhiwei, Z. Spatial-temporal variation of soil erosion in Dongjiang source area based on RUSLE model. J. Earth Environ. 2022, 13, 344–353. [Google Scholar] [CrossRef]
- Wischmeier, W.; Smith, D. Predicting Rainfall Erosion Losses—A Guide to Conservation Planning. In Agriculture Handbooks, USA, No. 537; Department of Agriculture, Science and Education Administration: West Lafayette, IN, USA, 1978; Volume 537, 62p. [Google Scholar]
- Renard, K.G.; Foster, G.R.; Weesies, G.A.; Mccool, D.K.; Yoder, D.C. Predicting soil erosion by water: A guide to conservation planning with the Revised Universal Soil Loss equation (RUSLE). In Agricultural Handbook, USA, No. 703; USDA, Agricultural Research Service: Beltsville, MD, USA, 1997. [Google Scholar]
- Rennó, C.; Nobre, A.; Cuartas, L.; Soares, J.; Hodnett, M.; Tomasella, J.; Waterloo, M.J. HAND, a new terrain descriptor using SRTM-DEM: Mapping terra-firme rainforest environments in Amazonia. Remote Sens. Environ. 2008, 112, 3469–3481. [Google Scholar] [CrossRef]
- Nobre, A.D.; Cuartas, L.A.; Hodnett, M.; Renno, C.D.; Rodrigues, G.; Silveira, A.; Waterloo, M.; Saleska, S. Height Above the Nearest Drainage—A hydrologically relevant new terrain model. J. Hydrol. 2011, 404, 13–29. [Google Scholar] [CrossRef]
- Tingting, L.; Peijun, S.; Chunying, M.; Fanya, S.; Juan, N.; Bo, C. Height above nearest drainage and application in flood inundation mapping in China. J. Beijing Norm. Univ. 2022, 58, 300–309. [Google Scholar] [CrossRef]
- Zheng, X.; Tarboton, D.G.; Maidment, D.R.; Liu, Y.Y.; Passalacqua, P. River Channel Geometry and Rating Curve Estimation Using Height above the Nearest Drainage. J. Am. Water Resour. Assoc. 2018, 54, 785–806. [Google Scholar] [CrossRef]
- Chow, C.; Twele, A.; Martinis, S. An assessment of the Height Above Nearest Drainage terrain descriptor for the thematic enhancement of automatic SAR-based flood monitoring services. In Remote Sensing for Agriculture, Ecosystems and Hydrology XVIII; SPIE: Bellingham, WA, USA, 2016; Volume 9998. [Google Scholar]
- Liu, Y.; Maidment, D.; Tarboton, D.; Zheng, X.; Yıldırım, A.; Sazib, N.; Wang, S. A CyberGIS Approach to Generating High-resolution Height Above Nearest Drainage (HAND) Raster for National Flood Mapping. In Proceedings of the Third International Conference on CyberGIS and Geospatial Data Science, Urbana, IL, USA, 26–28 July 2016. [Google Scholar]
- Speckhann, G.A.; Borges Chaffe, P.L.; Goerl, R.F.; de Abreu, J.J.; Altamirano Flores, J.A. Flood hazard mapping in Southern Brazil: A combination of flow frequency analysis and the HAND model. Hydrol. Sci. J. 2018, 63, 87–100. [Google Scholar] [CrossRef]
- Nyssen, J.; Poesen, J.; Moeyersons, J.; Deckers, J.; Haile, M.; Lang, A. Human impact on the environment in the Ethiopian and Eritrean highlands—A state of the art. Earth Sci. Rev. 2004, 64, 273–320. [Google Scholar] [CrossRef]
- Qin, W.; Zhu, Q.K.; Zhang, Y. Soil erosion assessment of small watershed in Loess Plateau based on GIS and RUSLE. Trans. Chin. Soc. Agric. Eng. 2009, 25, 157–163. [Google Scholar] [CrossRef]
- Reusing, M.; Schneider, T.; Ammer, U. Modelling soil loss rates in the Ethiopian Highlands by integration of high resolution MOMS-02/D2-stereo-data in a GIS. Int. J. Remote Sens. 2010, 21, 1885–1896. [Google Scholar] [CrossRef]
- Ren, Y.; Liu, J.; Liu, S.; Wang, Z.; Liu, T.; Shalamzari, M.J. Effects of Climate Change on Vegetation Growth in the Yellow River Basin from 2000 to 2019. Remote Sens. 2022, 14, 687. [Google Scholar] [CrossRef]
- Liu, J.; Zhang, W.; Nie, N. Spatial Downscaling of TRMM Precipitation Data Using an Optimal Subset Regression Model with NDVI and Terrain Factors in the Yarlung Zangbo River Basin, China. Adv. Meteorol. 2018, 2018, 3491960. [Google Scholar] [CrossRef]
- Liu, J.; Zhang, W.; Liu, T.; Li, Q. Runoff Dynamics and Associated Multi-Scale Responses to Climate Changes in the Middle Reach of the Yarlung Zangbo River Basin, China. Water 2018, 10, 295. [Google Scholar] [CrossRef]
- Lu, D.S.; Li, G.Y.; Valladares, G.; Batistella, M. Mapping soil erosion risk in Rondônia, Brazilian Amazonia: Using RUSLE, remote sensing and GIS. Land Degrad. Dev. 2004, 15, 499–512. [Google Scholar] [CrossRef]
- Xu, Y.Q.; Shao, X.M. Estimation of soil erosion supported by GIS and RUSLE: A case study of Maotiaohe Watershed, Guizhou Province. J. Beijing For. Univ. 2006, 28, 67–71. [Google Scholar]
- Mengmei, W.; Suhua, F.; Baoyuan, L. Quantitative Research of Water Erosion on the Qinghai-Tibet Plateau. Adv. Earth Sci. 2021, 36, 740–752. [Google Scholar] [CrossRef]
- Tongde, C.; Juying, J.; Haolin, W.; Chunjing, Z.; Hong, L. Progress in Research on Soil Erosion in Qinghai-Tibet Plateau. Acta Pedol. Sin. 2020, 57, 547–564. [Google Scholar] [CrossRef]
- Feng, W.; Jintong, L.; Tonggang, F.; Hui, G.; Fei, Q. Spatio-temporal variations in soil erosion and its influence factors in Taihang Mountain area based on RUSLE modeling. Chin. J. Eco-Agric. 2022, 30, 1064–1076. [Google Scholar] [CrossRef]
- Ruiyin, C.; Dongchun, Y.; Anbang, W.; Chenggang, L.; Zhonglin, S. Research on Soil Erosion in Key Prevention and Control Region of Soil and Water Loss Based on GIS/CSLE in Sichuan Province. J. Soil Water Conserv. 2020, 34, 17–26. [Google Scholar] [CrossRef]
- Zhengfa, C.; Aimin, G.; Dongwei, N.; Liudong, Z.; Jianxiong, W.; Biao, X. Characteristics of Soil Erosion and Nutrient Lossin Yunnan Province Based on RUSLE Model. J. Soil Water Conserv. 2021, 35, 7–14. [Google Scholar] [CrossRef]
- Cuiyan, L.; Xihua, S.; Yueqing, L. Quantitative attribution of soil erosion for different geomorphological types in mountainous area of Mid-Shandong. Water Resour. Hydropower Eng. 2020, 51, 209–219. [Google Scholar] [CrossRef]
- Congjian, S.; Ruojing, L.; Zhenjing, Z.; Jiarui, W.; Jiulin, S. Characteristic analysis of soil and water loss in typical small watersheds of the Middle Yellow River based on RUSLE model. Southwest China J. Agric. Sci. 2022, 35, 200–208. [Google Scholar] [CrossRef]
- Xiaomei, L.; Yong, L.; Zhigang, H.; Yusong, D.; Hao, G.; Qingheng, H. Soil Erosion Characteristics of Sugarcane-Growing Watershed Based on RUSLE. Bull. Soil Water Conserv. 2022, 42, 82–88+397. [Google Scholar] [CrossRef]
- Shuangyun, P.; Kun, Y.; Liang, H.; Quanli, X.; Yajun, H. Spatio-temporal evolution analysis of soil erosion based on USLE model in Dianchi Basin. Trans. Chin. Soc. Agric. Eng. 2018, 34, 138–146+305. [Google Scholar] [CrossRef]
- Jian, Z.; Rong, L. Soil Erosion and Subarea Characteristics in Yarlung Tsangpo RiverBasi. J. Yangtze River Sci. Res. Inst. 2008, 25, 42–45. [Google Scholar]
- Xiaobu, C.; Cheng, Q.; Jie, H. Soil Erosion and Its Countermeasures in the Middle Reaches of Yarlung Zangbo River in Tibet Autnomous Region. Bull. Soil Water Conserv. 1996, 5, 48–53. [Google Scholar] [CrossRef]
- Manyi, C.; Gang, Z.; Dahong, Z.; Shiqiang, Z. Global snowmelt flood disasters and their impact from 1900 to 2020. J. Glaciol. Geocryol. 2022, 10, 0361. [Google Scholar] [CrossRef]
- Chen, T.; Niu, R.Q.; Li, P.X.; Zhang, L.P.; Du, B. Regional soil erosion risk mapping using RUSLE, GIS and remote sensing: A case study in Miyun Watershed, North China. Environ. Earth Sci. 2011, 63, 533–541. [Google Scholar] [CrossRef]
- Dutta, S.; Ghosh, S. Impact of climate and land use changes on the flood hazard of the middle Brahmaputra Reach, India. J. Disaster Res. 2012, 7, 573–581. [Google Scholar] [CrossRef]
- Zhao, W.W.; Fu, B.J.; Qiu, Y. An Upscaling Method for Cover-Management Factor and Its Application in the Loess Plateau of China. Int. J. Environ. Res. Public Health 2013, 10, 4752–4766. [Google Scholar] [CrossRef]
- Song, M.H.; Ma, Y.M.; Zhang, Y.; Li, M.S.; Ma, W.Q.; Sun, F.L. Analyses of Characteristics and Trend of Air Temperature Variation along the Brahmaputra Valley. Clim. Environ. Res. 2011, 16, 760–766. [Google Scholar] [CrossRef]
- Peng, S.Z. 1-km Monthly Precipitation Dataset for China (1901–2017); National Tibetan Plateau Data Center: Beijing, China, 2020. [Google Scholar]
- Ding, Y.X.; Peng, S.Z. Spatiotemporal Trends and Attribution of Drought across China from 1901–2100. Sustainability 2020, 12, 477. [Google Scholar] [CrossRef]
- Peng, S.Z.; Ding, Y.X.; Liu, W.Z. 1 km monthly temperature and precipitation dataset for China from 1901 to 2017. Earth Syst. Sci. Data 2019, 11, 1931–1946. [Google Scholar] [CrossRef]
- Peng, S.Z.; Gang, C.C.; Cao, Y.; Chen, Y.M. Assessment of climate change trends over the Loess Plateau in China from 1901 to 2100. Int. J. Climatol. 2018, 38, 2250–2264. [Google Scholar] [CrossRef]
- Peng, S.Z.; Ding, Y.X.; Wen, Z.M.; Chen, Y.M.; Cao, Y.; Ren, J.Y. Spatiotemporal change and trend analysis of potential evapotranspiration over the Loess Plateau of China during 2011–2100. Agric. For. Meteorol. 2017, 233, 183–194. [Google Scholar] [CrossRef]
- Food and Agriculture Organization of the United Nations; International Institute for Applied Systems Analysis. China Soil Map Based Harmonized World Soil Database (HWSD) (v1.1) (2009); Food and Agriculture Organization of the United Nations (FAO): Rome, Italy, 2019. [Google Scholar]
- Fischer, G.; Nachtergaele, F.; Prieler, S.; van Velthuizen, H.T.; Verelst, L.; Wiberg, D. Global Agro-Ecological Zones Assessment for Agriculture (GAEZ 2008); IIASA: Laxenburg, Austria; FAO: Rome, Italy, 2008. [Google Scholar]
- Wischmeier, W.H.; Mannering, J.V. Relation of Soil Properties to its Erodibility. Soil Sci. Soc. Am. J. 1969, 33, 131–137. [Google Scholar] [CrossRef]
- Williams, J.R. EPIC-erosion/productivity impact calculator: 1. Model documentation. Tech. Bull. United States Dep. Agric. 1990, 4, 206–207. [Google Scholar] [CrossRef]
- Niyonsenga, J.D.; Mugabowindekwe, M.; Mupenzi, C. Spatial analysis of soil erosion sensitivity using the Revised Universal Soil Loss Equation model in Nyamasheke District, Western Province of Rwanda. Trans. Gis 2020, 25, 735–750. [Google Scholar] [CrossRef]
- Ganasri, B.P.; Ramesh, H. Assessment of soil erosion by RUSLE model using remote sensing and GIS—A case study of Nethravathi Basin. Geosci. Front. 2016, 7, 953–961. [Google Scholar] [CrossRef]
- Xiao, Y.; Xie, G.; An, K. The function and economic value of soil conservation of ecosystems in Qinghai-Tibet Plateau. Acta Ecol. Sin. 2003, 23, 2367–2378. [Google Scholar]
- Wang, W.Z.; Jiao, J.Y. Quantitative evaluation on factors influencing soil erosion in China. Bull. Soil Water Conserv. 1996. [Google Scholar]
- Wischmeir, W.H. Predicting Rainfall-Erosion Losses from Cropland East of the Rocky Mountain: Guide for Selection of Practices for Soil and Water Conservation; USDA: Washington, DC, USA, 1965; Volume 282. [Google Scholar]
- Valeriano, M.M.; Kuplich, T.M.; Storino, M.; Amaral, B.D.; Mendes, J.N.; Lima, D.J. Modeling small watersheds in Brazilian Amazonia with shuttle radar topographic mission-90m data. Comput. Geosci. 2006, 32, 1169–1181. [Google Scholar] [CrossRef]
- Mark, D.M. Network models in geomorphology. In Modelling Geomorphological Systems; John Wiley: New York, NY, USA, 1988. [Google Scholar]
- Kumar, S.; Kushwaha, S.P.S. Modelling soil erosion risk based on RUSLE-3D using GIS in a Shivalik sub-watershed. J. Earth Syst. Sci. 2013, 122, 389–398. [Google Scholar] [CrossRef]
- Yang, Y.Y.; Zhao, R.Y.; Shi, Z.; Viscarra Rossel, R.A.; Wan, D.; Liang, Z.Z. Integrating multi-source data to improve water erosion mapping in Tibet, China. Catena 2018, 169, 31–45. [Google Scholar] [CrossRef]
- Dotterweich, M. The history of human-induced soil erosion: Geomorphic legacies, early descriptions and research and the development of soil conservation—A global synopsis. Geomorphology 2013, 201, 1–34. [Google Scholar] [CrossRef]
- Li, X.; Wei, X.; Wang, N.; Cheng, H. Maximum Grade Approach to Surplus Floodwater of Hyperconcentration Rivers in Flood Season and its Application. Water Resour. Manag. 2011, 25, 2575–2593. [Google Scholar] [CrossRef]
- Li, X.; Wei, X. Analysis of the Relationship between Soil Erosion Risk and Surplus Floodwater during Flood Season. J. Hydrol. Eng. 2014, 19, 1294–1311. [Google Scholar] [CrossRef]
- Xu, Z.; Zhang, S.; Zhou, Y.; Hou, X.; Yang, X. Characteristics of watershed dynamic sediment delivery based on improved RUSLE model. Catena 2022, 219, 106602. [Google Scholar] [CrossRef]
- Xiong, M.; Sun, R.; Chen, L. Effects of soil conservation techniques on water erosion control: A global analysis. Sci. Total Environ. 2018, 645, 753–760. [Google Scholar] [CrossRef]
- Xiong, M.; Sun, R.; Chen, L. Global analysis of support practices in USLE-based soil erosion modeling. Prog. Phys. Geogr. Earth Environ. 2019, 43, 391–409. [Google Scholar] [CrossRef]
- Kumar, M.; Sahu, A.P.; Sahoo, N.; Dash, S.S.; Raul, S.K.; Panigrahi, B. Global-scale application of the RUSLE model: A comprehensive review. Hydrol. Sci. J. 2022, 67, 806–830. [Google Scholar] [CrossRef]
Disclaimer/Publisher’s Note: The statements, opinions and data contained in all publications are solely those of the individual author(s) and contributor(s) and not of MDPI and/or the editor(s). MDPI and/or the editor(s) disclaim responsibility for any injury to people or property resulting from any ideas, methods, instructions or products referred to in the content. |
© 2022 by the authors. Licensee MDPI, Basel, Switzerland. This article is an open access article distributed under the terms and conditions of the Creative Commons Attribution (CC BY) license (https://creativecommons.org/licenses/by/4.0/).