Abstract
Few studies have investigated how the reclamation of the desert to cropland affects soil nitrous oxide (N2O) emissions. A study site was initiated in 2005 at the southern Taklimakan Desert by establishing four fields along the desert−oasis ecotone. Three fields were reclaimed as croplands for continuous cotton (Gossypium hirsutum L.) production and received (1) high, (2) low, and (3) no fertilizer inputs and the fourth field remained as a native desert. Static-chamber monitoring of N2O flux was conducted from April 2019 to March 2021. N2O emissions occurred in cropland mainly after drip fertigation during the growing season. The two−year N2O emissions in the desert, no fertilizer, low fertilizer, and high fertilizer were 248, 670, 2232, and 3615 g N ha−1, respectively. The native desert was a weak source of N2O emissions, with the non−growing season emissions accounting for 66% of the annual emissions. N2O emissions from farmland mainly occurred over the growing season, accounting for 73−98% of the total annual emissions. The N2O flux was positively related to soil NO3−−N concentration and soil water−filled pore space (WFPS), highlighting the importance of soil N availability and moisture in affecting N2O emissions in extremely arid areas. Our results demonstrate that land reclamation from the desert to cropland significantly increased N2O emissions due to high nutrient inputs. Thus, appropriate fertilizer management in the reclaimed land is essential for maintaining yield, improving soil quality, and reducing N2O emissions for continuous cotton production.
1. Introduction
Nitrous oxide (N2O) is one of the three most common greenhouse gases, and its concentration in the atmosphere is increasing due to human activities. Applications of organic and inorganic nitrogen (N) fertilizers in agriculture are the most important anthropogenic source of N2O emissions [1,2]. Fertilizer application, land use and management, and climate change are the main controlling factors of N2O emission from agricultural land [3,4]. Accurately quantifying the impact of fertilizers on N2O emissions in response to the change in land use is a crucial prerequisite for developing global warming mitigation strategies [5].
Soil N2O production is mainly determined by the biological nitrification and denitrification processes, whereas other pathways such as anammox, nitrate−dependent ferrous oxidation (NDFO), and chemical denitrification are generally insignificant in arable agriculture. Both nitrification and denitrification are influenced by the microbial community composition and soil environmental conditions (soil temperature, porosity, water content, nutrient availability, etc.) [6,7,8]. It has also been recognized that changes in land use can affect the composition and content of soil organic matter, thus affecting the mineralization rate of organic N and further soil N2O emissions [9,10]. For example, several studies reported that converting pristine ecosystems (e.g., forests or grassland) into agricultural systems greatly increased N2O emissions [11,12,13], thus enhancing the surface temperature, decreasing transpiration, and increasing N availability and C sequestration [14]. However, it is not clear how the land reclamation of desert into farmland can affect soil N2O emissions. Previous studies have reported that converting deserts to agricultural lands improved soil quality and productivity, and increased microbial community diversity [8,15,16], which has positive effects on accelerated soil evolution. Land use changes could profoundly affect the production and emission of N2O by changing the abiotic and biotic features of the soil. Therefore, further investigation is needed to understand how desert reclamation affects soil N2O emissions by affecting soil properties in arid areas.
Taklimakan Desert, located in the south of Xinjiang, is the second−largest shifting sand desert in the world [17]. Many desert areas have been reclaimed for irrigated agricultural land on the southern margin of the Taklimakan Desert to meet the pressures brought by the rising population since the 1980s [18]. Cotton production heavily relies on the continuous and intensive inputs of water and fertilizer in extremely arid areas [19]. Substantial fertilizer input could induce excessive residual N accumulation and soil acidification, which could further influence soil N2O emissions [20,21]. Reclamation of the desert into farmland could have resulted in significant changes in vegetation, soil properties, microbial community composition, and activity [10,15]. For instance, compared to the desert, fertilizer application had an effect on rhizosphere root exudates, which is beneficial to the growth and reproduction of nitrifying and denitrifying microorganisms [22]. In addition, vegetation cover could reduce soil temperature, which further affects the abundance and activity of microorganisms [23]. Irrigation and film−mulching practices are essential for management in cotton production, which can increase soil water content and further influence microbial nitrification, denitrification processes, and potentially, N2O emissions [24].
Some studies have investigated the effect of fertilization sources and rates on soil N2O emission in cotton fields in arid and semi−arid areas [25,26,27,28]. For example, Kuang et al. [27] reported that the N2O emission from drip−irrigated cotton fields in the southern Xinjiang region was 300–500 g N ha−1. These studies are, however, based on relative short−term field trials over 2–3 years and few studies have reported on the N2O emission characteristics of cotton fields under different intensities of long−term fertilizer inputs. Fertilizers exert a long−term influence on the soil structure and microbial processes [14]. Several studies have shown that long−term manure and mineral fertilizer application greatly impacted the emission of soil N2O, due to changes in the available carbon and nitrogen sources for soil microbes [29,30]. Understanding the impact of land reclamation, associated long−term fertilization, and water management practices on N2O emissions is thus important for developing the appropriate strategies for greenhouse gas mitigation.
Previous studies in arid and semi−arid regions mainly focused on N2O emissions during the season with plant cover, whereas N2O emissions in the non−growing season are not well understood [8,29]. Many studies have proposed that N2O emission may be significant in the non−growing season [31,32,33]. For instance, Shang et al. [32] used a meta−analysis to study the non−growing season N2O emissions at 23 sites and reported that ignoring the non−growing season would underestimate annual N2O emissions by 30% for paddy fields. For arable land in northeast China, Chen et al. [34] found that N2O emissions over the non−growing season contributed to 66% of the paddy rice and 18% of the maize fields’ annual emissions, respectively. For the gray desert soil in northern Xinjiang, Yin et al. [35] reported that during the non−growing season, N2O emission in a cotton field accounted for 39% of the annual emissions. These studies highlight the significance of N2O emissions over the non−growing season, which is important to understand how land use management can affect seasonal changes in N2O fluxes.
In this study, the emission of N2O and environmental conditions were analyzed from 2019 to 2021 and based on a long−term experiment initiated in 2005 in the desert−oasis ecotone. The objectives of this study were to: (1) investigate the seasonal dynamics of N2O flux after desert reclamation; (2) quantify the cumulative N2O emissions and seasonal proportions; and (3) study the relationship between N2O flux and soil environmental factors.
2. Materials and Methods
2.1. Study Area and Soil Properties
The long−term field experiment was established in 2005 at Cele National Station (37°01′ N, 80°43′ E) in Xinjiang province. The site is located in the extremely arid region of the southern margin of the Taklimakan Desert. Precipitation is 42.5 mm, while potential annual evapotranspiration is 2956 mm. The annual mean temperature is 12.7 °C. According to the USDA ST classification system, the soil in this region is Aridisols (USDA, 1999). The soil texture is fine sandy (sand 90%, silt 4%, and clay 6%), and has a CaCO3 content of 16.6%. The depth of groundwater is 14.0 m. The meteorological data were recorded using an on−site weather station.
2.2. Experimental Design and Agronomic Management
The long−term study was initiated in 2005 by establishing four fields along the desert−oasis ecotone, with each field having an area of 100 m × 100 m (1 ha). Three fields were reclaimed as croplands and received (1) high, (2) low, and (3) no fertilizer inputs, and the fourth field remained as a native desert. The croplands have been continuously cropped to cotton and covered with plastic film over the growing season each year and left fallow in the rest of the months. The non−fertilized field did not receive any fertilizer input since reclamation. In contrast, the desert land remained native and had sparse vegetation (mainly Karelinia caspia (Pall) Less and Alhagi sparsifolia Shap.). Before 2019, the high fertilizer treatment input included urea 362 kg N ha−1, triple superphosphate (TSP) 126 kg P2O5 ha−1, and manure 30,000 kg ha−1; the low fertilizer application used urea 208 kg N ha−1, TSP 57 kg P2O5 ha−1, and manure 21,000 kg ha−1. Soil core samples (0–20 cm) were collected in each field before sowing in 2019 for the determination of the soil’s basic chemical properties (Table 1). The soil organic carbon (SOC), total nitrogen (TN), and available phosphorus (AP) in fertilized fields were significantly higher than those in no−fertilizer fields and deserts.

Table 1.
Properties of 0–20 cm soil in each treatment before sowing in 2019. Values are the means ± 1 standard error, n = 3.
In 2019, the amount of high fertilizer application was N 644 kg N ha−1, phosphate (P) 297.9 kg P ha−1, and potassium (K) 105 kg K ha−1. The fertilizer application rate of low fertilizer was 53% of high fertilizer. In 2020, due to the COVID-19 lockdown, there was no fertilization from mid−July to August, and the application rate of high and low fertilizers in 2020 was 70% of that in 2019. The N fertilizer applied above was the sum of the N content of urea, diammonium phosphate (DAP), and manure. The P fertilizer was the sum of the P content of DAP and potassium dihydrogen phosphate (KDP). The K fertilizer all came from KDP. Before sowing, manure, DAP, and 20% urea were applied as base fertilizers incorporated into the soil. KDP and the remaining 80% urea were dissolved in water and applied to the soil with drip irrigation during the growing season. For more details about topdressing, see Table 2. In this study, manure was a mixture of sheep and cow dung with a ratio of C/N 18.0, total N of 15.6 ± 0.6 g N kg−1, total K of 16.8 ± 0.3 g kg−1, and total P of 2.0 ± 0.1g kg−1. In the year of application, 20% of the total N in manure was considered available by mineralization based on the ratio of C/N [36]. Thus, the manure was 19.5 Mg ha−1 and 30 Mg ha−1 applied in low and high fertilizer treatments, respectively.
Table 2.
Fertilization schedules for the low and high fertilizer treatments in 2019 and 2020.
Cotton (Zhongke 1) was sown in the middle of April in both years using a mechanical seeding planter and grown with a plastic mulch drip−irrigation system. Briefly, the plastic mulch drip−irrigation system consists of one film, two pipes, and four rows. Underneath the two sides of the film, there are two drip−irrigation pipes. On both sides of each pipe, two rows of cotton were distributed. The film was 110 cm wide, with a 50 cm inter−film zone. Cotton was planted in a uniform distribution with a spacing of 10 cm, the row spacing of cotton on both sides of the pipe and between the two pipes was 30 cm and 50 cm, respectively [27]. All reclaimed fields received sufficient irrigation derived from an underground well at Cele National Station. Irrigation was performed 10 times in 2019 and 8 times in 2020, the amount of irrigation was 620 mm and 580 mm in 2019 and 2020, respectively. The irrigation schedule was based on local practices and implemented according to the growing need for cotton and farmers’ experience to enable a real characterization of N2O emissions from the experimental fields in this region.
2.3. N2O Gas Sampling and Analysis
Soil surface gas emission was determined using a static chamber [26] that was 90 cm (length) × 40 cm (wide) × 25 cm (high). After sowing, four pseudo−replicate plots were set up in each treatment field, and three static chamber bases were installed in each plot by inserting the chamber at 5 cm into the soil. Because the long−term trial began before the N2O monitoring experiment, treatment was not necessarily randomized, but it was the same method employed by Rothamsted Research [37]. For the reclaimed croplands, the installation position covered half film−mulched and half not film−mulched soil to represent the field average. During sampling, an appropriate amount of water was added to a pre−installed groove at the base of the chamber, and a fitting lid was placed in the groove to seal the chamber. Gas samples were collected from the chamber by a syringe 0, 15, 30, and 45 min after it was closed. At each sampling, 30 mL of gas was collected and transferred to a pre−evacuated aluminum bag. Sampling was generally carried out in the morning between 10:00 and 14:00 (GMT + 8) to minimize diurnal variation in flux patterns. The sampling frequency was every two to three days following fertilization or irrigation, decreased to once a week in the late growth period, and once or twice a month in the non−growing season. At each gas collection, the soil volumetric water content (VWC) and temperature at the 5 cm depth in the chamber were measured using a portable soil sensor (HH2−WET, Delta−T Devices, Cambridge, UK). Sampling was collected a total of 23 times from April 2019 to March 2020 and 26 times from April 2020 to March 2021. April to October is the growing season, November to March is the non−growing season, and April to March is a crop year.
The N2O concentration was measured by gas chromatography (Shimadzu GC−2014C, Shimadzu Scientific, Kyoto, Japan). Standard gas (purity of 99.999%, Dalian Date Gas Co., Ltd., Dalian, China) was used for instrument calibration. The HMR package in the R program was used to calculate the daily N2O flux rate (g N2O−N ha−1 d−1) by fitting the measured N2O concentrations into a linear or non−linear model [38]. The cumulative emissions (ƩN2O, g N2O−N ha−1) in the crop year of each chamber were calculated by summing the daily fluxes. The fluxes for the period between the two measurements were gap−filled using linear interpolation. The crop year N2O emission factor (EF, %) from the fertilized cropland was calculated as the percentage of N2O emission from the total applied N, using the Equation:
where, EN and EC are the ƩN2O (g N ha−1 yr−1) of the fertilization treatment and control, respectively, and the Applied N is the rate of N applied in the fertilization treatment (g N ha−1).
2.4. Soil Sampling and Analysis
Core soil samples (0−20 cm) were collected biweekly over the growing season and monthly in the non−growing season. In each plot, four composited soil samples were collected near the chambers. Each composite sample combined three cores from the cotton row and three cores from the bare row (20 cm i.d.). Soil samples were measured for concentrations of ammonium (NH4+) and nitrate (NO3−) using a continuous flow analyzer (Auto analyzer 3 SEAL, Bran and Luebbe, Norderstedt, Germany) after being extracted using 0.1 M CaCl2. The soil organic carbon (SOC), available phosphorus (Olsen−P), total N, and available potassium (ammonium acetate extracted potassium) of soil samples after harvest were also analyzed.
Soil nitrate intensity (g N kg−1 days) refers to the accumulation of soil NO3− concentrations during the crop growing period [26,39] and is calculated in a similar manner as ƩN2O, by gap−filling daily NO3− concentrations using the linear interpolation and then summing the daily values.
In addition to being measured using the portable sensor, soil temperature and VWC at a depth of 5 cm in each field were continuously measured using the pre−installed soil temperature and humidity sensors (Decagon Devices Inc., Pullman, WA, USA). Data were recorded by a data logger (EM50G with GSM Module, Decagon Devices Inc., Pullman, WA). Soil WFPS was calculated by the following Equation:
where BD is the bulk density of the soil (Mg m−3) and PD is the particle density (assuming 2.65 Mg m−3).
2.5. Plant Sample Collection and Analysis
Cotton was harvested at the end of September each year, and seed cotton yield (Mg ha−1) was measured by hand−picking all cotton bolls and drying them at 80 ℃. For the reclaimed cropland, the emission intensity (EI) was calculated as ƩN2O emission per Mg of seed cotton yield. A 1 m × 1 m quadrat was selected from each field to collect the plant’s above−ground biomass which was further separated into stems, leaves, shells, fibers, and seeds. All samples were oven−dried at 105 ℃ for 30 min and then at 80 °C to a constant weight, then the total N concentration of each part was measured. The nitrogen uptake was calculated by multiplying plant N concentrations with the dry weight of each individual organ and then summing for all organs. Nitrogen recovery efficiency (NRE) was calculated as:
where NF and NC are the total above−ground N uptake in the fertilized fields and no fertilizer field (kg N ha−1), respectively. Applied N is the N application (kg N ha−1).
2.6. Data Analysis
The PROC UNIVARIATE was used to determine the normality and homogeneity of all data. Log transformations were used to transform the data that did not conform to the normal distribution. A one−way ANOVA with the MIXED (SAS Institute, 9.3, Cary, NC, USA) procedure was performed on the data to assess the effects of fertilizer treatment on soil properties, ΣN2O, cotton yield, crop N uptake, NRE, and yield−scaled emission intensity (EI) for each crop year, with the fertilizer treatments treated as fixed effects and the pseudo−replicated plots at each treatment as a random effect. The relationship between ΣN2O and nitrate intensity and the relationship between daily N2O flux and soil temperature and WFPS and concentration of NH4+, NO3− were analyzed by regression analyses. All differences were significant at p < 0.05.
3. Results
3.1. Weather Conditions
During the study period, the daily air temperature was lowest at −10.6 °C (1 January 2019), highest at 30.6 °C (1 August 2019), and the annual mean was 12.3 °C (Figure 1). The precipitation of the crop year (April to March) was 24.4 mm in 2019 and 36.2 mm in 2020. Soil temperature ranged from −6.9 °C in February 2021 to 30.9 °C in August 2020 across the four fields (Figure 1). Soil WFPS at a 5 cm depth in cotton fields and desert increased rapidly following the rainfall and irrigation events and then decreased due to the poor water−holding capacity of sandy soil and high evapotranspiration. Soil WFPS ranged from 7% to 54% (mean 24%) in the cotton fields and 4% to 25% (mean 8%) in the desert.
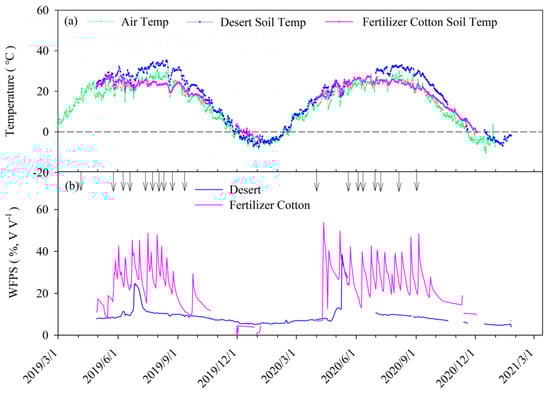
Figure 1.
Air temperature and soil temperature (a) and water−filled pore space (WFPS) (b) at a 5 cm soil depth over the experimental period. Arrows indicate dates of irrigation.
3.2. Daily N2O Fluxes
The daily N2O flux rate of the desert, no fertilizer, low fertilizer, and high fertilizer fields over the study period varied from −2.6 to 3.9, −2.8 to 15.7, −1.4 to 19.1, and −4.2 to 43.1 g N ha−1 d−1, respectively (Figure 2). The averages were 0.2, 1.3, 6.0, and 9.2 g N ha−1 d−1, respectively. Large pluses of N2O emission were observed in the low and high fertilizer fields in both growing seasons. The N2O fluxes of the low and high fertilizer fields peaked at 9.8 g N ha−1 d−1 and 35.2 g N ha−1 d−1 on 11 May 2019, and 15.8 g N ha−1 d−1 and 43.1 g N ha−1 d−1 after sowing on 20 April 2020, respectively. The high flux peaks lasted for about 10 days and then rapidly decreased to a low emission level (below 10 g N ha−1 d−1). Small N2O emission peaks also occurred after drip fertigation. However, N2O emissions did not increase in the no fertilizer field and desert treatments. The N2O flux during the non−growing seasons was generally low, never exceeding 5.2 g N ha−1 d−1 in all treatments.
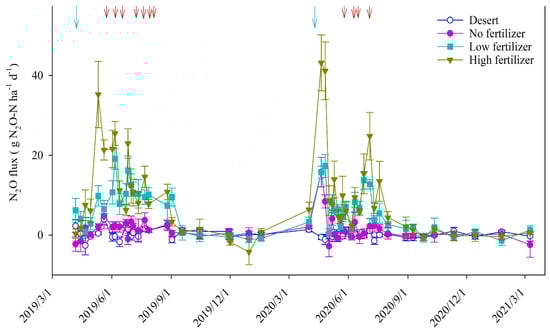
Figure 2.
Daily N2O flux rate for the desert and fertilizer treatments over the 2019–2021 growing season and non−growing season. Blue arrows indicate the date of planting and basal fertilizer application and red arrows indicate the dates of drip fertigation. Bars indicate the ±1 standard error of the mean, n = 12.
3.3. Seasonal and Crop Year N2O Emissions and Emission Factors
Compared to the desert and no fertilizer fields, reclaimed farmland with fertilizer application significantly increased ƩN2O over the growing season but not in the non−growing season (Table 3). However, compared with the desert, the N2O emissions in the no fertilizer fields did not increase significantly during the whole year. The two−year ƩN2O were 248, 670, 2232, and 3615 g N ha−1 for the desert, no fertilizer, low fertilizer, and high fertilizer fields, respectively (Table 3). In the two crop years, the ƩN2O in fertilizer cotton fields was 2.3–4.4 times and 8.0–13.6 times greater than the no fertilizer field and desert, respectively.
Table 3.
Cumulative N2O emissions, the proportion of N2O emissions from non−growing season to total emission, and applied N scaled emission factor as affected by fertilizer treatments. Values are the means ± 1 standard error, n = 4 for treatment.
Across the two years, N2O emissions in the non−growing seasons ranged from 7–179 g N ha−1 and accounted for 66%, 27%, 2%, and 5% of crop year fluxes in the desert, no fertilizer, low fertilizer, and high fertilizer fields, respectively (Table 3). There was no difference in ƩN2O emissions over two non−growing seasons between all treatments. The applied−N scaled N2O EF ranged from 0.14% to 0.29% and were not affected by the fertilizer intensity in either year (Table 3).
3.4. Soil Inorganic N Concentrations
Soil NO3− concentration varied between 15.74 and 85.71 mg N kg−1 and primarily changed with fertilizer input in the cotton fields. In contrast, NO3 was relatively stable in the non−fertilizer field (1.00–9.10 mg kg−1) and desert (7.47–24.27 mg kg−1) (Figure 3). The annual mean concentration of NO3− was 16.59, 4.56, 27.14, and 56.07 mg kg−1 in the desert, no fertilizer, low fertilizer, and high fertilizer fields, respectively. After sowing and fertilization, the NO3− concentration increased significantly and maintained a relatively high value for 4 weeks in July 2019 and from July to August 2020. On the whole, the NO3− concentration under different fields was as follows: high fertilizer > low fertilizer > desert > no fertilizer. In contrast, the NH4+ concentration was relatively low (0.40–5.82 mg kg−1) (Figure 3). In 2019, the NH4+ concentration increased rapidly after sowing, and then gradually decreased to a lower level. In 2020, the NH4+ concentration did not fluctuate greatly. The annual mean NH4+ concentration in the desert, no fertilizer, low fertilizer, and high fertilizer fields were 1.59, 1.61, 1.44, and 1.91 mg kg−1, respectively, and there was no significant difference in NH4+ concentration among all treatments.
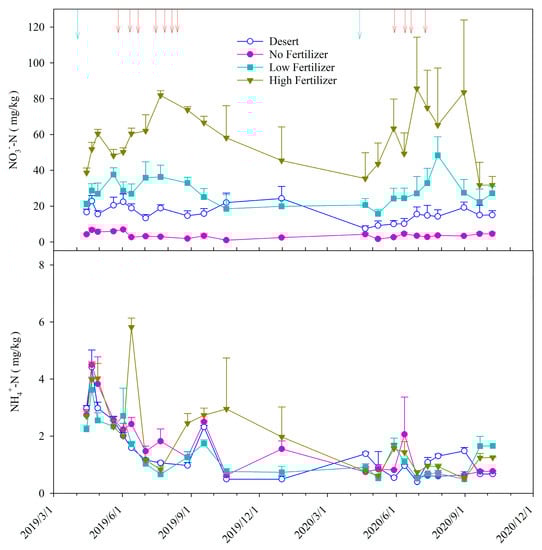
Figure 3.
Dynamic changes of soil concentrations of NH4+−N and NO3−−N as affected by land reclamation and fertilizer input treatments. Blue arrows indicate the date of planting and basal fertilizer application and red arrows indicate the dates of drip fertigation. Bars indicate the +1 standard error of the mean, n = 4.
3.5. Relationship of N2O Flux with Environmental Factors and Nitrate Intensity
Over the two crop years studied, the daily N2O flux rate correlated positively and significantly (p < 0.001) with the soil NO3− and WFPS, whereas the coefficient of determination was as small as 0.10 for NO3− and 0.27 for WFPS (Figure 4). In contrast, the N2O flux did not correlate to soil NH4+ and soil temperature and ΣN2O increased linearly with soil nitrate intensity (p < 0.001), with greater values occurring in the high fertilizer field while the non−fertilizer field had the lowest nitrate intensity (Figure 5).
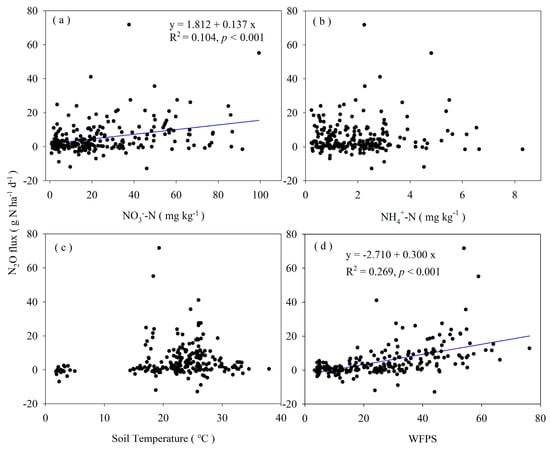
Figure 4.
Relationship of the daily N2O flux rate with the soil concentrations of NO3−−N (a) and NH4+−N (b), soil temperature (c), and water−filled pore space (WFPS) (d) (n = 220).
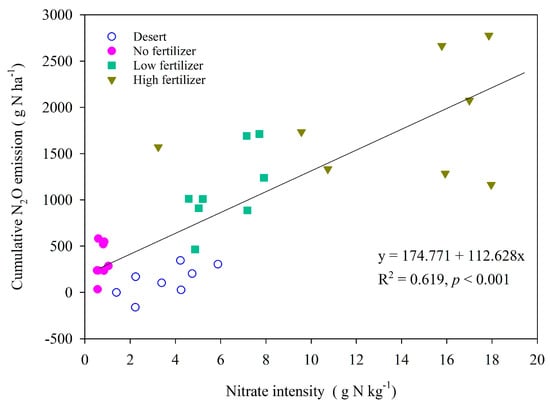
Figure 5.
Relationship between the cumulative N2O emission and nitrate intensity from 2019 to 2021.
3.6. Crop Yield and Yield−Based Emission Intensity
In both years, the cotton yield in the fertilized treatments approximately tripled that in the non−fertilizer treatment, and there was no apparent difference between the high and low fertilizer treatments (Table 4). Similar to cotton yield, the crop N uptake under fertilizer (low and high) fields in 2019 and 2020 was significantly (p < 0.001) greater than the no fertilizer field. The N recovery efficiency was lower than 0.2 in fertilized fields and was not affected by fertilizer intensity. The yield−scaled emission intensity (EI) in the high fertilizer field was significantly higher than in the no fertilizer field in 2019, but there was no difference in 2020.
Table 4.
Cotton seed yield, crop N uptake, N recovery efficiency, and yield−scaled emission intensity by study year and fertilizer. Values are the means ± 1 standard error, n = 4.
4. Discussion
4.1. Annual N2O Emissions
Over the experimental period, N2O emissions from the desert ranged from 27–221 g N ha−1 yr−1, similar to emissions in the Gurbantunggut Desert in northwest China (130 g N ha−1 yr−1) [40], but lower than those in the Sonoran Desert in North America (400 g N2O−N ha−1) [9,41]. The daily N2O flux rates from the desert in the current study were also generally low, not exceeding 4.0 g N ha−1 h−1. The low flux and cumulative N2O emissions in our study were mostly due to the extremely low WFPS (mean 9%) in desert soils, which could have limited the activity of N2O−producing microorganisms, despite the comparatively high mineral N concentrations (mean NO3− 16.4 mg kg−1). The emissions of N2O in the non−growing seasons accounted for 66% of annual emissions and is consistent with other research (57%, [40]; 72%, [42]). Overall, in our study, the N2O emission in the native desert was relatively small compared to other natural or intensively managed ecosystems [10]. However, desert ecosystems account for 20% of the earth’s land area [43] and ignoring their contribution to global greenhouse gas emissions could potentially underestimate the N2O emission inventory.
In our long−term experiment, emissions of N2O in cotton fields varied from 273–2165 g N ha−1 yr−1, which was greater than our recent studies in the same area (72–506 g N ha−1 yr−1, [27]; 460–1500 g N ha−1 yr−1, [28]). The greater N2O emissions could be partly due to the higher amount of fertilizer inputs than those in previous studies (120–240 kg N ha−1). Many studies have reported a linear or non−linear increase in N2O emissions in response to N fertilizer rates [44]. In addition, our study was based on 16 years of fertilization experiments, which might be attributed to the long−term effects of fertilizer on soil C and N [30]. It has been confirmed that long−time fertilization has a cumulative effect on soil N2O emissions [45]. However, the N2O emissions in our study were much lower than those from intensive agriculture soil in other regions (i.e., 900–5500 g N ha−1, [29]). It was demonstrated that N2O emission was still low based on long−term fertilization experiments in drip irrigation cotton in northwestern China, which also verifies our previous short−term study results in the same area [27]. In the current study, the EF values (0.14−0.29%) were consistent with studies at the same site (0.23−0.42%, [28]) and higher than other studies in Xinjiang (0.01–0.09%, [26]; 0.06–0.15%, [27]). The relatively higher value in this site could be due to the fact that our study calculated EF based on the annual N2O emissions, while other studies were based on emissions only occurring over the growing season. Shang et al. [32] reported that the N2O−EF estimated over the whole year was significantly greater than the measurement of only the growing season. In addition, the EF in our research was far lower than the IPCC default value (1%, [46]). The results of our long−term experiment suggest that N2O emissions from extremely arid regions could be significantly overestimated using the IPCC default value.
Emissions of N2O from the cotton fields were 1.7–13.6 times greater than those from the native desert, demonstrating that reclamation from desert to farmland increased N2O emissions. Our results were consistent with previous studies that the cultivation of native ecosystems to agroecosystems greatly enhanced soil N2O flux [12,14]. The increases in N2O flux occurred mainly after drip fertigation. Lv et al. [29] also reported that the N2O flux peaks of the cotton fields mainly appeared after basal and supplementary fertilizer application in Xinjiang. The N2O emissions in the fertilized fields were significantly greater than those from the no−fertilizer cotton field and desert during the growing season. In contrast, there were no significant differences among the four fields in the non−growing seasons, which was similar to the result of Yang et al. [12] who demonstrated that N2O emissions were similar among different land use types in the winter. In addition, N2O emissions in the non−growing seasons from cotton fields account for 2–27% of the annual total. Therefore, the increases in N2O emissions in response to the land use change from desert to cropland were mainly attributed to emissions in the growing season.
4.2. Effects of Reclamation on N2O Emissions
Water and fertilizer inputs were the main reasons for the increases in N2O emissions in cropland soil [47]. In this study, N2O emissions from the fertilized fields were significantly greater than in the non−fertilized field and the desert, but there was no significant difference between the non−fertilized field and the desert. Manure and synthetic fertilizer application increased the concentrations of mineral N in the cotton fields. Soil NO3− and NH4+ in the high and low fertilizer fields achieved maximum values of 85.7 and 5.8 mg N kg−1 and 48.4 and 3.6 mg N kg−1, respectively. This assumption is also supported by the positive relationship between the cumulative N2O emission and soil nitrate intensity. In addition, the soil WFPS in farmland (mean 24%) was higher than that in the desert (mean 8%). It is generally believed that nitrification is the primary process of N2O release when soil WFPS is less than 60% [48]. For the fertilized fields, increases in mineral N and soil moisture in response to drip fertigation could promote the nitrification rate, thus enhancing the release of N2O. Crop cover on the soil surface can limit soil water evaporation and consequently promote N2O emission, especially in extremely arid regions. In addition, the soil microbial biomass and activities increased dramatically after the desert was converted to agricultural land due to the addition of nitrogen nutrients and water [16,49,50]. Furthermore, root exudates from cotton crops can increase the abundance and activities of soil microorganisms [51,52]. Thus, changes in these environmental factors could provide more favorable conditions for nitrification, resulting in an increase in N2O emissions in agroecosystems after desert reclamation.
According to our long−term experiment, fertilizer application resulted in a considerable improvement in soil properties. The soil pH changed from weakly alkaline to neutral, and SOC and available P also increased considerably. These results were consistent with previous research that long−term cropping and fertilizer practices improved the soil structure and fertility of farmland reclaimed from deserts [8,53,54]. Long−term fertilization also greatly increased cotton yield. Cotton yields in the fertilized fields was nearly triple that of the no fertilizer in the current study. However, increasing fertilizer application from low to high rates increased cotton yields by only 6% but resulted in a significant increase in soil N2O emissions of 62%, indicating that the excessive application of fertilizer will not only fail to yield improvement but also increase environmental hazards such as N2O emissions. Lv et al. (2014) [29] also reported that excessive inputs of animal manure did not improve crop yields but resulted in high soil nitrate accumulation. In addition, there was no difference in crop N uptake, N recovery efficiency, and yield−based emission intensity between low and high fertilizer fields. These results further confirm that the low fertilizer input level in the current study could meet crop nutrient needs while reducing N2O emission.
4.3. Effects of Soil Mineral N and Moisture on N2O Emissions
Many studies have reported a positive relationship between soil mineral N and N2O emission [55,56]. In the current experiment period, there was a significant linear correlation between NO3− concentration and N2O flux (R2 = 0.104, p < 0.001). It is worth noting that NO3− concentration only explained 10% of N2O emissions, indicating that other environmental factors have a greater impact on N2O emissions in this study, such as organic carbon or microorganisms, which can be further confirmed in future research.
It is widely established that the N2O flux is usually correlated with soil temperature [57]. However, soil temperature was not associated with N2O flux in our long−term experiment. This is likely attributed to the seasonal fluctuation of soil temperature during the two observation years, while the N2O flux rates were relatively stable under the no fertilizer and desert treatments.
Soil moisture regulates the production, transport, and emission of N2O by influencing the activity of nitrifying and denitrifying microorganisms and soil permeability [57,58]. In our long−term experiment, there was a significantly positive relationship between N2O flux and soil WFPS (R2 = 0.269, p < 0.001), which was in line with the reports by Meng et al. [53] and Yan et al. [59] who also reported a positive correlation between N2O flux and soil moisture in arid regions. In our study, the poor water−holding capacity and the high evaporation of reclaimed sandy soils generally maintained the WFPS around 20% and did not exceed 55%, even after drip fertigation. This indicates that in our research site, N2O production was mainly through nitrification, and soil moisture is an important factor regulating N2O production and emission in arid regions.
5. Conclusions
In our study, the two−year cumulative N2O emissions ranged from 248–3615 g N ha−1 from reclaimed croplands and desert, and the applied−N−based emission factors were 0.14% to 0.29% in the fertilized cotton fields. Our study demonstrated that land reclamation from desert to agricultural land effectively improved soil quality and cotton yield but resulted in high N2O emissions over the growing seasons. The enhanced N2O emissions in the reclaimed farmland were mainly attributed to the nutrient and water inputs through fertilizer and irrigation practices. Increasing fertilizer rates from low to high did not improve cotton yield but led to a significant increase in N2O emissions. These results reveal that excessive fertilization failed to increase yield and resulted in more N2O emissions in the reclaimed cropland. The results of this study can be a reference for developing fertilizer management strategies and estimating N2O fluxes for land reclamation with a similar arid oasis agriculture. Future studies should investigate the microbial−driven N2O production processes in response to land reclamation.
Author Contributions
Conceptualization, Y.W., X.G. and X.L.; methodology, Y.W. and X.G.; formal analysis, Y.W. and W.K.; investigation, Y.W. and W.K.; writing—original draft preparation, Y.W.; writing—review and editing, Y.W., X.G., X.L. and F.Z.; Revising critically for important intellectual content, W.K. All authors have read and agreed to the published version of the manuscript.
Funding
This work was supported by the National Natural Science Foundation of China [grant number 41877420] and the Western Light Foundation of the Chinese Academy of Sciences [grant number 2019−FPGGRC].
Institutional Review Board Statement
Not applicable.
Informed Consent Statement
Not applicable.
Data Availability Statement
The data presented in this study are available on request from the corresponding author.
Conflicts of Interest
The authors declare no conflict of interest.
References
- Stehfest, E.; Bouwman, L. N2O and NO emission from agricultural fields and soils under natural vegetation: Summarizing available measurement data and modeling of global annual emissions. Nutr. Cycl. Agroecosyst. 2006, 74, 207–228. [Google Scholar] [CrossRef]
- Paustian, K.; Lehmann, J.; Ogle, S.; Reay, D.; Robertson, G.P.; Smith, P. Climate-smart soils. Nature 2016, 532, 49–57. [Google Scholar] [CrossRef] [PubMed]
- De Klein, C.A.; Eckard, R.J.; van der Weerden, T.J. Nitrous oxide emissions from the nitrogen cycle in livestock agriculture: Estimation and mitigation. In Nitrous Oxide and Climate Change; Smith, K., Ed.; Earthscan Ltd.: London, UK, 2010; pp. 107–144. [Google Scholar]
- Kirschbaum, M.U.; Saggar, S.; Tate, K.R.; Giltrap, D.L.; Ausseil AG, E.; Greenhalgh, S.; Whitehead, D. Comprehensive evaluation of the climate-change implications of shifting land use between forest and grassland: New Zealand as a case study Agric. Ecosyst. Environ. 2012, 150, 123–138. [Google Scholar] [CrossRef]
- Aliyu, G.; Sanz-Cobena, A.; Müller, C.; Zaman, M.; Luo, J.; Liu, D.; Yuan, J.; Chen, Z.; Niu, Y.; Arowolo, A.; et al. A meta-analysis of soil background N2O emissions from croplands in China shows variation among climatic zones. Agric. Ecosyst. Environ. 2018, 267, 63–73. [Google Scholar] [CrossRef]
- Sahrawat, K.L. Factors affecting nitrification in soils. Commun. Soil Sci. Plant. 2008, 39, 1436–1446. [Google Scholar] [CrossRef]
- Butterbach-Bahl, K.; Baggs, E.M.; Dannenmann, M.; Kiese, R.; Zechmeister-Boltenstern, S. Nitrous oxide emissions from soils: How well do we understand the processes and their controls? Philos. Trans. R. Soc. Lond. B Biol. Sci. 2013, 368, 20130122. [Google Scholar] [CrossRef] [PubMed]
- Li, J.; Pokharel, P.; Liu, G.; Chen, J. Reclamation of desert land to different land-use types changes soil bacterial community composition in a desert-oasis ecotone. Land Degrad. Dev. 2021, 32, 1389–1399. [Google Scholar] [CrossRef]
- Guilbault, M.R.; Matthias, A.D. Emissions of N2O from Sonoran Desert and effluent-irrigated grass ecosystems. J. Arid Environ. 1998, 38, 87–98. [Google Scholar] [CrossRef]
- Chen, D.; Li, Y.; Wang, C.; Liu, X.; Wang, Y.; Shen, J.; Qin, J.; Wu, J. Dynamics and underlying mechanisms of N2O and NO emissions in response to a transient land-use conversion of Masson pine forest to tea field. Sci. Total Environ. 2019, 693, 133549. [Google Scholar] [CrossRef]
- Van Lent, J.; Hergoualc’h, K.; Verchot, L.V. Reviews and syntheses: Soil N2O and NO emissions from land use and land-use change in the tropics and subtropics: A meta-analysis. Biogeosciences 2015, 12, 7299–7313. [Google Scholar] [CrossRef]
- Yang, X.; Chen, H.; Gong, Y.; Zheng, X.; Fan, M.; Kuzyakov, Y. Nitrous oxide emissions from an agro-pastoral ecotone of northern China depending on land uses. Agric. Ecosyst. Environ. 2015, 213, 241–251. [Google Scholar] [CrossRef]
- Gütlein, A.; Gerschlauer, F.; Kikoti, I.; Kiese, R. Impacts of climate and land use on N2O and CH4 fluxes from tropical ecosystems in the Mt. Kilimanjaro region, Tanzania. Glob. Chang. Biol. 2018, 24, 1239–1255. [Google Scholar] [CrossRef] [PubMed]
- McDaniel, M.D.; Saha, D.; Dumont, M.G.; Hernández, M.; Adams, M.A. The effect of land-use change on soil CH4 and N2O fluxes: A global meta-analysis. Ecosystems 2019, 22, 1424–1443. [Google Scholar] [CrossRef]
- Li, X.; Li, Y.; Li, F.; Ma, Q.; Zhang, P.; Yin, P. Changes in soil organic carbon, nutrients and aggregation after conversion of native desert soil into irrigated arable land. Soil Till. Res. 2009, 104, 263–269. [Google Scholar] [CrossRef]
- Hu, Y.; Wang, Z.; Zhang, Z.; Song, N.; Zhou, H.; Li, Y.; Wang, Y.; Li, C.; Hale, L. Alteration of desert soil microbial community structure in response to agricultural reclamation and abandonment. Catena 2021, 207, 105678. [Google Scholar] [CrossRef]
- Sun, J.; Liu, T. The age of the Taklimakan Desert. Science 2006, 312, 1621. [Google Scholar] [CrossRef]
- Liu, J.; Kuang, W.; Zhang, Z.; Xu, X.; Qin, Y.; Ning, J.; Zhou, W.; Zhang, S.; Li, R.; Yan, C.; et al. Spatiotemporal characteristics, patterns, and causes of land-use changes in China since the late 1980s. J. Geogr. Sci. 2014, 24, 195–210. [Google Scholar] [CrossRef]
- Kuang, W.; Gao, X.; Tenuta, M.; Ma, Z.; Gui, D.; Zeng, F. Soil property and cotton productivity changes with nutrient input intensity in the Taklimakan desert of China. Arid Land Res. Manag. 2018, 32, 421–437. [Google Scholar] [CrossRef]
- Tian, H.; Yang, J.; Xu, R.; Lu, C.; Canadell, J.G.; Davidson, E.A.; Jackson, R.B.; Arneth, A.; Chang, J.; Ciais, P.; et al. Global soil nitrous oxide emissions since the preindustrial era estimated by an ensemble of terrestrial biosphere models: Magnitude, attribution, and uncertainty. Glob. Chang. Biol. 2019, 25, 640–659. [Google Scholar] [CrossRef]
- Xia, F.; Mei, K.; Xu, Y.; Zhang, C.; Dahlgren, R.A.; Zhang, M. Response of N2O emission to manure application in field trials of agricultural soils across the globe. Sci. Total Environ. 2020, 733, 139390. [Google Scholar] [CrossRef]
- Zhu, S.; Vivanco, J.M.; Manter, D.K. Nitrogen fertilizer rate affects root exudation, the rhizosphere microbiome and nitrogen-use-efficiency of maize. Appl. Soil Ecol. 2016, 107, 324–333. [Google Scholar] [CrossRef]
- Spehn, E.M.; Joshi, J.; Schmid, B.; Alphei, J.; Körner, C. Plant diversity effects on soil heterotrophic activity in experimental grassland ecosystems. Plant. Soil. 2000, 224, 217–230. [Google Scholar] [CrossRef]
- Kuang, W.; Gao, X.; Tenuta, M.; Zeng, F. A global meta-analysis of nitrous oxide emission from drip-irrigated cropping system. Glob. Chang. Biol. 2021, 27, 3244–3256. [Google Scholar] [CrossRef] [PubMed]
- Scheer, C.; Wassmann, R.; Kienzler, K.; Ibragimov, N.; Eschanov, R. Nitrous oxide emissions from fertilized, irrigated cotton (Gossypium hirsutum L.) in the Aral Sea Basin, Uzbekistan: Influence of nitrogen applications and irrigation practices. Soil Biol. Biochem. 2008, 40, 290–301. [Google Scholar] [CrossRef]
- Ma, Z.; Gao, X.; Tenuta, M.; Kuang, W.; Gui, D.; Zeng, F. Urea fertigation sources affect nitrous oxide emission from a drip-fertigated cotton field in northwestern China. Agric. Ecosyst. Environ. 2018, 265, 22–30. [Google Scholar] [CrossRef]
- Kuang, W.; Gao, X.; Gui, D.; Tenuta, M.; Flaten, D.N.; Yin, M.; Zeng, F. Effects of fertilizer and irrigation management on nitrous oxide emission from cotton fields in an extremely arid region of northwestern China. Field Crops Res. 2018, 229, 17–26. [Google Scholar] [CrossRef]
- Li, Y.; Gao, X.; Tenuta, M.; Gui, D.; Li, X.; Xue, W.; Zeng, F. Enhanced efficiency nitrogen fertilizers were not effective in reducing N2O emissions from a drip-irrigated cotton field in arid region of Northwestern China. Sci. Total Environ. 2020, 748, 141543. [Google Scholar] [CrossRef]
- Lv, J.; Liu, X.; Liu, H.; Wang, X.; Li, K.; Tian, C.; Christie, P. Greenhouse gas intensity and net annual global warming potential of cotton cropping systems in an extremely arid region. Nutr. Cycl. Agroecosyst. 2014, 98, 15–26. [Google Scholar] [CrossRef]
- Afreh, D.; Zhang, J.; Guan, D.; Liu, K.; Song, Z.; Zheng, C.; Deng, A.; Feng, X.; Zhang, X.; Wu, Y.; et al. Long-term fertilization on nitrogen use efficiency and greenhouse gas emissions in a double maize cropping system in subtropical China. Soil Till. Res. 2018, 180, 259–267. [Google Scholar] [CrossRef]
- Liu, W.; Hussain, S.; Wu, L.; Qin, Z.; Li, X.; Lu, J.; Klan, F.; Cao, W.; Geng, M. Greenhouse gas emissions, soil quality, and crop productivity from a mono-rice cultivation system as influenced by fallow season straw management. Environ. Sci. Pollut. Res. 2016, 23, 315–328. [Google Scholar] [CrossRef] [PubMed]
- Shang, Z.; Abdalla, M.; Kuhnert, M.; Albanito, F.; Zhou, F.; Xia, L.; Smith, P. Measurement of N2O emissions over the whole year is necessary for estimating reliable emission factors. Environ. Pollut. 2020, 259, 113864. [Google Scholar] [CrossRef] [PubMed]
- Gao, W.; Gao, D.; Song, L.; Sheng, H.; Cai, T.; Liang, H. Contribution of the nongrowing season to annual N2O emissions from the permafrost wetland in Northeast China. Environ. Sci. Pollut. Res. 2022, 29, 61470–61487. [Google Scholar] [CrossRef] [PubMed]
- Chen, Z.; Yang, S.; Zhang, A.; Jing, X.; Song, W.; Mi, Z.; Zhang, Q.; Wang, W.; Yang, Z. Nitrous oxide emissions following seasonal freeze-thaw events from arable soils in Northeast China. J. Integr. Agric. 2018, 17, 231–246. [Google Scholar] [CrossRef]
- Yin, M.; Gao, X.; Tenuta, M.; Gui, D.; Zeng, F. Presence of spring-thaw N2O emissions are not linked to functional gene abundance in a drip-fertigated cropped soil in arid northwestern China. Sci. Total Environ. 2019, 695, 133670. [Google Scholar] [CrossRef] [PubMed]
- Gale, E.S.; Sullivan, D.M.; Cogger, C.G.; Bary, A.I.; Hemphill, D.D.; Myhre, E.A. Estimating plant-available nitrogen release from manures, composts, and specialty products. J. Environ. Qual. 2006, 35, 2321–2332. [Google Scholar] [CrossRef] [PubMed]
- Poulton, P.; Johnston, J.; Macdonald, A.; White, R.; Powlson, D. Major limitations to achieving “4 per 1000” increases in soil organic carbon stock in temperate regions: Evidence from long-term experiments at Rothamsted Research, United Kingdom. Glob. Chang. Biol. 2018, 24, 2563–2584. [Google Scholar] [CrossRef]
- Pedersen, A.R. HMR: Flux Estimation with Static Chamber data. R Package Version 0.3.1. 2011. Available online: https://cran.r-project.org/web/packages/HMR/index.html (accessed on 3 May 2021).
- Maharjan, B.; Venterea, R.T. Nitrite intensity explains N management effects on N2O emissions in maize. Soil Biol. Biochem. 2013, 66, 229–238. [Google Scholar] [CrossRef]
- Yue, P.; Cui, X.; Wu, W.; Gong, Y.; Li, K.; Misselbrook, T.; Liu, X. Are annual nitrous oxide fluxes sensitive to warming and increasing precipitation in the Gurbantunggut Desert? Land Degrad. Dev. 2021, 32, 1213–1223. [Google Scholar] [CrossRef]
- Dalal, R.C.; Allen, D.E. Greenhouse gas fluxes from natural ecosystems. Aust. J. Bot. 2008, 56, 369–407. [Google Scholar] [CrossRef]
- Wolf, B.; Zheng, X.; Brüggemann, N.; Chen, W.; Dannenmann, M.; Han, X.; Sutton, M.; Wu, H.; Yao, Z.; Butterbach-Bahl, K. Grazing-induced reduction of natural nitrous oxide release from continental steppe. Nature 2010, 464, 881–884. [Google Scholar] [CrossRef]
- Huang, C.; Zeng, F.; Lei, J. Cultivation effects on the carbon and nitrogen dynamics at depth in oasis farmlands of the Southern Tarim Basin, China. Soil Sci. Plant Nutr. 2015, 61, 287–294. [Google Scholar] [CrossRef]
- Qiu, W.; Liu, J.; Li, B.; Wang, Z. N2O and CO2 emissions from a dryland wheat cropping system with long-term N fertilization and their relationships with soil C, N, and bacterial community. Environ. Sci. Pollut. Res. 2020, 27, 8673–8683. [Google Scholar] [CrossRef] [PubMed]
- Geng, F.; Li, K.; Liu, X.; Gong, Y.; Yue, P.; Li, Y.; Han, W. Long-term effects of N deposition on N2O emission in an alpine grassland of Central Asia. Catena 2019, 182, 104100. [Google Scholar] [CrossRef]
- IPCC. Climate Change 2013: The Physical Science Basis; Cambridge University Press: New York, NY, USA, 2013. [Google Scholar]
- Shcherbak, I.; Millar, N.; Robertson, G.P. Global metaanalysis of the nonlinear response of soil nitrous oxide (N2O) emissions to fertilizer nitrogen. Proc. Natl. Acad. Sci. USA 2014, 111, 9199–9204. [Google Scholar] [CrossRef] [PubMed]
- Davidson, E.A.; Vitousek, P.M.; Matson, P.A.; Riley, R.; García-Méndez, G.; Maass, J.M. Soil emissions of nitric oxide in a seasonally dry tropical forest of Mexico. J. Geophys. Res.-Atmos. 1991, 96, 15439–15445. [Google Scholar] [CrossRef]
- Li, F.; Liu, J.; Ren, W.; Liu, L. Land-use change alters patterns of soil biodiversity in arid lands of northwestern China. Plant Soil. 2018, 428, 371–388. [Google Scholar] [CrossRef]
- Wang, Z.; Liu, Y.; Zhao, L.; Zhang, W.; Liu, L. Change of soil microbial community under long-term fertilization in a reclaimed sandy agricultural ecosystem. PeerJ 2019, 7, e6497. [Google Scholar] [CrossRef]
- Zhao, S.; Li, K.; Zhou, W.; Qiu, S.; Huang, S.; He, P. Changes in soil microbial community, enzyme activities and organic matter fractions under long-term straw return in north-central China. Agric. Ecosyst. Environ. 2016, 216, 82–88. [Google Scholar] [CrossRef]
- Liu, S.; Wang, M.; Yin, M.; Chu, G.; Xu, C.; Zhang, X.; Aliz, B.; Tang, C.; Wang, D.; Chen, S. Fifteen years of crop rotation combined with straw management alters the nitrogen supply capacity of upland-paddy soil. Soil Till. Res. 2022, 215, 105219. [Google Scholar] [CrossRef]
- Meng, L.; Ding, W.; Cai, Z. Long-term application of organic manure and nitrogen fertilizer on N2O emissions, soil quality and crop production in a sandy loam soil. Soil Biol. Biochem. 2005, 37, 2037–2045. [Google Scholar] [CrossRef]
- Su, Y.; Yang, R.; Liu, W.; Wang, X. Evolution of soil structure and fertility after conversion of native sandy desert soil to irrigated cropland in arid region, China. Soil Sci. 2010, 175, 246–254. [Google Scholar] [CrossRef]
- Yao, Z.; Zhou, Z.; Zheng, X.; Xie, B.; Mei, B.; Wang, R.; Butterbach-Bahl, K.; Zhu, J. Effects of organic matter incorporation on nitrous oxide emissions from rice-wheat rotation ecosystems in China. Plant Soil 2010, 327, 315–330. [Google Scholar] [CrossRef]
- Lebender, U.; Senbayram, M.; Lammel, J.; Kuhlmann, H. Impact of mineral N fertilizer application rates on N2O emissions from arable soils under winter wheat. Nutr. Cycl Agroecosyst. 2014, 100, 111–120. [Google Scholar] [CrossRef]
- Lin, X.; Wang, S.; Ma, X.; Xu, G.; Luo, C.; Li, Y.; Jiang, G.; Xie, Z. Fluxes of CO2, CH4, and N2O in an alpine meadow affected by yak excreta on the Qinghai-Tibetan plateau during summer grazing periods. Soil Biol. Biochem. 2009, 41, 718–725. [Google Scholar] [CrossRef]
- Schaufler, G.; Kitzler, B.; Schindlbacher, A.; Skiba, U.; Sutton, M.A.; Zechmeister-Boltenstern, S. Greenhouse gas emissions from European soils under different land use: Effects of soil moisture and temperature. Eur. J. Soil Sci. 2010, 61, 683–696. [Google Scholar] [CrossRef]
- Yan, R.; Tang, H.; Xin, X.; Chen, B.; Murray, P.J.; Yan, Y.; Wang, X.; Yang, G. Grazing intensity and driving factors affect soil nitrous oxide fluxes during the growing seasons in the Hulunber meadow steppe of China. Environ. Res. Lett. 2016, 11, 054004. [Google Scholar] [CrossRef]
Publisher’s Note: MDPI stays neutral with regard to jurisdictional claims in published maps and institutional affiliations. |
© 2022 by the authors. Licensee MDPI, Basel, Switzerland. This article is an open access article distributed under the terms and conditions of the Creative Commons Attribution (CC BY) license (https://creativecommons.org/licenses/by/4.0/).