Article

Assessment of Lockdown Effectiveness during COVID-19 Pandemic Using Air Pollution Data in Armenia in March–June 2019 and 2020: A Cross-Sectional Study

by
Aelita Sargsyan
1,*,
Narek Galstyan
2,
Hamazasp Nahatakyan
2 and
Maria Manuela Morales-Suárez-Varela
3,4
1
Doctoral Program in Pollution, Toxicology and Environmental Health, Faculty of Biological Sciences, University of Valencia, c/Dr. Moliner, 50, Burjassot, 46100 Valencia, Spain
2
Department of Healthcare Policy, Ministry of Health of Armenia, Governmental Building N 3, Yerevan 0010, Armenia
3
Area of Preventive Medicine and Public Health, Department of Preventive Medicine and Public Health, Food Sciences, Toxicology and Legal Medicine, School of Pharmacy, University de Valencia, Avenida Vi-cent Andres Estelles s/n, 46100 Valencia, Spain
4
Biomedical Research Center Network on Epidemiology and Public Health (CIBERESP), Institute of Health Carlos III, Avenida Monforte de Lemos, 3-5, Pabellón 11, Planta 0, 28029 Madrid, Spain
*
Author to whom correspondence should be addressed.
Atmosphere 2022, 13(10), 1563; https://doi.org/10.3390/atmos13101563
Submission received: 18 August 2022 / Revised: 13 September 2022 / Accepted: 20 September 2022 / Published: 24 September 2022

Abstract

:
Various methods used by different countries’ governments to control the spread of coronavirus disease 2019 (COVID-19), the cause of pandemic in 2020, affected air quality. The aim of this study was to evaluate the effects of lockdown in Armenia on the content of the main air pollutants—dust, SO2 and NO2. This was a cross-sectional study. We analyzed data on the concentrations of SO2, NO2 and dust from March to June, 2019 and the same period in 2020 as well as data on positive COVID-19 cases from Yerevan, Vanadzor and Hrazdan. In 2020, dust was found to be lower in Yerevan and in Hrazdan and higher in Vanadzor than in the same period in 2019. The same pattern was present for SO2 concentrations: in Yerevan and Hrazdan there was a decrease, and there was an increase in Vanadzor. The concentrations of NO2 increased in Yerevan and Hrazdan, with a slight decrease in Vanadzor. New cases of COVID-19 had a negative correlation with dust and a positive correlation with SO2. The strict quarantine measures were effective in containing the spread of COVID-19.

1. Introduction

Coronavirus disease 2019 (COVID-19), caused by the novel severe acute respiratory syndrome coronavirus 2 (SARS-CoV-2), was first found in China in December 2019 and quickly grew into a global pandemic [1]. As of 13 September 2022, SARS-CoV-2 was spread over 230 countries, territories or areas, infecting nearly 614 million individuals and resulting in over 6,517,000 deaths globally [2]. Armenia had over 439,000 confirmed COVID-19 cases and 8600 deaths reported in the country by the same date [3].
In order to contain the spread of SARS-CoV-2 infection, governments around the world took action. As there were neither effective prevention (vaccine) nor treatment (antiviral) measures available for COVID-19, the public health authorities suggested non-pharmaceutical interventions—emergency lockdowns, quarantine of suspected cases, isolation and hospitalization of confirmed cases, contact tracing, social distancing, mass testing, mandatory use of face masks, etc.—for controlling and mitigating the spread of the pandemic [4,5,6]. Reduction of the infection rate (flattening the epidemic curve) [7] through the prevention of person-to-person transmission of SARS-CoV-2 has been the key strategy to reduce morbidity and mortality from COVID-19 [8,9]. This approach was guided by evidence of the effectiveness of similar non-pharmaceutical interventions during previous influenza pandemics [10,11,12,13]. Social distancing measures were adopted as a primary tool for curbing the pandemic via the reduction of interpersonal contact [4,5,6]. These policies included the closure of educational institutions, public places, non-essential businesses and workplaces; the cancellation and restriction of mass gatherings and group events; the restriction of travel; stay-at-home orders; practicing physical distancing (six or three feet) from people outside from their household; etc. [4,6,14,15,16,17]. A state of emergency and a complete lockdown was implemented in Armenia from 16 March to 4 May 2020 [18].
Before COVID-19, high levels of urban air pollution, mainly through concentrations of sulfur dioxide (SO2), nitrogen dioxide (NO2) and particulate matter (PM)/dust, were observed around the world. According to a European Environmental Agency evaluation in 2019, the main sources of air pollution were energy consumption (responsible for about 28% of dust (PM10 and PM2.5)), agriculture (responsible for 94% of ammonia and 55% of methane emissions), road transport (36% of nitrogen oxides), energy supply (46% of sulfur oxides), manufacturing industry (air pollution with heavy metals) and anthropogenic factors [19]. Although the pollutants can be generated by natural processes (e.g., sand, volcanic ash and fog), their appearance and then suspension in the air is mainly a result of human activities together with technology and the energy matrix, including transport, industries, power stations etc. [20,21]. Before COVID-19, the emission of carbon dioxide (CO2) was increasing by 1% per year. During the lockdown, CO2 emission decreased by 17% (11 to 25%) by 7 April 2020 compared to the mean emissions in 2019 [22]. Similar effects were witnessed all around the world. Different studies showed that after countries adopted strict lockdown measures to contain COVID-19, emissions of dust, SO2 and NO2 were significantly reduced, improving air quality [23,24]. In the countries of Latin America, SO2 concentrations decreased in Mexico and Lima, NO2 concentrations in Lima and Santiago and PM in Bogota and Quito. European countries (e.g., Serbia, Croatia) and cities (e.g., Madrid, Paris, Milan etc.) also witnessed a decrease in SO2, NO2 and PM concentrations in the air after lockdown [21,25]. Ambient PM and NO2 were reduced during the social distancing period in 2020 in Korea. Concentrations of SO2 were not observed to be attributable to social distancing in response [26].
Different studies have assessed the effect of COVID-19 lockdowns on PM concentrations in various parts of the world, showing that the quarantine periods had a significant impact on the environment and on the air quality of cities. Research showed decreased PM in Barcelona (Spain), Krakow (Poland), Milan (Italy), Delhi (India), Tehran (Iran) and 50 other cities around the world [27,28,29,30,31,32]. Journal Special Issues of journals were dedicated to research on air quality in pre- and post-COVID-19 eras, showing the changes of not only the ambient air, but also the indoor air in different parts of the world [33].
According to World Bank data, since 2011 the air pollution in Armenia has been decreasing, with the annual average PM2.5 concentration of about 39.0 in 2011 decreasing to 34.3 µg/m3 in 2017 [34]. The 2019 World Air Quality Report showed Armenia to have reached an annual average PM2.5 concentration of 25.5 µg/m3 and 24.9 µg/m3 in 2020, but in the next report (2021) Armenia ranked 6th among 13 countries in the region in terms of pollution, with an annual average PM2.5 concentration equal to 33.9 µg/m3, exceeding the recommended WHO concentration (5 µg/m3) by more than six-fold [35,36].
The objectives of the present study were as follows:
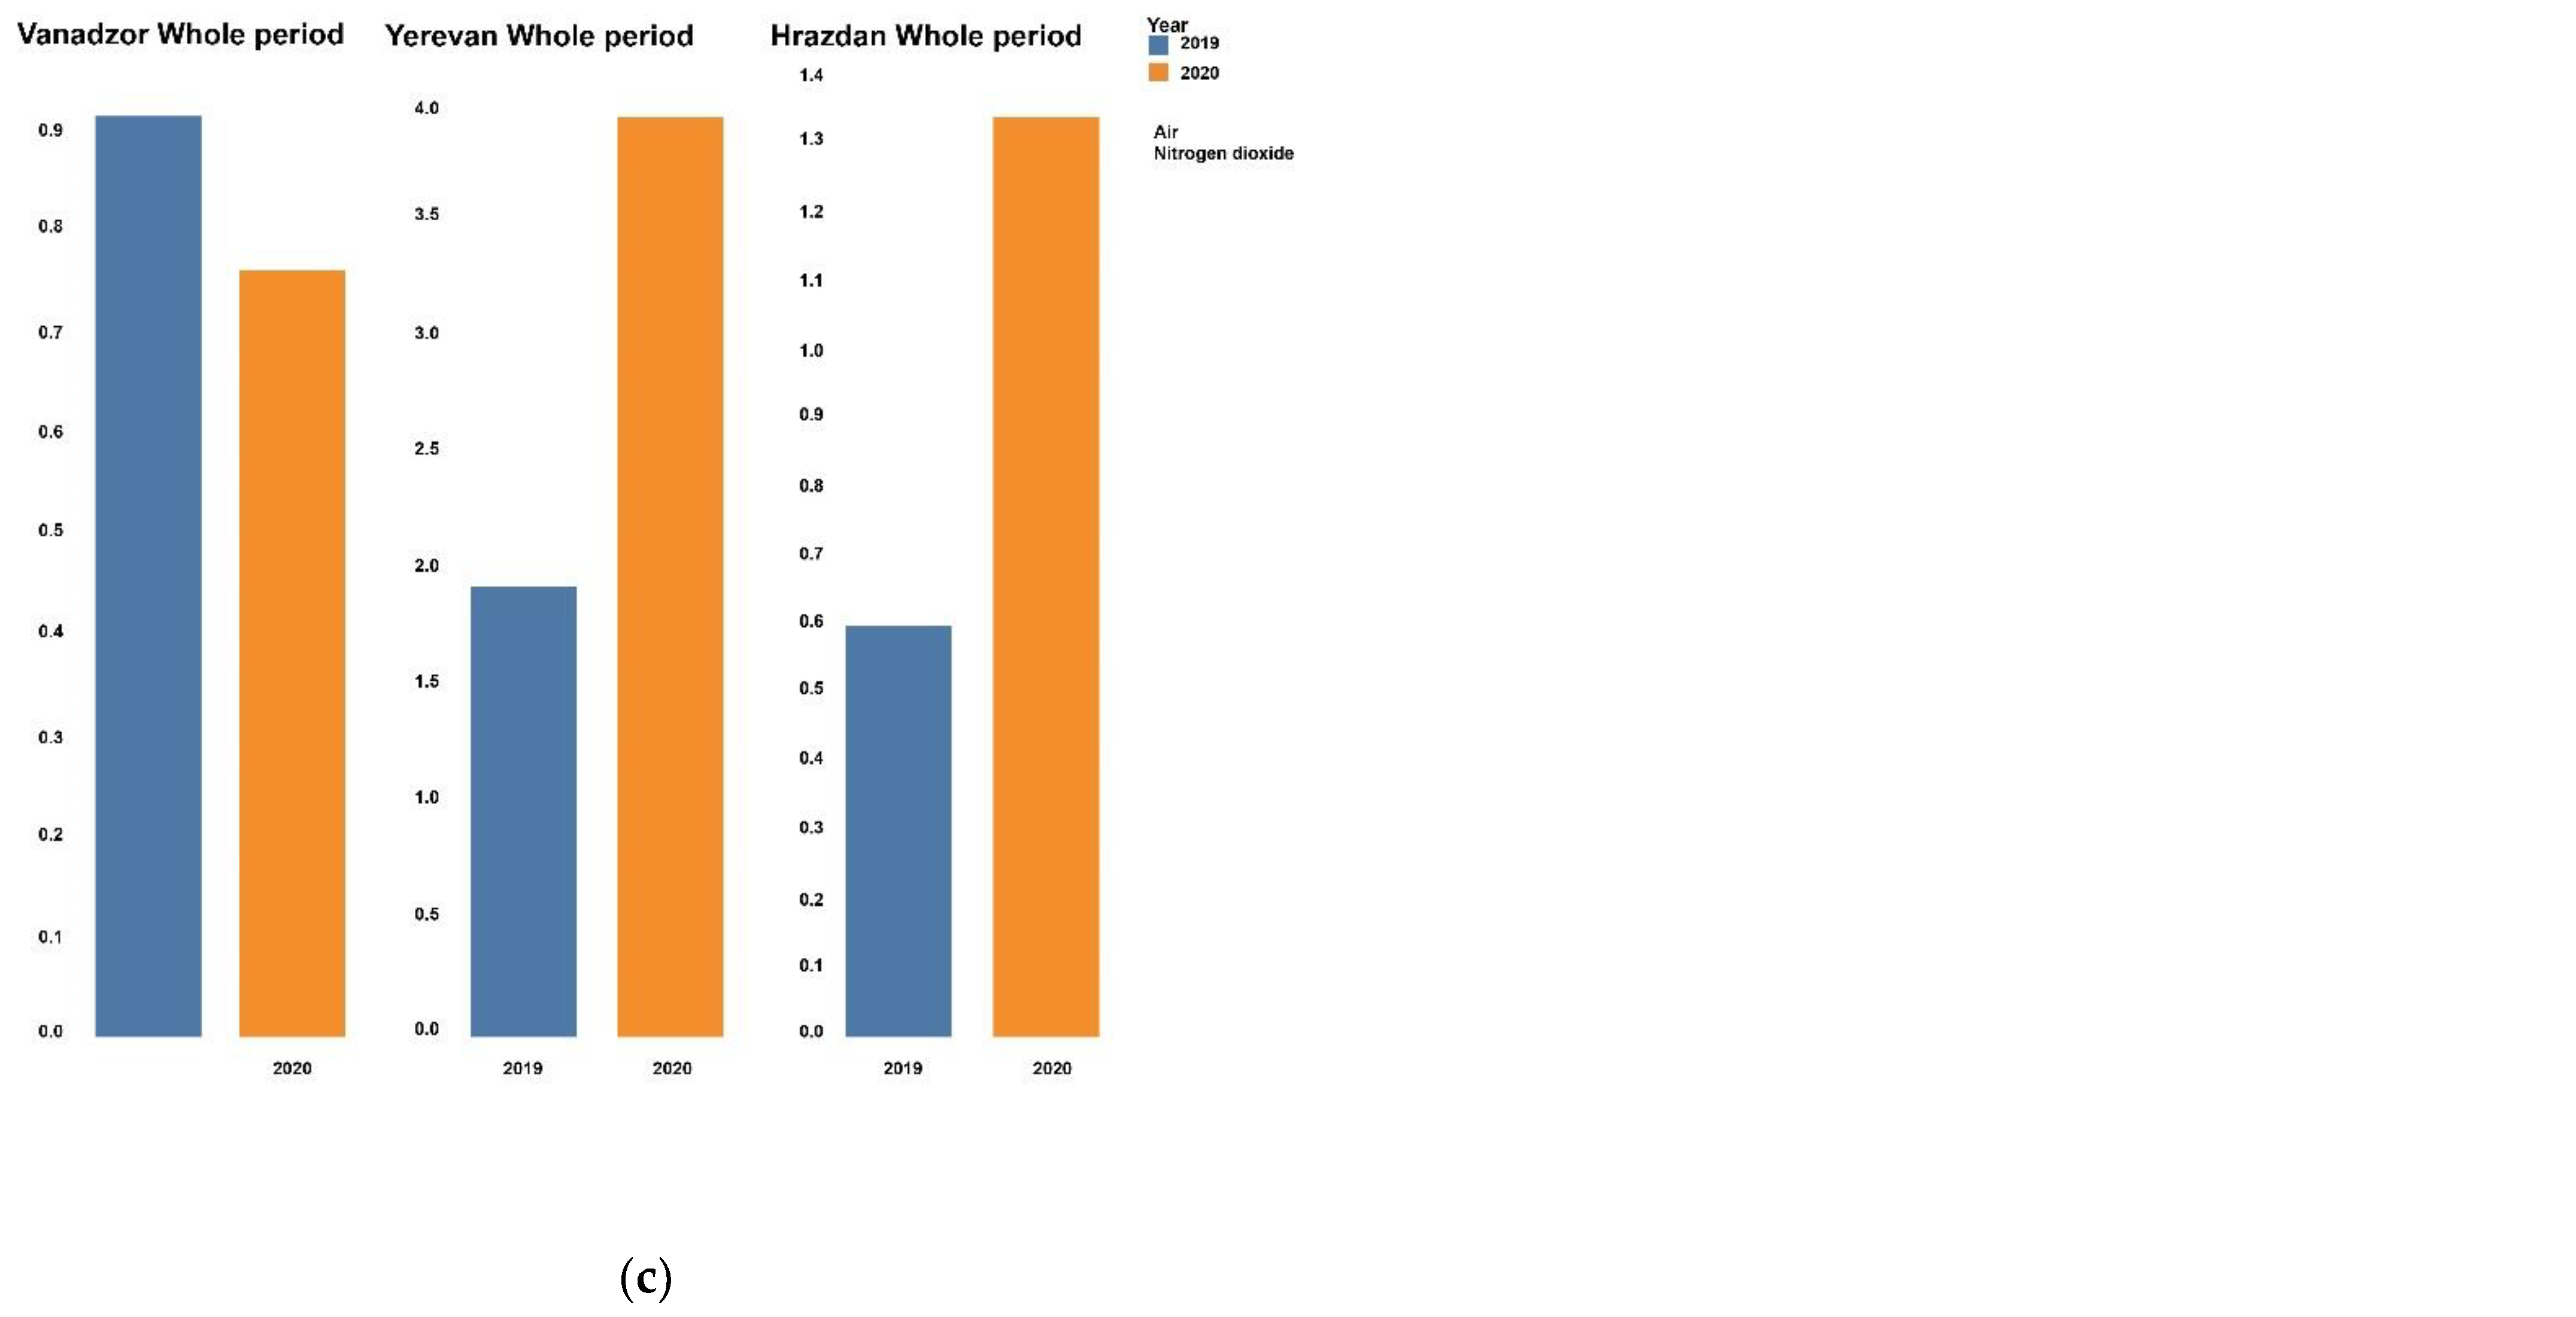
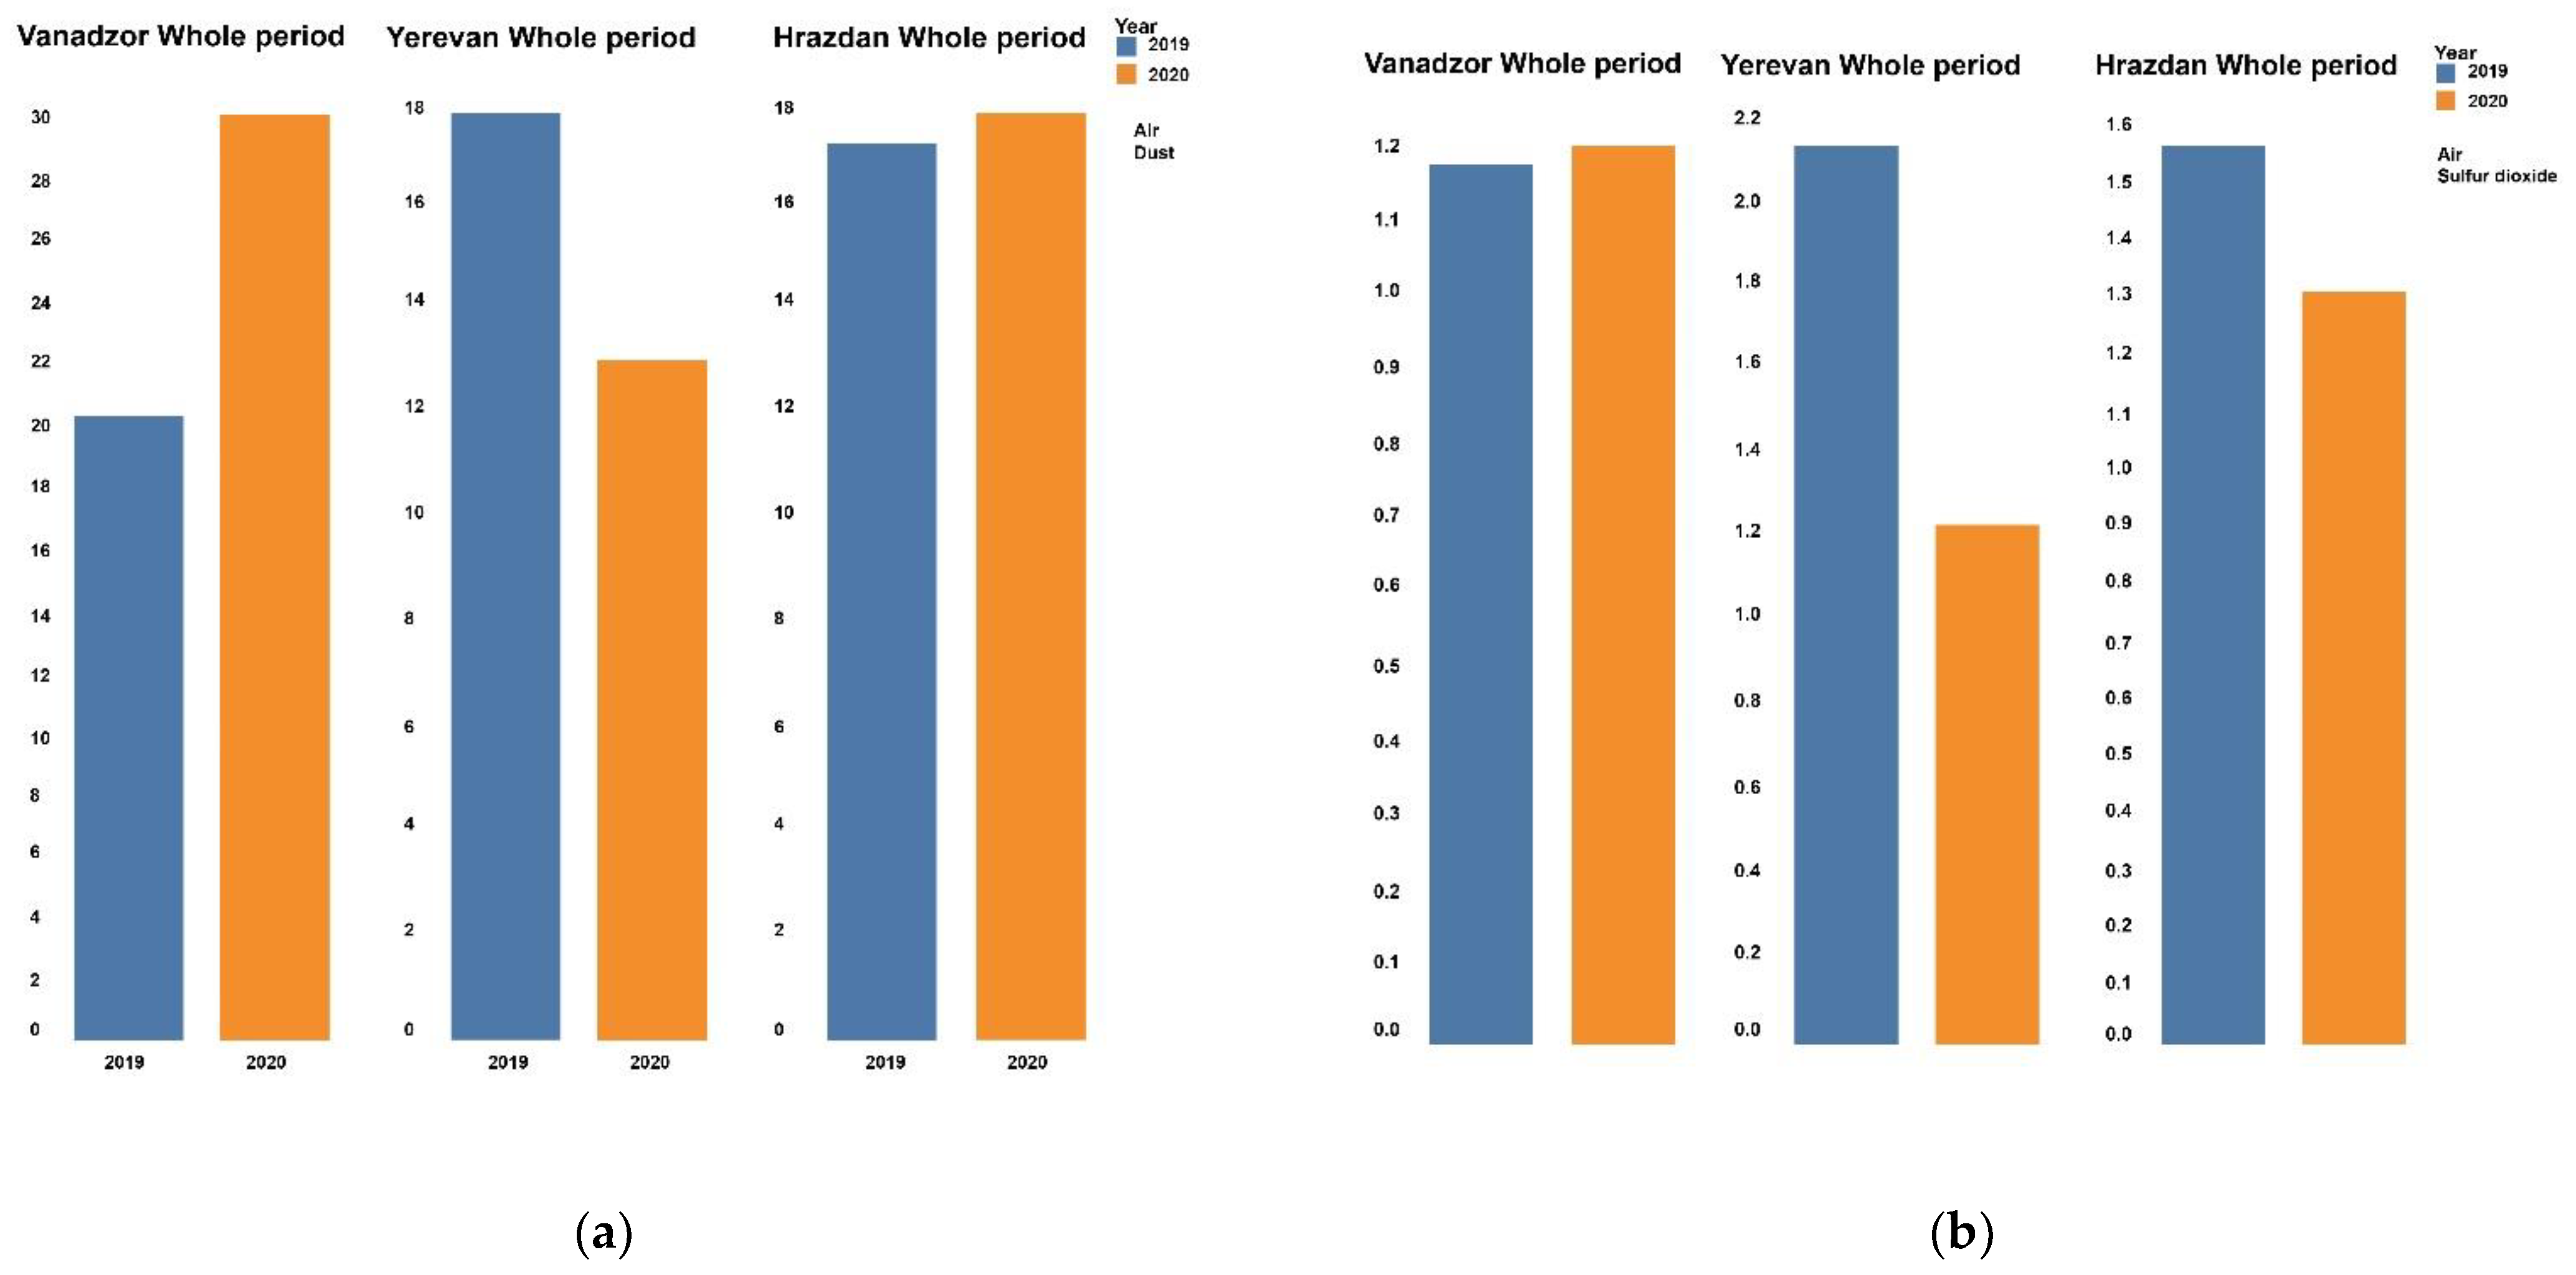
  • To estimate the change of air pollution (SO2, NO2 and dust) in the capital and two regional centers during the full lockdown (16 March–14 May 2020).
  • To assess the differences in the values compared with the same period in 2019.
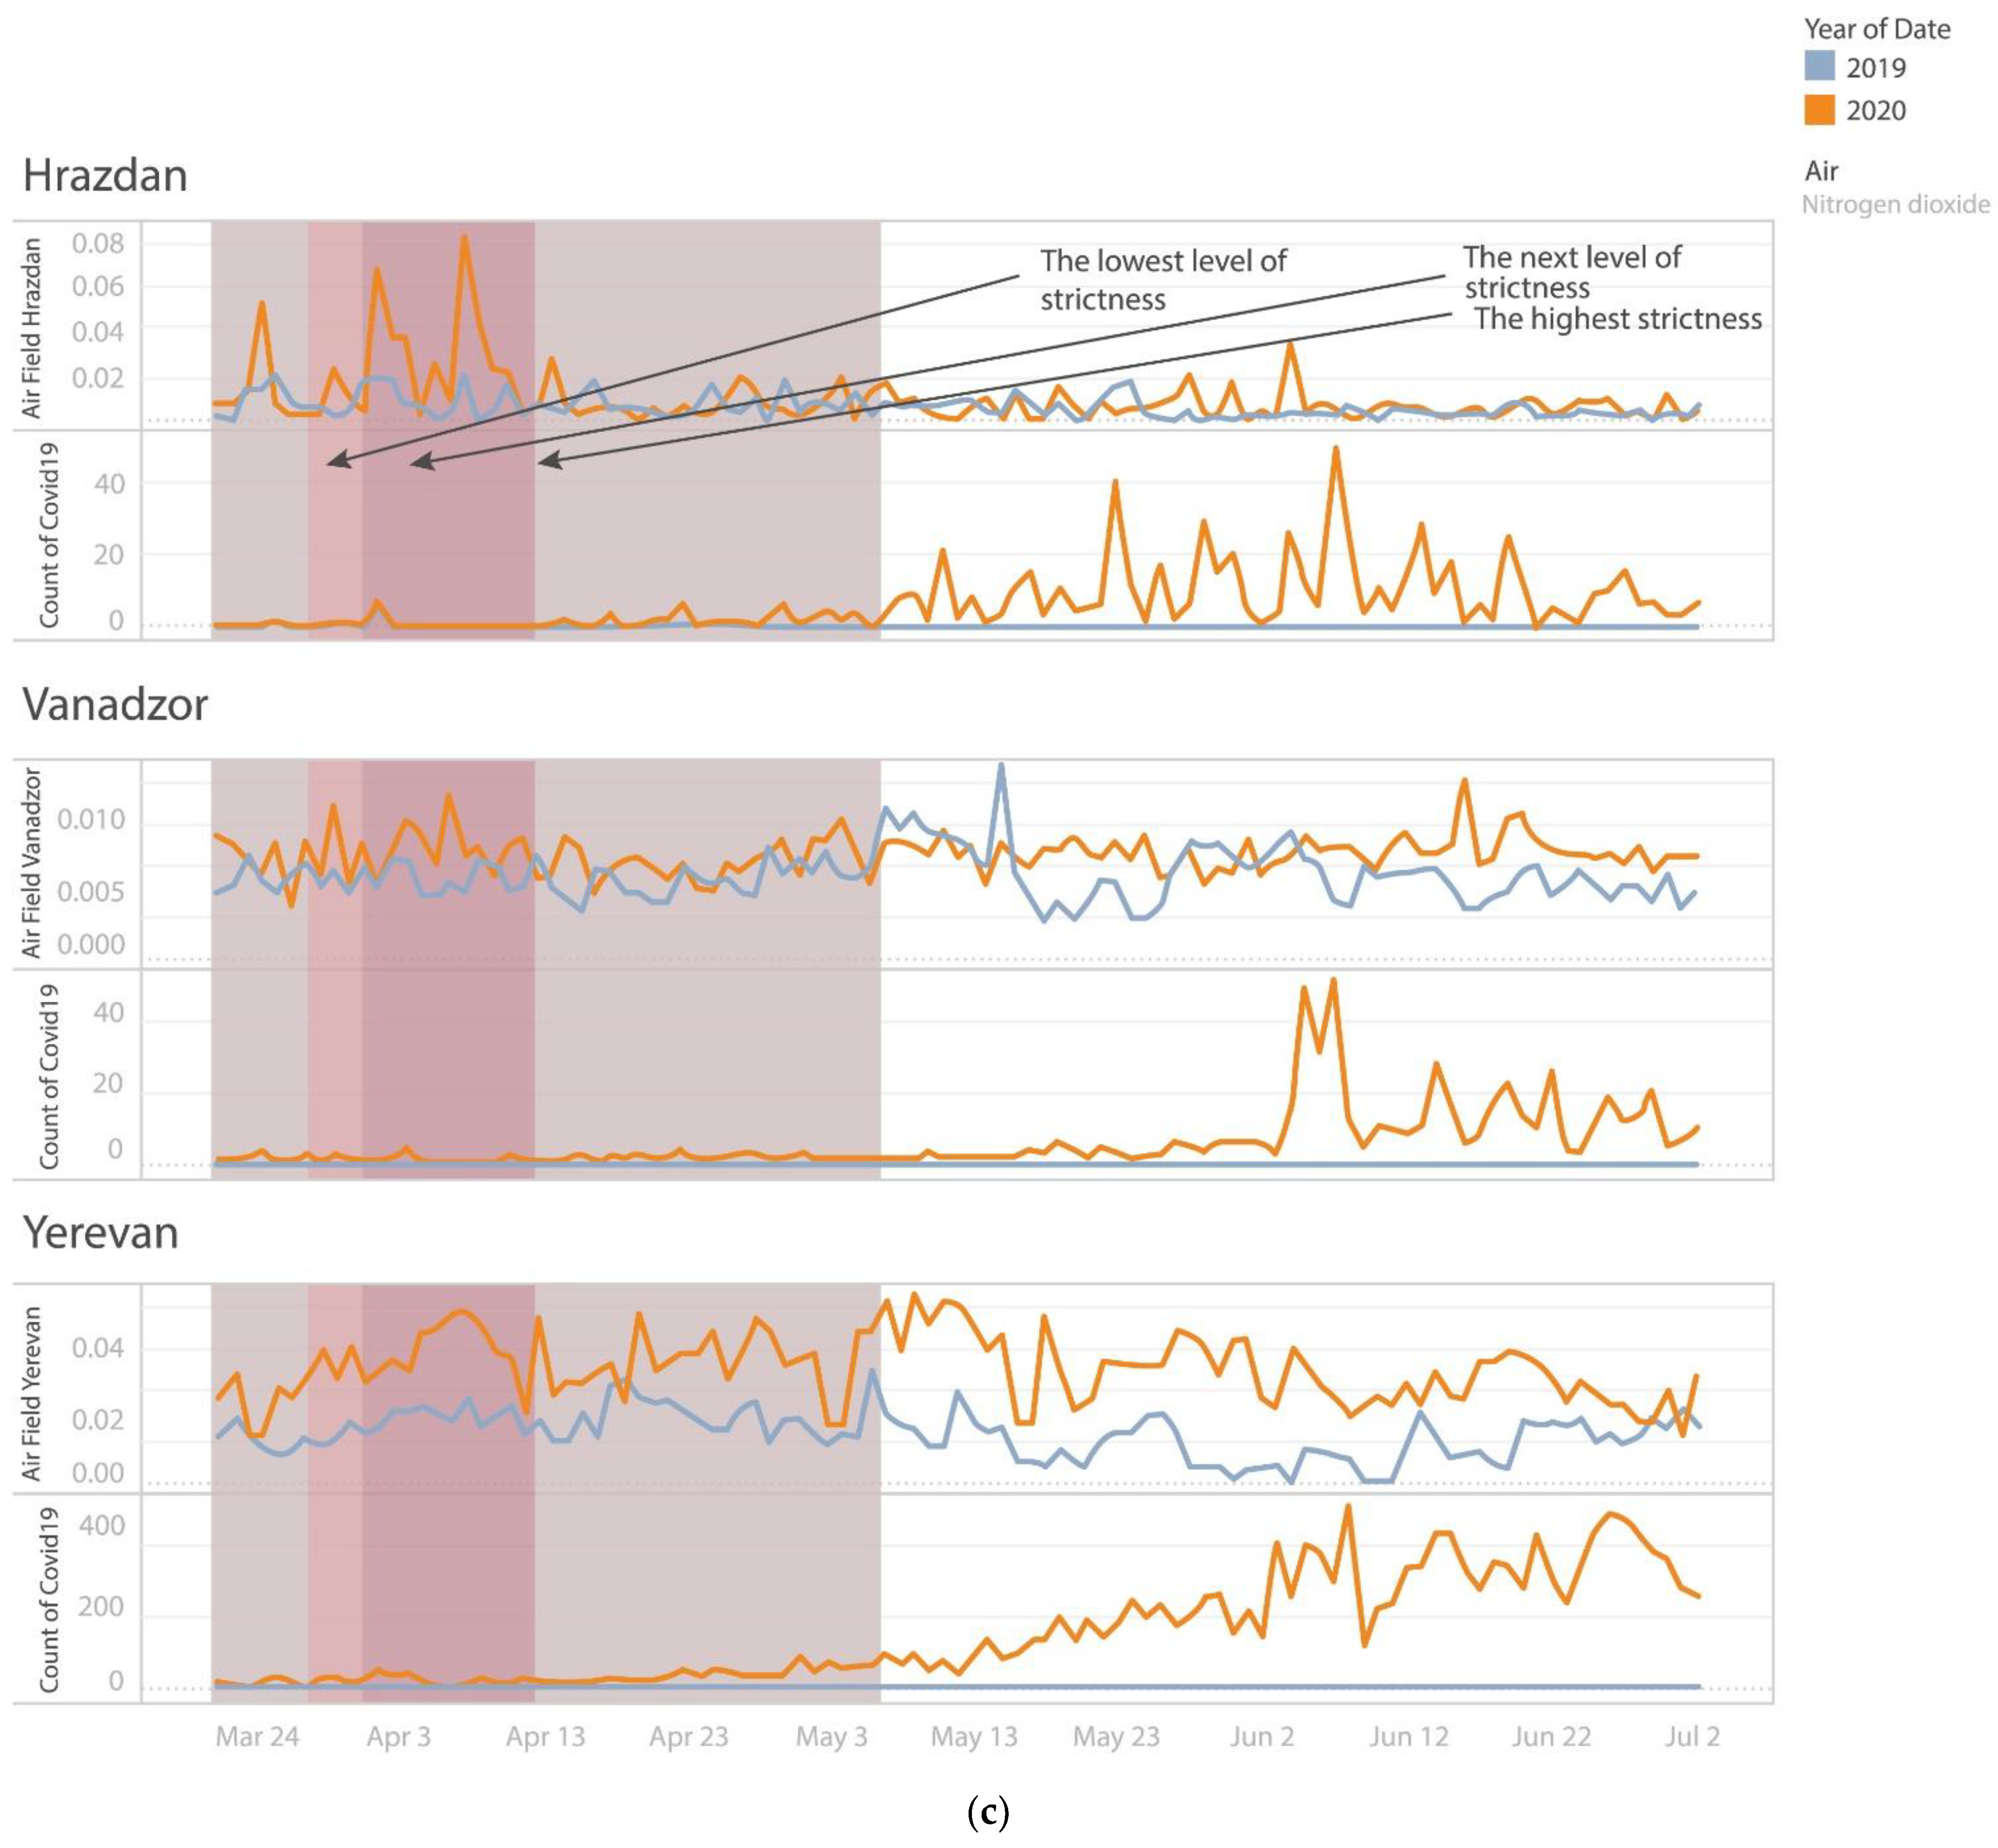
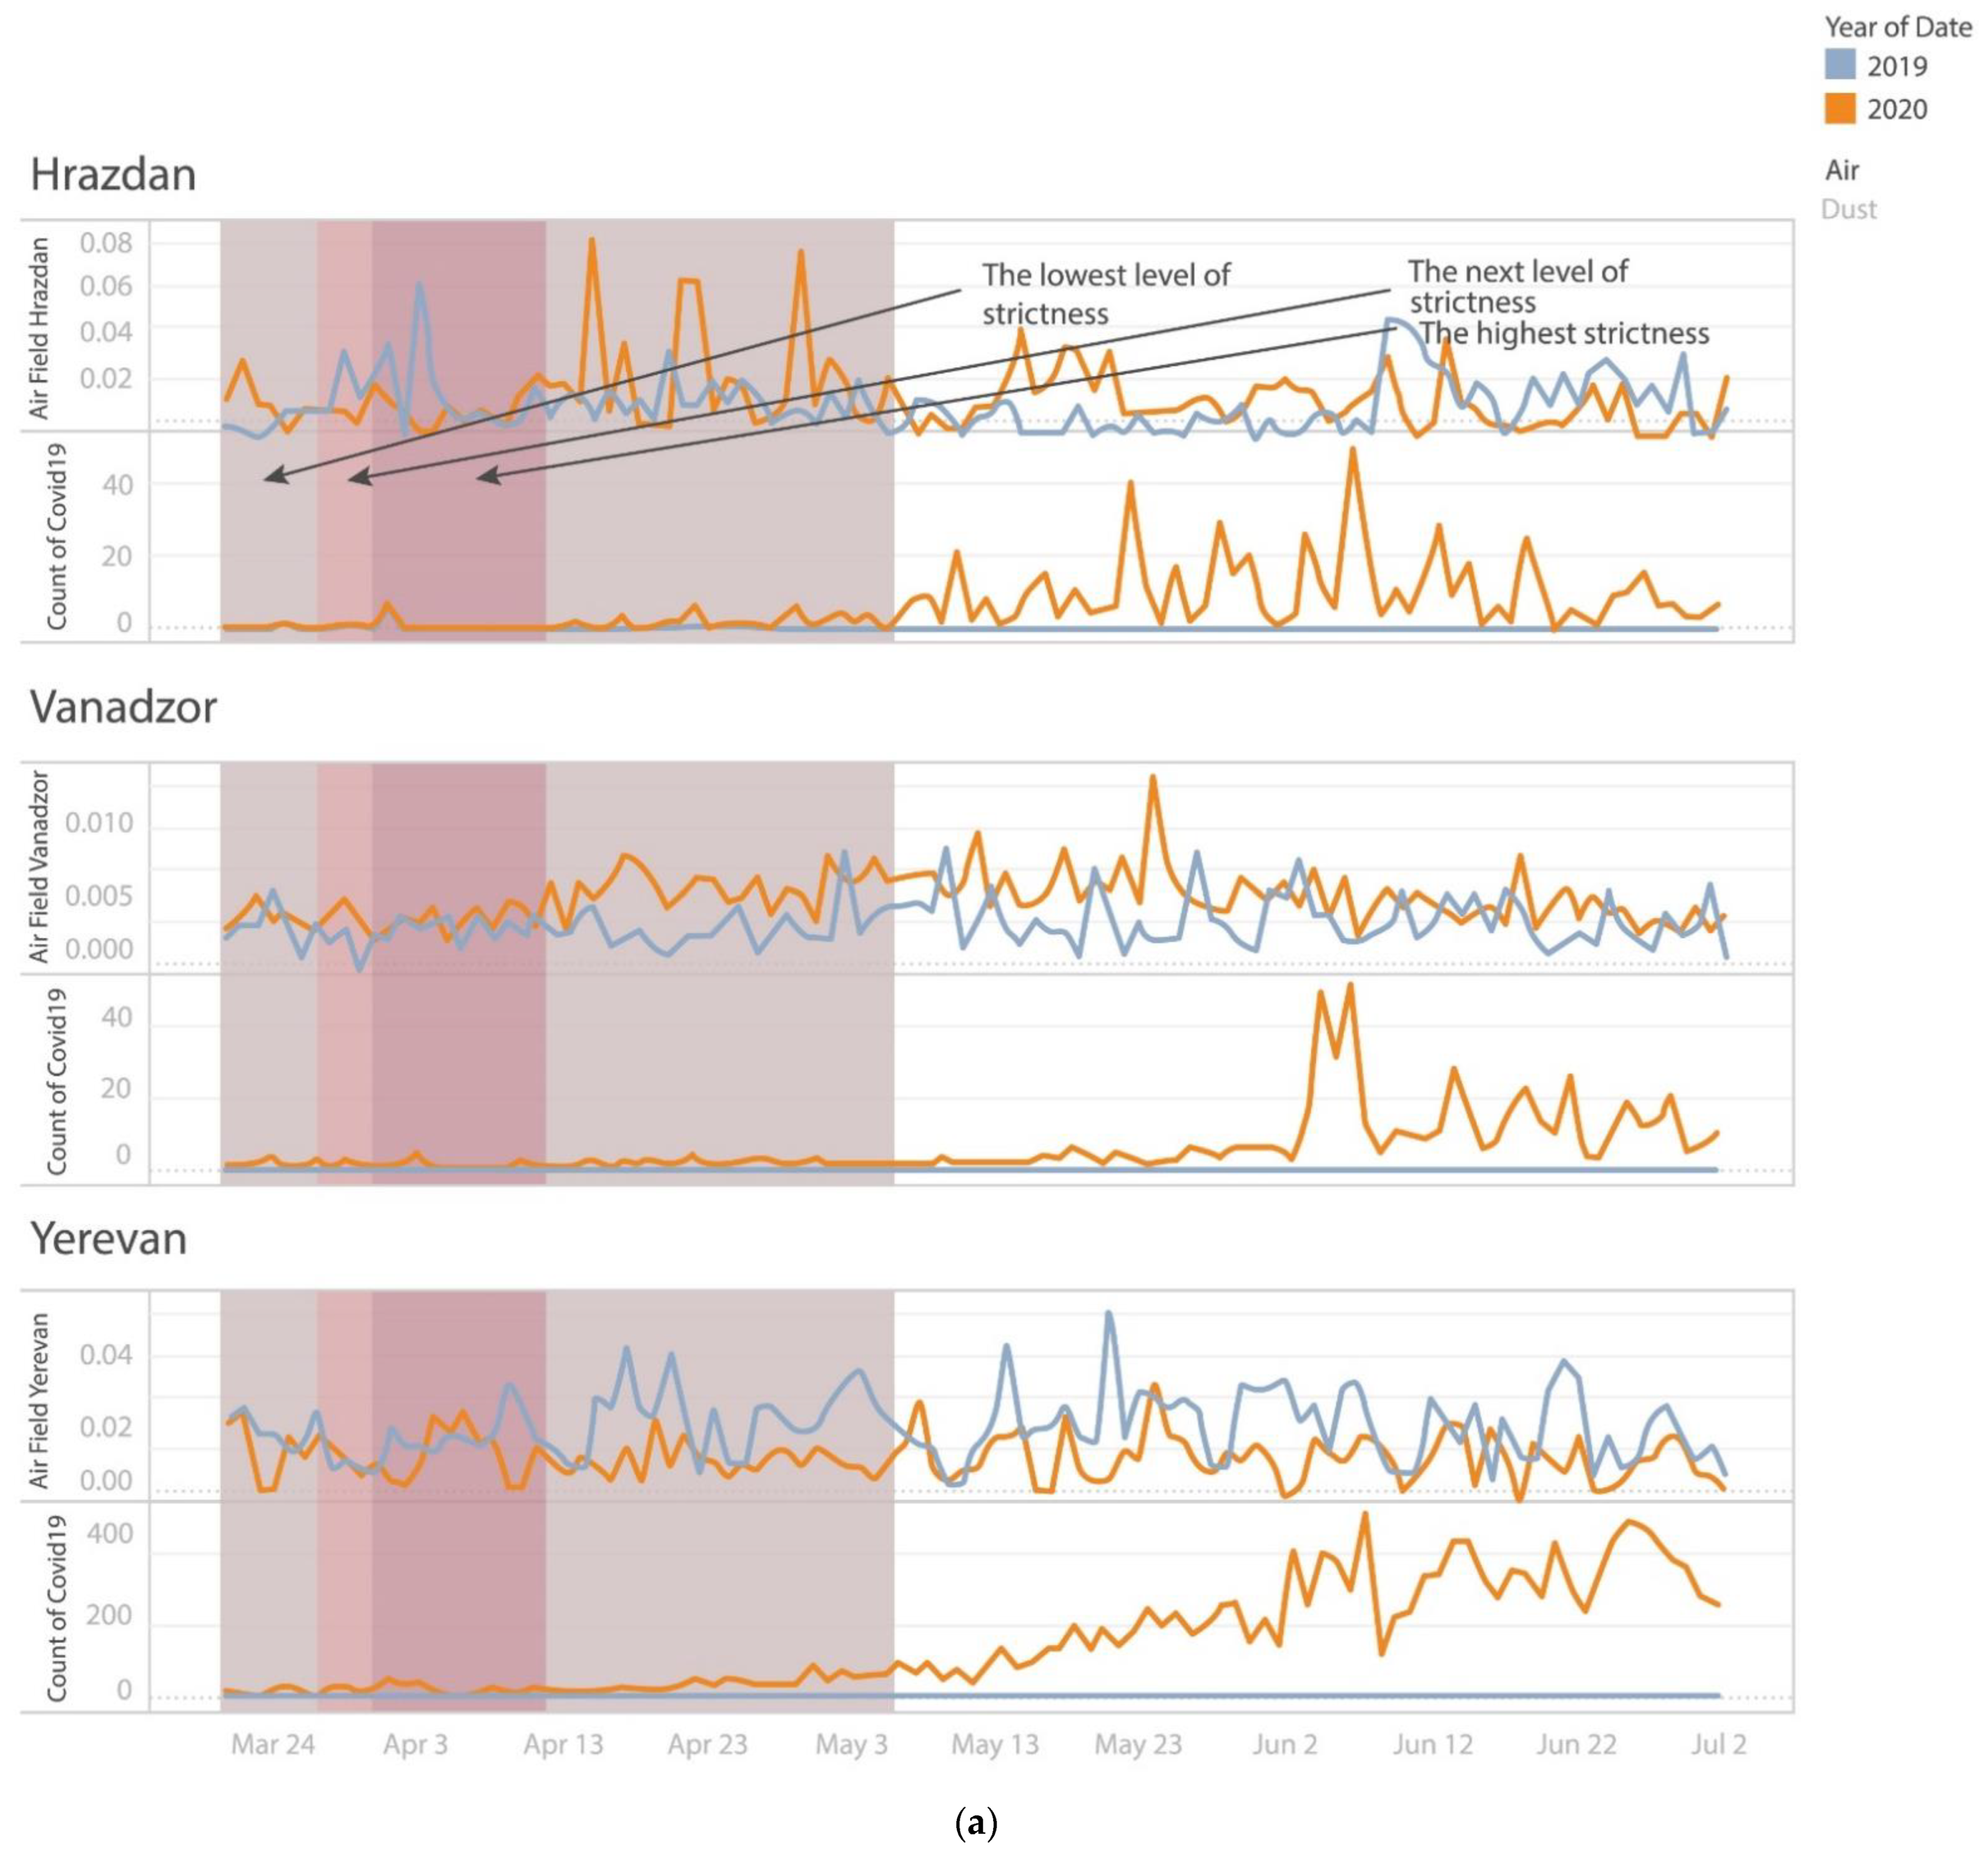
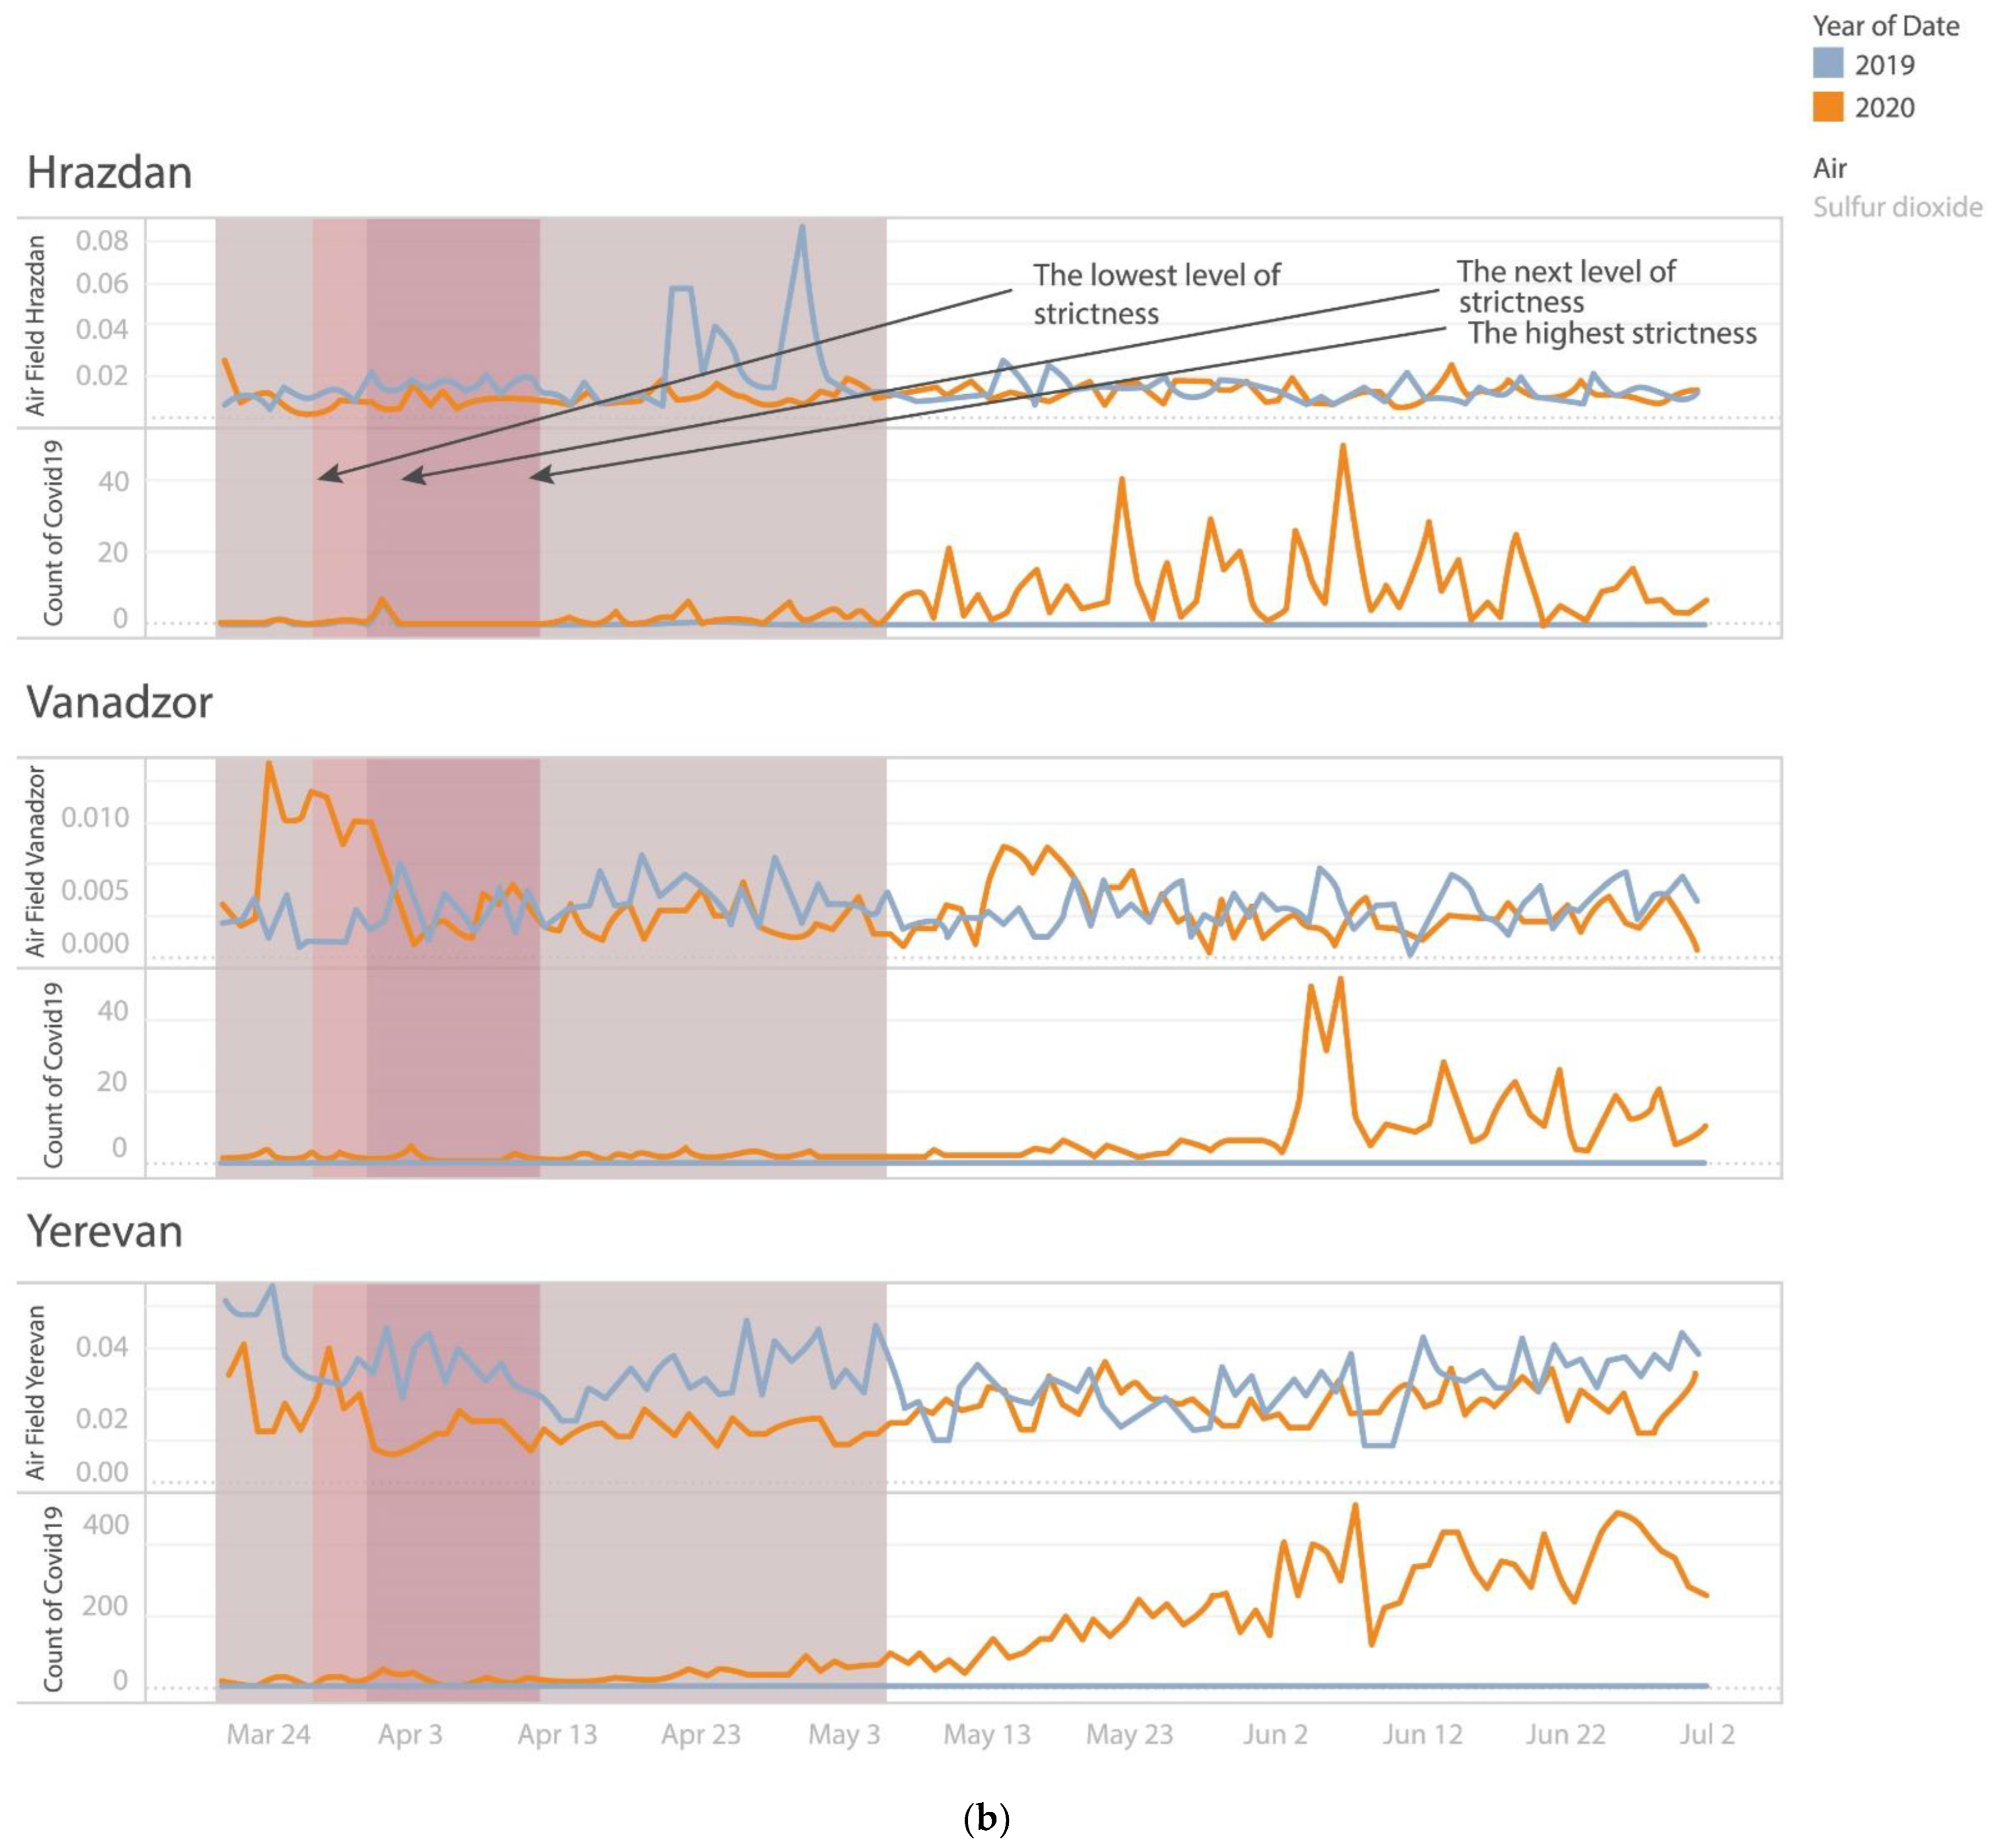
  • To take air pollution as a proxy measure for compliance with governmental regulations to find the difference in numbers of new cases of COVID-19 in the capital and in the regional centers.
With these objectives, we answered the following research questions:
  • How did the air quality change in the observed cities during the lockdown?
  • How was the air quality different in March–June 2020 from the same period in 2019?
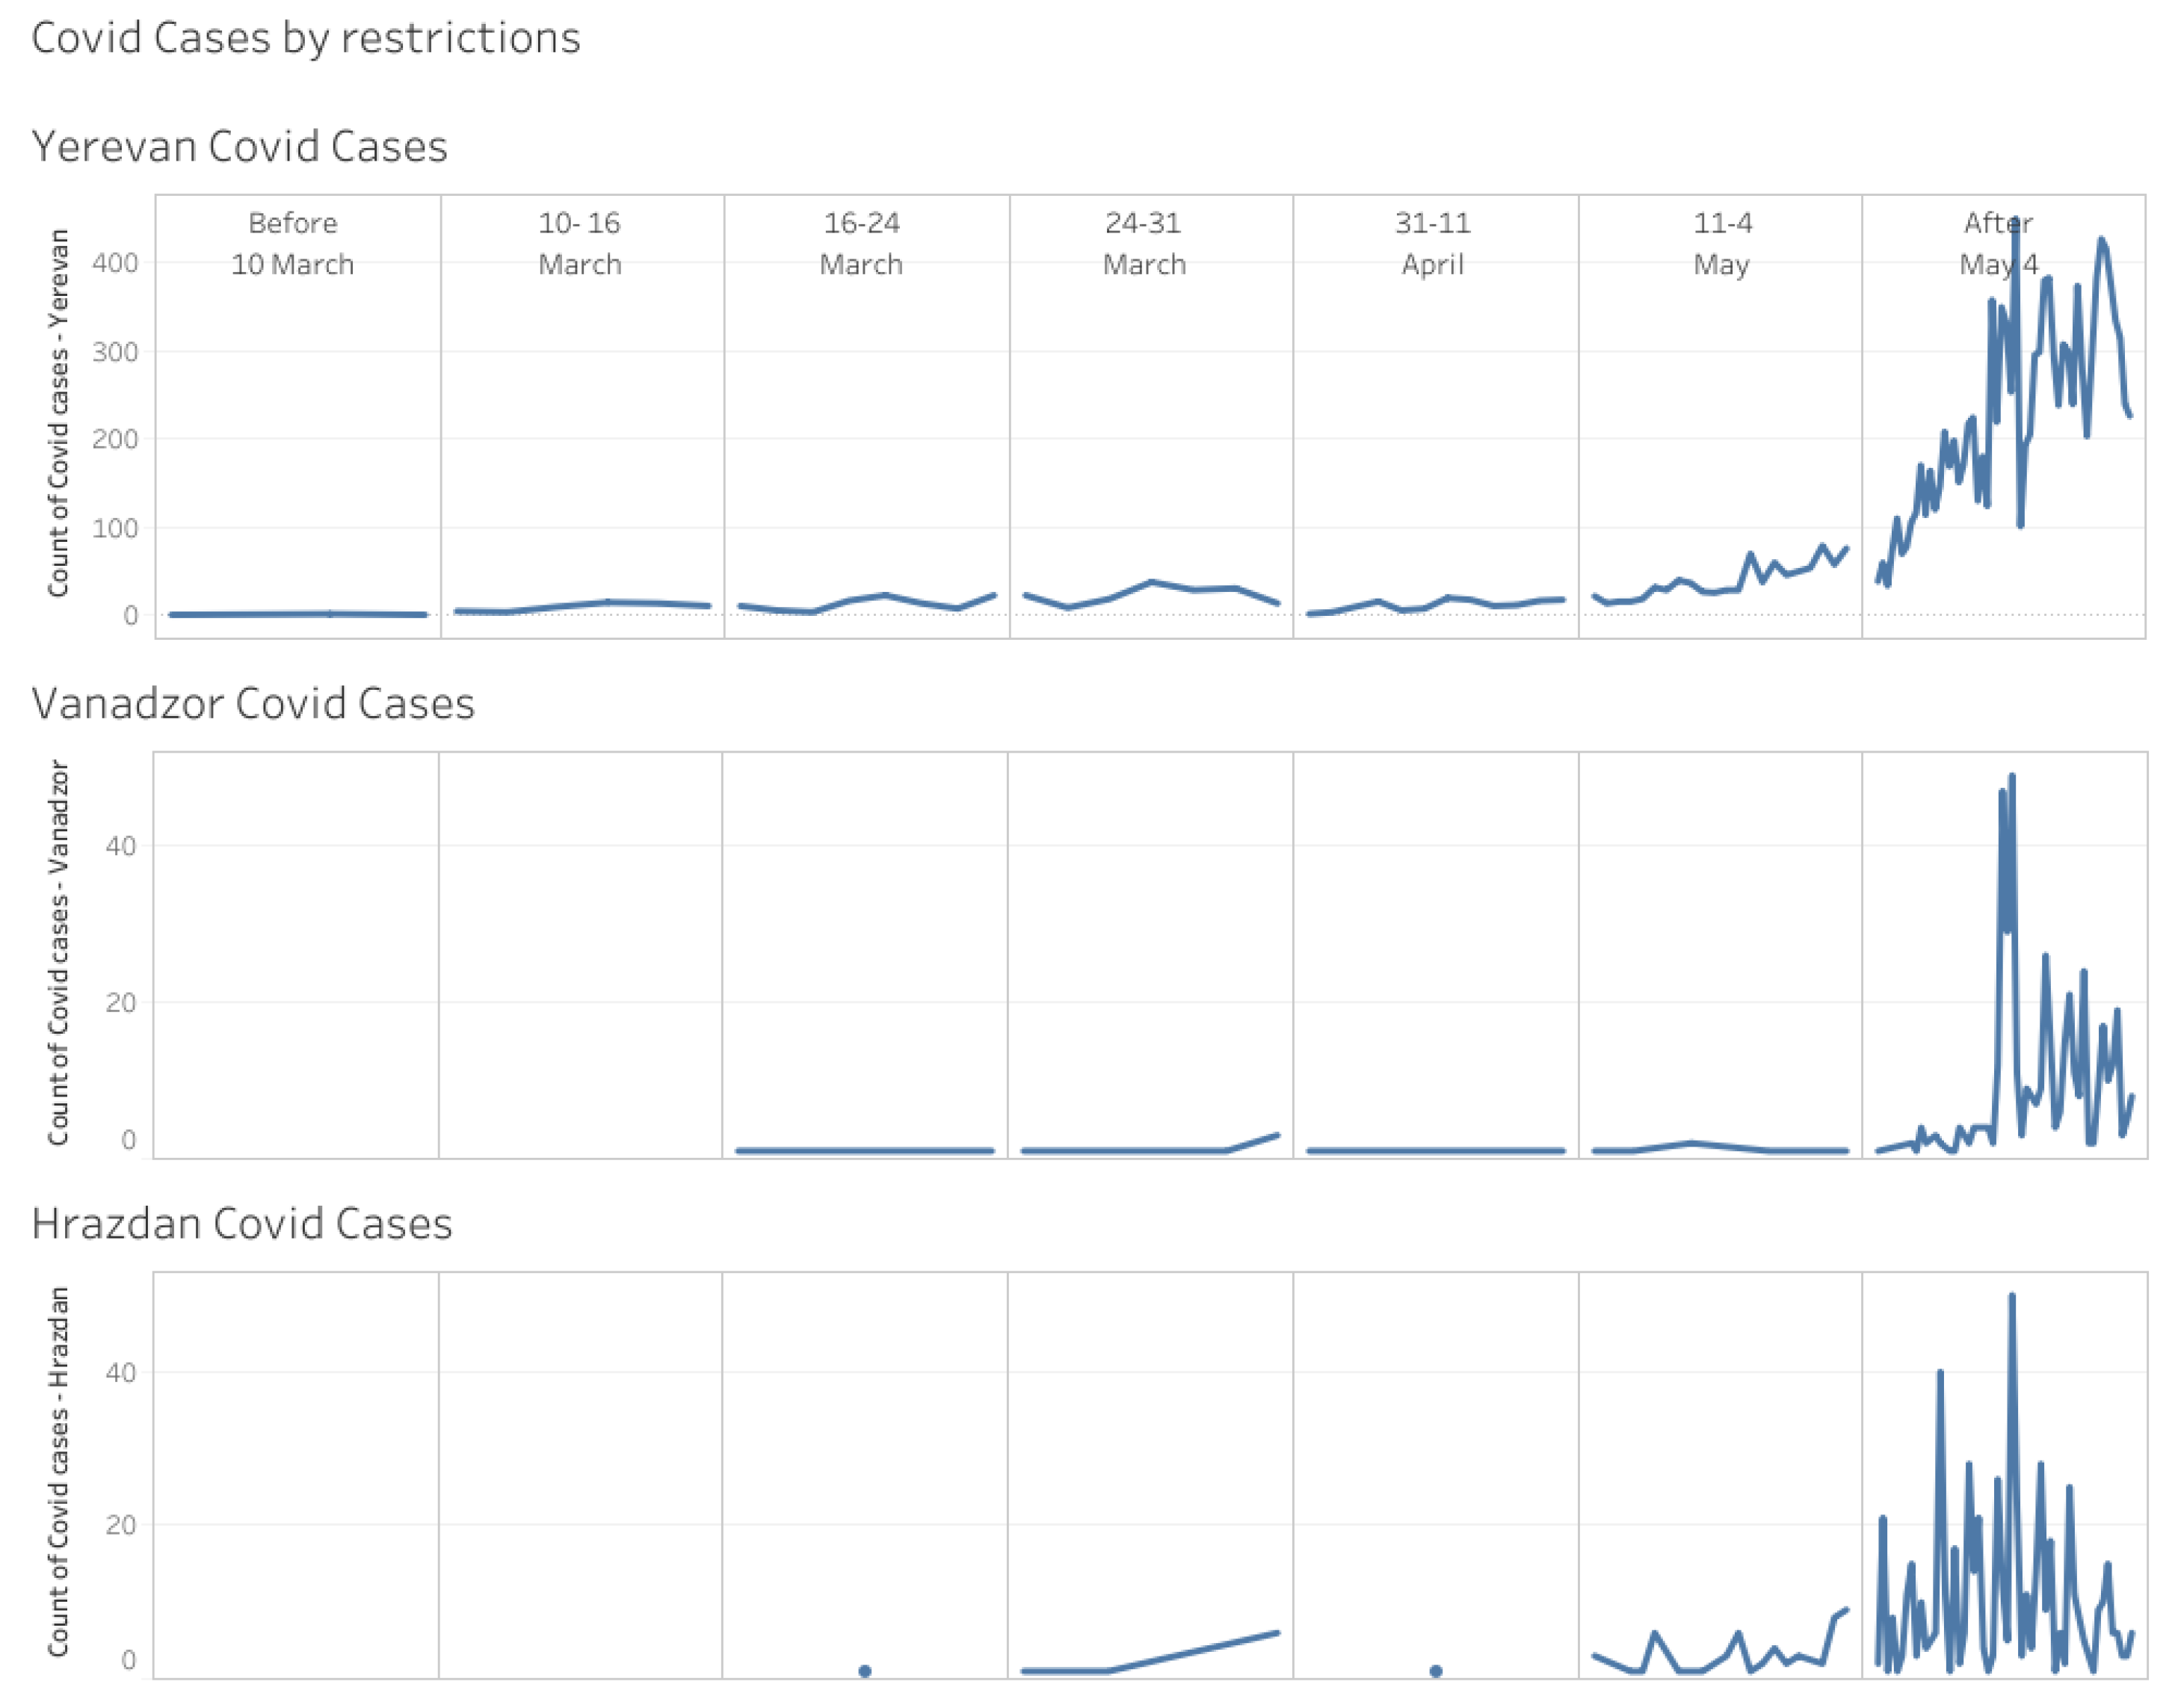
  • What correlation existed between compliance with quarantine restrictions and the spread of COVID-19?

2. Materials and Methods
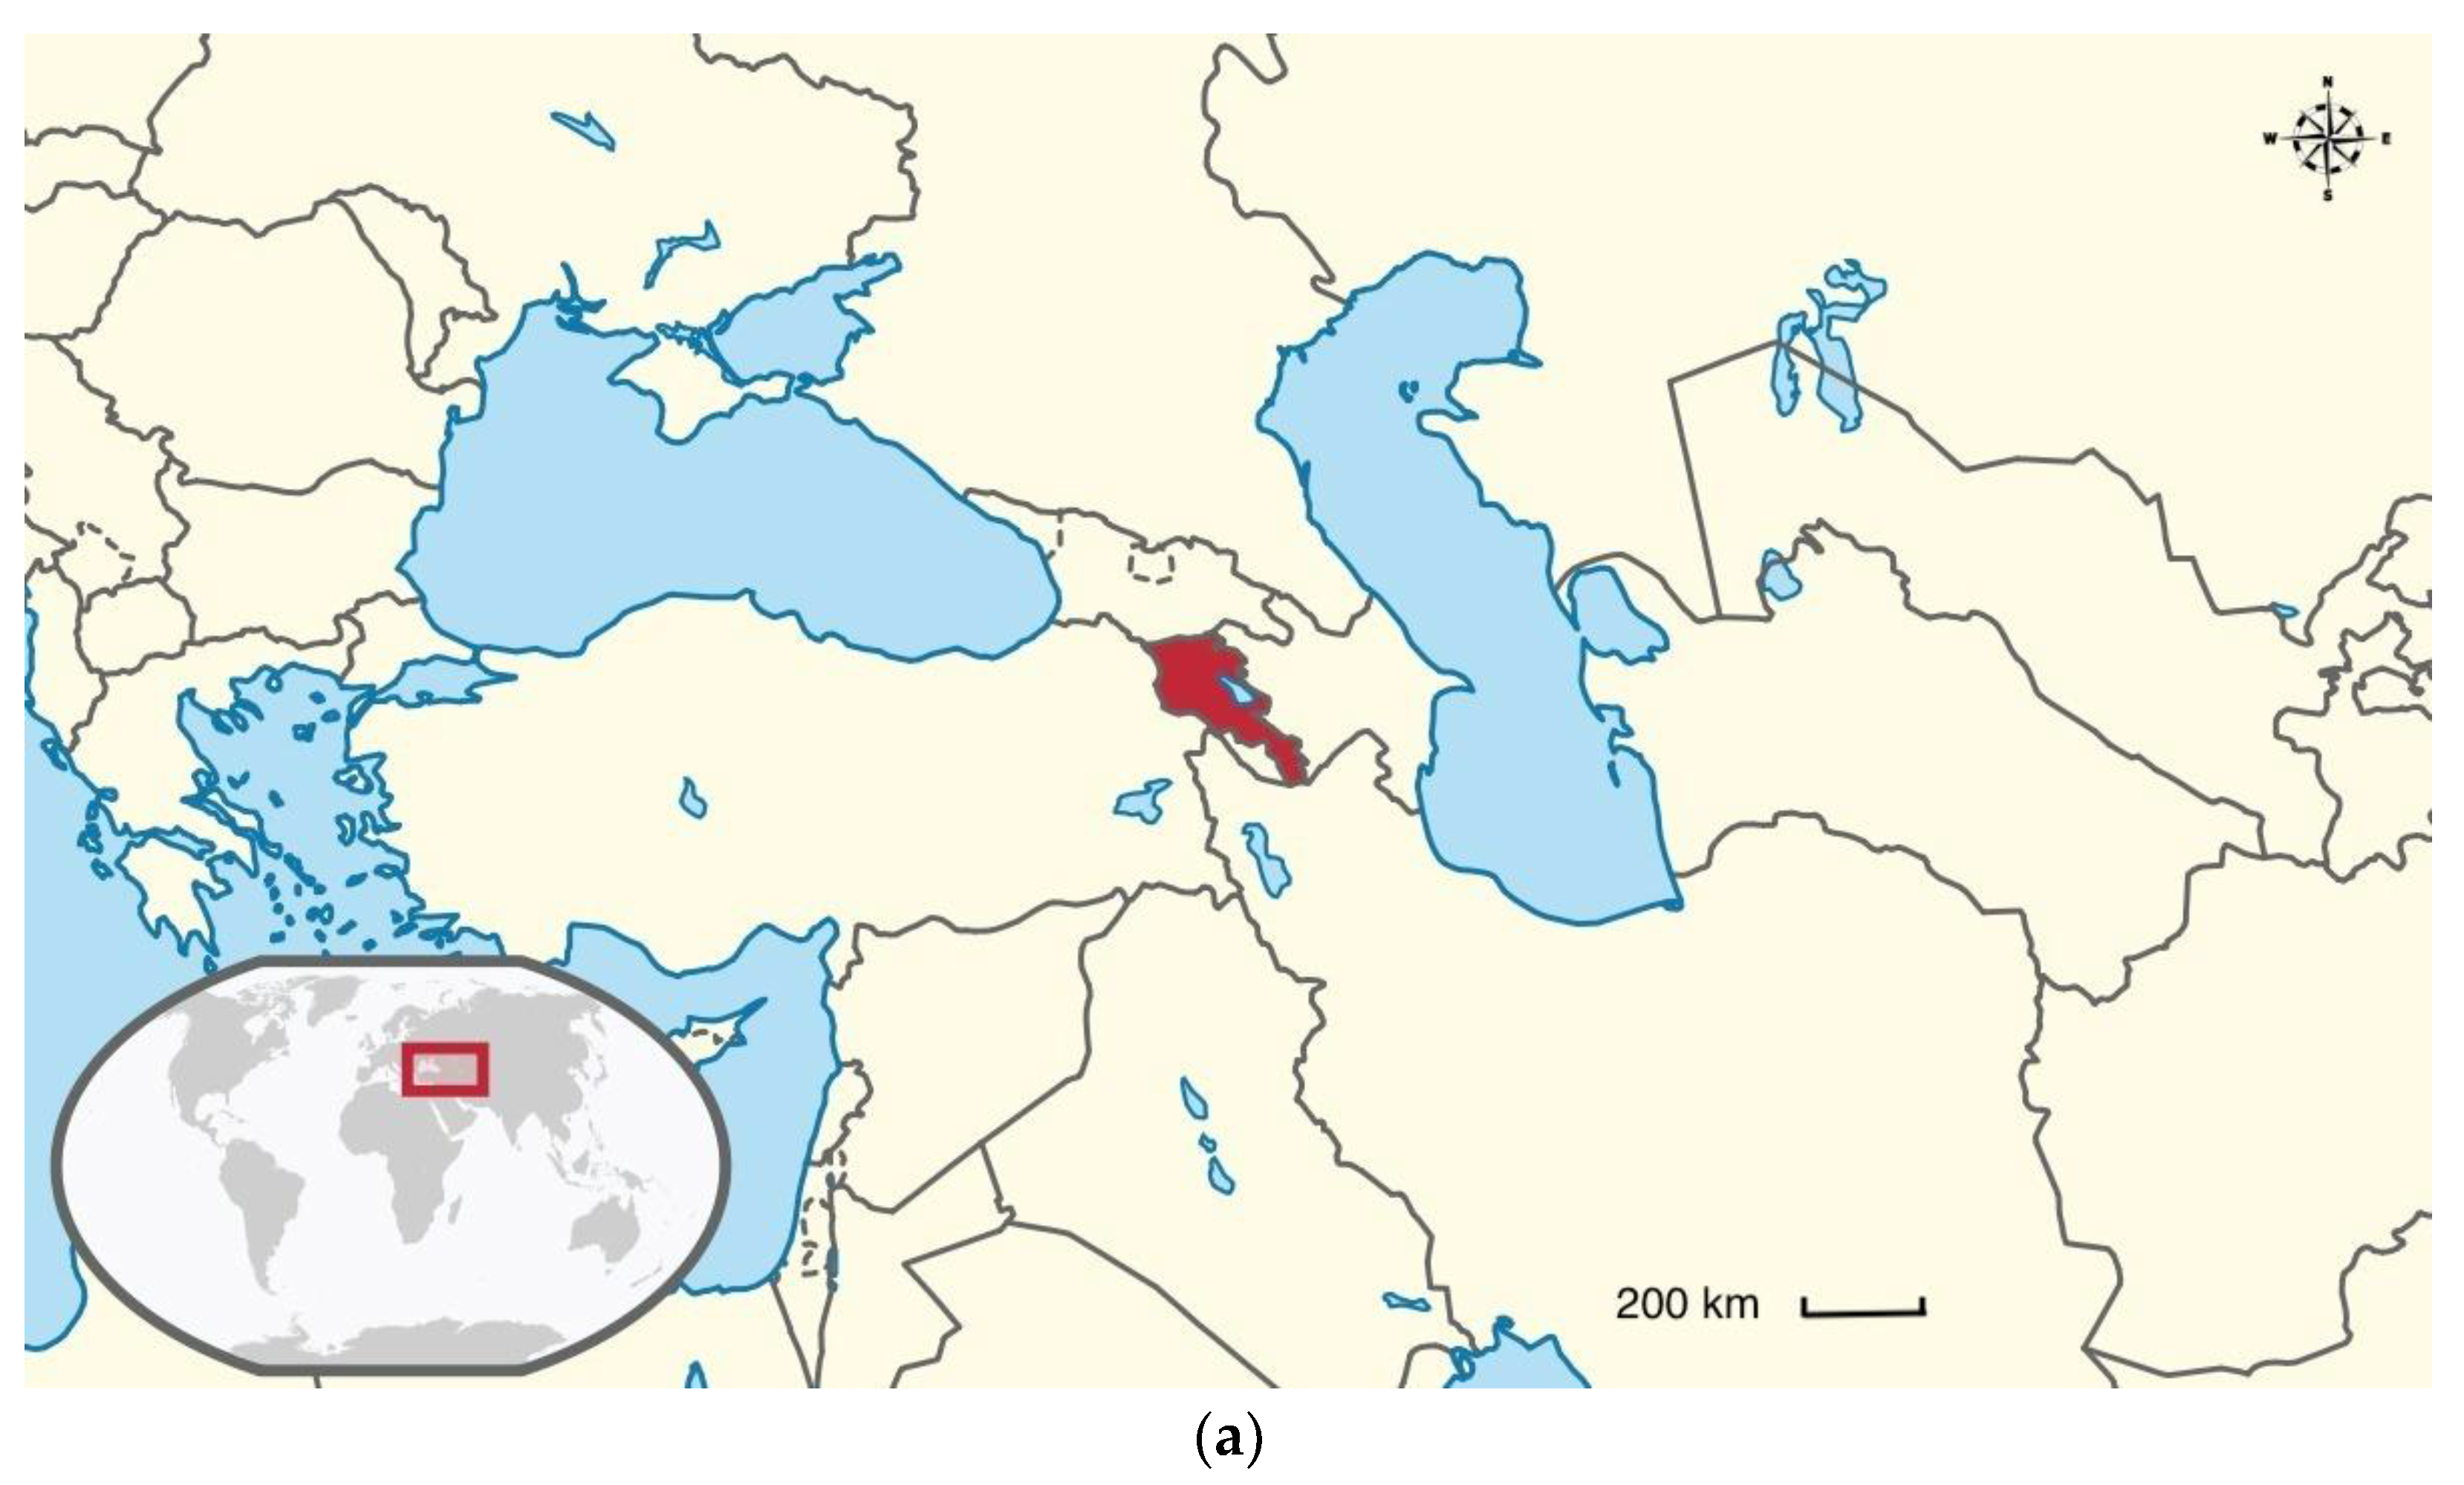
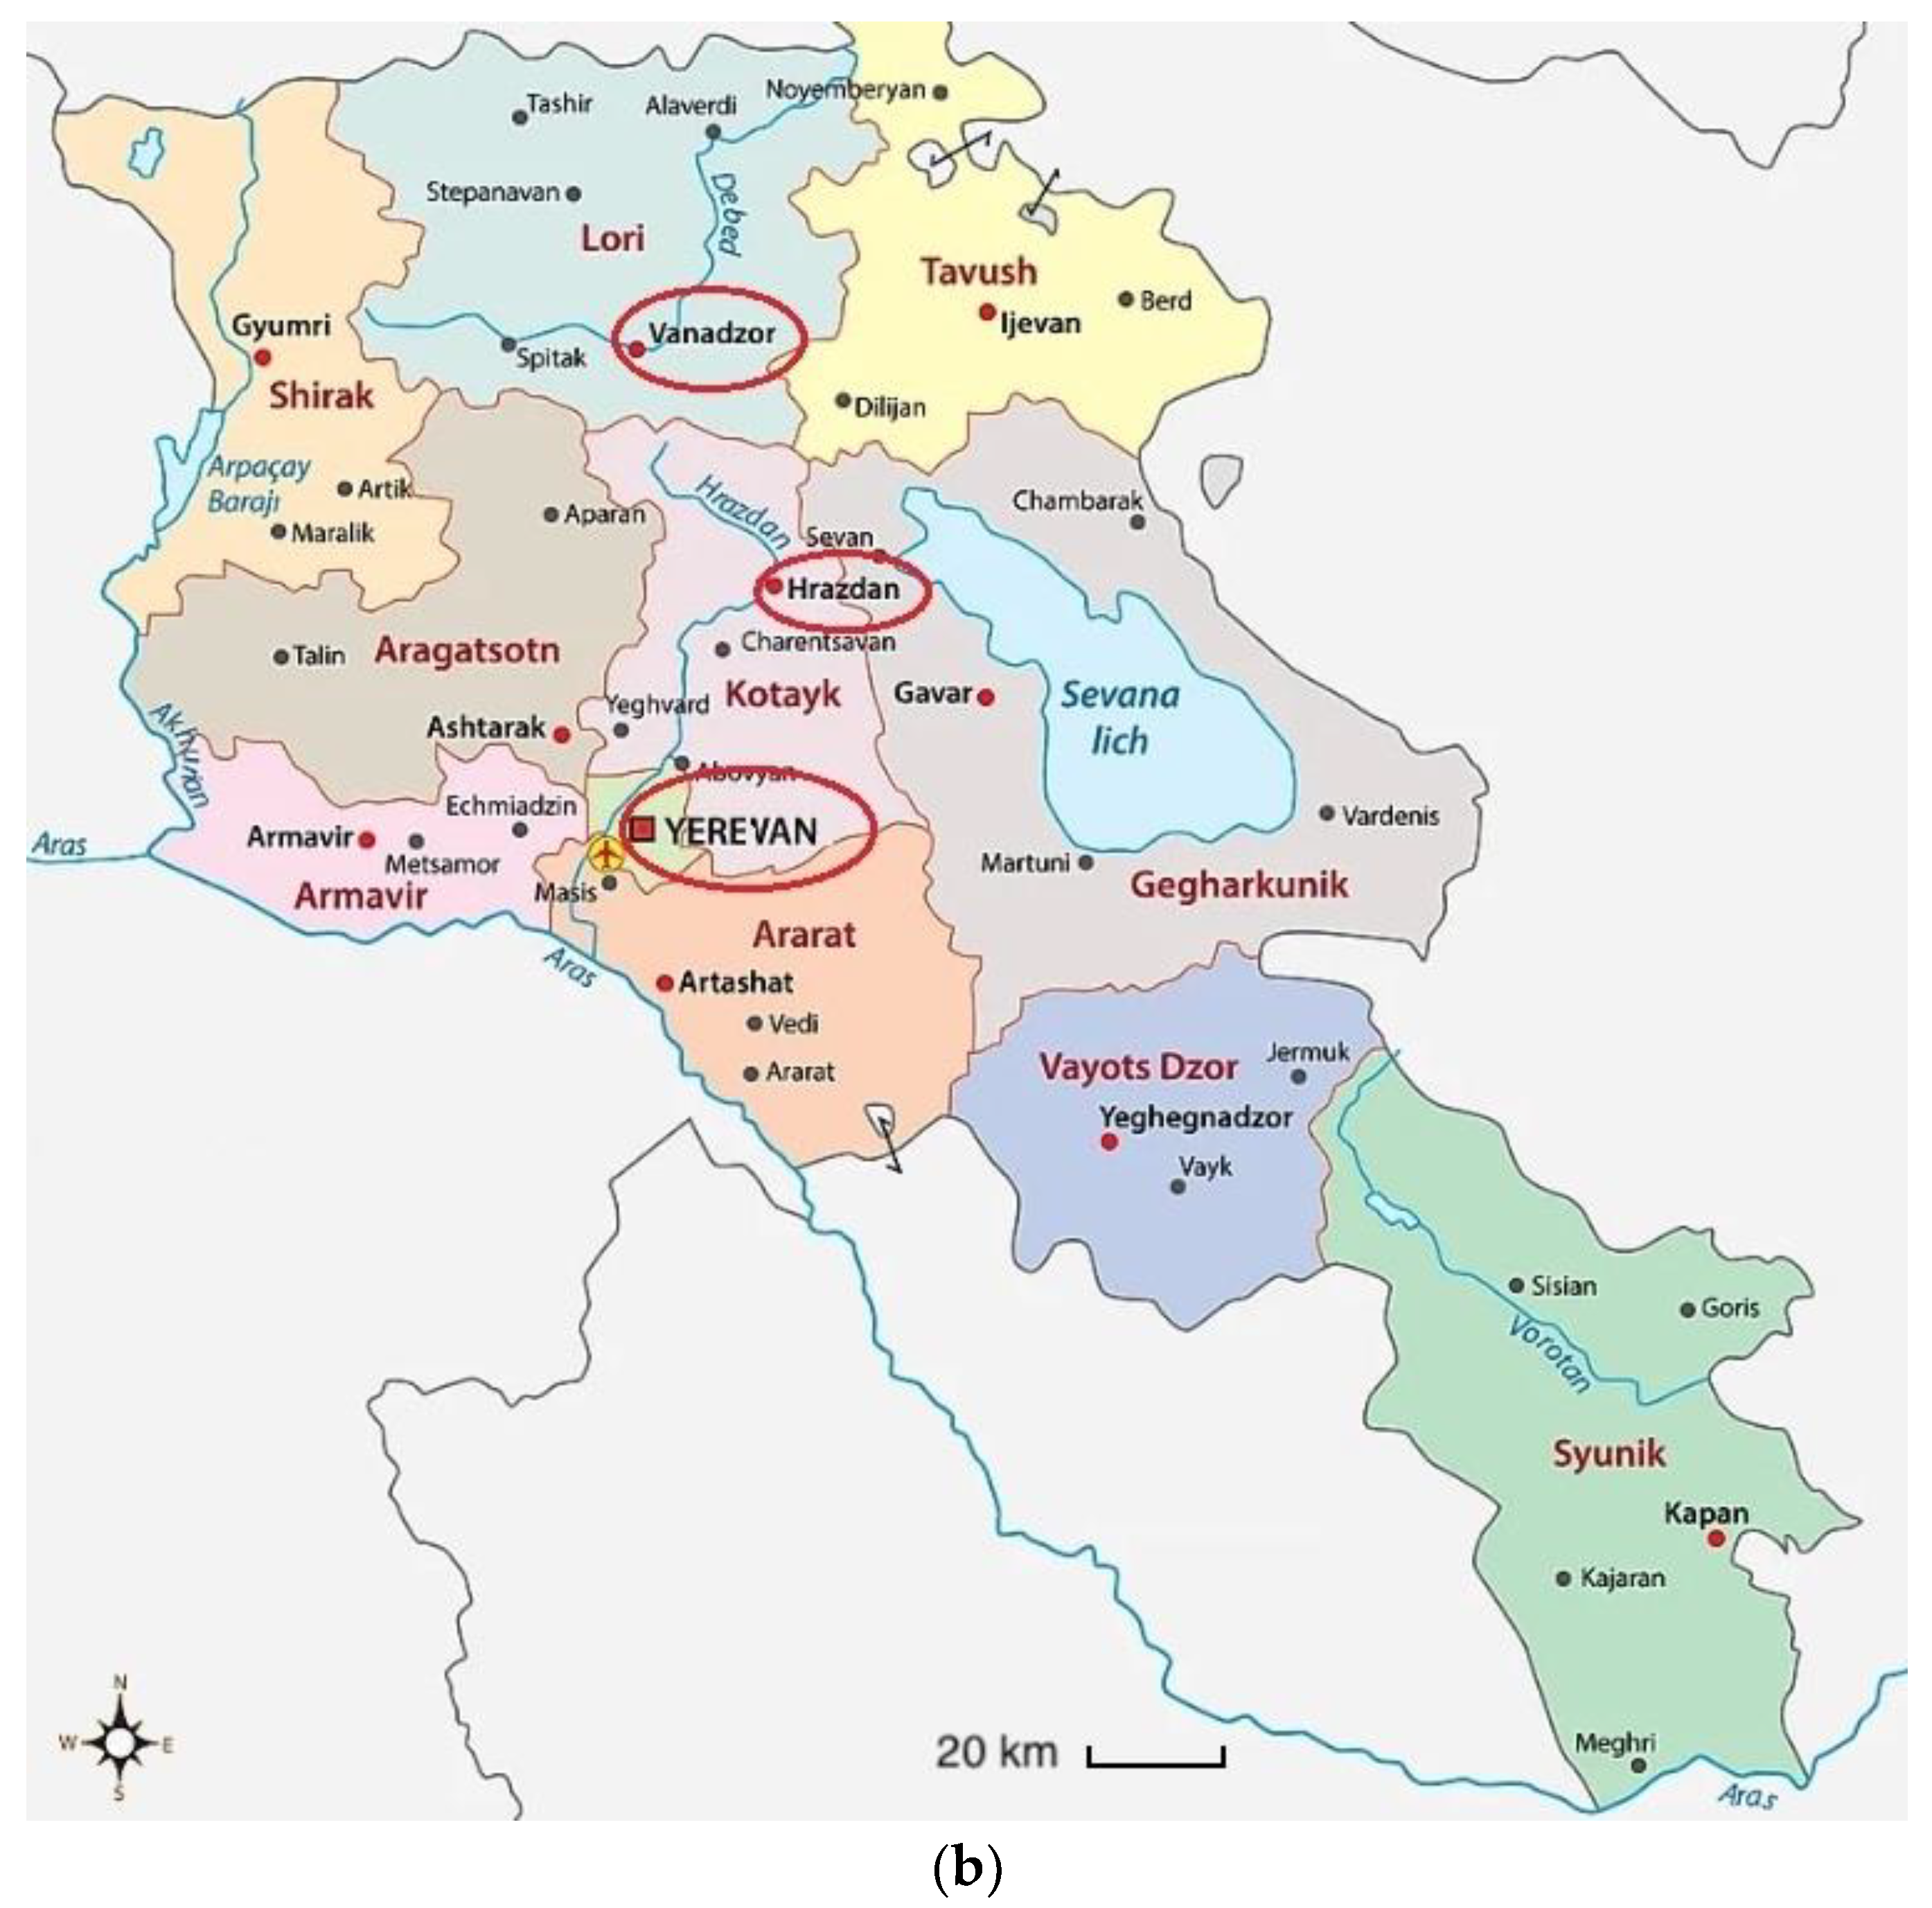
Study design—This was a cross-sectional study.
Data sources—Data on the concentrations of SO2, NO2 and dust (large coarse particles) from 1 March 2019 to 30 June 2019 and from 1 March 2020 to 30 June 2020 for Yerevan, Vanadzor and Hrazdan cities (Figure 1) were taken from the Hydrometeorology and Monitoring Center of Armenia. This center has 15 stationary active sampling observation stations and 214 mobile passive sampling points in 10 different cities of Armenia.
Data on positive COVID-19 cases from Yerevan, Vanadzor and Hrazdan detected during the 1 March–30 June 2020 period were received from the Health Project Implementation Unit of Ministry of Health of Armenia.

2.1. Study Setting

General: Armenia is a small, upper-middle-income country located in the South Caucasus with population of around 3 million and gross domestic product (GDP) of USD 12.4 billion (2018). The percentage of the population living below the national poverty line was 27.0% in 2017 according to World Bank data [37].
Yerevan is the capital of Armenia, and covers an area of 260 km2 extending 18 km north–south and 16 km east–west with a population of about 1,092,000 people [38]. Yerevan has been rapidly developing economically, resulting in growing car ownership and increasing congestion, outdated public transport, decreased air quality linked to vehicle emissions etc. [39].
Vanadzor is the third-largest city in Armenia, located in the northern part of the country. It is located about 128 km (80 miles) north of the capital Yerevan. According to the Ministry of Territorial Administration and Development, the city had a population of 78,700 in 2018. The industry of the city is quite diverse, and includes garment manufacturing and the production of chemicals, dairy products etc.
Hrazdan is the regional center of one of the eleven regions of Armenia. It is situated 40 km north-east of Yerevan, and is one of the highly industrialized cities of Armenia. The city has a population of about 40,000 people [40].

2.2. COVID-19-Related Restrictions in Armenia

On 10 March 2020, the Government of Armenia advised citizens to avoid traveling to Italy, France, Germany, Spain, Japan, China, Iran and South Korea. Later the travel ban became almost universal. On 16 March 2020 (light quarantine) the Government of Armenia declared a state of emergency, allowing the Government to take steps to minimize risk of infection spread during the outbreak of COVID-19. Actions included closure of schools and universities, prohibition of events with more than 20 participants, restrictions on movement within the country, screening and quarantine measures as well as restriction of entry into Armenia. Later, on 24 March 2020 the Government of Armenia introduced stricter quarantine measures for a week (the measures continued through April). All people were required to carry their passports and self-declaration forms if they left their homes. Violations of movement restrictions or quarantine were declared to be punishable by law. During the 31 March–12 April period the Government of Armenia introduced stricter quarantine measures (the strictest quarantine); travel between Armenian regions was prohibited and public transportation was shut down.
Starting from 4 May 2020, many previously implemented restrictions were lifted. Open-air cafes and restaurants were re-opened. The requirement to carry a self-declaration form was removed. Many industries were allowed to re-open with the implementation of sanitary rules (masks, distancing, etc.).
Data analysis was done using Stata 13 statistical software [41], as well as Pandas, Numpy and Sklearn plotting libraries in Python programming language [42]. Descriptive statistics (i.e., means and standard deviations for continuous variables, frequencies and percentages) for categorical variables were run. Spearman’s rank correlation coefficient was used to test the strength and direction of the correlation between the air pollution and new COVID-19 cases. To accommodate delays between those two time series, we computed the correlation on lagged values. We shifted COVID-19 cases backward in time by some number of days and reported the correlation value and p-value for each lag. We trained a predictive model to fill in the missing values based on the present ones. For that purpose, polynomial regression was used—a standard linear regression with polynomial basis functions. During 5-fold cross-validation, a polynomial regression of degree 5 was found to be the most prominent. Figures were created using Tableau—an analytical data visualization tool [43].

3. Results

The total number of patients during the 1 March–30 June 2020 period was 13,557 in Yerevan, Hrazdan and Vanadzor. The mean age of the patients in Yerevan was 46.8 (±19.3), in Hrazdan it was 46.9 (±18.4) and in Vanadzor it was 46.8 (±15.9). There was a higher proportion of female patients in all cities: 62.0% in Yerevan, 60.9% in Hrazdan and 70.9% in Vanadzor.
Table 1 shows the concentrations of dust, SO2 and NO2 (mg/m3) in Yerevan, Vanadzor and Hrazdan during the periods of interest. The maximum concentrations of dust were higher than the Maximum Allowable Concentration (MAC) for Armenia (0.15 mg/m3) in all three cities during all periods, while the mean concentrations of dust were higher than the MAC in Hrazdan and Vanadzor [44].
The SO2 and NO2 concentrations exceeded the MAC (0.005 and 0.06 mg/m3 respectively) only in Hrazdan (SO2 in 2019 and NO2 in 2020).
Figure 2 shows the cumulative concentrations of dust (a), sulfur dioxide (b) and nitrogen dioxide (c) in the three cities during the periods of interest. The cumulative concentration of dust decreased in Yerevan (17.73 vs. 13.07 mg/m3), increased in Vanadzor (20.33 vs. 30.18 mg/m3) and was almost the same in Hrazdan (17.33 vs. 17.88 mg/m3). The cumulative concentration of SO2 decreased in Yerevan (2.13 vs. 1.24 mg/m3) and in Hrazdan (1.57 vs. 1.31 mg/m3) and was almost the same in Vanadzor (1.18 vs. 1.20 mg/m3). The concentration of nitrogen dioxide increased in Yerevan (1.93 vs. 3.96 mg/m3) and Hrazdan (0.61 vs. 1.36 mg/m3) and slightly decreased in Vanadzor (0.92 and 0.76 mg/m3).
Figure 3 shows the concentrations of dust, SO2 and NO2 and new COVID-19 cases in Yerevan, Vanadzor and Hrazdan during March–June 2019 and periods of lockdown in 2020. During the lockdown, the dust was lower in Yerevan (mean concentration of dust during 20 March–4 May 2019 was 0.15 vs. 0.10 mg/m3 in the same period in 2020) and in Hrazdan (in 2019 the mean was 0.19 vs. 0.15 mg/m3 in 2020) and higher in Vanadzor (in 2019 the mean was 0.19 vs. 0.24 mg/m3 in 2020) than in the same period in 2019. The same pattern was present for the sulfur dioxide concentrations—in Yerevan and Hrazdan there was a decrease (0.018 vs. 0.008 mg/m3 and 0.019 vs. 0.009 mg/m3, respectively). In Vanadzor the average concentration of SO2 increased in 2020 (0.012 vs. 0.010 mg/m3), however there were several peaks in early stages of the lockdown. The pattern was the opposite for the concentrations of NO2: they increased in Yerevan and Hrazdan (0.035 vs. 0.019 mg/m3 and 0.015 vs. 0.008 mg/m3, respectively) with a slight decrease in Vanadzor (0.006 vs. 0.007 mg/m3).
The numbers of new cases of COVID-19 started to increase after the lockdown measures were cancelled. In Yerevan and Hrazdan the increase was almost immediate; in Vanadzor increases were seen from the beginning of June. Figure 4 shows the dynamics of the new cases of COVID-19 more closely.
Table 2 shows Spearman’s rank correlation between the dust, SO2 and NO2 and new cases of COVID-19 after different lags (from 1 to 14 days) in Yerevan, Hrazdan and Vanadzor during the March–June 2020 period. There was a negative correlation between the concentration of dust and new cases of COVID-19 in all three cities. The strongest correlation in Yerevan was during the first five days of lag (−0.33 to −0.30), while in Hrazdan the strongest was seen after 10–12 days (−0.33). In Vanadzor there was no statistically significant correlation.
The correlation between SO2 concentration and new cases of COVID-19 was found to be positive. The highest coefficients for Yerevan were obtained for the third and fourth days (0.38). In Hrazdan the strongest correlation was on the eleventh day. No statistically significant correlation was observed in Vanadzor.
In terms of NO2 there was a positive correlation in Yerevan and a negative correlation in Hrazdan. In Yerevan the strongest correlation was observed at the end of the second week of the lag, and in Hrazdan during the fifth to sixth days (−0.46 to −0.43).

4. Discussion

Our study showed that the government decisions in response to COVID-19 impacted the air pollution in Yerevan, Hrazdan and Vanadzor, but the impact was not uniform across all three cities. For Yerevan, the concentrations of dust and SO2 decreased, but the concentration of NO2 increased. This pattern differed from those in Hrazdan and Vanadzor.
As the source of SO2 in the atmosphere is the burning of fossil fuels by power plants, other industrial processes as well as trains, other vehicles and heavy equipment which burn fuel containing sulfur, the content of SO2 in the air is expected to decrease during a lockdown [45]. The decreased concentration of SO2 in the air of Yerevan, Hrazdan and Vanadzor during the lockdown was consistent with reports in the literature. The same pattern was observed in many countries and cities during the period of COVID-19-related restrictions—e.g., in six different cities of Latin America, in Hanoi, Salé city (North-Western Morocco), Malaysia etc. [24,46,47].
The sources of NO2 are mainly anthropogenic activities (e.g., transportation, industrial emissions, domestic heating, power plants and smelters), which is why NO2 is most abundant in urban environments [29,48,49,50,51]. After the outbreak of COVID-19 in many cities of the world, all levels of human activities were reduced, including the operation of production facilities, traffic and individual activities. This lead to decreased NO2 concentrations in the air as a consequence of the limitation of NO2 emission from both industrial production and vehicle exhaust. In various studies on the environmental changes during lockdowns in different countries and cities all over the world, the decreases in NO2 concentrations were found to range from small (e.g., Korea, Lincoln, Warsaw etc.) to significant changes (e.g., Paris, Madrid, Milan etc.) [26,52]. Cooper et al. showed a mean decrease of 32  ±  2% in a consistent analysis of 215 cities’ data [53,54]. A decrease of NO2 was also observed in Greece, India and China [55,56,57,58,59] and in 31 other countries according to Venter et al. [25]. However, in both Yerevan and Hrazdan there was an increase of NO2 concentration during the lockdown. In several studies in South Asia (e.g., India) emissions from biomass burning were identified as a major source of tropospheric NO2, and this was given as an explanation for the increase of NO2 concentrations during the lockdown (e.g., vegetation fires in Northeast India) [60]. Additionally, Rana et al. reported that the variability of tropospheric NO2 was significantly associated with meteorological parameters such as temperature [61]. A study by Kerr GH et al. showed that marginalized communities faced higher NO2 levels during the lockdowns than nonmarginalized communities did prior to the lockdown, which was explained by the fact that heavy-duty trucking largely continued unabated [62]. In the case of Yerevan and Hrazdan, the discrepancy could probably be attributed the fact that people who stopped working or started to work at home had to heat their houses more actively than when they were in their workplaces. They also started to cook at home more than before [63].
One of the possible reasons for the difference of Vanadzor from Yerevan and Hrazdan is that because Vanadzor is far from Yerevan (~116 km), people who were originally from Vanadzor but were working or studying in Yerevan could have returned to Vanadzor as a result of the closure of some businesses, shifting to work-from-home or remote-learning mode. This may have been the reason for the increase in SO2 concentrations during the beginning of the lockdown when people could have returned home. In comparing the lockdown period starting from 1 April (i.e., skipping the peaks), the mean concentration of SO2 in Vanadzor was also decreasing (0.080 mg/m3 in 2020 vs. 0.011 mg/m3 in 2019).
The mean values of dust in Hrazdan and Vanadzor were found to be higher than the MAC for Armenia (0.15 mg/m3) during both periods of interest in 2019 and 2020. The maximum concentrations of dust were higher than the MAC in all three cities during all periods. One of the reasons for the high concentration of dust in the air in Armenia could be the extensive deforestation which took place during the early 2000s. According to our findings, the cumulative concentration of dust decreased mainly in Yerevan (17.73 vs. 13.07 mg/m3). During the lockdown the dust was lower in Yerevan (mean concentration of dust during 20 March–4 May 2019 was 0.15 vs. 0.10 mg/m3 in the same period in 2020). A study from Poland suggested neighboring cities could be the main sources of air pollution if they were more polluted or did not follow the regulations about air quality [64]. Another study showed that an unfavorable location of a city, particularly topographic (terrain elevation) and meteorological factors (especially wind speed) could make it vulnerable in terms of the accumulation of pollutants from its neighborhood [65]. Being surrounded by mountains on three sides, the natural dispersion of pollutants in the atmosphere cannot occur in Yerevan, resulting in high concentrations of dust in the air [39].
In order to receive information about the effectiveness of the lockdown, it was helpful to look at the mobility data of the population. In many countries around the world, it was possible to check the effectiveness of lockdowns using mobility data from Google and Apple. As these data were unavailable for Armenia, the lockdown in Armenia was demonstrated from Yandex.ru. In March 2020, Yandex introduced the Self-Isolation Index, which was measured on a scale from 0 to 5 points [66]. An index between 0 and 2.4 points showed that there were many people on the streets and the level of self-isolation was low. This was considered the red zone due to the high likelihood of spreading coronavirus. An index between 2.5 and 3.9 points indicated that most people were at home (yellow zone), and a score from 4 to 5 points meant that there was almost no one on the streets, which was a green zone and suggested a low likelihood of disease spread. Figure 5 shows to what degree people were self-isolating by way of not leaving their homes. From March 14 until May 7 the index was ≥2.5, reaching around 4 during the last days of March and the first week of April, meaning that Armenians living in Yerevan were quite compliant regarding the restrictions.
Our study did not find a consistent correlation between air pollution and new COVID-19 cases at certain lag periods. However, various studies in the literature stated different durations of lag periods of COVID-19 (e.g., 5–6 days in Italy [67], 9–12 days in the USA [68] etc.) indicated an absence of consistency in these terms.
In terms of compliance with the lockdown measures, based on Yerevan data (the most complete data), it is possible to say that the population was following the restrictions. This was reflected in the self-isolation index as well as the decreased SO2 concentration when compared with the same period in 2019. Looking at the emergence of new cases of COVID-19 during and after the lockdown, we could conclude that the strict lockdown was effective in containing the spread of the infection.
The results of the study could have both mid- and long-term implications.First of all, the strict quarantine measures were shown to be effective in containing the spread of the virus. This could later serve as an argument for using similar measures in future pandemics. Additionally, the use of air pollution data as a proxy measure for the population’s compliance with the quarantine measures may serve as a basis for developing different instruments in future which will allow the assessment of compliance with various restrictions based on the concentrations of different pollutants in the air.

Strengths and Limitations

One of the strengths of this study is that the research regarding air pollution during COVID-19 pandemic was performed for the first time in Armenia.
Additionally, the study used information about air pollution and COVID-19 cases not only from the capital (Yerevan) but also from the regional centers. This gave an opportunity to compare and see how the data were different in the capital and in remote areas.
One of the limitations of this study was that there were some gaps in the Vanadzor data. This could have altered the results and may represent one of the reasons for the different results for Vanadzor from those in Yerevan and Hrazdan.
Finally, several studies argued for an effect of topography and meteorology on the concentrations of traffic-related pollutants [65,69,70]. While the meteorological parameters could have affected the data in this study, they were not quantified.

5. Conclusions

The lockdown in Armenia decreased the concentrations of dust and SO2 and increased NO2 in the capital Yerevan and a regional center in Hrazdan. The data from Vanadzor were different in several respects. The strict quarantine measures were shown to be effective in containing the spread of COVID-19.
Along with containment of the dissemination of the disease, COVID-19 lockdown in many countries served as a natural experiment to study the impact of emissions control on air quality. Contributing to the knowledge about middle-income countries’ experience in terms of COVID-19, this study also emphasizes that although it is an effective measure, the quarantine can lead to varying effects in the different parts of the same country. More research is still needed to determine the causes of the differences between cities as well as the effects of other meteorological factors on air pollution.

Author Contributions

Conceptualization, A.S. and M.M.M.-S.-V.; methodology, A.S. and M.M.M.-S.-V.; software, A.S.; formal analysis, A.S.; data curation, N.G. and H.N.; writing—original draft preparation, A.S.; writing—review and editing, A.S., M.M.M.-S.-V., N.G. and H.N.; visualization, A.S., N.G. and H.N.; supervision, M.M.M.-S.-V. All authors have read and agreed to the published version of the manuscript.

Funding

This research received no external funding.

Institutional Review Board Statement

Ethical review and approval were waived for this study, due to the de-identified information of the patients was taken from the database.

Informed Consent Statement

Patient consent was waived due to the data being provided to the researchers in an anonymized format.

Data Availability Statement

Not applicable.

Acknowledgments

The authors express their gratitude to the former Minister of Environment of Armenia Erik Grigoryan, as well as Gayane Shahnazaryan and Vardan Karyan from Hydrometeorology and Monitoring Center State Non-Commercial Organization for providing the environmental data.

Conflicts of Interest

The authors declare no conflict of interest.

References

  1. World Health Organization (WHO). Virtual Press Conference on COVID-19—11 March 2020. Available online: https://www.who.int/docs/default-source/coronaviruse/transcripts/who-audio-emergencies-coronavirus-press-conference-full-and-final-11mar2020.pdf (accessed on 7 July 2022).
  2. World Health Organization. Coronavirus Disease (COVID-19) Pandemic. Available online: https://www.who.int/emergencies/diseases/novel-coronavirus-2019 (accessed on 7 July 2022).
  3. World Health Organization. Armenia Situation. Available online: https://covid19.who.int/region/euro/country/am (accessed on 7 July 2022).
  4. Centers for Disease Control and Prevention. Preventing the Spread of COVID-19 in a Variety of Settings Throughout Your Community. Available online: https://www.cdc.gov/coronavirus/2019-ncov/php/infection-control.html (accessed on 7 July 2022).
  5. Centers for Disease Control and Prevention. Health Departments: Information on COVID-19. Available online: https://www.cdc.gov/coronavirus/2019-ncov/php/index.html (accessed on 7 July 2022).
  6. European Centre for Disease Prevention and Control. Coronavirus Disease 2019 (COVID-19) Pandemic: Increased Transmission in the EU/EEA and the UK–Seventh Update. Available online: https://www.ecdc.europa.eu/sites/default/files/documents/RRA-seventh-update-Outbreak-of-coronavirus-disease-COVID-19.pdf (accessed on 7 July 2022).
  7. Ferguson, N.M.; Laydon, D.; Nedjati Gilani, G.; Imai, N.; Ainslie, K.; Baguelin, M.; Bhatia, S.; Boonyasiri, A.; Cucunuba Perez, Z.; Cuomo-Dannenburg, G. Report 9: Impact of Non-Pharmaceutical Interventions (NPIs) to Reduce COVID19 Mortality and Healthcare Demand; Imperial College London: London, UK, 2020. [Google Scholar] [CrossRef]
  8. Prem, K.; Liu, Y.; Russell, T.W.; Kucharski, A.J.; Eggo, R.M.; Davies, N. The effect of control strategies to reduce social mixing on outcomes of the COVID-19 epidemic in Wuhan, China: A modelling study. Lancet Public Health 2020, 5, e261–e270. [Google Scholar] [CrossRef]
  9. Koo, J.R.; Cook, A.R.; Park, M.; Sun, Y.; Sun, H.; Lim, J.T.; Tam, C.; Dickens, B.L. Interventions to mitigate early spread of SARS-CoV-2 in Singapore: A modelling study. Lancet Infect. Dis. 2020, 20, 678–688. [Google Scholar] [CrossRef]
  10. Markel, H.; Lipman, H.B.; Navarro, J.A. Nonpharmaceutical Interventions Implemented by US Cities During the 1918-1919 Influenza Pandemic. JAMA 2007, 298, 644–654. [Google Scholar] [CrossRef]
  11. World Health Organization Writing Group. Nonpharmaceutical Interventions for Pandemic Influenza, International Measures. Emerg. Infect. Dis. 2006, 12, 81–94. [Google Scholar] [CrossRef]
  12. Jackson, C.; Vynnycky, E.; Hawker, J.; Olowokure, B.; Mangtani, P. School closures and influenza: Systematic review of epidemiological studies. BMJ Open 2013, 3, e002149. [Google Scholar] [CrossRef]
  13. Ferguson, N.M.; Cummings, D.A.; Cauchemez, S.; Fraser, C.; Riley, S.; Meeyai, A.; Iamsirithaworn, S.; Burke, D.S. Strategies for containing an emerging influenza pandemic in Southeast Asia. Nature 2005, 437, 209–214. [Google Scholar] [CrossRef]
  14. World Health Organization. Advice for the Public: Coronavirus Disease (COVID-19). Available online: https://www.who.int/emergencies/diseases/novel-coronavirus-2019/advice-for-public (accessed on 10 July 2022).
  15. World Health Organization. WHO Coronavirus (COVID-19) Dashboard. Available online: https://covid19.who.int/ (accessed on 10 July 2022).
  16. The COVID Tracking Project. 2 Metrics 7-Day Average Curves. Available online: https://covidtracking.com/data/charts/2-metrics-7-day-average-curves (accessed on 1 August 2022).
  17. Centers for Disease Control and Prevention. How to Protect Yourself & Others. Available online: https://www.cdc.gov/coronavirus/2019-ncov/prevent-getting-sick/social-distancing.html (accessed on 7 July 2022).
  18. Pearce, K. What Is Social Distancing and How Can It Slow the Spread of COVID-19? Available online: https://hub.jhu.edu/2020/03/13/what-is-social-distancing/ (accessed on 7 July 2022).
  19. European Environmental Agency. Sources and Emissions of Air Pollutants in Europe. Available online: https://www.eea.europa.eu/publications/air-quality-in-europe-2021/sources-and-emissions-of-air (accessed on 13 September 2022).
  20. Arora, S.; Bhaukhandi, K.D.; Mishra, P.K. Coronavirus lockdown helped the environment to bounce back. Sci. Total Environ. 2020, 742, 140573. [Google Scholar] [CrossRef]
  21. Economic Commission for Latin America and the Caribbean. Effects of the Quarantines and Activity Restrictions Related to the Coronavirus Disease (COVID-19) on Air Quality in Latin America’s Cities. Available online: https://repositorio.cepal.org/handle/11362/45885 (accessed on 27 July 2022).
  22. Le Quéré, C.; Jackson, R.B.; Jones, M.W.; Smith, A.J.; Abernethy, S.; Andrew, R.M.; De-Gol, A.J.; Willis, D.R.; Shan, Y.; Canadell, J.C.; et al. Temporary reduction in daily global CO2 emissions during the COVID-19 forced confinement. Nat. Clim. Chang. 2020, 10, 647–653. [Google Scholar] [CrossRef]
  23. Filonchyk, M.; Hurynovich, V.; Yan, H.; Gusev, A.; Shpilevskaya, N. Impact Assessment of COVID-19 on Variations of SO2, NO2, CO and AOD over East China. Aerosol Air Qual. Res. 2020, 20, 1530–1540. [Google Scholar] [CrossRef]
  24. Nguyen, T.P.; Bui, T.H.; Nguyen, M.K.; Nguyen, T.H.; Vu, V.T.; Pham, H.L. Impact of COVID-19 partial lockdown on PM2.5, SO2, NO2, O3, and trace elements in PM2.5 in Hanoi, Vietnam. Environ. Sci. Pollut. Res. 2022, 29, 41875–41885. [Google Scholar] [CrossRef]
  25. Venter, Z.S.; Aunan, K.; Chowdhury, S.; Lelieveld, J. COVID-19 lockdowns cause global air pollution declines. Proc. Natl. Acad. Sci. USA 2020, 117, 18984–18990. [Google Scholar] [CrossRef]
  26. Ju, M.J.; Oh, J.; Choi, Y.-H. Changes in air pollution levels after COVID-19 outbreak in Korea. Sci. Total Environ. 2021, 750, 141521. [Google Scholar] [CrossRef]
  27. Tobías, A.; Carnerero, C.; Reche, C.; Massagué, J.; Via, M.; Minguillón, M.C.; Alastuey, A.; Querol, X. Changes in air quality during the lockdown in Barcelona (Spain) one month into the SARS-CoV-2 epidemic. Sci. Total Environ. 2020, 726, 138540. [Google Scholar] [CrossRef] [PubMed]
  28. Zaręba, M.; Danek, T. Analysis of Air Pollution Migration during COVID-19 Lockdown in Krakow, Poland. Aerosol Air Qual. Res. 2022, 22, 210275. [Google Scholar] [CrossRef]
  29. Collivignarelli, M.C.; Abbà, A.; Caccamo, F.M.; Bertanza, G.; Pedrazzani, R.; Baldi, M.; Ricciardi, P.; Miino, M.C. Can particulate matter be identified as the primary cause of the rapid spread of CoViD-19 in some areas of Northern Italy? Environ. Sci. Pollut. Res. 2021, 28, 33120–33132. [Google Scholar] [CrossRef] [PubMed]
  30. Mahato, S.; Pal, S.; Ghosh, K.G. Effect of lockdown amid COVID-19 pandemic on air quality of the megacity Delhi, India. Sci. Total Environ. 2020, 730, 139086. [Google Scholar] [CrossRef]
  31. Broomandi, P.; Karaca, F.; Nikfal, A.; Jahanbakhshi, A.; Tamjidi, M.; Kim, J.R. Impact of COVID-19 Event on the Air Quality in Iran. Aerosol Air Qual. Res. 2020, 20, 1793–1804. [Google Scholar] [CrossRef]
  32. Rodríguez-Urrego, D.; Rodríguez-Urrego, L. Air quality during the COVID-19: PM2.5 analysis in the 50 most polluted capital cities in the world. Environ. Pollut. 2020, 266, 115042. [Google Scholar] [CrossRef]
  33. Aerosol and Air Quality Research. Air Quality in a Changed World: Regional, Ambient, and Indoor Air Concentrations from the COVID to Post-COVID Era. Available online: https://aaqr.org/articles/special-issues/post-covid (accessed on 12 September 2022).
  34. The World Bank. PM2.5 Air Pollution, Mean Annual Exposure (Micrograms per Cubic Meter)—Armenia. Available online: https://data.worldbank.org/indicator/EN.ATM.PM25.MC.M3?locations=AM (accessed on 10 September 2022).
  35. World Health Organization. WHO Global Air Quality Guidelines: Particulate Matter (PM2.5 and PM10), Ozone, Nitrogen Dioxide, Sulfur Dioxide and Carbon Monoxide. Available online: https://apps.who.int/iris/handle/10665/345329 (accessed on 12 September 2022).
  36. IQAir. 2021 World Air Quality Report. Available online: https://www.iqair.com/world-most-polluted-cities/world-air-quality-report-2019-en.pdf (accessed on 12 September 2022).
  37. The World Bank. World Development Indicators. Available online: https://databank.worldbank.org/source/world-development-indicators (accessed on 7 July 2022).
  38. World Population Review. Yerevan Population 2022. Available online: https://worldpopulationreview.com/world-cities/yerevan-population. (accessed on 9 July 2022).
  39. Armenia: Sustainable Urban Development Investment Program. Available online: https://www.adb.org/sites/default/files/linked-documents/42417-01-arm-ieeab.pdf (accessed on 9 July 2022).
  40. Statistical Committee of the Republic of Armenia. Marzes and Yerevan City of the Republic of Armenia in Figures, Kotayk Marz. Available online: https://armstat.am/file/Map/MARZ_07.pdf (accessed on 9 July 2022).
  41. StataCorp. Stata Statistical Software: Release 14; StataCorp LP: College Station, TX, USA, 2015. [Google Scholar]
  42. Van Rossum, G. Python Library Reference; Centrum voor Wiskunde en Informatica: Amsterdam, The Netherlands, 1995. [Google Scholar]
  43. Joshua, N.M. Learning Tableau; PACKT: Birmingham, UK, 2015; ISBN 13-978-1784391164. [Google Scholar]
  44. Electronic Government of Republic of Armenia. Governmental Decision on the Maximum Allowable Concentrations of Air Pollutants. Available online: https://www.arlis.am/documentview.aspx?docid=22634 (accessed on 9 July 2022).
  45. United States Environmental Protection Agency. Sulfur Dioxide Basics. Available online: https://www.epa.gov/so2-pollution/sulfur-dioxide-basics (accessed on 9 July 2022).
  46. Otmani, A.; Benchrif, A.; Tahri, M.; Bounakhla, M.; Chakir, E.M.; El Bouch, M.; Krombi, M. Impact of COVID-19 lockdown on PM10, SO2 and NO2 concentrations in Salé City (Morocco). Sci Total Environ. 2020, 735, 139541. [Google Scholar] [CrossRef]
  47. Kanniah, K.D.; Zaman, N.A.F.K.; Kaskaoutis, D.G.; Latif, M.T. COVID-19’s impact on the atmospheric environment in the Southeast Asia region. Sci. Total Environ. 2020, 736, 139658. [Google Scholar] [CrossRef]
  48. Biswas, M.S.; Ghude, S.D.; Gurnale, D.; Prabhakaran, T.; Mahajan, A.S. Simultaneous Observations of Nitrogen Dioxide, Formaldehyde and Ozone in the Indo-Gangetic Plain. Aerosol Air Qual. Res. 2019, 19, 1749–1764. [Google Scholar] [CrossRef]
  49. Burnett, R.T.; Stieb, D.; Brook, J.R.; Cakmak, S.; Dales, R.; Raizenne, M.; Vincent, R.; Dann, T. Associations between short-term changes in nitrogen dioxide and mortality in Canadian cities. Arch. Environ. Health 2004, 59, 228–236. [Google Scholar] [CrossRef] [PubMed]
  50. Stohl, A.; Aamaas, B.; Amann, M.; Baker, L.H.; Bellouin, N.; Berntsen, T.K.; Boucher, O.; Cherian, R.; Collins, W.; Daskalakis, N.; et al. Evaluating the climate and air quality impacts of short-lived pollutants. Atmos. Chem. Phys. 2015, 15, 10529–10566. [Google Scholar] [CrossRef]
  51. Bechle, M.J.; Millet, D.B.; Marshall, J.D. Does Urban Form Affect Urban NO2? Satellite-Based Evidence for More than 1200 Cities. Environ. Sci. Technol. 2017, 51, 12707–12716. [Google Scholar] [CrossRef] [PubMed]
  52. Bar, S.; Parida, B.R.; Mandal, S.P.; Pandey, A.C.; Kumar, N.; Mishra, B. Impacts of partial to complete COVID-19 lockdown on NO2 and PM2.5 levels in major urban cities of Europe and USA. Cities 2021, 117, 103308. [Google Scholar] [CrossRef]
  53. Cooper, M.J.; Martin, R.V.; Hammer, M.S.; Levelt, P.F.; Veefkind, P.; Lamsal, L.N.; Krotkov, N.A.; Brook, J.R.; McLinden, C.A. Global fine-scale changes in ambient NO2 during COVID-19 lockdowns. Nature 2022, 601, 380–387. [Google Scholar] [CrossRef]
  54. Benítez-García, S.-E.; Kanda, I.; Wakamatsu, S.; Okazaki, Y.; Kawano, M. Analysis of Criteria Air Pollutant Trends in Three Mexican Metropolitan Areas. Atmosphere 2014, 5, 806–829. [Google Scholar] [CrossRef]
  55. Koukouli, M.-E.; Skoulidou, I.; Karavias, A.; Parcharidis, I.; Balis, D.; Manders, A.; Segers, A.; Eskes, H.; van Geffen, J. Sudden changes in nitrogen dioxide emissions over Greece due to lockdown after the outbreak of COVID-19. Atmos. Chem. Phys. 2021, 21, 1759–1774. [Google Scholar] [CrossRef]
  56. Biswal, A.; Singh, V.; Singh, S.; Kesarkar, A.P.; Ravindra, K.; Sokhi, R.S.; Chipperfield, M.P.; Dhomse, S.S.; Pope, R.J.; Singh, T.; et al. COVID-19 lockdown-induced changes in NO2 levels across India observed by multi-satellite and surface observations. Atmos. Chem. Phys. 2021, 21, 5235–5251. [Google Scholar] [CrossRef]
  57. Field, R.D.; Hickman, J.E.; Geogdzhayev, I.V.; Tsigaridis, K.; Bauer, S.E. Changes in satellite retrievals of atmospheric composition over eastern China during the 2020 COVID-19 lockdowns. Atmos. Chem. Phys. 2021, 21, 18333–18350. [Google Scholar] [CrossRef]
  58. Liu, F.; Page, A.; Strode, S.A.; Yoshida, Y.; Choi, S.; Zheng, B.; Lamsal, L.N.; Li, C.; Krotkov, N.A.; Eskes, H.; et al. Abrupt decline in tropospheric nitrogen dioxide over China after the outbreak of COVID-19. Sci. Adv. 2020, 6, eabc2992. [Google Scholar] [CrossRef] [PubMed]
  59. Bauwens, M.; Compernolle, S.; Stavrakou, T.; Müller, J.-F.; Van Gent, J.; Eskes, H.; Levelt, P.F.; van der A, R.; Veefkind, J.P.; Vlietinck, J.; et al. Impact of coronavirus outbreak on NO2 pollution assessed using TROPOMI and OMI observations. Geophys. Res. Lett. 2020, 47, e2020GL087978. [Google Scholar] [CrossRef] [PubMed]
  60. Vadrevu, K.P.; Eaturu, A.; Biswas, S.; Lasko, K.; Sahu, S.; Garg, J.K.; Justice, C. Spatial and temporal variations of air pollution over 41 cities of India during the COVID-19 lockdown period. Sci. Rep. 2020, 10, 16574. [Google Scholar] [CrossRef]
  61. Rana, M.; Mittal, S.K.; Beig, G.; Rana, P. The impact of crop residue burning (CRB) on the diurnal and seasonal variability of the ozone and PM levels at a semi-urban site in the north-western Indo-Gangetic plain. J. Earth Syst. Sci. 2019, 128, 166. [Google Scholar] [CrossRef]
  62. Kerr, G.H.; Goldberg, D.L.; Anenberg, S.C. COVID-19 pandemic reveals persistent disparities in nitrogen dioxide pollution. Proc. Natl. Acad. Sci. USA 2021, 118, e2022409118. [Google Scholar] [CrossRef] [PubMed]
  63. Gas Stoves Can Generate Unsafe Levels of Indoor Air Pollution. Available online: https://www.vox.com/energy-and-environment/2020/5/7/21247602/gas-stove-cooking-indoor-air-pollution-health-risks (accessed on 9 August 2022).
  64. Danek, T.; Zaręba, M. The Use of Public Data from Low-Cost Sensors for the Geospatial Analysis of Air Pollution from Solid Fuel Heating during the COVID-19 Pandemic Spring Period in Krakow, Poland. Sensors 2021, 21, 5208. [Google Scholar] [CrossRef]
  65. Danek, T.; Weglinska, E.; Zareba, M. The influence of meteorological factors and terrain on air pollution concentration and migration: A geostatistical case study from Krakow, Poland. Sci. Rep. 2022, 12, 11050. [Google Scholar] [CrossRef]
  66. Yandex Maps. Yandex Self-Isolation Index. Available online: https://yandex.ru/web-maps/covid19 (accessed on 9 July 2022).
  67. Epidemia COVID-19. Aggiornamento Nazionale 12 Marzo 2020. Istituto Superiore di Sanità, Roma. Available online: https://www.epicentro.iss.it/coronavirus/bollettino/Bollettino-sorveglianza-integrata-COVID-19_12-marzo-2020.pdf (accessed on 15 July 2022).
  68. Badr, H.S.; Du, H.; Marshall, M.; Dong, E.; Squire, M.M.; Gardner, L.M. Association between mobility patterns and COVID-19 transmission in the USA: A mathematical modelling study. Lancet Infect. Dis. 2020, 20, 1247–1254. [Google Scholar] [CrossRef]
  69. Dragomir, C.M.; Voiculescu, M.; Constantin, D.-E.; Georgescu, L.P. Prediction of the NO2 concentration data in an urban area using multiple regression and neuronal networks. In Proceedings of the AIP Conference, Timisoara, Romania, 8 December 2015. [Google Scholar]
  70. Ocak, S.; Turalioglu, F.S. Effect of Meteorology on the Atmospheric Concentrations of Traffic- Related Pollutants in Erzurum, Turkey. J. Int. Environ. Appl. Sci. 2008, 3, 325–335. [Google Scholar]
Figure 1. Maps of (a) the world (Armenia is in red) and (b) of Armenia (3 cities of this study—Yerevan, Vanadzor and Hrazdan—are marked with ovals).
Atmosphere 13 01563 g001aAtmosphere 13 01563 g001b
Figure 2. Cumulative concentrations of dust (a), sulfur dioxide (b) and nitrogen dioxide (c) in Yerevan, Vanadzor and Hrazdan during March–June in 2019 and 2020.
Atmosphere 13 01563 g002aAtmosphere 13 01563 g002b
Figure 3. Concentrations of dust (a), sulfur dioxide (b) and nitrogen dioxide (c) and new cases of COVID-19 in Yerevan, Vanadzor and Hrazdan during March–June in 2019 and 2020 during the periods of different levels of stringency in terms of lockdown restrictions.
Atmosphere 13 01563 g003aAtmosphere 13 01563 g003bAtmosphere 13 01563 g003c
Figure 4. New COVID-19 cases in Yerevan, Vanadzor and Hrazdan during March–June 2020 during and after the lockdown.
Atmosphere 13 01563 g004
Figure 5. Yandex self-isolation index in Yerevan during the March-June 2020 period.
Atmosphere 13 01563 g005
Table 1. Dust, SO2 and NO2 concentrations (mg/m3) in Yerevan, Vanadzor and Hrazdan during March–June 2019 and 2020 (concentration exceeding the MAC are marked with grey).
NMinimum ConcentrationSDMaximum
Concentration
MeanMedianMAC
(mg/m3)
Dust 0.15
Yerevan 20191220.0560.0540.3350.1450.136
Yerevan 20201220.0300.0450.2670.1070.100
Vanadzor 20191220.0370.0670.3870.1670.153
Vanadzor 20201220.1180.0740.6060.2470.235
Hrazdan 2019890.0230.1470.7540.1650.118
Hrazdan 2020970.0280.1130.5920.1570.132
Sulfur dioxide (SO2) 0.05
Yerevan 20191220.0060.0050.0330.0170.017
Yerevan 20201220.0040.0030.0210.0100.010
Vanadzor 20191220.0020.0040.0190.0100.009
Vanadzor 20201220.0030.0060.0350.0100.008
Hrazdan 2019940.0040.0130.0920.0150.012
Hrazdan 20201210.0010.0050.0270.0110.011
Nitrogen
dioxide (NO2)
0.06
Yerevan 20191220.0030.0060.0340.0160.016
Yerevan 20201220.0160.0100.0550.0320.032
Vanadzor 20191220.0040.0020.0130.0080.008
Vanadzor 20201220.0030.0020.0140.0060.006
Hrazdan 2019990.0000.0050.0210.0050.004
Hrazdan 20201120.0010.0120.0830.0090.006
SD—standard deviation, MAC—Maximum Allowable Concentration.
Table 2. Correlation between concentrations of dust, SO2 and NO2 with new cases of COVID-19 in Yerevan, Hrazdan and Vanadzor with 1–14 lag days. A grey color denotes a significant (p-value < 0.05) correlation.
Lag Days
1234567891011121314
Dust
Spearman’s coefficient Yerevan−0.33−0.33−0.29−0.30−0.30−0.27−0.25−0.26−0.30−0.25−0.22−0.21−0.20−0.24
p-Value Yerevan0.000.000.000.000.000.000.010.010.000.010.020.030.040.01
Spearman’s coefficient Hrazdan−0.14−0.24−0.12−0.18−0.25−0.25−0.25−0.24−0.25−0.33−0.30−0.33−0.24−0.21
p-Value Hrazdan0.120.010.180.050.010.010.010.010.010.000.000.000.010.03
Spearman’s coefficient Vanadzor−0.10−0.14−0.08−0.01−0.07−0.05−0.01
p-Value Vanadzor0.260.130.360.940.490.560.94
Sulfur dioxide
Spearman’s coefficient Yerevan0.310.310.340.380.380.370.370.320.310.330.320.310.300.28
p-Value Yerevan0.000.000.000.000.000.000.000.000.000.000.000.000.000.00
Spearman’s coefficient Hrazdan0.100.050.120.110.130.120.130.180.210.130.260.140.160.21
p-Value Hrazdan0.300.600.210.230.170.210.160.050.020.170.010.150.110.03
Spearman’s coefficient Vanadzor−0.07−0.06−0.02−0.05−0.02−0.07−0.12−0.05−0.07−0.15−0.12−0.11−0.02−0.09
p-Value Vanadzor0.470.490.800.590.860.430.190.590.440.110.220.260.830.34
Nitrogen dioxide
Spearman’s coefficient Yerevan0.040.070.080.100.100.140.180.160.170.190.180.190.180.20
p-Value Yerevan0.630.470.380.300.270.130.060.090.070.040.050.040.060.04
Spearman’s coefficient Hrazdan−0.36−0.37−0.36−0.34−0.46−0.43−0.32−0.35−0.37−0.36−0.41−0.36−0.30−0.41
p-Value Hrazdan0.000.000.000.000.000.000.000.000.000.000.000.000.000.00
Spearman’s coefficient Vanadzor −0.07−0.09−0.11−0.08−0.11 −0.13−0.03
p-Value Vanadzor 0.480.330.230.410.23 0.170.74
Publisher’s Note: MDPI stays neutral with regard to jurisdictional claims in published maps and institutional affiliations.

