Article

The UAE Cloud Seeding Program: A Statistical and Physical Evaluation

1
National Center of Meteorology, Department of Research, Development and Training, Abu Dhabi P.O. Box 4815, United Arab Emirates
2
UAE Research Program for Rain Enhancement Science, National Center of Meteorology, Abu Dhabi P.O. Box 4815, United Arab Emirates
*
Author to whom correspondence should be addressed.
Atmosphere 2021, 12(8), 1013; https://doi.org/10.3390/atmos12081013
Submission received: 20 June 2021 / Revised: 27 July 2021 / Accepted: 2 August 2021 / Published: 7 August 2021
(This article belongs to the Special Issue Aerosol–Cloud–Precipitation Interactions: From Weather to Climate)

Abstract

:
Operational cloud seeding programs have been increasingly deployed in several countries to augment natural rainfall amounts, particularly over water-scarce and arid regions. However, evaluating operational programs by quantifying seeding impacts remains a challenging task subject to complex uncertainties. In this study, we investigate seeding impacts using both long-term rain gauge records and event-based weather radar retrievals within the framework of the United Arab Emirates (UAE) National Center of Meteorology’s operational cloud seeding program. First, seasonal rain gauge records are inter-compared between unseeded (1981–2002) and seeded (2003–2019) periods, after which a posteriori target/control regression is developed to decouple natural and seeded rainfall time series. Next, trend analyses and change point detection are carried out over the July-October seeding periods using the modified Mann-Kendall (mMK) test and the Cumulative Sum (CUSUM) method, respectively. Results indicate an average increase of 23% in annual surface rainfall over the seeded target area, along with statistically significant change points detected during 2011 with decreasing/increasing rainfall trends for pre-/post-change point periods, respectively. Alternatively, rain gauge records over the control (non-seeded) area show non-significant change points. In line with the gauge-based statistical findings, a physical analysis using an archive of seeded (65) and unseeded (87) storms shows enhancements in radar-based storm properties within 15–25 min of seeding. The largest increases are recorded in storm volume (159%), area cover (72%), and lifetime (65%). The work provides new insights for assessing long-term seeding impacts and has significant implications for policy- and decision-making related to cloud seeding research and operational programs in arid regions.

Graphical Abstract

1. Introduction

In response to shortages in water resources, exacerbated by growing populations and a changing climate, an increasing number of countries have invested in weather modification research and applications [1]. Precipitation enhancement is a subset of weather modification that aims to augment natural rainfall (or snowfall) amounts through airborne or ground-based interventions in the microphysical processes of specific cloud types [2,3]. Targeting warm clouds, hygroscopic cloud seeding entails introducing large artificial (hygroscopic) aerosol particles into clouds to increase the uptake of available cloud liquid water beyond that expected from the natural background aerosol population with relatively smaller diameter sizes [4,5,6]. The larger seeding particles are expected to trigger a “competition effect” which favors the production of large drops that can activate the collision-coalescence process and enhance rainfall generation [7,8,9]. The basic assumption is that increased cloud buoyancy, achieved through conversion of cloud water content into liquid droplets through condensation, will enhance the release of latent heat, increase cloud depth and result in larger cloud extent and lifetime and rainfall intensity.
Evaluating the effectiveness of operational cloud seeding programs is critical to advance weather modification research as well as to provide policymakers with realistic cost-benefit metrics. According to the most recent review on global precipitation enhancement activities conducted by the World Meteorological Organization (WMO) Expert Team on Weather Modification, cloud seeding from aircraft platforms is generally considered more effective compared to other techniques such as ground-based generators, customized rockets, and artillery shells [1]. Results from operational cloud seeding programs spanning several countries, including Australia [10], China [11], India [12], Israel [13], South Africa [14,15,16], Thailand [17], and the United States [18,19], record between 10–30% increases in precipitation amounts and cloud lifetime. Alternatively, several studies report on the limited efficacy of seeding experiments for drought relief [20], along with inconclusive results stemming from unreliable measurements and/or co-occurring microphysical and dynamical processes that are difficult to account for [21,22].
The complex spatiotemporal variability of cloud properties and resulting precipitation represents the main source of uncertainty in seeding impact evaluations. As such, field experiments offer a single realization of seeding effects within a specific cloud lifetime which may significantly differ from an unseeded (control) cloud [23,24]. In fact, the methodology of experimentation, randomization, and statistical analysis needed for cloud seeding programs draws several parallels with the design of randomized clinical trials in the medical field [25]. Albeit, clouds are a transient and less accessible sample unit compared to human patients, which challenges the reproducibility of randomized seeding experiments.
To overcome the limitations of field experiments, several long-term statistical analyses have been pursued to evaluate seeding impacts using control-target (i.e., unseeded-seeded) regression derived from historical rainfall records [26,27,28,29,30,31]. Fluek [32] outlines this procedure and discusses its advantages and limitations. Rainfall records over target and control areas during unseeded periods are used to establish a regression equation that emulates natural rainfall (unassociated with seeding) over the target area during the seeding period. Potential seeding impacts are determined by comparing the regression-based (predicted) natural rainfall in the target area to the actual observed rainfall during seeding periods. The basic requirements are that rainfall records over the target and control areas are reasonably correlated and that rainfall over the control gauges are not contaminated by seeding over the target area. Solak, et al. [33] adapted a posteriori historical target/control regression to estimate the downwind effects on precipitation during an operational snow enhancement project in Utah, USA. They established a linear regression equation between each downwind gauge and the control group that provided the highest correlation of precipitation with the downwind gauge. The extra-area seeding effect was demonstrated by comparing the observed downwind precipitation during the seeding period with the natural downwind precipitation predicted by the regression equation. Their results suggested an average increase in extra-area precipitation of about 8% over both the target and downwind areas. Similarly, a historical target/control regression model was derived for evaluating cloud seeding effects over Israel during the period 1976–1990 which showed an increase of 6% in mean annual rainfall [34]. Nevertheless, the aforementioned statistical analyses exclusively rely on local scale (rain gauge) measurements that fail to capture potential changes in climate circulations which may influence local rainfall regimes beyond seeding effects. Hence, diagnosing the physical mechanisms associated with potential changes in seeded cloud properties is necessary to interpret the statistical findings.
Weather radars generate high-resolution and real-time estimates of cloud and precipitation properties above the surface by emitting electromagnetic signals and analyzing backscatters from intercepted hydrometeors [35]. They return continuous volumetric scans of cloud systems which provide critical information on their microphysical and thermodynamic evolution throughout their lifetime [36]. As such, weather radars have been a key instrument in several cloud seeding experiments and evaluation programs. Reinking and Martner [37] conducted one of the earlier attempts of using circular-polarization radar to track the dispersion of seeding aerosols (using radar chaff as a proxy) released at convective cloud bases. They derived quantitative measurements of seeding aerosol dispersion and dilution rates at multiple levels to demonstrate the effectiveness of cloud base seeding for both rainfall enhancement and hail suppression purposes. Consolidating the outcomes of the South African Rainfall Enhancement Program, Terblanche, et al. [38] compiled a radar-based storm climatology over a 10,000 km2 seeding target area using thresholds of 15 min and 30 dBZ for storm lifetime and radar reflectivity, respectively. They found that seeded storms produce approximately twice as much radar-estimated rainfall as the control (unseeded) storms. More recently, volume-scans from Doppler radars have been increasingly used to identify physical differences between seeded and unseeded cloud properties including storm volume, area cover, lifetime, rain flux/mass, top height, and precipitable water content [17,18,39,40]. Ground-based radar measurements are often complemented by in-situ airborne measurements from specialized cloud physics aircraft, when available.
Conventional randomized aircraft seeding experiments fail to account for differences in the dynamical and microphysical properties between targeted clouds, which are particularly pronounced in desert environments with diverse dust and aerosol populations [41,42,43]. With less than 120 mm of mean annual rainfall across the nation [44], the United Arab Emirates (UAE) has implemented an operational aircraft-based hygroscopic seeding program over the past two decades [45]. The UAE is situated along the eastern coast of the Arabian Peninsula within a regional dust hotspot impacted by transcontinental air masses converging over its coastal and mountainous landscapes [46,47]. The UAE Unified Aerosol Experiment (UAE2) represents the first comprehensive airborne assessment of the ambient aerosol population over the UAE [48]. The measurements indicated an abundance of sulfate-dominant fine-mode aerosols which may significantly impact cloud and rainfall formation. The UAE is therefore considered a “natural laboratory” to study both mesoscale features and microscale aerosol-cloud-precipitation processes within a limited geographical area.
Investigating seeding effects by combing both physical and statistical analyses is considered the most systematic approach to evaluate cloud seeding experiments [24,49]. Here, we present the first results of the UAE cloud seeding program by comparing seasonal rain gauge records for unseeded (1981–2002) and seeded (2003–2019) periods. Posteriori historical target/control regression, change point detection and time-series analyses are carried out to statistically decouple natural and seeded rainfall. The statistical evaluations are complemented by a radar-based physical investigation by comparing an archive of seeded and unseeded storm properties.

2. Materials and Methods

The UAE cloud seeding program, implemented by the National Center of Meteorology (NCM), follows the conventional approach of igniting hygroscopic flares composed of natural salts (primarily potassium chloride) at the base of convective clouds near the updraft core. Launched in 2002, the program targeted frequent summertime convection [50] along the northeastern Hajar mountains (see Figure 1). The program infrastructure subsequently expanded over the years until suitable cloud candidates were targeted year-round over the entire UAE from 2010 onwards.

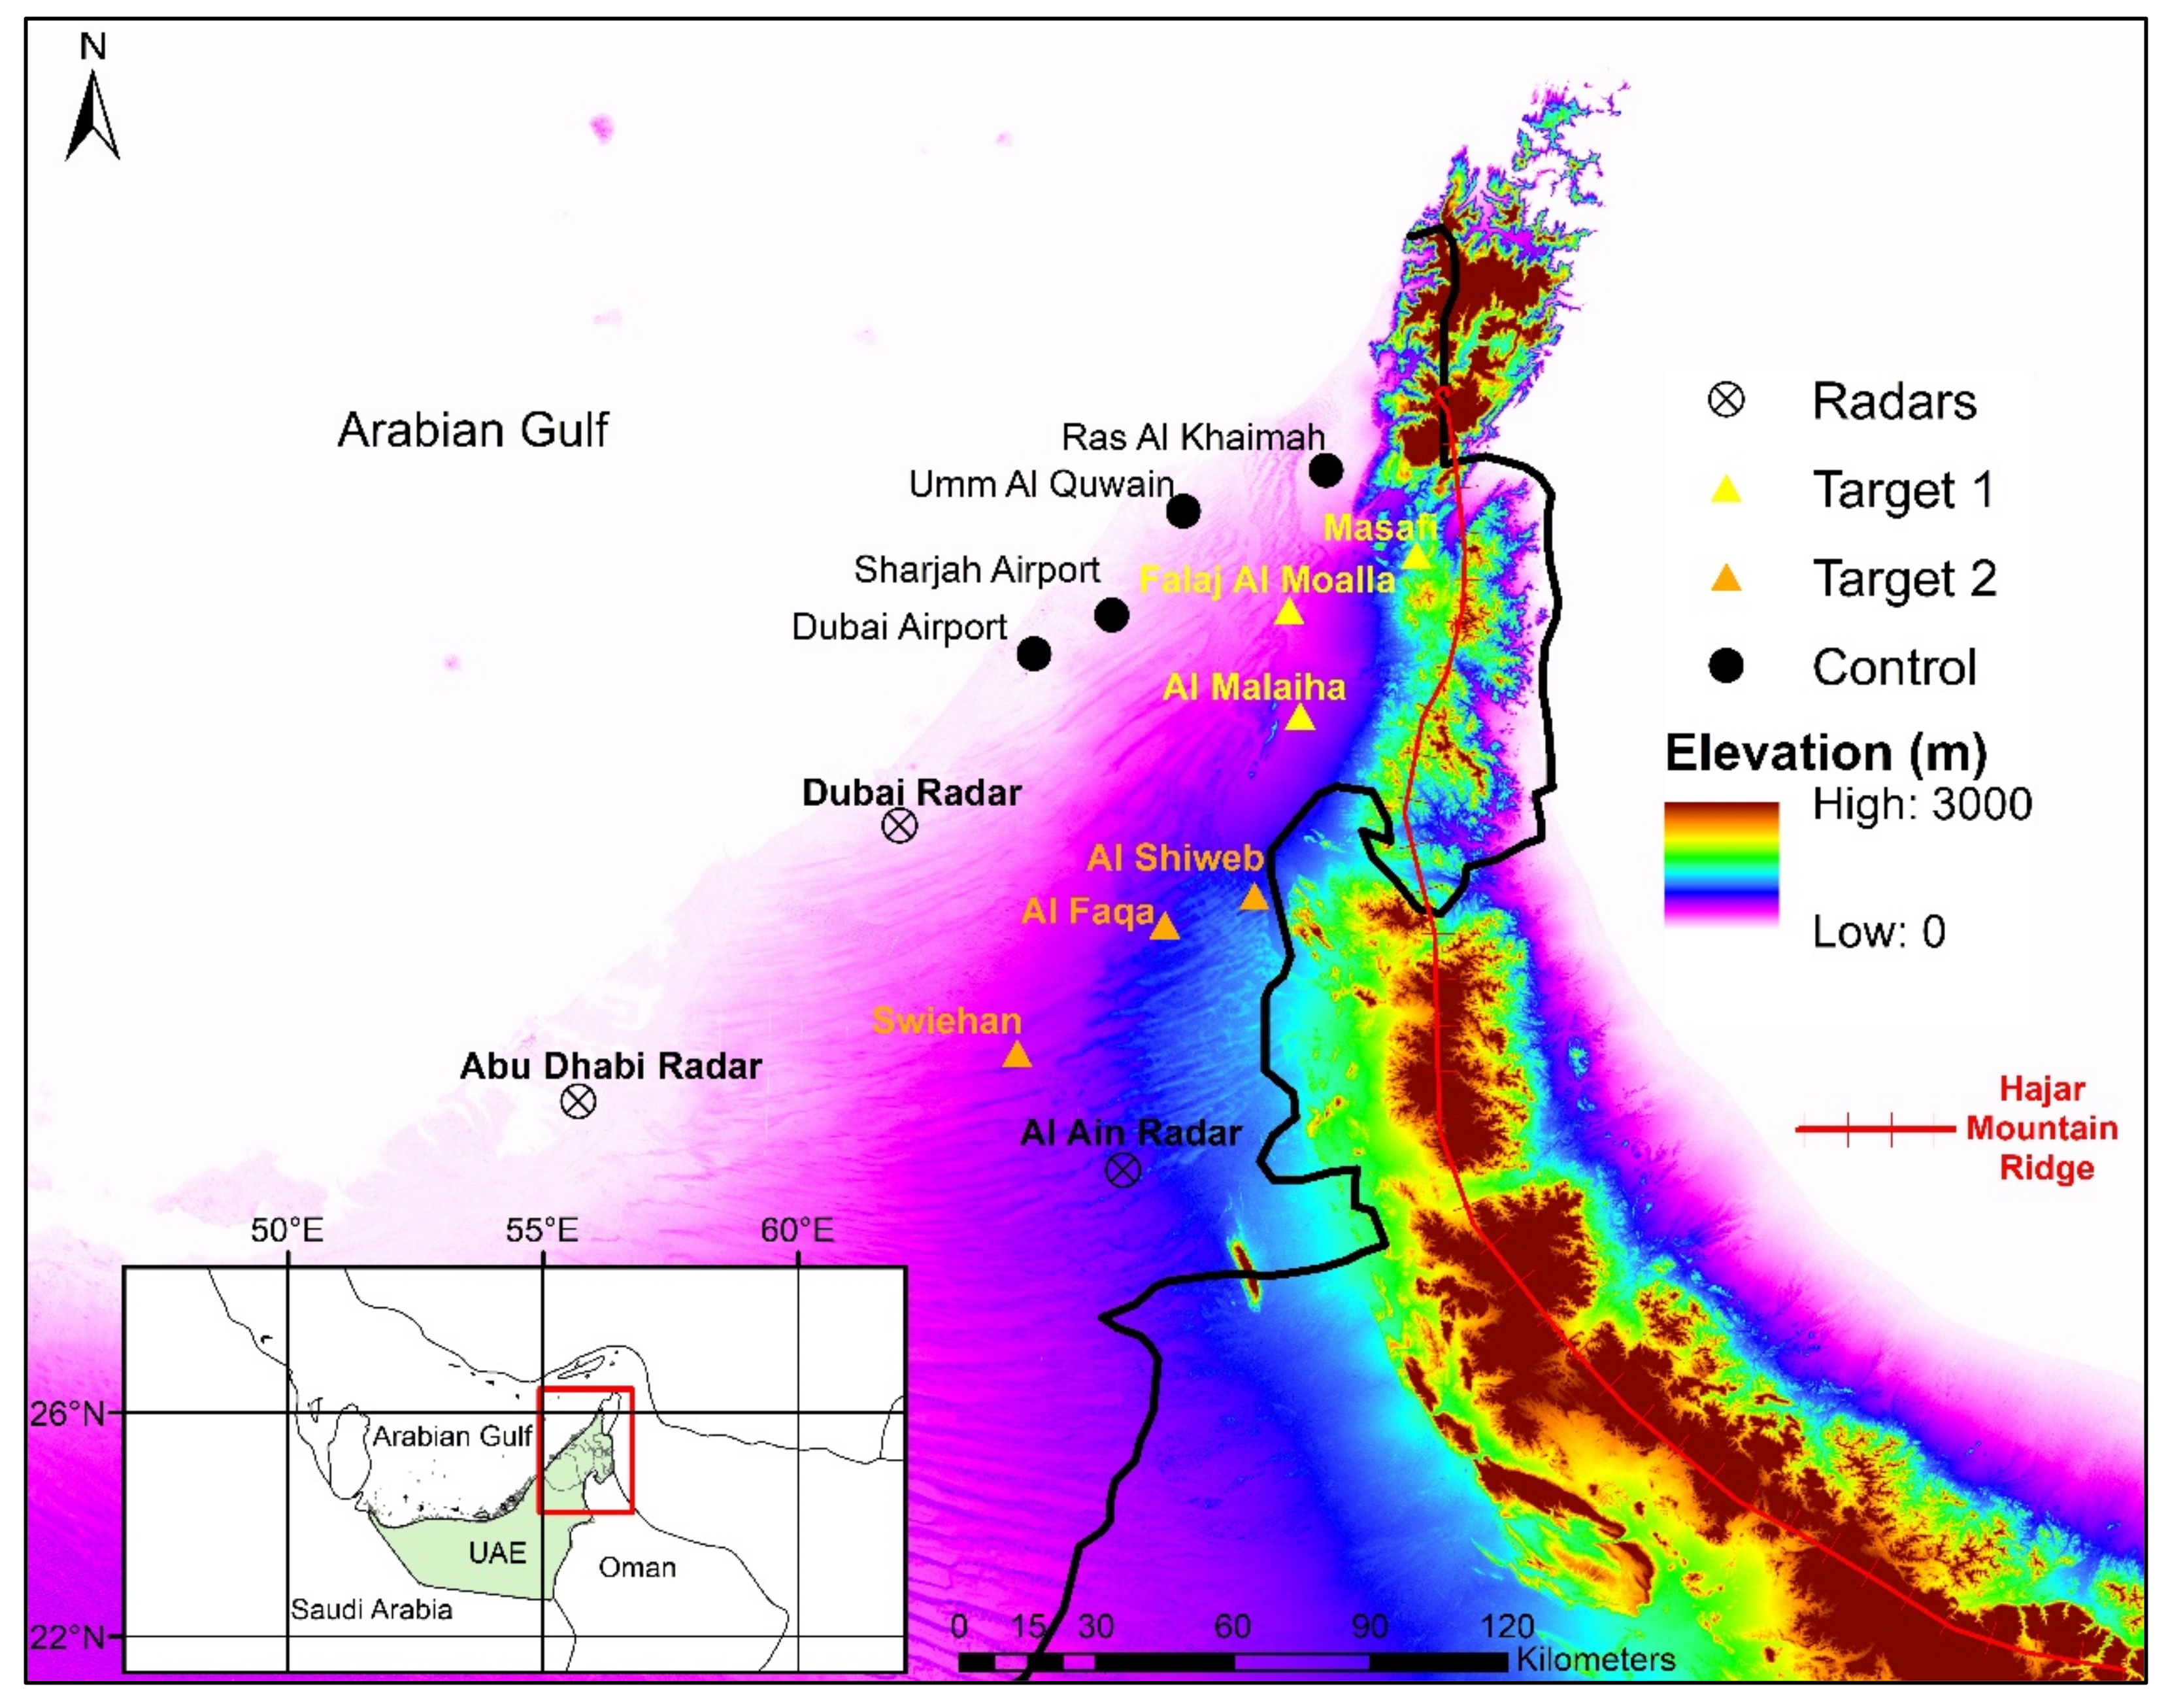
2.1. Rain Gauge Data

The long-term rain gauge dataset was compiled from two separate sources during the 1980–2002 and 2003–2019 periods. The first period was retrieved from the UAE Agricultural Authority records, currently merged under the portfolio of the Ministry of Climate Change and Environment, while the second period was retrieved from Automatic Weather Station (AWS) records maintained by the NCM. Figure 1 shows the terrain elevation across the study area in the northeastern UAE, weather radar locations, and the distribution of rain gauges across the control and two target areas (see Table 1).

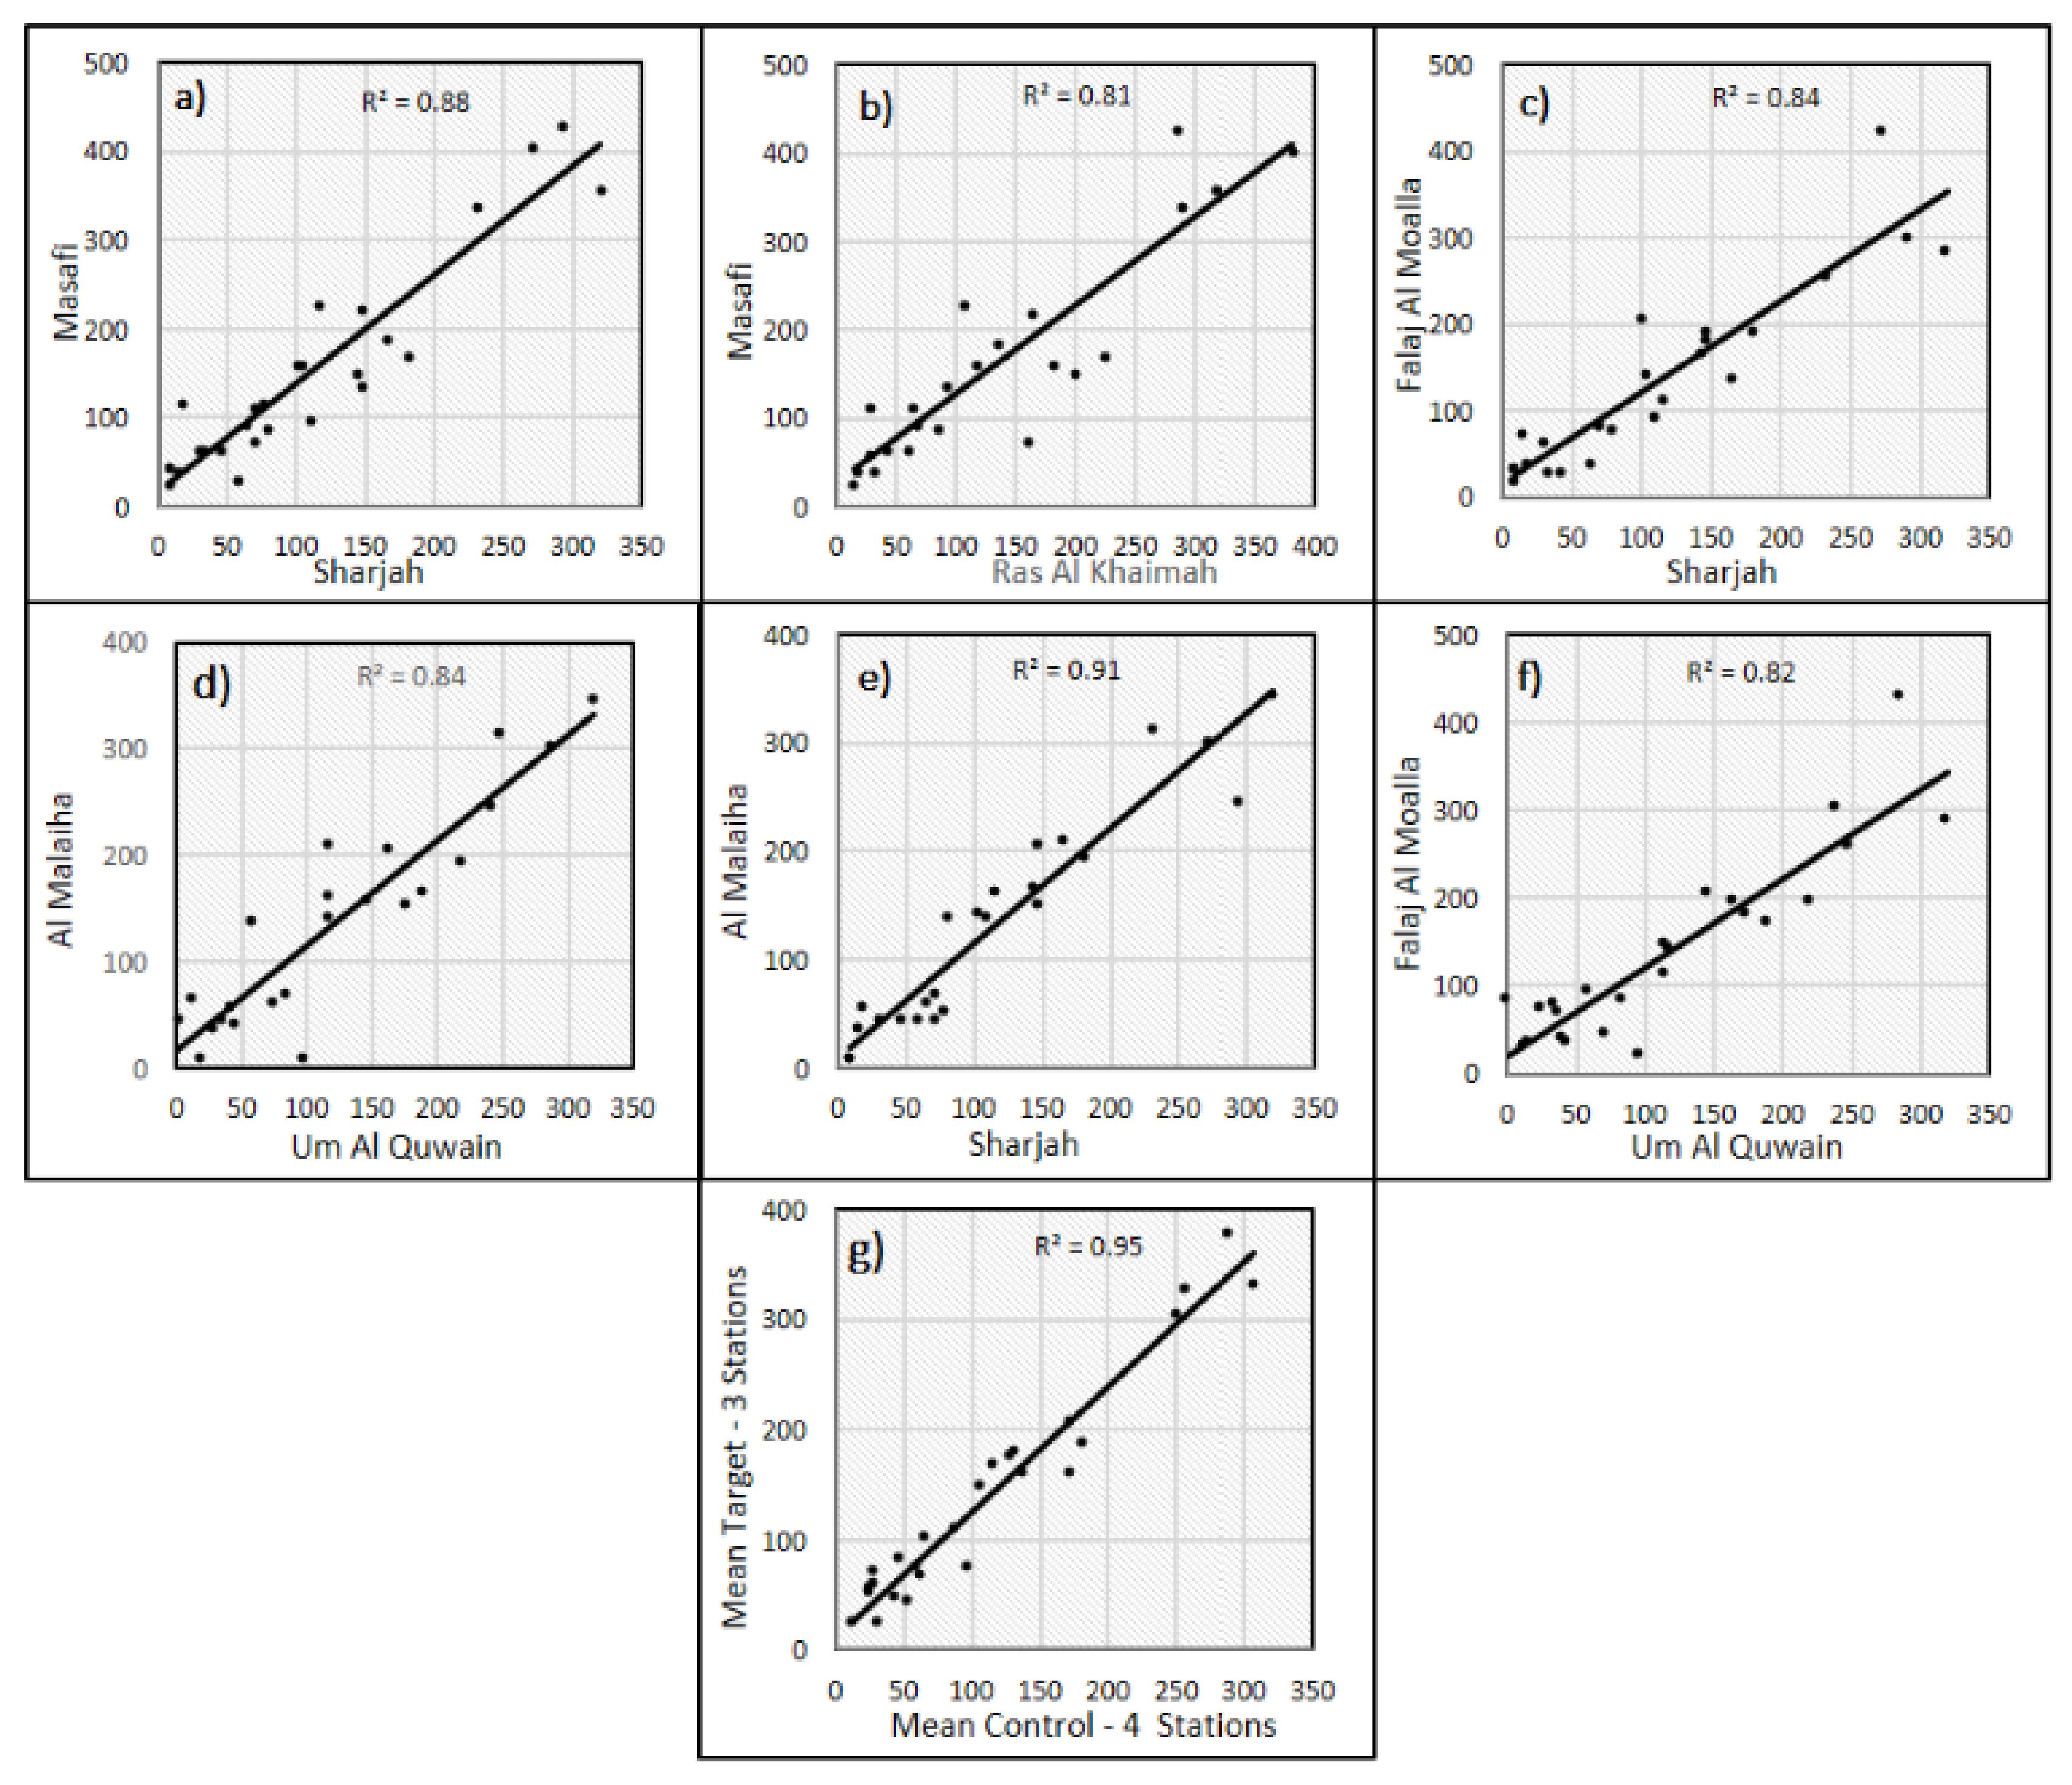
2.2. Target/Control Regression

A target/control regression requires a base period (pre-seeding) of rainfall records spanning at least 20 years to be considered statistically representative [51]. Here we use a 23-year base period from 1980–2002 from the control area and the more neighboring Target Area 1 [51]. The target/control linear regression relationship is computed as:
y i = γ + δ x i
where y i and x i are the annual rainfall in the target and control areas respectively, γ is the intercept and δ is the slope. The equations with the highest goodness-of-fit (i.e., coefficient of determination R2) are used to predict the natural (unseeded) rainfall for the individual target gauges and overall target area using the observed control rain gauge records. The predicted natural rainfall is then compared with actual (observed) amounts during the seeding period to evaluate seeding effects.

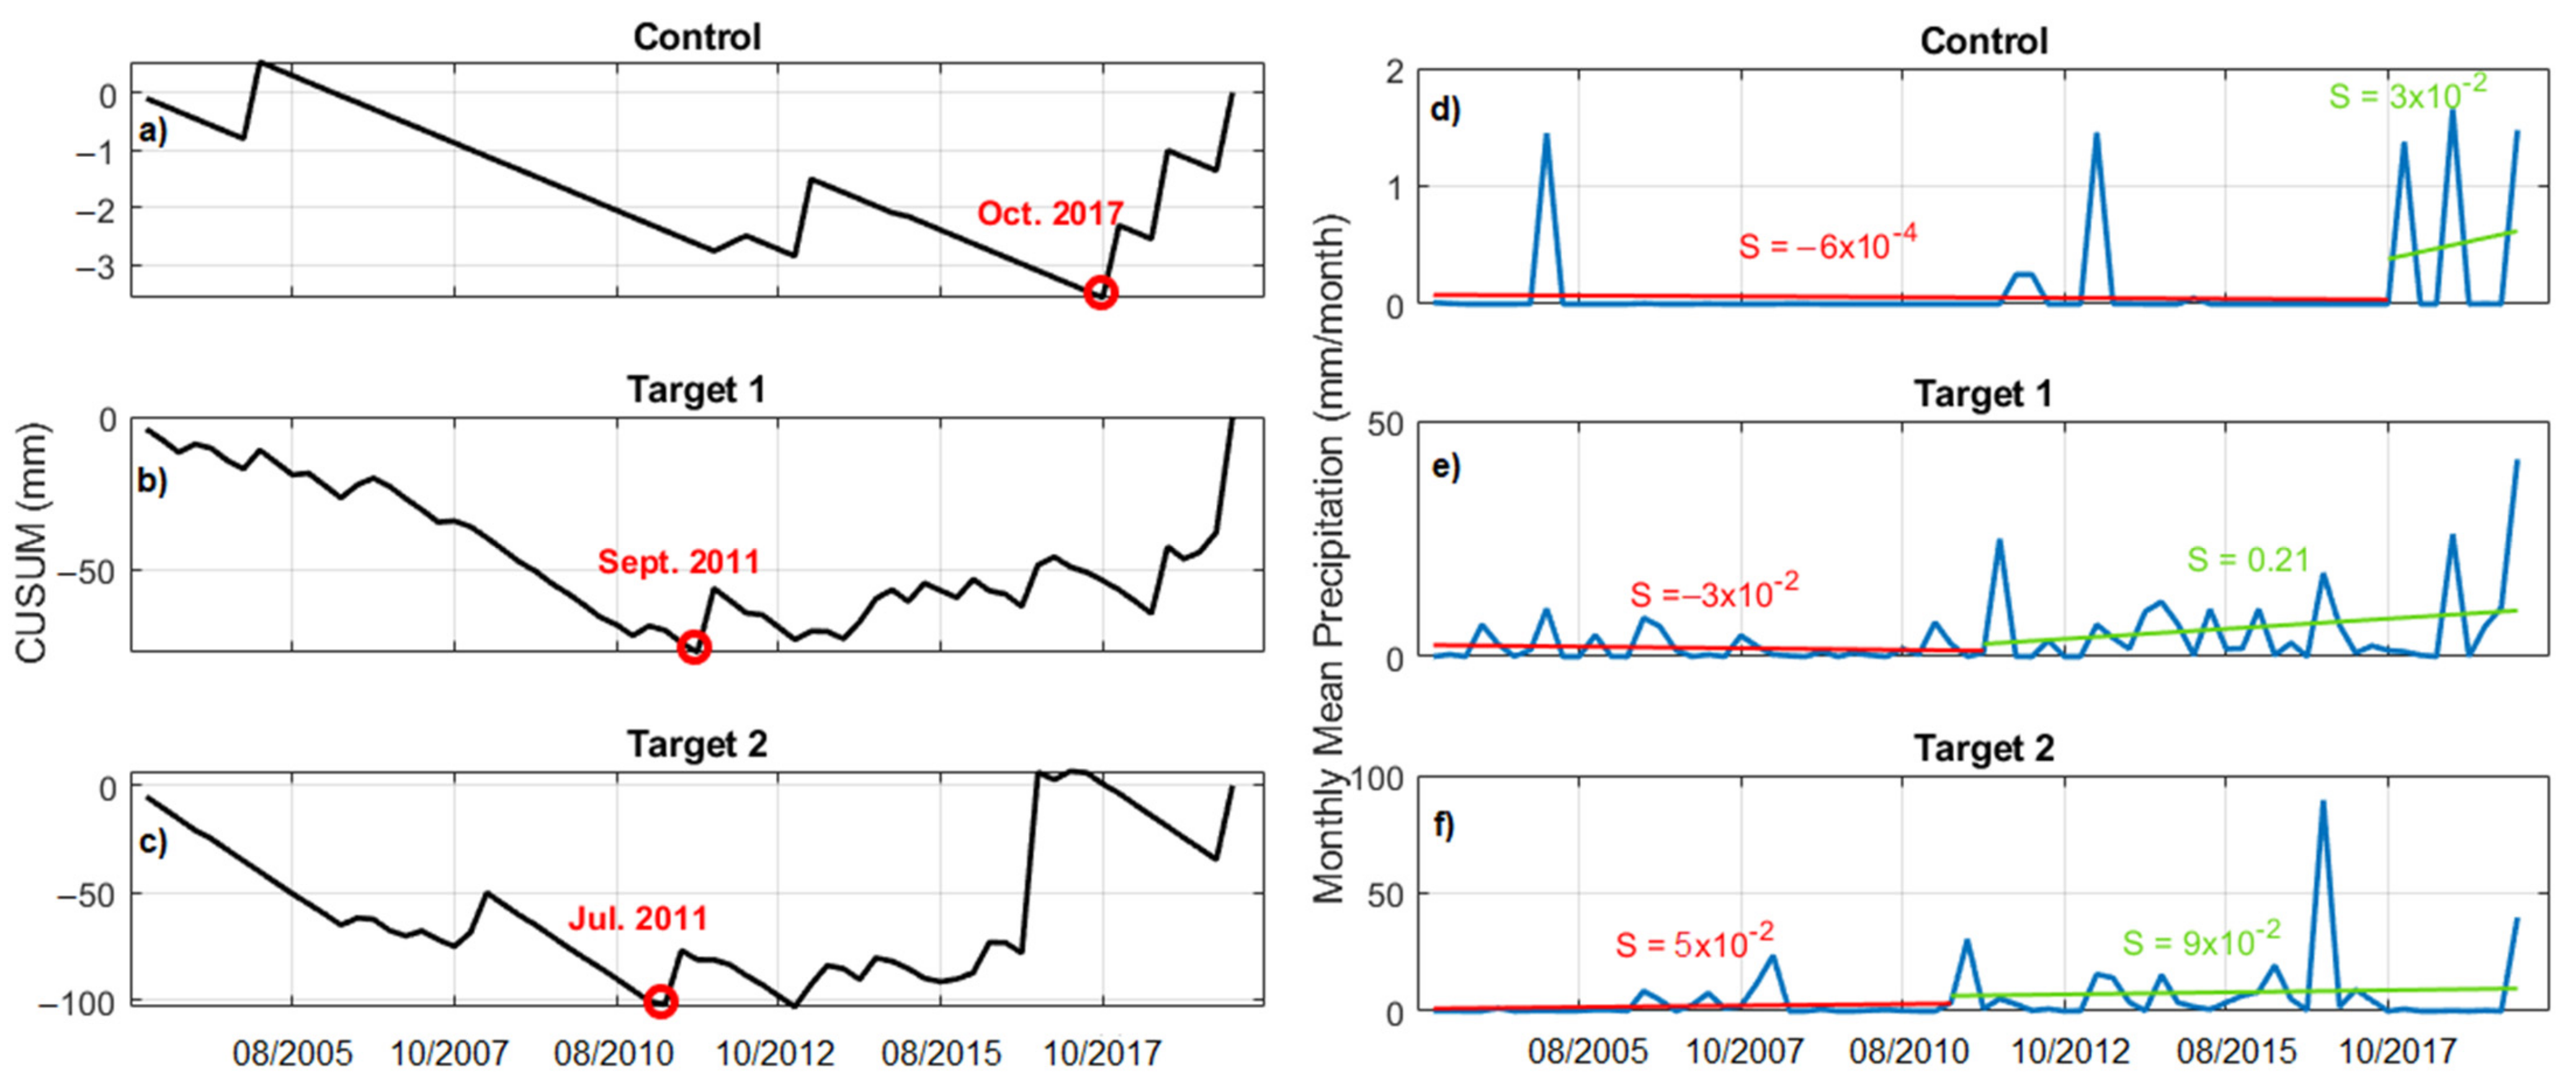
2.3. Change Point Detection

Change-point detection is the process of identifying abrupt changes in a time series and is used to further investigate the potential impacts of cloud seeding on rainfall trends over the target area. The cumulative sum (CUSUM) method [52] is a non-parametric statistical technique that has been extensively applied for change point detection of hydro-meteorological time series [46,53,54,55,56]. The method relies on accumulating the deviations from the mean and recording the absolute maxima and minima at each time step. For a given rainfall time series, x1, x2, …, xn, the cumulative sum (C) of deviations at any time k is expressed as:
C k = i = 1 k ( x i x ¯ )
The peaks/troughs of the resulting CUSUM series coincide with years where the most abrupt deviations from the mean occur. Once change points (if any) are located, the comparison of trend directions between pre- and post-change periods would indicate an overall increase/decrease in surface rainfall amounts.
The statistical significance (5% significance level) of all resulting trends is carried out using the Modified Mann-Kendall test (mMK) [57], which accounts for autocorrelations present in rainfall data. For a given sample x1, x2, …, xn, of size n, the standardized test statistic Z s is expressed as:
Z s = S     1 σ s i f   S > 0 0 i f   S = 0 S   +   1 σ s i f   S < 0
and
S = i = 1 N 1 j = i + 1 N s g n ( x j x i )
and
σ s = n n 1 2 n + 5     i = 1 m t i i i 1 2 i + 5 18
where m is the number of tied values in t i .
The null hypothesis (absence of trend) is rejected if the p-value is less than the 5% significance level.

2.4. Radar-Based Evaluation

The above statistical approaches rely exclusively on surface rainfall records logged by rain gauges that are subject to several sources of uncertainty. Also, ground-based records may not be representative of the actual generated precipitation through cloud base that is subject to high evaporation rates (virga) before reaching the surface of dry environments such as the UAE [58].
Other precursory storm properties (e.g., cloud liquid water content, volume, and top height) dictate observed differences in rainfall associated with cloud seeding. Hence, a comparative analysis between seeded and unseeded cloud properties using the NCM C-band radar network is carried out to provide a physical context for the statistical results. Starting from 2010, the radar network has been subsequently upgraded from single-pol to dual-pol retrieval with the following operational characteristics:
  • Instrumented range: 200 km
  • Range gate: 100 m
  • Min-max elevation angles: 0.5°–32.4°
  • 3-dB-Beamwidth: 1°
  • Volume scans interval: 6 min
The Lidar Radar Open Software Environment (LROSE) system, which includes the upgraded Thunderstorm Identification Tracking Analysis and Nowcasting (TITAN) algorithm [59,60], is used to provide real-time tracking of convective clouds and guide the seeding aircraft. The storm and track data used in this analysis are maintained in a database at the NCM. To ensure representative results and minimize data contamination from co-occurring processes such as entrainment, downdrafts, and evaporation, the following selection criteria and thresholds were applied: (1) Seeding is conducted within the first 20 min of the cloud lifetime; (2) Maximum reflectivity is greater than 38 dBZ; (3) Initial values of storm volume, area cover, maximum reflectivity, and precipitation flux are comparable between seeded and unseeded clouds.

3. Results

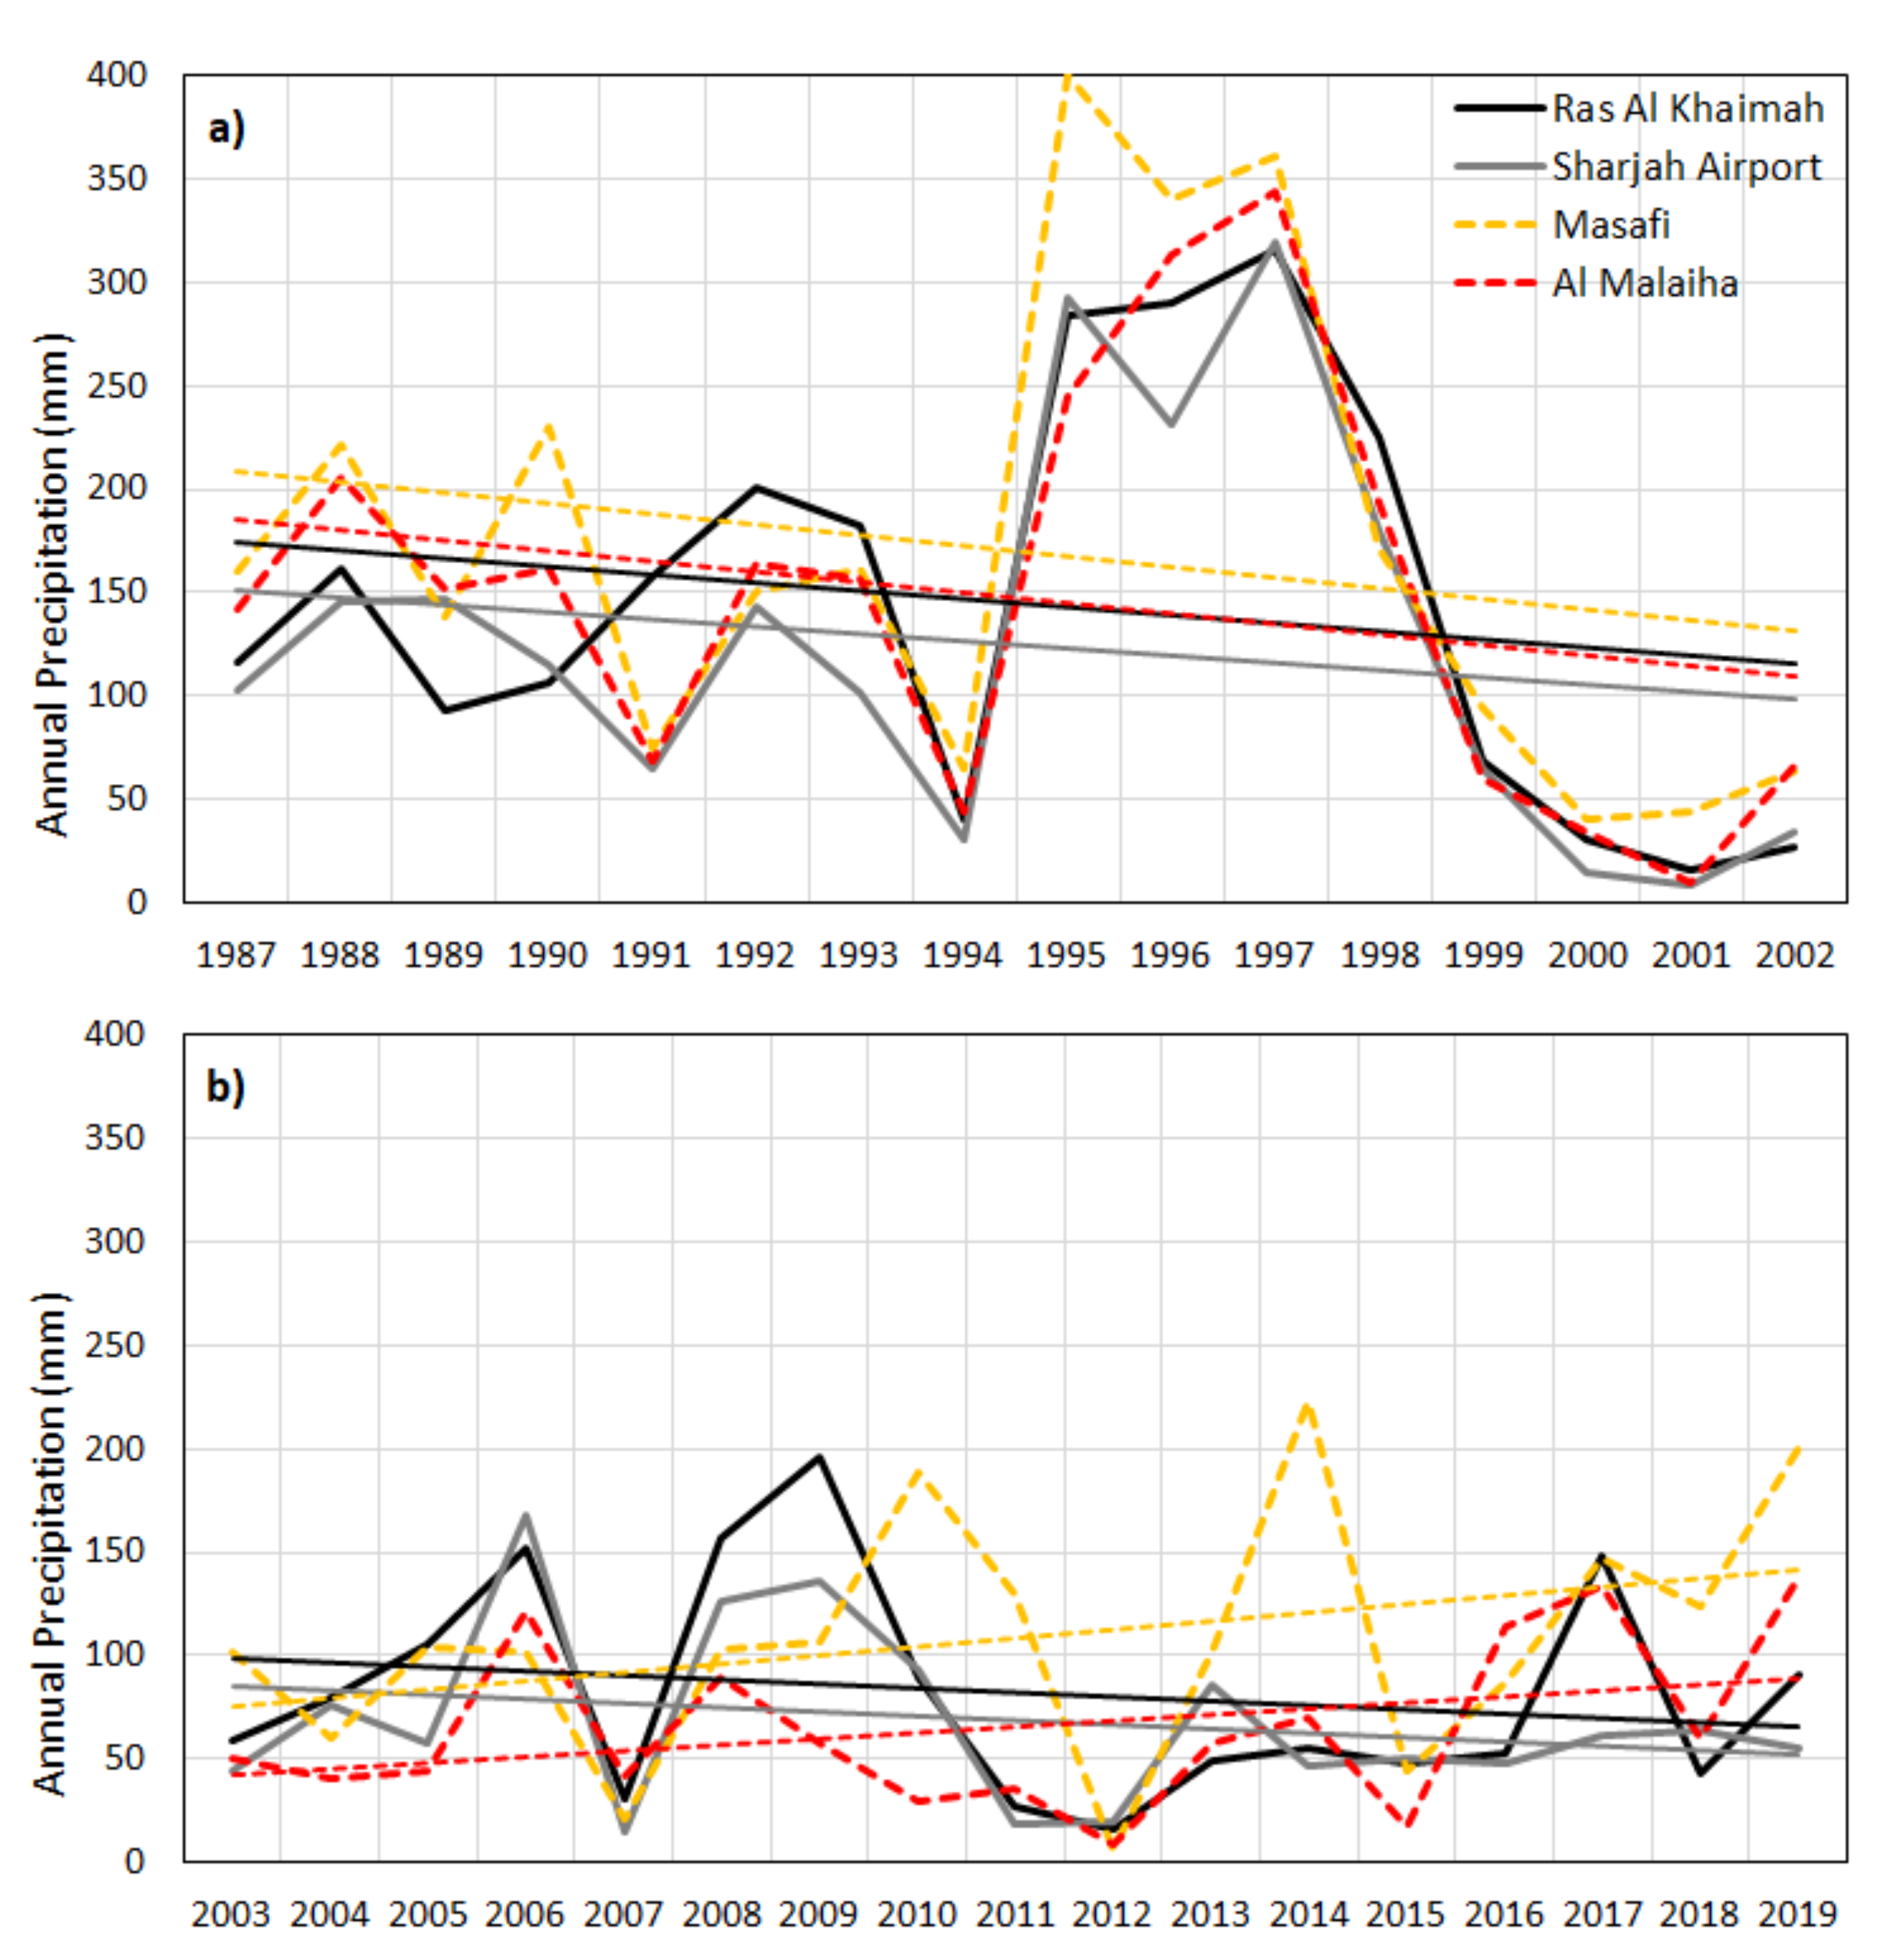
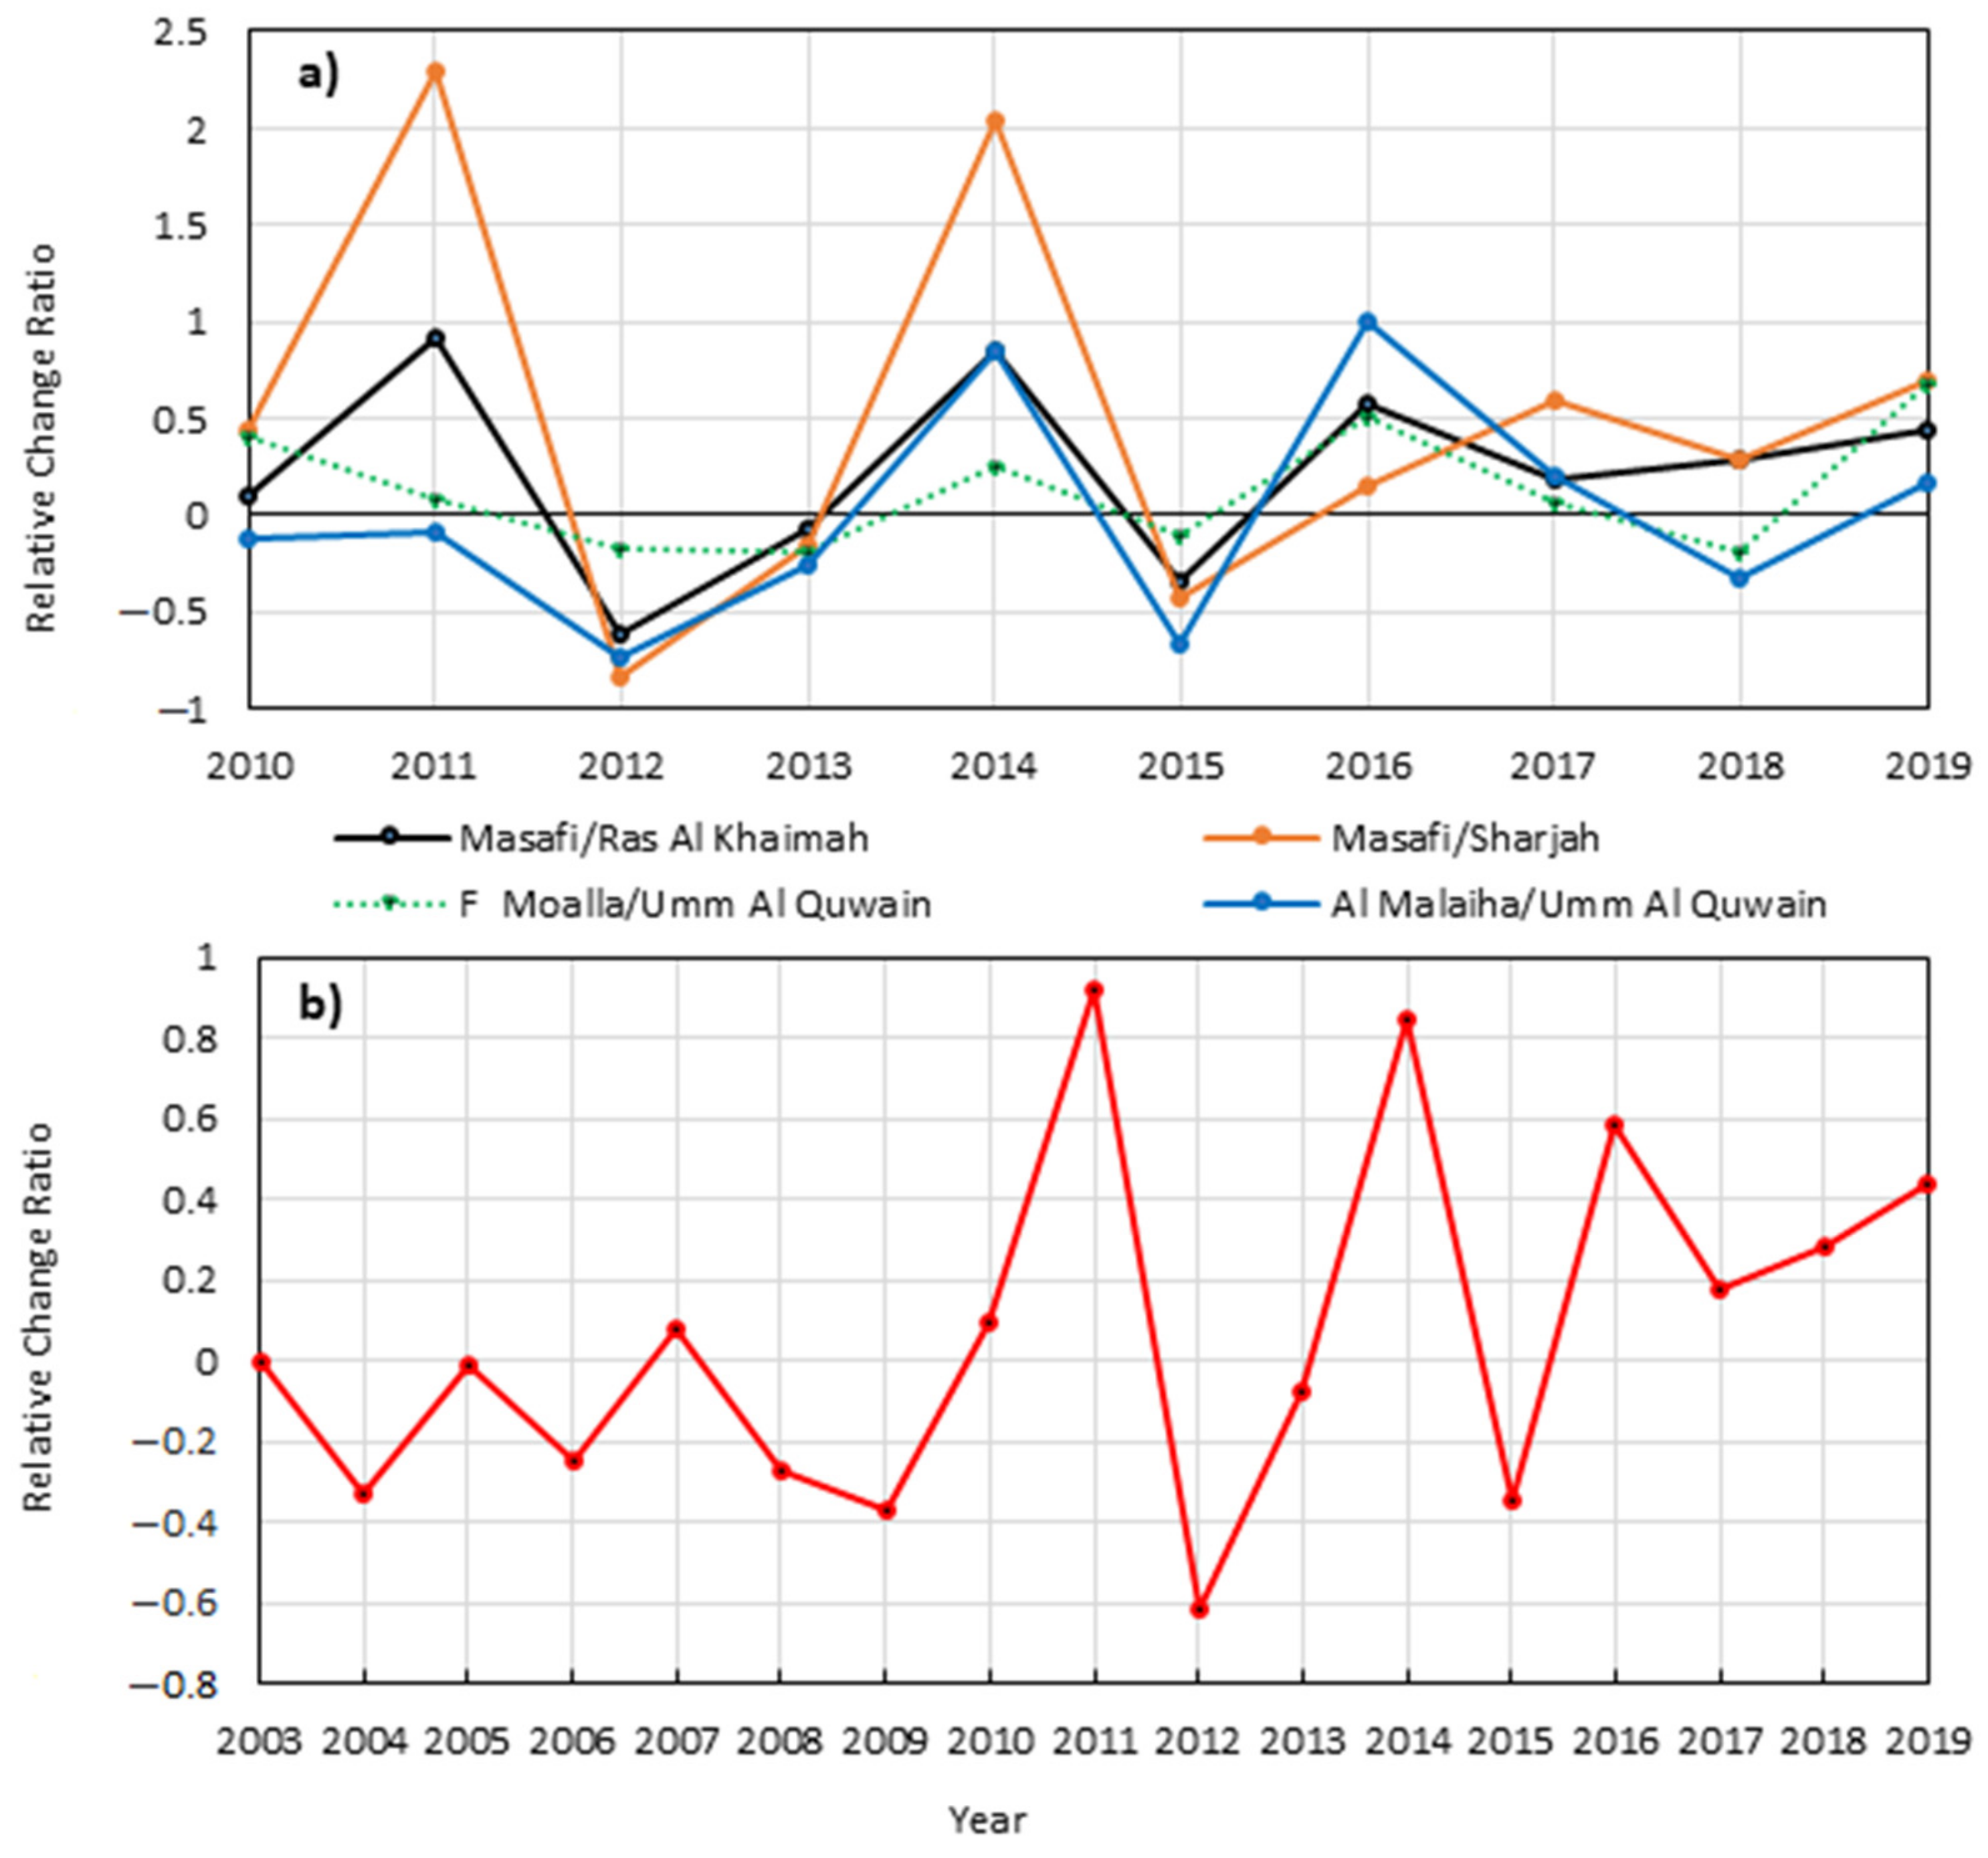
3.1. Time Series Analysis and Target/Control Regression

Figure 2 shows the time series and linear trends of observed rainfall at individual gauges, namely, Ras Al Khaimah and Sharjah gauges from the (unseeded) control area, and the Masafi and Malaiha gauges from the neighboring (seeded) Target Area 1 during the (a) 1980–2002 pre-seeding and (b) 2003–2019 seeding periods. Statistically significant negative trends are recorded during the 1980–2002 pre-seeding period at all gauges. However, both target gauges exhibit a positive trend during the 2003–2019 seeding periods, while negative trends are recorded again at the control gauges.
Figure 3 depicts the scatterplots of observed annual rainfall (mm/year) for control vs. target gauges during 1980–2002, with fitted regression lines and coefficients of determination (R2) denoted in each panel. Figure 3a–f indicates that rainfall records are highly correlated between the selected pairs of control and target gauges, with R2 values ranging from 0.81 to 0.91 between the Al Malaiha and Sharjah gauges. Figure 3g shows the best fit (R2 = 0.95) scatterplot between the mean of the four control gauges (Dubai, Ras Al Khaimah, Sharjah, and Umm Al Quwain) and that of the three target gauges (Masafi, Al Malaiha, and Falaj Al Moalla).
Table 2 lists the correlation coefficients (CC) and R2 values and corresponding regression equations for each pair of control-target gauges. The regression equations are used to predict the natural (unseeded) rainfall over the target area using the observed control records during the 2010–2019 seeding period. The predicted values are then used to compute a relative change (%) in rainfall compared to the observed rainfall at the target gauges during the 2010–2019 seeding period. The mean relative change (MRC) reflects an annual average estimate of the impact of seeding over the 10-year period and is shown to be positive in all cases—varying from 5.6% at Al Malaiha gauge to 30.8% at Masafi gauge. An average increase of 22.8% is recorded over the target area using Equation (11), which is derived from the mean of target/control observations with the best fit (R2 = 0.95).
Figure 4a shows the inter-annual variability of the relative change ratio throughout the 2010–2019 seeding period at gauges within Target Area 1. The Masafi/Sharjah regression shows the greatest improvements in 2011 and 2014 with ratios of 2.3 and 2, respectively. These substantial improvements are not likely associated with seeding alone since the number of rainfall events was evidently higher at this gauge relative to other years. Alternatively, negative change ratios are consistently recorded across all gauges for 2012 and 2015. This is attributed to the particularly low number of observed rainfall events during these two years, and consequently a limited number of conducted seeding operations. Thus, the natural variability of rainfall introduces major uncertainties and must be accounted for in the analysis. These high (2011 and 2014) and low (2012 and 2015) extremes in the natural variability of the rainfall regime are also noticeable in Figure 4b, which shows the annual variability in relative change over the target area from 2003–2019. Beyond these periods of natural variability, the degrees of improvement which are more likely attributed to seeding over the target area vary between 10% in 2010 to 40% in 2019.

3.2. Change Point Detection

The majority of seeding operations take place during the July–October period which corresponds to the highest frequency of convective clouds over the target region [61]. Hence, change point detection is carried over the July–October periods throughout the full seeding period (2003–2019) to statistically investigate a potential shift in the local rainfall regime since the initiation of seeding operations. Unlike the former target/control regression, both target areas are included in the change point detection analysis since collinearity between neighboring target and control gauges is not required. Figure 5a–c shows the time series of CUSUM values derived over the control, Target 1 and Target 2 areas, respectively. All areas record varying change points—October 2017 over the control area and July/September 2011 over Target Areas 1/2. The coincident change point during 2011 over both target areas corroborates previous trend results and provides preliminary evidence on the consistent impact of seeding over the long-term operational period. However, the physical mechanism responsible for the detected change in the rainfall time series, as well as the 2017 change over the control area, warrant further investigation. Hence, each time series was divided into pre- and post-change point time series to assess the statistical significance of the detected change points and resulting trends.
Figure 5d–f shows the time series of observed rainfall divided at detected change points with pre- and post-change point trend lines and the corresponding slope coefficient values. The mMK test is applied to test the statistical significance of all resulting trends at the 5% significance level. Interestingly, the control area trends test non-significant (even at 10% significance level), while the trends over both target areas test significant. The slopes indicate increasing trends over both target areas, with magnitudes amplified by a factor of 7 (0.21/0.03) and 1.8 (0.09/0.05) over Target Areas 1 and 2, respectively. Furthermore, a standardized t-test to assess the difference in means between pre- and post-change point series was carried out. Again, statistically significant differences in average monthly rainfall between the target pre- and post-change point periods are found, while a non-significant mean difference exists between the control series.

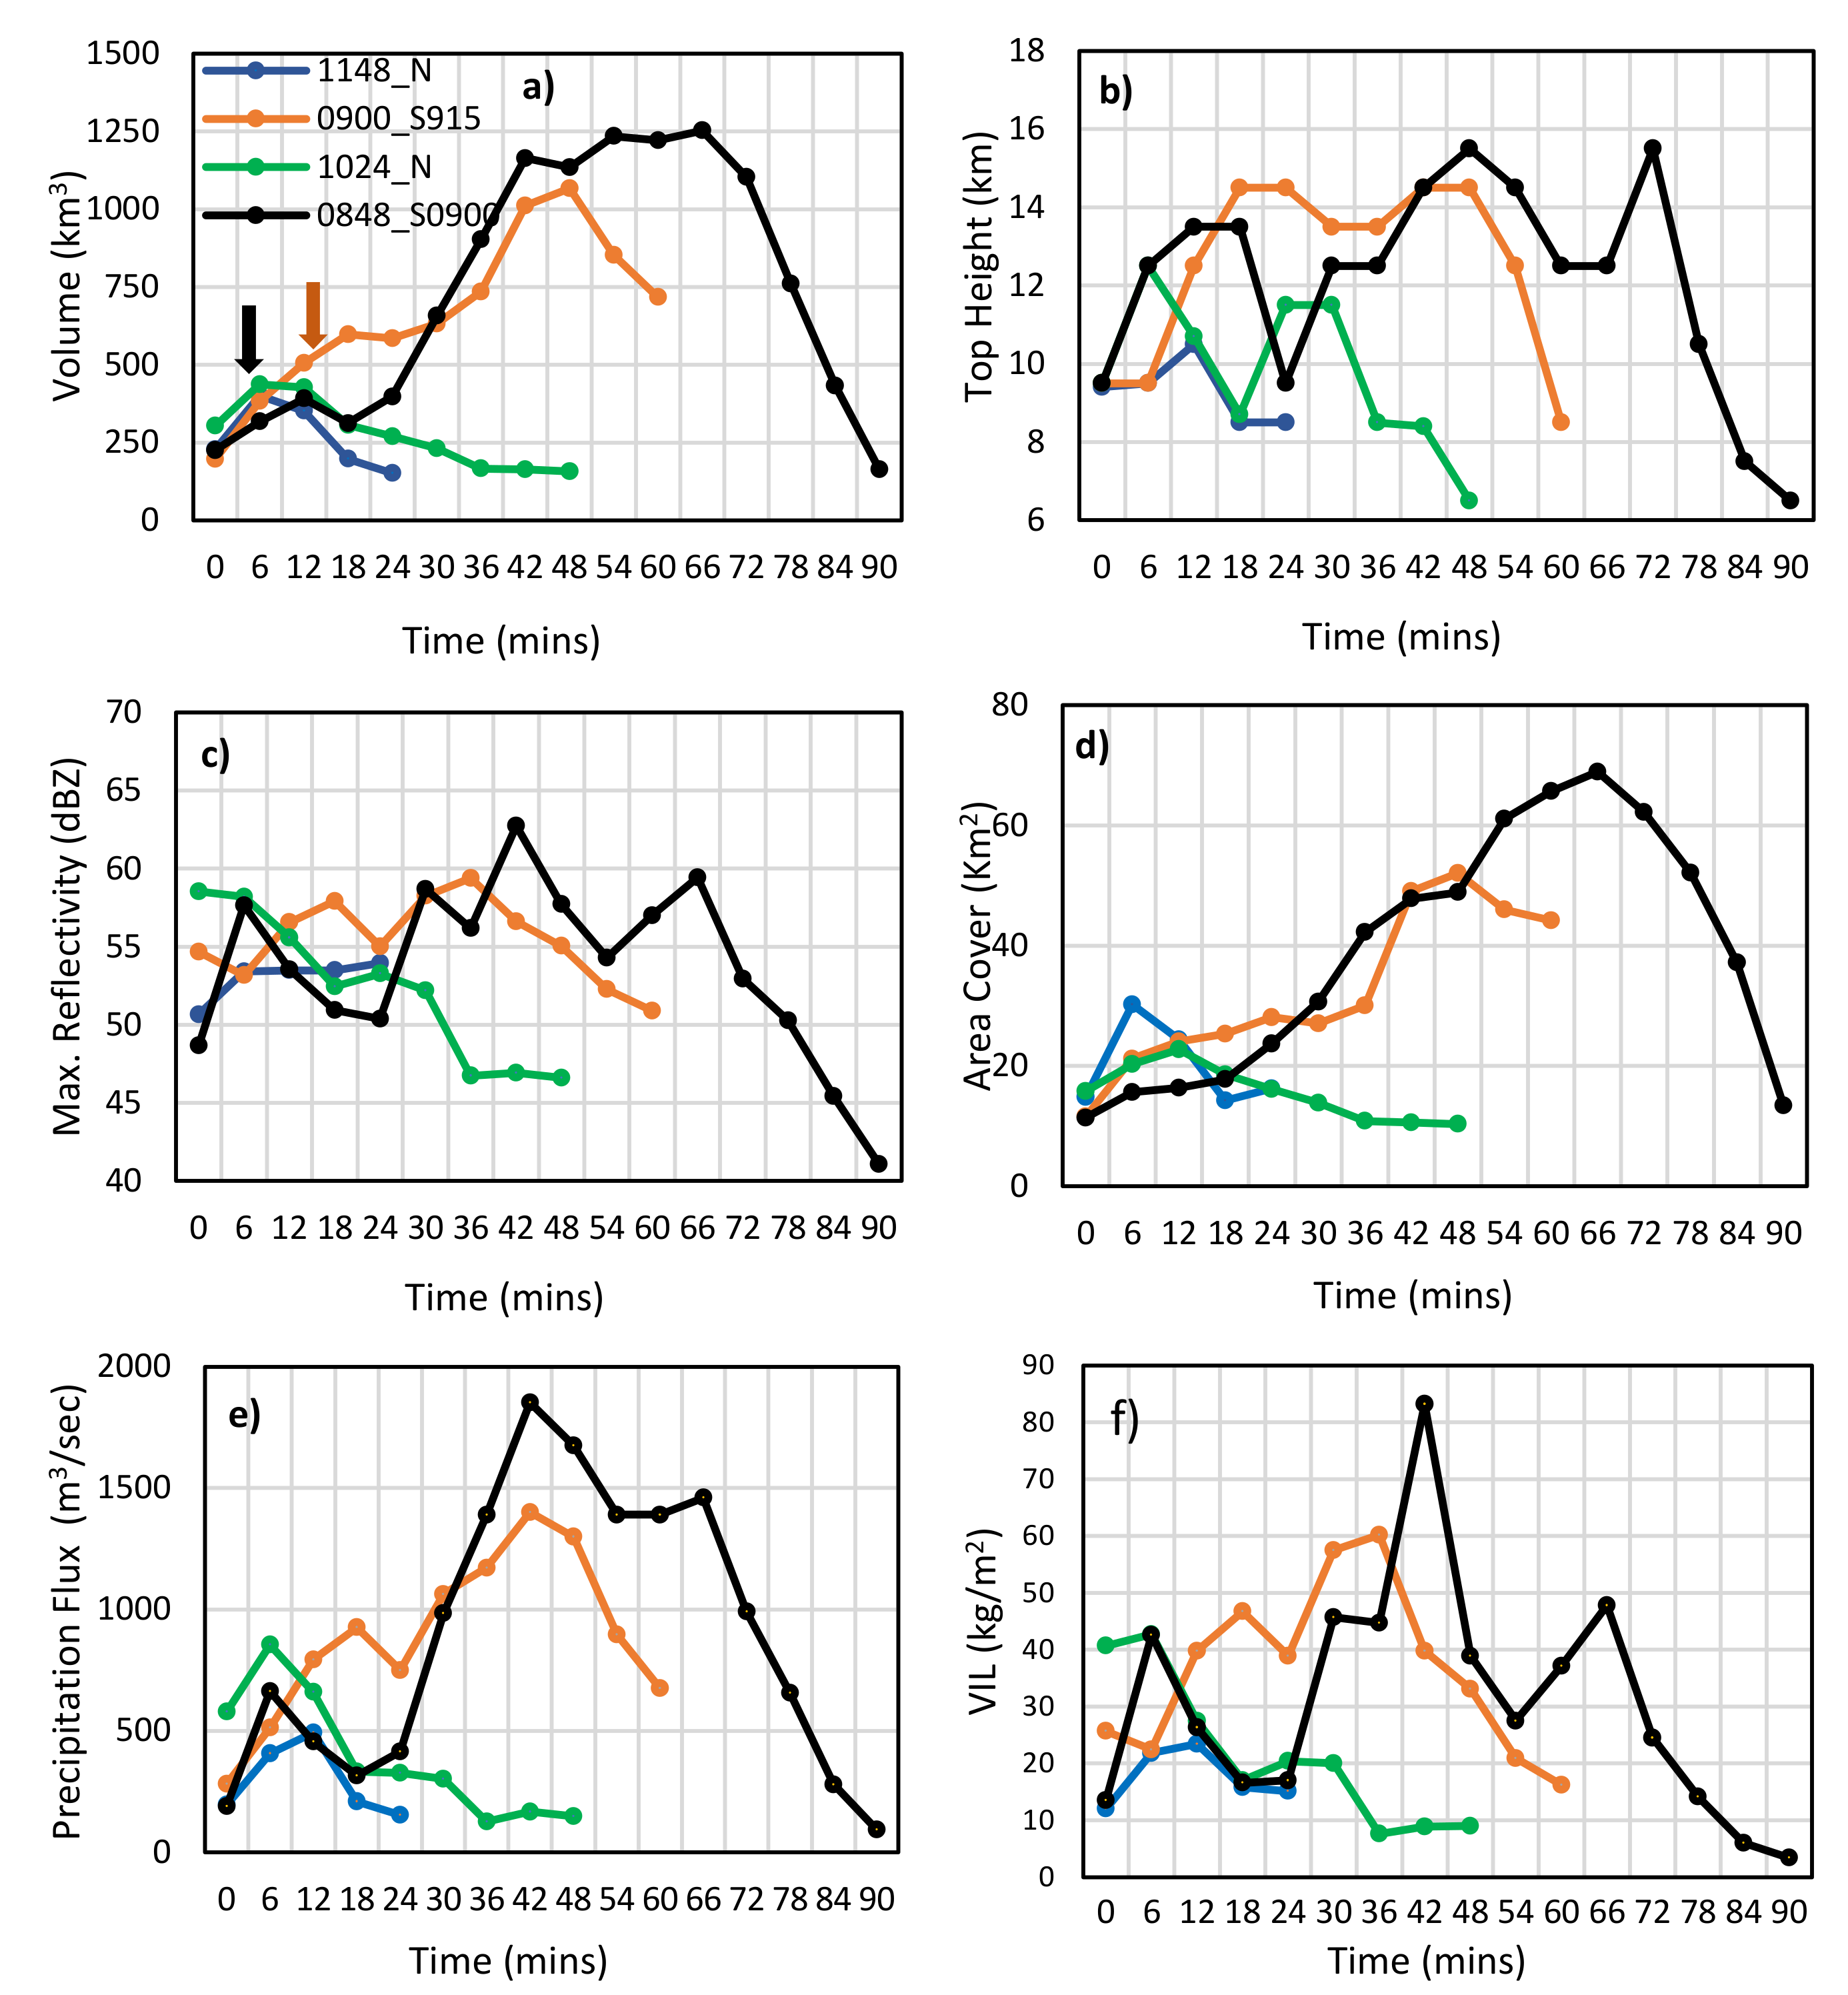
3.3. Inter-Comparison of Radar-Based Storm Properties

Further to the above statistical results which suggest the overall efficacy of seeding operations over the target area, this section presents the investigation of radar echoes of small mesoscale convective clusters to assess the physical impacts of seeding on cloud properties. First, a systematic comparison between unseeded and seeded cloud properties from two representative events in October 2018 and August 2019 is conducted. The analysis is then expanded to cover all records of seeded/unseeded events during the 2018–2019 period. The inter-compared cloud properties of interest include the echo volume (km3), top height (km), area cover (km2), maximum reflectivity (>38 dBZ), vertically integrated liquid water content (VIL; kg/m2), and precipitation flux (m3/sec). Storms with similar initial values of volume, area cover, maximum reflectivity, and precipitation flux were selected to ensure comparable convection initiation conditions between seeded and unseeded storms.

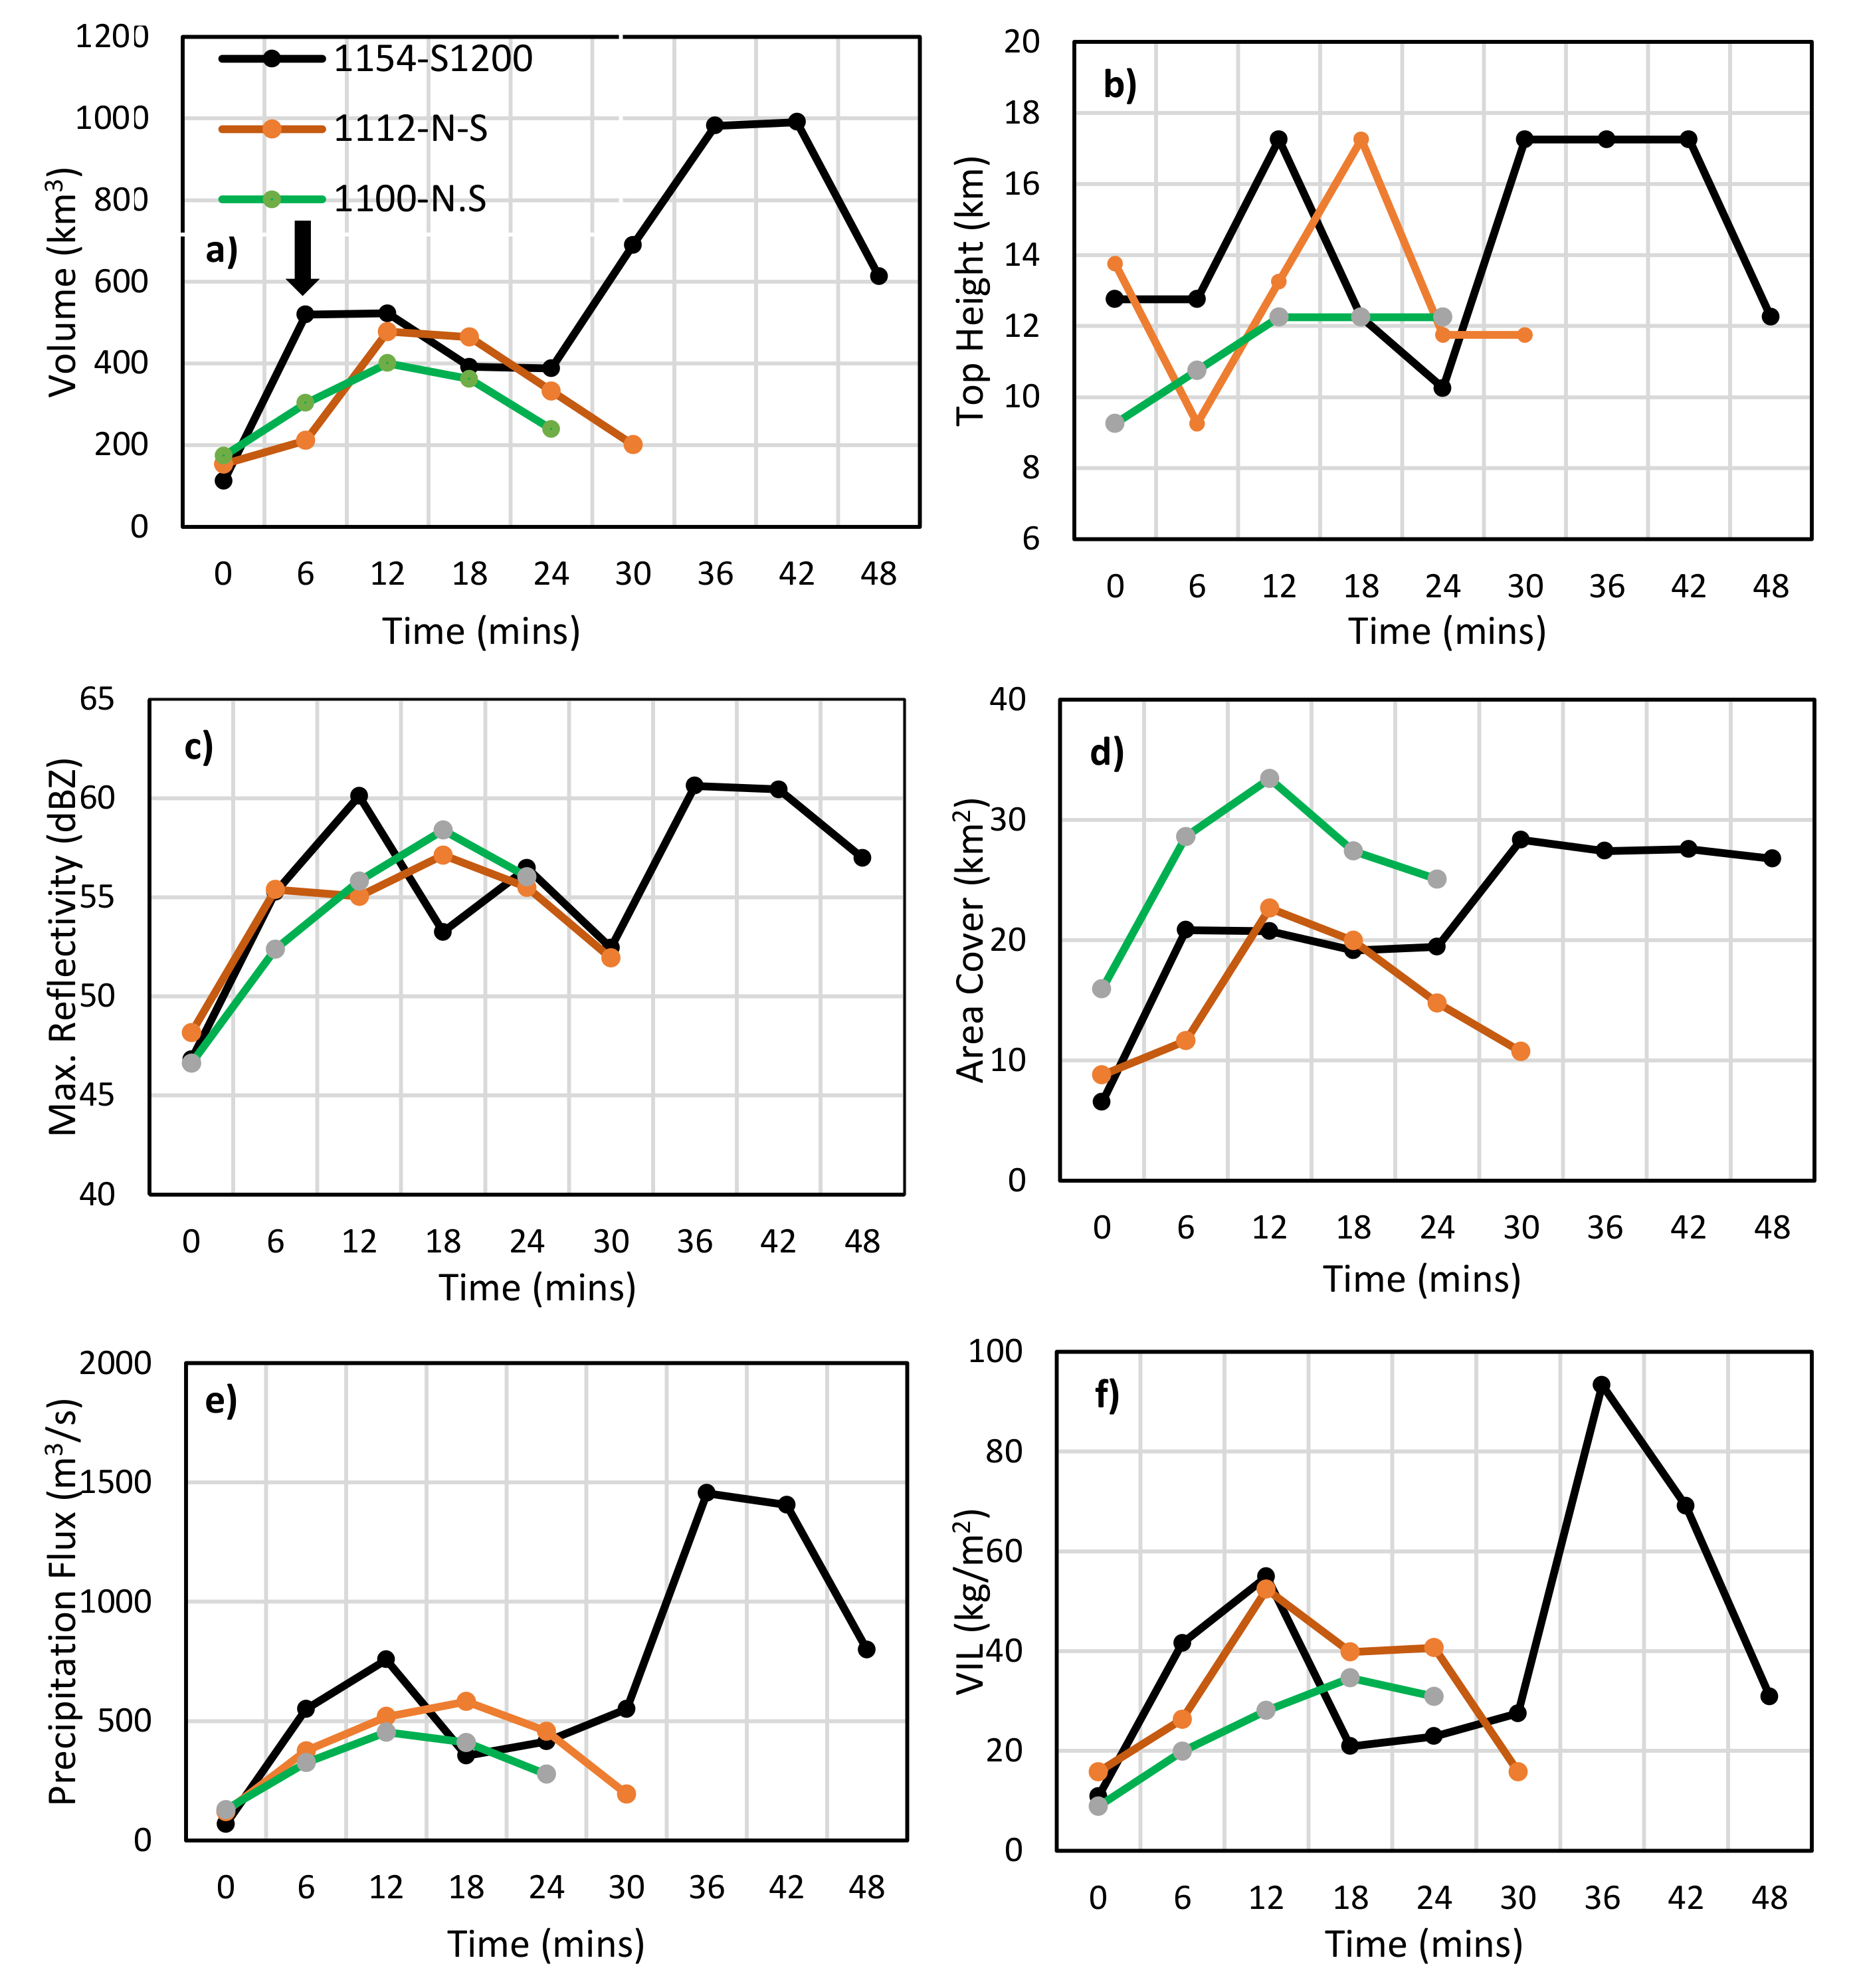
3.3.1. Case Study 1: 24 October 2018

Figure 6 shows the variations in the six radar-derived storm parameters across four different echoes observed on 24 October 2018 over the northeastern region (Target Area 1). The four storms (2 seeded and 2 remained unseeded) were selected based on comparable initial echo volumes (~250 km3). The seeded storms are labeled with their initiation and seeding times, where the 0848_S0900 (black) curve denotes the first detection at 08:48 UTC and seeding at 09:00 UTC, and the 0900_S915 (orange) curve denotes the first detection at 09:00 UTC and seeding at 09:15 UTC. The 1148_N (blue) 1024_N (green) curves denote the first detections at 11:48 UTC and 10:24 UTC, respectively, without seeding. During the initial 10 min of echo detection, all four storms record comparable values of the six cloud properties. However, within 10–20 min of seeding (indicated by arrows), both seeded storms show a systematic increase in parameter magnitude and lifetime relative to the unseeded storms. This is observed consistently across all six parameters with extended durations ranging from 10–40 min beyond the unseeded storm lifetimes.

3.3.2. Case Study 2: 14 August 2019

Similar to Figure 6, Figure 7 shows the variations in the six radar-derived storm parameters across three different echoes observed on 14 August 2019. The 1154_S1200 (black) curve denotes the first detection at 11:54 UTC and seeding at 12:00 UTC, while the 1112_N (orange) and 1100_N (green) curves denote the first detections at 11:12 UTC and 11:00 UTC, respectively, without seeding. During initial echo detections, all parameters record comparable values. Similar to the previous October 2018 case, the lifetime of all parameters of the seeded storm (black) are extended by ~20 min compared to unseeded storms (orange and green), along with systematic increases in parameter magnitudes within 15–20 min of seeding. However, the area cover parameter shows a less pronounced increase compared to that observed in the seeded storms of the October 2018 case. The echo top height shows an increase of 17% (from 14.75 to 17.25 km) in the seeded storm which indicates strong vertical development, while the horizontal expansion in terms of area cover remained within 20–30 km.

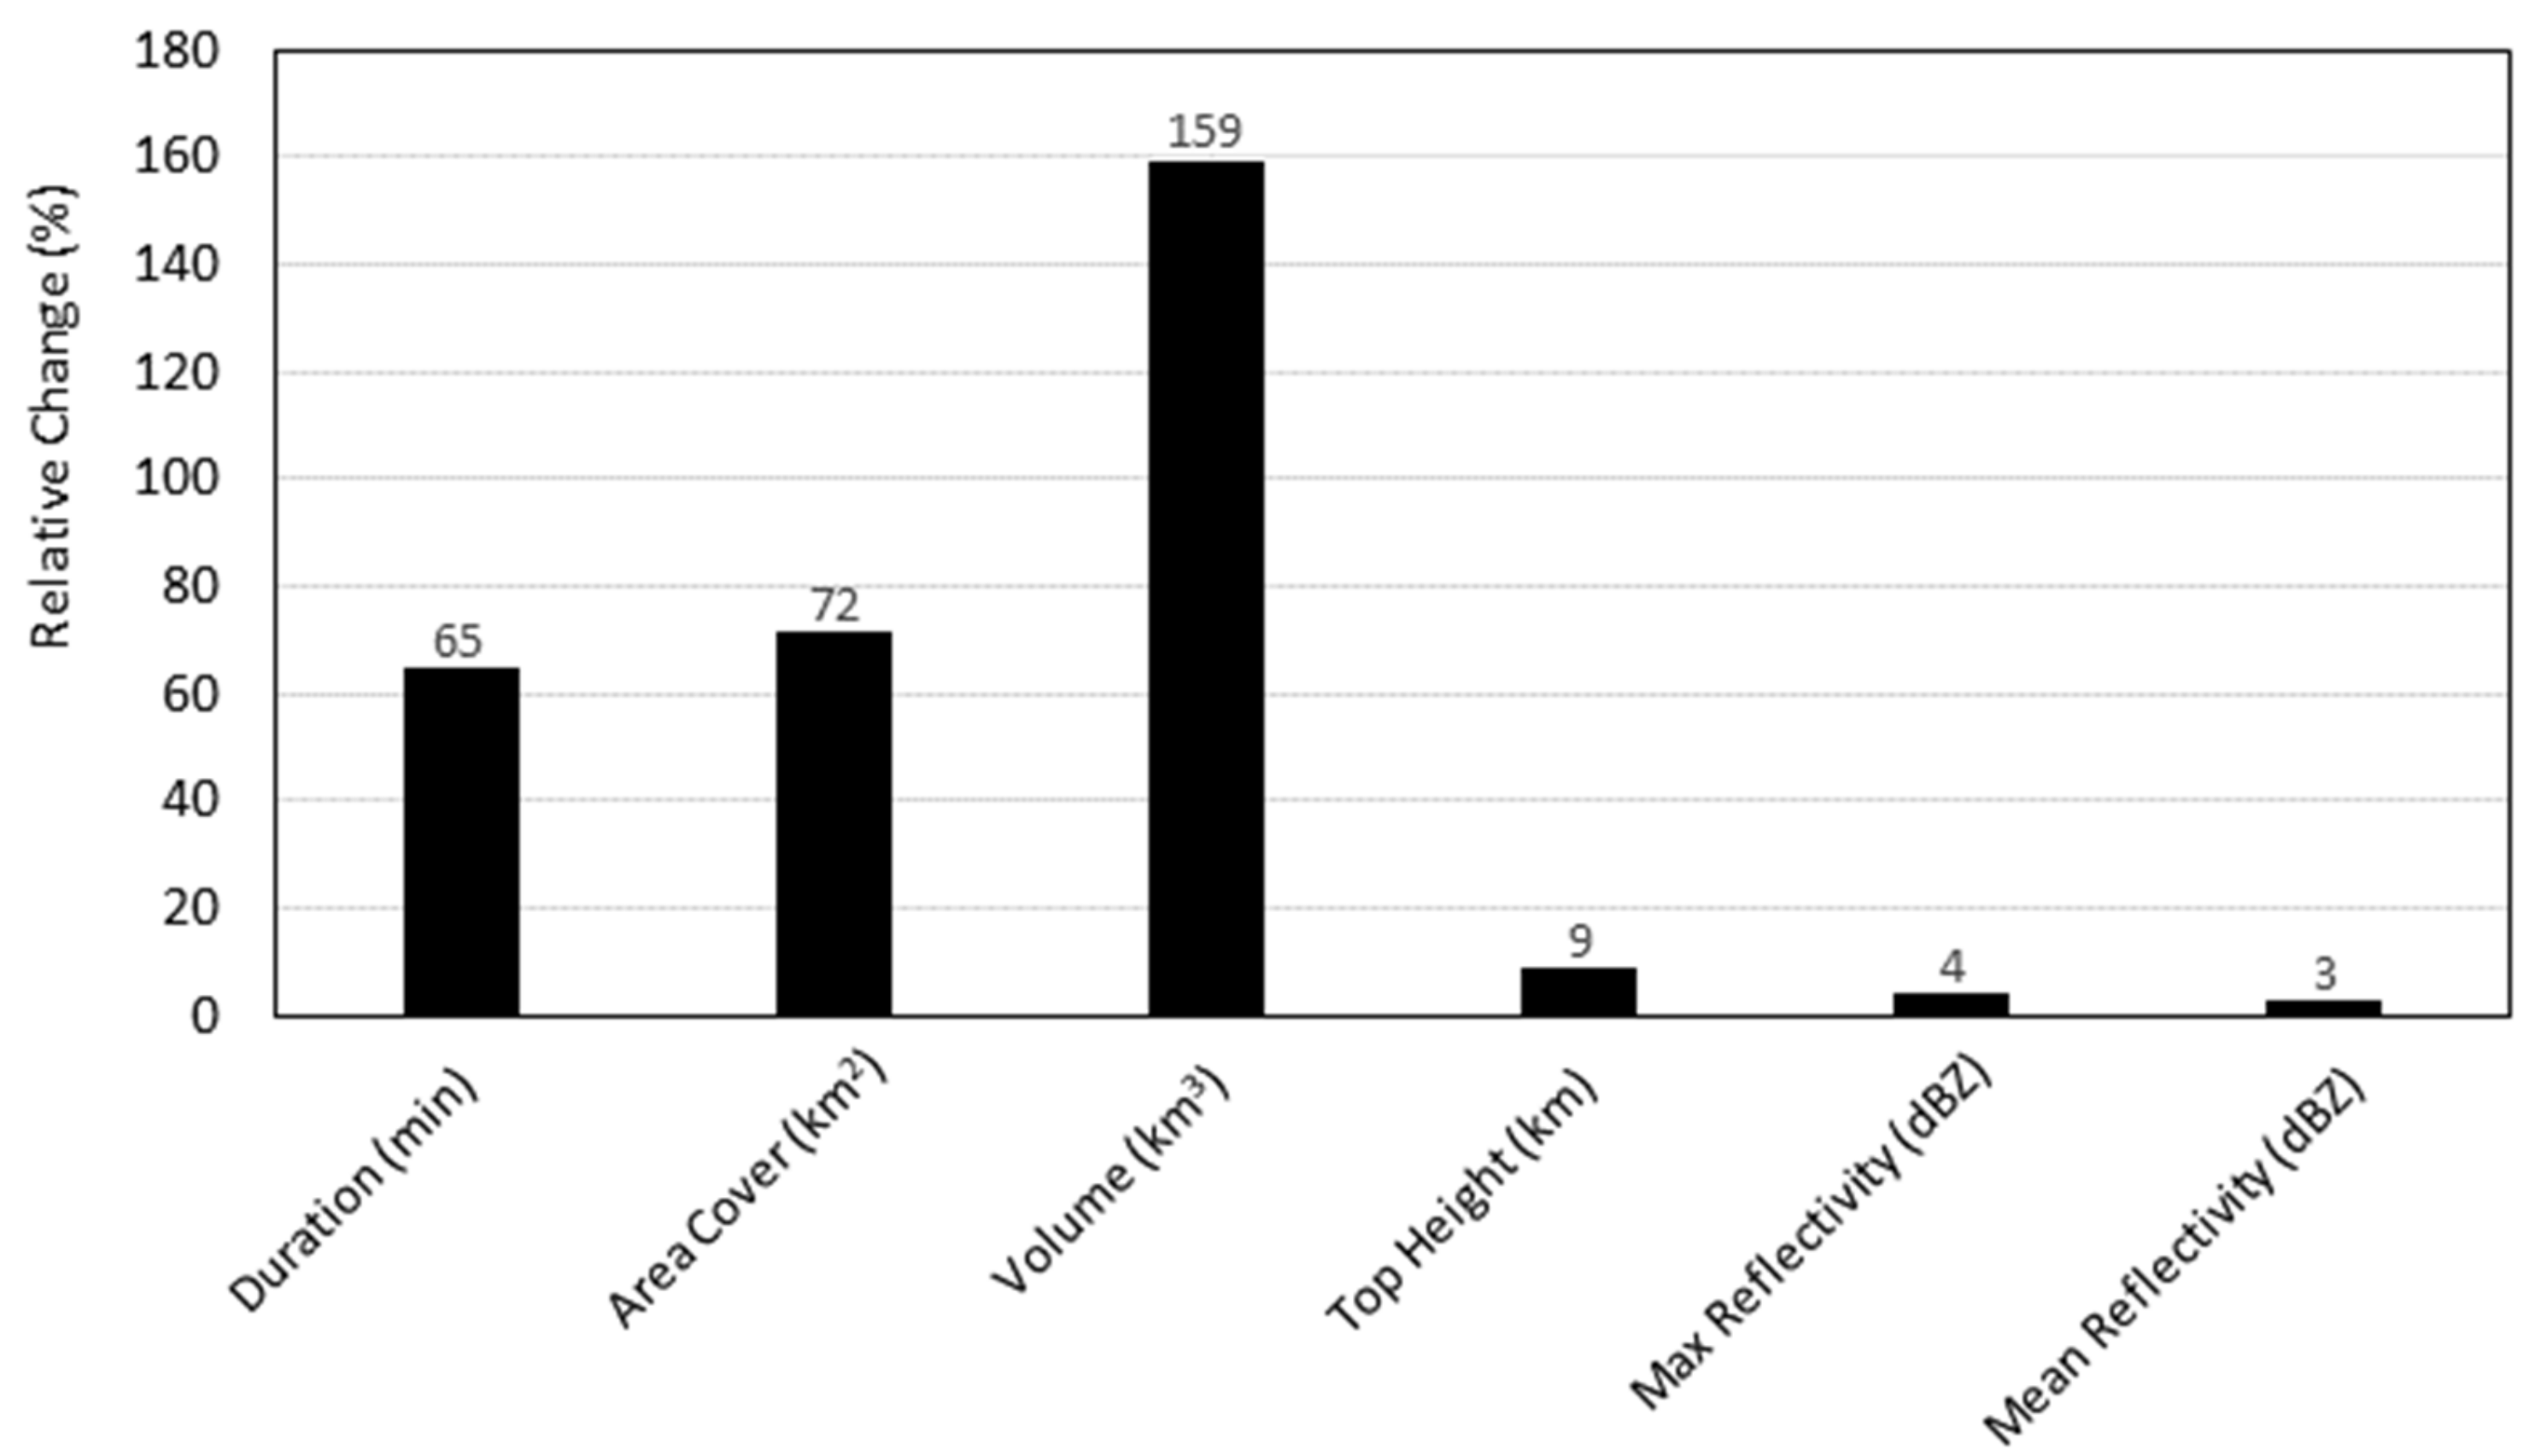
3.3.3. Storm Archive

Extending the analysis of the two radar-based case studies, Figure 8 shows a comparison of radar-derived storm lifetime, area cover, volume, top height, maximum reflectivity, and mean reflectivity between seeded and unseeded storms during the 2018–2019 summer periods. A total of 152 storms were included of which 65 were seeded and 87 remained unseeded. Storms not seeded within the last 15 min of their lifetime (i.e., before dissipating) were considered unseeded. The mean relative changes between the full record of unseeded and seeded storms indicate average increases of 159%, 72%, 65%, 9%, 4%, 3% in echo volume, area cover, duration, top height, maximum reflectivity, and mean reflectivity, respectively.

4. Discussion

The statistical evaluations (regression and change point detection), supported by the physical (radar-based) analysis, provide important insights into the long-term impacts of cloud seeding operations over the UAE. The mean annual increase of 23% rainfall associated with seeding falls within the range of 10–30% reported by other hygroscopic seeding programs around the world [10,13,14,17,19]. Nevertheless, several limitations and potential sources of uncertainty are important to note.
The relative change ratios inferred from the target/control regression are impacted by anomalies associated with climate variability over the study area, primarily in 2012 and 2014 (see Figure 4b). While outliers were excluded when reporting the mean annual change ratio attributed to seeding, random variability may still exist during other years. Furthermore, the target areas are predominantly impacted by localized microscale orographic events that last less than 30 min and rarely reach the coastal control areas (west) before dissipating [62,63]. Hence, the control area naturally experiences a less significant rainfall regime compared to the mountainous target areas [44,50]. While the target/control regression is expected to resolve these differences based on the long-term interdependencies of the historical data, uncertainties attributed to the extreme variability of rainfall in space and time over the study area remain [64].
The change points analysis supported the target/regression analysis by indicating a statistically significant change point in 2011 consistent over both target areas and coincident with the expansion of the seeding operations. Also, the pre- and post-change point trends over the target area show an increase in slope suggesting an overall increase in seasonal rainfall associated with seeding. Alternatively, a non-significant change is detected in 2015 over the control area. Similar to target/control regression uncertainties, change points may be influenced by large-scale variability which is challenging to decouple from local-scale impacts as highlighted by Yousef et al. [56] specifically for cloud cover change detection. The pre-seeding period (Figure 2a) between 1995 to 1998 shows a drastic increase in annual rainfall across all rain gauges (>200 mm), followed by a sharp drop in 1999 and onwards. This pre-seeding variability in the natural rainfall regime is carefully diagnosed in the work of Ouarda, et al. [65]. They linked this anomaly in the rainfall regime to the variability in the equatorial Pacific sea surface temperatures—a teleconnection triggered by shifts of the upper-level stream towards the Equator during the positive El Niño phase [66], ultimately impacting moisture in the region [67]. This climatological anomaly does not appear to recur during the post-seeding period (Figure 2b) with annual rainfall rates generally not exceeding 200 mm. In fact, analyzing post-seeding period trends in the absence of the pre-seeding climatological anomaly triggering the 3-year (1995–1998) increase in rainfall would further favor the role of seeding. Hence, the presence of the anomaly during the pre-seeding period provides further generalization and robustness to the results of the target/control regression.
The radar data analysis corroborates the statistical findings by demonstrating the differences in storm properties between seeded and unseeded storms over the target area. The degree of enhancement in storm properties generally agrees with similar radar-based studies on hygroscopic seeding experiments in Thailand [17] and China [40]. Hygroscopic seeding through the updraft portion of convective clouds is expected to rapidly convert cloud water vapor to droplets (condensation), thereby increasing the echo volume. Hence, natural disparities in vertical (updraft) velocities between unseeded and seeded storms may explain differences in the evolution of their cloud properties over time, which may not be fully attributed to seeding effects. For instance, the 1024_N (non-seeded) 0848_S0900 (seeded) storms record peak vertical velocities of 0.5 and 2.5 m/s, respectively.
Also, mixed-phase clouds frequently occur over the target areas [62]. The latent heat released by the deposition of ice particles increases the buoyancy of growing turrets and the resulting echo top height. Increases in cell top heights have significant non-linear impacts on rain production rates [68]. The growth of seeded cloud top heights may have been underestimated in the analysis, particularly those in close proximity to the Al Ain radar (see Figure 1) and falling within its cone of silence.
Finally, the rapid decreases in precipitation flux and VIL after the peaks in the extended lifetimes of seeded storms (see Figure 6f and Figure 7f) indicate the onset of rainfall through cloud base. In terms of indirect impacts, the enhanced rainfall in conjunction with the increased entrainment of drier environmental air into seeded clouds can trigger strong downdrafts which interact with sub-cloud ambient winds. This interaction can enhance convergence and trigger additional neighboring cloud growth, which may explain the 3-fold increase in area cover in storm 0848_S0900 after seeding (see Figure 6d).

5. Conclusions

This study conducts the first attempt to objectively evaluate seeding impacts from the UAE cloud seeding program. The methodology combines both statistical and physical approaches by utilizing long-term records from rain gauges over unseeded (1981–2002) and seeded (2003–2019) periods, complemented by polarimetric radar data. A posteriori historical target/control regression indicates an average increase of 23% in rainfall associated with seeding along with statistically significant change points detected in 2011 with decreasing/increasing rainfall trends for pre-/post-change point periods, respectively. The radar-based physical analysis inter-compared an archive of storm properties between unseeded (87) and seeded (65) storms. Results show consistent and systematic enhancements in storm properties within 15–25 min of seeding. The largest increases are recorded in storm echo volume (159%), area cover (72%), and lifetime (65%). While limitations and uncertainties require attention and further investigation (see Section 4), the overall results are in line with similar evaluations of operational hygroscopic seeding in other regions [17,40]. The combined statistical-physical evidence presented in this work provides important insights regarding the long-term impacts of cloud seeding operations over the UAE and its contribution to the nation’s water resources.
The UAE Research Program for Rain Enhancement Science (UAEREP) was established in 2015 under the supervision of the NCM to stimulate and promote scientific advancement and the development of new technology in the field [45]. The UAEREP is an international merit review research initiative that provides managed grant assistance to projects targeting innovative research on cloud seeding and the broader field of rainfall enhancement. Several projects supported by the UAEREP report on the need to better quantify the size, concentration, and chemical composition of the natural background aerosol population encountered during seeding operations in order to evaluate seeding impacts in dusty and polluted environments such as the UAE [42,69,70,71]. Further studies using in-situ cloud measurements coupled with microphysical modeling can help evaluate and refine ongoing seeding operations. Internationally driven and targeted research within the framework of UAEREP can advance the role of rainfall enhancement as a robust tool to support water security efforts.

Author Contributions

Conceptualization, A.A.M. (Abdulla Al Mandous) and O.A.Y.; methodology, T.A.H., Y.W., A.S., N.A.S. and H.A.N.; software, T.A.H., Y.W., A.S., N.A.S. and H.A.N.; validation, Y.W.; formal analysis, T.A.H., Y.W., A.S., N.A.S., H.A.N. and S.F.; resources, A.A.M. (Abdulla Al Mandous), O.A.Y. and A.A.M. (Alya Al Mazroui); data curation, T.A.H. and Y.W.; writing—original draft preparation, T.A.H., A.S., N.A.S. and H.A.N.; writing—review and editing, Y.W.; visualization, Y.W.; supervision, A.A.M. (Abdulla Al Mandous), O.A.Y. and A.A.M. (Alya Al Mazroui). All authors have read and agreed to the published version of the manuscript.

Funding

This research received no external funding.

Institutional Review Board Statement

Not applicable.

Informed Consent Statement

Not applicable.

Data Availability Statement

The rain gauge and radar datasets are archived at the UAE National Center of Meteorology. Readers can request the data by contacting [email protected].

Acknowledgments

The authors thank Karel DeWaal for the radar data processing and archiving, the NCM Climate Section for the quality-controlled rain gauge records, and the NCM Cloud Seeding Operations Section for providing the seeding mission logs.

Conflicts of Interest

The authors declare no conflict of interest.

References

  1. Flossmann, A.I.; Manton, M.; Abshaev, A.; Bruintjes, R.; Murakami, M.; Prabhakaran, T.; Yao, Z. Review of advances in precipitation enhancement research. Bull. Am. Meteorol. Soc. 2019, 100, 1465–1480. [Google Scholar] [CrossRef]
  2. Rosenfeld, D.; Axisa, D.; Woodley, W.L.; Lahav, R. A quest for effective hygroscopic cloud seeding. J. Appl. Meteorol. Climatol. 2010, 49, 1548–1562. [Google Scholar] [CrossRef]
  3. Bruintjes, R.T. A review of cloud seeding experiments to enhance precipitation and some new prospects. Bull. Am. Meteorol. Soc. 1999, 80, 805–820. [Google Scholar] [CrossRef] [Green Version]
  4. Cooper, W.A.; Bruintjes, R.T.; Mather, G.K. Calculations pertaining to hygroscopic seeding with flares. J. Appl. Meteorol. 1997, 36, 1449–1469. [Google Scholar] [CrossRef]
  5. Bruintjes, R.T.; Salazar, V.; Semeniuk, T.A.; Buseck, P.; Breed, D.W.; Gunkelman, J. Evaluation of hygroscopic cloud seeding flares. J. Weather Modif. 2012, 44, 69–94. [Google Scholar]
  6. Cotton, W.R. Modification of precipitation from warm clouds—A review. Bull. Am. Meteorol. Soc. 1982, 63, 146–160. [Google Scholar] [CrossRef] [Green Version]
  7. Pinsky, M.; Khain, A.; Shapiro, M. Collision efficiency of drops in a wide range of Reynolds numbers: Effects of pressure on spectrum evolution. J. Atmos. Sci. 2001, 58, 742–764. [Google Scholar] [CrossRef]
  8. Rosenfeld, D.; Gutman, G. Retrieving microphysical properties near the tops of potential rain clouds by multispectral analysis of AVHRR data. Atmos. Res. 1994, 34, 259–283. [Google Scholar] [CrossRef]
  9. Brenguier, J.-L.; Chaumat, L. Droplet spectra broadening in cumulus clouds. Part I: Broadening in adiabatic cores. J. Atmos. Sci. 2001, 58, 628–641. [Google Scholar] [CrossRef]
  10. Morrison, A.E.; Siems, S.T.; Manton, M.J.; Nazarov, A. On the analysis of a cloud seeding dataset over Tasmania. J. Appl. Meteorol. Climatol. 2009, 48, 1267–1280. [Google Scholar] [CrossRef]
  11. Wu, X.; Niu, S.; Jin, D.; Sun, H. Influence of natural rainfall variability on the evaluation of artificial precipitation enhancement. Sci. China Earth Sci. 2015, 58, 906–914. [Google Scholar] [CrossRef]
  12. Murty, B.V.R.; Biswas, K.R. Weather modification in India. J. Meteorol. Soc. Japan. Ser. II 1968, 46, 160–165. [Google Scholar] [CrossRef] [Green Version]
  13. Gagin, A.; Neumann, J. The second Israeli randomized cloud seeding experiment: Evaluation of the results. J. Appl. Meteorol. Climatol. 1981, 20, 1301–1311. [Google Scholar] [CrossRef] [Green Version]
  14. Mather, G.; Terblanche, D.; Steffens, F.; Fletcher, L. Results of the South African cloud-seeding experiments using hygroscopic flares. J. Appl. Meteorol. 1997, 36, 1433–1447. [Google Scholar] [CrossRef]
  15. Bigg, E. An independent evaluation of a South African hygroscopic cloud seeding experiment, 1991–1995. Atmos. Res. 1997, 43, 111–127. [Google Scholar] [CrossRef]
  16. Silverman, B.A. An independent statistical reevaluation of the South African hygroscopic flare seeding experiment. J. Appl. Meteorol. 2000, 39, 1373–1378. [Google Scholar] [CrossRef]
  17. Silverman, B.A.; Sukarnjanaset, W. Results of the Thailand warm-cloud hygroscopic particle seeding experiment. J. Appl. Meteorol. 2000, 39, 1160–1175. [Google Scholar] [CrossRef]
  18. Friedrich, K.; Ikeda, K.; Tessendorf, S.A.; French, J.R.; Rauber, R.M.; Geerts, B.; Xue, L.; Rasmussen, R.M.; Blestrud, D.R.; Kunkel, M.L. Quantifying snowfall from orographic cloud seeding. Proc. Natl. Acad. Sci. USA 2020, 117, 5190–5195. [Google Scholar] [CrossRef] [PubMed]
  19. Jung, E.; Albrecht, B.A.; Jonsson, H.H.; Chen, Y.-C.; Seinfeld, J.H.; Sorooshian, A.; Metcalf, A.R.; Song, S.; Fang, M.; Russell, L.M. Precipitation effects of giant cloud condensation nuclei artificially introduced into stratocumulus clouds. Atmos. Chem. Phys. 2015, 15, 5645–5658. [Google Scholar] [CrossRef] [Green Version]
  20. Ryan, B.F.; King, W.D. A critical review of the Australian experience in cloud seeding. Bull. Am. Meteorol. Soc. 1997, 78, 239–254. [Google Scholar] [CrossRef] [Green Version]
  21. Rangno, A.L.; Robbs, P.V. A new look at the Israeli cloud seeding experiments. J. Appl. Meteorol. Climatol. 1995, 34, 1169–1193. [Google Scholar] [CrossRef] [Green Version]
  22. Goldreich, Y.; Kaner, M. Advertent/Inadvertent effect on ‘rainfall center’displacement in Northern Israel. Atmos. Environ. Part. B Urban. Atmos. 1991, 25, 301–309. [Google Scholar] [CrossRef]
  23. Schickedanz, P.T.; Huff, F.A. The design and evaluation of rainfall modification experiments. J. Appl. Meteorol. Climatol. 1971, 10, 502–514. [Google Scholar] [CrossRef] [Green Version]
  24. Tessendorf, S.A.; Bruintjes, R.T.; Weeks, C.; Wilson, J.W.; Knight, C.A.; Roberts, R.D.; Peter, J.R.; Collis, S.; Buseck, P.R.; Freney, E. The Queensland cloud seeding research program. Bull. Am. Meteorol. Soc. 2012, 93, 75–90. [Google Scholar] [CrossRef]
  25. Gabriel, K.R. Parallels between statistical issues in medical and meteorological experimentation. J. Appl. Meteorol. 2000, 39, 1822–1836. [Google Scholar] [CrossRef]
  26. Griffith, D.; Yorty, D.; Beall, S. Target/control analyses for Santa Barbara county’s operational winter cloud seeding program. J. Weather Modif. 2015, 47, 10. [Google Scholar]
  27. Dennis, A.S. Weather Modification by Cloud Seeding; Academic Press: Cambridge, MA, USA, 1980; Volume 24. [Google Scholar]
  28. Griffith, C.G.; Woodley, W.L.; Grube, P.G.; Martin, D.W.; Stout, J.; Sikdar, D.N. Rain estimation from geosynchronous satellite imagery—Visible and infrared studies. Mon. Weather Rev. 1978, 106, 1153–1171. [Google Scholar] [CrossRef] [Green Version]
  29. Griffith, C.G.; Woodley, W.; Augustine, J.A. The Estimation of Convective, Summertime Rainfall in the United States High Planes from Thermal Infrared, Geostationary Satellite Imagery; National Oceanic & Atmospheric Administration: Washington, DC, USA, 1980.
  30. Gabriel, K.R.; Petrondas, D. On using historical comparisons in evaluating cloud seeding operations. J. Appl. Meteorol. Climatol. 1983, 22, 626–631. [Google Scholar] [CrossRef] [Green Version]
  31. Woodley, W.L.; Solak, M.E. Results of operational seeding over the watershed of San Angelo, Texas. J. Weather Modif. 1990, 22, 30–42. [Google Scholar]
  32. Fluek, J. Evaluation of operational weather modification projects. J. Weather Modif. 1976, 8, 42–56. [Google Scholar]
  33. Solak, M.E.; Yorty, D.P.; Griffith, D.A. Estimations of downwind cloud seeding effects in Utah. J. Weather Modif. 2003, 35, 52–58. [Google Scholar]
  34. Nirel, R.; Rosenfeld, D. Estimation of the effect of operational seeding on rain amounts in Israel. J. Appl. Meteorol. Climatol. 1995, 34, 2220–2229. [Google Scholar] [CrossRef] [Green Version]
  35. Meischner, P. Weather Radar: Principles and Advanced Applications; Springer Science & Business Media: Berlin, Germany, 2005. [Google Scholar]
  36. Goudenhoofdt, E.; Delobbe, L. Statistical characteristics of convective storms in Belgium derived from volumetric weather radar observations. J. Appl. Meteorol. Climatol. 2013, 52, 918–934. [Google Scholar] [CrossRef]
  37. Reinking, R.F.; Martner, B.E. Feeder-cell ingestion of seeding aerosol from cloud base determined by tracking radar chaff. J. Appl. Meteorol. Climatol. 1996, 35, 1402–1415. [Google Scholar] [CrossRef] [Green Version]
  38. Terblanche, D.E.; Mittermaier, M.P.; Burger, R.P.; De Waal, K.J.; Ncipha, X.G. The South African rainfall enhancement programme: 1997–2001. Water SA 2005, 31, 291–298. [Google Scholar] [CrossRef] [Green Version]
  39. Jing, X.; Geerts, B.; Boe, B. The extra-area effect of orographic cloud seeding: Observational evidence of precipitation enhancement downwind of the target mountain. J. Appl. Meteorol. Climatol. 2016, 55, 1409–1424. [Google Scholar] [CrossRef]
  40. Wang, F.; Li, Z.; Jiang, Q.; Wang, G.; Jia, S.; Duan, J.; Zhou, Y. Evaluation of hygroscopic cloud seeding in liquid-water clouds: A feasibility study. Atmos. Chem. Phys. 2019, 19, 14967–14977. [Google Scholar] [CrossRef] [Green Version]
  41. Semeniuk, T.; Bruintjes, R.; Salazar, V.; Breed, D.; Jensen, T.; Buseck, P. Individual aerosol particles in ambient and updraft conditions below convective cloud bases in the Oman mountain region. J. Geophys. Res. Atmos. 2014, 119, 2511–2528. [Google Scholar] [CrossRef]
  42. Wehbe, Y.; Tessendorf, S.A.; Weeks, C.; Bruintjes, R.; Xue, L.; Rasmussen, R.M.; Lawson, P.; Woods, S.; Temimi, M. Analysis of aerosol-cloud interactions and their implications for precipitation formation using aircraft observations over the United Arab Emirates. Atmos. Chem. Phys. Discuss. 2021, 1–28. [Google Scholar] [CrossRef]
  43. Chen, S.; Xue, L.; Yau, M.-K. Impact of hygroscopic CCN and turbulence on cloud droplet growth: A parcel-DNS approach. Atmos. Chem. Phys. Discuss. 2019, 2019, 1–17. [Google Scholar]
  44. Wehbe, Y.; Ghebreyesus, D.; Temimi, M.; Milewski, A.; Al Mandous, A. Assessment of the consistency among global precipitation products over the United Arab Emirates. J. Hydrol. Reg. Stud. 2017, 12, 122–135. [Google Scholar] [CrossRef]
  45. Mazroui, A.A.; Farrah, S. The UAE seeks leading position in global rain enhancement research. J. Weather Modif. 2017, 49, 1. [Google Scholar]
  46. Wehbe, Y.; Temimi, M. A remote sensing-based assessment of water resources in the Arabian Peninsula. Remote Sens. 2021, 13, 247. [Google Scholar] [CrossRef]
  47. Wehbe, Y.; Temimi, M.; Ghebreyesus, D.T.; Milewski, A.; Norouzi, H.; Ibrahim, E. Consistency of precipitation products over the Arabian Peninsula and interactions with soil moisture and water storage. Hydrol. Sci. J. 2018, 63, 408–425. [Google Scholar] [CrossRef]
  48. Reid, J.; Westphal, D.; Reid, E.; Walker, A.; Liu, M.; Miller, S.; Kuciauskas, A. The United Arab Emirates Unified Aerosol Experiment (UAE2); Naval Research Lab Monterey CA Marine, Meteorology Division: Monterey, CA, USA, 2006. [Google Scholar]
  49. Wu, X.; Yan, N.; Yu, H.; Niu, S.; Meng, F.; Liu, W.; Sun, H. Advances in the evaluation of cloud seeding: Statistical evidence for the enhancement of precipitation. Earth Space Sci. 2018, 5, 425–439. [Google Scholar] [CrossRef]
  50. Wehbe, Y.; Temimi, M.; Adler, R.F. Enhancing precipitation estimates through the fusion of weather radar, satellite retrievals, and surface parameters. Remote Sens. 2020, 12, 1342. [Google Scholar] [CrossRef] [Green Version]
  51. Griffith, D.A.; Solak, M.E.; Almy, R.B.; Gibbs, D. The santa barbara cloud seeding project in coastal southern California, summary of results and their implications. J. Weather Modif. 2005, 37, 21–27. [Google Scholar]
  52. Page, E.S. Continuous inspection schemes. Biometrika 1954, 41, 100–115. [Google Scholar] [CrossRef]
  53. Pranuthi, G.; Dubey, S.; Tripathi, S.; Chandniha, S. Trend and change point detection of precipitation in urbanizing Districts of Uttarakhand in India. Indian J. Sci. Technol. 2014, 7, 1573–1582. [Google Scholar] [CrossRef]
  54. Gallagher, C.; Lund, R.; Robbins, M. Changepoint detection in daily precipitation data. Environmetrics 2012, 23, 407–419. [Google Scholar] [CrossRef]
  55. Fischer, T.; Gemmer, M.; Liu, L.; Su, B. Change-points in climate extremes in the Zhujiang River Basin, South China, 1961–2007. Clim. Chang. 2012, 110, 783–799. [Google Scholar] [CrossRef]
  56. Yousef, L.A.; Temimi, M.; Wehbe, Y.; Al Mandous, A. Total cloud cover climatology over the United Arab Emirates. Atmos. Sci. Lett. 2019, 20, e883. [Google Scholar] [CrossRef]
  57. Hamed, K.H.; Rao, A.R. A modified Mann-Kendall trend test for autocorrelated data. J. Hydrol. 1998, 204, 182–196. [Google Scholar] [CrossRef]
  58. Nicoll, K.; Airey, M.; Harrison, R.G.; Marlton, G. Rainfall in the desert: Anatomy of rainfall events in the United Arab Emirates. In Proceedings of the 23rd EGU General Assembly, Held Online, 19–30 April 2021. [Google Scholar]
  59. Dixon, M.; Wiener, G. TITAN: Thunderstorm identification, tracking, analysis, and nowcasting—A radar-based methodology. J. Atmos. Ocean. Technol. 1993, 10, 785–797. [Google Scholar] [CrossRef]
  60. Han, L.; Fu, S.; Zhao, L.; Zheng, Y.; Wang, H.; Lin, Y. 3D convective storm identification, tracking, and forecasting—An enhanced TITAN algorithm. J. Atmos. Ocean. Technol. 2009, 26, 719–732. [Google Scholar] [CrossRef]
  61. Branch, O.; Behrendt, A.; Gong, Z.; Schwitalla, T.; Wulfmeyer, V. Convection initiation over the Eastern Arabian Peninsula. Meteorol. Z. 2020, 29, 67–77. [Google Scholar] [CrossRef]
  62. Kumar, K.N.; Suzuki, K. Assessment of seasonal cloud properties in the United Arab Emirates and adjoining regions from geostationary satellite data. Remote Sens. Environ. 2019, 228, 90–104. [Google Scholar] [CrossRef]
  63. Breed, D.; Bruintjes, R.; Salazar, V.; Jensen, T. NCAR Feasibility Studies for Weather Modification Programs Over the Past 10 Years; Technical Report; Research Applications Laboratory: Boulder, CO, USA, 2007. [Google Scholar]
  64. Wehbe, Y.; Temimi, M.; Weston, M.; Chaouch, N.; Branch, O.; Schwitalla, T.; Wulfmeyer, V.; Zhan, X.; Liu, J.; Al Mandous, A. Analysis of an extreme weather event in a hyper-arid region using WRF-Hydro coupling, station, and satellite data. Nat. Hazards Earth Syst. Sci. 2019, 19, 1129–1149. [Google Scholar] [CrossRef] [Green Version]
  65. Ouarda, T.B.; Charron, C.; Kumar, K.N.; Marpu, P.R.; Ghedira, H.; Molini, A.; Khayal, I. Evolution of the rainfall regime in the United Arab Emirates. J. Hydrol. 2014, 514, 258–270. [Google Scholar] [CrossRef] [Green Version]
  66. Athar, H. Teleconnections and variability in observed rainfall over Saudi Arabia during 1978–2010. Atmos. Sci. Lett. 2015, 16, 373–379. [Google Scholar] [CrossRef]
  67. Niranjan Kumar, K.; Ouarda, T. Precipitation variability over UAE and global SST teleconnections. J. Geophys. Res. Atmos. 2014, 119, 10313–10322. [Google Scholar] [CrossRef]
  68. Gagin, A.; Rosenfeld, D.; Lopez, R. The relationship between height and precipitation characteristics of summertime convective cells in South Florida. J. Atmos. Sci. 1985, 42, 84–94. [Google Scholar] [CrossRef] [Green Version]
  69. Filioglou, M.; Giannakaki, E.; Backman, J.; Kesti, J.; Hirsikko, A.; Engelmann, R.; O’Connor, E.; Leskinen, J.T.; Shang, X.; Korhonen, H. Optical and geometrical aerosol particle properties over the United Arab Emirates. Atmos. Chem. Phys. 2020, 20, 8909–8922. [Google Scholar] [CrossRef]
  70. Orikasa, N.; Murakami, M.; Tajiri, T.; Zaizen, Y.; Shinoda, T. In Situ Measurements of Cloud and Aerosol Microphysical Properties in Summertime Convective Clouds over Eastern United Arab Emirates. SOLA 2020, 16, 185–191. [Google Scholar] [CrossRef]
  71. Geresdi, I.; Chen, S.; Wehbe, Y.; Bruintjes, R.; Lee, J.; Tessendorf, S.; Weeks, C.; Sarkadi, N.; Rasmussen, R.M.; Grabowski, W.; et al. Sensitivity of the efficiency of hygroscopic seeding on the size distribution and chemical composition of the seeding material. In Proceedings of the 101st American Meteorological Society Annual Meeting, Held Online, 10–15 January 2021. [Google Scholar]
Figure 1. Location and terrain elevation of the study area in the northeastern UAE and the distribution of target/control rain gauges and polarimetric weather radars.
Atmosphere 12 01013 g001
Figure 2. Time series and linear trends for selected rain gauges within the control (Ras Al Khaimah and Shrajah) and target (Masafi and Al Malaiha) areas (a) before (1987–2002) and (b) after (2003–2019) the initiation of cloud seeding operations.
Atmosphere 12 01013 g002
Figure 3. (ag) Scatterplots of observed annual rainfall (mm/year) for control vs. target gauges during 1980–2002, with fitted regression lines and R2 values denoted in each panel.
Atmosphere 12 01013 g003
Figure 4. Time series of inter-annual variation in the rainfall relative change ratio for (a) individual target gauges during 2010–2019 and for (b) the overall target area from Equation (11) during 2003–2019.
Atmosphere 12 01013 g004
Figure 5. Time series of CUSUM values derived over the (a) control area, (b) Target Area 1 and (c) Target Area 2 which represent the cumulative sum of differences from the mean at each time step. The corresponding gauge-averaged time series (df) of observed rainfall divided at the detected change points with pre- and post-change point trend lines and slope values are labeled in green and red, respectively.
Atmosphere 12 01013 g005
Figure 6. Temporal evolutions of (a) echo volume (b) echo top height, (c) maximum reflectivity (d) echo area cover (e) precipitation flux and (f) vertically integrated liquid water derived from the radar network for 24 October 2018 storms as a function of time (mins). The 0848_S0900 (black) curve denotes a storm first detected at 08:48 UTC and seeded at 09:00 UTC, and the 0900_S915 (orange) curve denotes a storm first detected at 09:00 UTC and seeded at 09:15 UTC. The 1148_N (blue) 1024_N (green) curves denote storms first detected at 11:48 UTC and 10:24 UTC, respectively, and not seeded. The arrows in panel (a) depict the onset of seeding for each seeded storm with the matching color.
Atmosphere 12 01013 g006
Figure 7. Temporal evolutions of (a) echo volume (b) echo top height, (c) maximum reflectivity (d) echo area cover (e) precipitation flux and (f) vertically integrated liquid water derived from the radar network for 14 August 2019 storms as a function of time (mins). The 1154_S1200 (black) curve denotes a storm first detected at 11:54 UTC and seeded at 12:00 UTC, while the 1112_N (orange) and 1100_N (green) curves denote storms first detected at 11:12 UTC and 11:00 UTC, respectively, and not seeded. The arrow in panel (a) depicts the onset of seeding.
Atmosphere 12 01013 g007
Figure 8. Mean relative change ratios in echo duration, area cover, volume, top height, maximum and mean reflectivity between seeded (65) and unseeded (87) storms recorded during the 2018–2019 summer periods.
Atmosphere 12 01013 g008
Table 1. Location and elevation of control and target area rain gauges.
AreaGauge NameLat (°N) × Lon (°E)Elevation (m)
Control AreaDubai Airport25.25 × 55.3719
Sharjah Airport25.35 × 55.434
Ras Al Khaimah23.58 × 54.751
Umm Al Quwain25.6 × 55.5820
Target Area 1Masafi25.3 × 56.17516
Al Malaiha25.13 × 55.88150
Falaj Al Moalla25.51 × 56.32105
Target Area 2Al Shiweb24.78 × 55.80306
Al Faqa24.72 × 55.62215
Swiehan24.47 × 55.33179
Table 2. Correlation and R2 coefficient values between pairs of control-target gauges, the corresponding regression equations (1980–2002) and the mean relative change (MRC) over the seeding period (2010–2019).
ControlTargetCCR2Regression
(1980–2002)
MRC * (2010–2019)
SharjahMasafi0.940.88(5) y = 1.22x + 17.0730.8%
Umm Al QuwainAl Malaiha0.900.84(6) y = 0.98x + 17.175.6%
Umm Al QuwainFalaj Al Moalla0.900.82(7) y = 1.01x + 18.6415.4%
SharjahFalaj Al Moalla0.950.84(8) y = 1.05x + 16.8713.6%
Ras Al KhaimahMasafi0.900.81(9) y = 1.00x + 28.4530.0%
SharjahAl Malaiha0.950.91(10) y = 1.05x + 09.957.9%
Mean ControlMean Target 10.970.95(11) y = 1.13x + 10.522.8%
* MRC ratio computed as: [Σ(Gauge rainfall−Predicted rainfall)/Σ(Predicted rainfall)]/10.
Publisher’s Note: MDPI stays neutral with regard to jurisdictional claims in published maps and institutional affiliations.

