Abstract
This study investigates the effects of aerosol vertical distribution on a deep convective cloud system. We intend to elucidate the mechanisms for aerosols entering the cloud from different heights, and how they affect cloud microphysics and precipitation. A thermal bubble is released at 1.5 km initially to run an idealized case using the Weather Research and Forecast (WRF) model. The aerosol layer with high concentration was initially put at different altitudes in the model to study the mechanisms and the number of aerosols entering the cloud. It was found that there are three mechanisms for aerosols from different heights to enter the cloud, depending on their relative height with the thermal bubble. Aerosols from lower altitudes (below 1 km) enter the cloud through pumping, while aerosols from higher altitudes (2–3 km, 3–5 km) enter the cloud through entrainment. Both mechanisms lead to low cloud condensation nuclei (CCN) concentration in the cloud. Only aerosols from intermediate altitudes (1–2 km), which is the same as the initial height of the thermal bubble, enter the cloud mainly by ascending with the bubble and lead to high CCN concentration in the cloud. The differences in activated CCN concentration affect the microphysical processes and precipitation remarkably. For the simulations with an initial aerosol layer at 1–2 km and 0–5 km, aerosols can enter the cloud more efficiently than the other four simulations. More activated CCNs in these two simulations lead to more graupels with smaller sizes at higher altitudes, which delays the precipitation but makes the precipitation last longer. However, the accumulated precipitation is similar in all six simulations, no matter what aerosol vertical distribution is like. The results in this study indicate that the altitude of aerosol layers determines the mechanisms for aerosols entering clouds, CCN concentration in the cloud, and to what extent the cloud microphysical processes and precipitation are affected.
1. Introduction
The concentration of aerosol particles has great variability in space and time. The vertical distribution of aerosol particles particularly varies greatly from case to case according to airborne measurement results. For aerosols from local sources, the concentration profile depends mainly on vertical mixing, the height of planetary boundary layer (PBL), and long-range horizontal transport (Zhang et al., 2009 [1]). Generally speaking, aerosols accumulate near the surface and their concentration decreases with altitude (Liu et al., 2009 [2]). Sun et al. (2013 [3]) analyzed 104 vertical profiles of aerosol concentration over Northern China and generally classified them into three types: aerosol concentration exponentially decreasing with altitude, aerosol layers existing near the surface, and aerosol layers existing at the boundary layer height. (Liu et al., 2009 [2]; Zhang et al., 2009 [1]; Chen et al., 2012 [4]). However, long-range transport is able to carry aerosols to much higher altitudes. Bertschi et al. (2004) [5] and Bertschi and Jaffe (2005) [6] observed several well-defined polluted layers of varying thickness (~0.2 to >3 km) at altitudes between 0 and 6 km, which were transported from Asia to North America. Verma et al. (2006) [7] investigated how lofting of air as high as 800 hPa (approximately 2 km above sea level) could lead to entrainment of aerosols into the free troposphere and long-range transport. Liang et al. (2004) [8] indicated that pollutants could be transported from Asia to the Northeast Pacific in the upper, middle, and lower troposphere throughout the year with periods of 10, 15, and 30 days, respectively. Lelieveld et al. (2002) [9] revealed that pollution layers may distribute from the surface to the lower stratosphere of 15 km high as a result of long-range transport.
Because of the vertical distributions, aerosols may enter the clouds from different levels. Aerosols can act as cloud condensation nuclei (CCN) to have aerosol-cloud interaction and impact cloud microphysical and macrophysical properties (Twomey, 1977 [10]; Albrecht, 1989 [11]; Ackerman et al., 2000 [12]; Liu et al., 2003 [13]; Andreae et al., 2004 [14]). For a deep convective cloud, the aerosol–cloud–precipitation interaction is much more complicated than that in warm clouds because of the coexistence of liquid and ice phase particles.
It has been proposed that aerosols serving as CCN can have a thermodynamic invigoration effect (Khain et al., 2005 [15]; Rosenfeld et al., 2008 [16]). In a polluted condition, as warm rain precipitation is suppressed, more liquid water is transported above the freezing level. As the liquid phase is converted to the ice phase, more latent heat is released. Hence the cloud becomes invigorated and precipitation increases. This effect is confirmed by many studies (Fan et al., 2012 [17]; Lebo et al., 2012 [18]), but controversial results also exist. For example, Grabowski (2015) [19] found that the invigoration from extra latent heat is offset by the reduced buoyancy because of the increase of condensate loading, and the precipitation also decreases in their polluted simulations.
Increased CCN aerosols also have microphysical effects on the convective cloud. Cheng et al. (2010) [20] point out that increased aerosols lead to more cloud water but smaller cloud drops, which provide more water for riming but reduce the efficiency for riming. The responses of riming strength and precipitation depend on the relative strength of the two variations. In general, precipitation increases with CCN aerosols when the aerosol concentration is not too high, while precipitation decreases in highly polluted cases. This non-monotonic relationship between the riming strength and CCN aerosol concentration is also found by Li et al. (2017) [21]. For the anvil regions of the deep convective clouds, it is found that increased CCN aerosols can lead to higher cloud top heights and higher anvil ice mixing ratios in a polluted environment (Morrison and Grabowski, 2011 [22]). Increasing aerosols leads to more numerous but smaller droplets, hence more ice particles with smaller sizes and reduced fall velocities. Therefore, the anvil clouds have a higher amount of ice, expand larger and higher, and dissipate more slowly. This effect of aerosols on anvil clouds is also confirmed by Fan et al. (2013) [23] and Grabowski et al. (2016) [24].
Whether the vertical distribution of CCN aerosols has considerable impacts on the mixed-phase microphysics, and precipitation of deep convective systems has been investigated by only a few studies. The main conclusions as to how the vertical distribution of CCN aerosols impacts deep convective systems in previous studies are summarized in Table 1 below.

Table 1.
The relative importance of cloud condensation nuclei (CCN) aerosols from different heights on deep convective systems in previous studies.
The idealized simulation results of Lebo (2014) [25] pointed out that in a squall line, cloud properties are less affected by aerosols from the lower- troposphere (below 3 km) than those from the mid-troposphere (between 3 and 10 km). The lower-tropospheric aerosols only suppress the warm-rain process below the freezing level and can hardly affect the mixed-phase microphysics. Although parts of lower-tropospheric aerosols are wrapped into the updraft cores, they can hardly be diluted in the mixed-phase region and most of them are transported to the cloud anvil. As for the mid-tropospheric aerosols, they lead to more numerous but smaller cloud droplets, and more supercooled liquid in the mixed-phase region, thus enhances the riming process and precipitation.
Marinescu et al. (2017) [26] simulated two mesoscale convective systems and found that the lower-tropospheric aerosols have a greater impact on mixed-phase precipitation than the mid-tropospheric aerosols. The lower-tropospheric aerosols activate more cloud droplets act as CCNs in the warm cloud region, which not only suppress warm-rain precipitation, but can also be transported upwards and enhance the riming process and precipitation in the mixed-phase region. The mid-tropospheric aerosols can be entrained into the mixed-phase region of the cloud, activate cloud droplets, and can only increase mixed-phase precipitation by enhancing the riming process. That is, the lower tropospheric aerosols can affect both the warm cloud and mixed-phase cloud regions, while the mid-tropospheric aerosols can only affect the mixed-phase region.
The formation of cloud anvils also depends on the vertical distribution of aerosols. Fridlind et al. (2004) [27] found that the mid-tropospheric aerosols are more important than lower-tropospheric aerosols for the formation of anvil crystals by comparing large-eddy simulations with aircraft measurement results of a deep convective storm in southern Florida. In their study, the simulation including aerosols only from 0 to 2 km cannot agree with the measurement at all in both number concentrations and size distributions of ice crystal in the anvil. If aerosols from 0 to 6 km are included, the simulation shows closer agreement with the measurement. When aerosols from the whole tropospheric layer are included, the agreement between simulation and measurement is the closest and is not sensitive to aerosol concentrations in the boundary layer.
Generally, the previous studies indicate inconsistent results of the effect of aerosol vertical distribution on convective systems, and the mechanisms for aerosols entering the cloud have hardly been elucidated. In this paper, we investigate the effects of aerosol vertical distribution on the properties of a deep convective cloud using the idealized simulations in the Weather Research and Forecast (WRF) model. The mechanisms for aerosols entering the cloud are elucidated. The extent to which the CCN aerosols from different altitudes affect the cloud and precipitation is studied. Section 2 introduces the model, the deep convection case, and the profiles of aerosol concentration used in this study. In Section 3.1, the transport and distribution of aerosols in the cloud are analyzed, and the numbers of activated CCNs are compared for the 6 simulations. In Section 3.2, the responses of precipitation to aerosol vertical distributions are shown, and we identify three critical microphysical processes in the evolution of the deep convective cloud to explain the differences. Section 4 presents the conclusions and discussions.
2. Model and Case
Numerical studies were conducted with idealized simulations in the WRF model (Skamorock et al., 2008 [28]) version 3.7.1. At the beginning of the idealized simulations, ellipsoid thermal bubbles (potential temperature perturbations) are released at 1.5 km height and the domain center. The horizontal and vertical radii of the thermal bubbles are 10 km and 1.5 km, respectively. The potential temperature in the bubble centers is 3 K higher than the surrounding environment, and progressively approaches the potential temperature of the environment radially.
The initial profiles of temperature and dew point temperature, as seen in Figure 1, are set horizontally homogeneous, and the horizontal wind field was initialized to zero to remove the influence of background horizontal wind on cloud development. The initial profiles are from a sounding in Beijing at 1200 UTC 21 June 2017, when a deep convective system was passing. The deep convective system was triggered at noon (local time), became stronger as it moved to the northeast, passed Beijing in the evening, and dissipated in the early morning of the next day (the satellite cloud pictures are not shown). It brought strong wind, heavy rainfall as well as hails in Beijing (Fu et al., 2019 [29]). As shown in Figure 1, the relative humidity was quite high in the mid-troposphere and an inversion of humidity existed between 850 hPa and 925 hPa, which were favorable to the development of the convective system. The convective available potential energy (CAPE, using virtual temperature) was 760.91 J kg−1, and the convective inhibition (CIN, using virtual temperature) was 86.25 J kg−1.
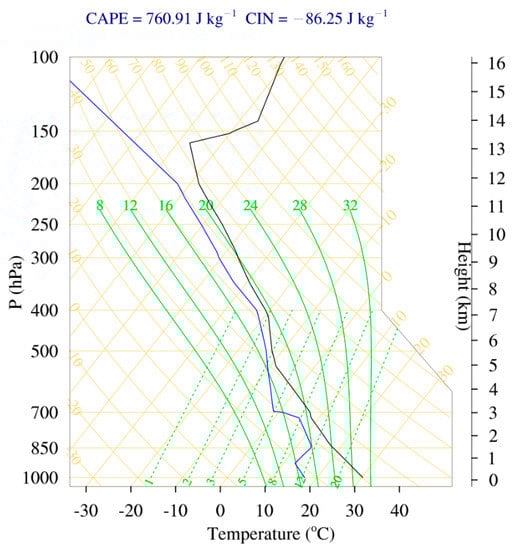
Figure 1.
The skew−T diagram of the initial profiles of temperature (black line) and dew point temperature (blue line) used in this study.
The simulations were performed within a 100 km × 100 km × 24 km domain with a grid spacing of 500 m in horizontal directions, and approximately 200 m in the vertical (120 layers). The underlying surface was set to be flat without surface fluxes. The model boundaries were periodic in both x and y directions. A time step of 3 s is used. The simulations were performed for 90 min and results are output every minute. The effects of Coriolis acceleration were neglected.
Radiation, boundary layer process, surface and land processes are not considered in our idealized simulations. Cumulus parameterization is not used because the spatial resolution is relatively high in our simulations. The microphysical processes are parameterized with the two-moment bulk microphysics National Severe Storm Laboratory (NSSL) scheme (Ziegler,1985 [30]; Mansell, 2010 [31]; Mansell et al., 2010 [32]; Mansell and Ziegler, 2013 [33]).
The NSSL scheme can predict both mass and number mixing ratios of six hydrometeors: cloud droplet, raindrop, cloud ice, snow, graupel, and hail. It can also predict the number mixing ratios of inactivated CCN and activated CCN. Similar to the hydrometeors, the inactivated and activated CCN can advect with air flows and flow into the domain from the lateral boundaries. No surface source of CCN is considered.
For cloud droplets, microphysical processes such as activation, condensational growth/evaporation, auto-conversion to raindrops, melting from cloud ice, and accretion by other hydrometeors are considered. For raindrops, the warm-rain process, melting and shedding from other hydrometeors, accretion by other hydrometeors are considered. For cloud ice, formation from homogeneous and heterogeneous freezing, depositional growth/evaporation, the splintering of graupel, melting to cloud droplets, and accretion by other hydrometeors are considered. For snow, clumping of cloud ice, accretion of other hydrometeors, melting and shedding to rain, and accretion by other hydrometeors are considered. For graupel, freezing of raindrops, depositional growth/evaporation, accretion between hydrometeors, melting and shedding to raindrops as well as splintering to cloud ice.
In the NSSL scheme, the activation of cloud droplets is simulated following Mansell et al. (2010) [32]. Initiated cloud droplet number mixing ratio N is calculated both at cloud base and within the cloud as:
where w is the updraft speed, k is a parameter indicating the activity property of CCN and equals 0.6 in the scheme, B is the complete beta function, and C represents aerosol concentration and equals the number mixing ratio of activated CCN at 1% supersaturation. The concentration of inactivated CCN in each grid is initialized with parameter C, and the initial concentration of activated CCN is set to 0. The above equation is derived from the parameterized relationship (Twomey, 1959) [34]. In the original scheme, the value of parameter C is only proportional to the air density in the grid. In our study, the scheme was revised so that C equals the number concentration of CCN (including both inactivated and activated CCN). The initial profile of parameter C is introduced below.
In this study, six simulations are performed with the only difference in the initial vertical profile of parameter C, as seen in Figure A1 in the Appendix A. The first simulation represents a very clean case (hereinafter referred to as the Clean simulation), whose parameter C is initialized homogenously to 5 × 10⁷ m−3 (at standard sea-level conditions, which refer to the pressure of 101.325 kPa, the temperature of 15 °C and air density of 1.225 kg m−3, and is equivalent to 4.08 × 10⁷ kg−1, the same below) in the whole domain. In the second simulation, parameter C is increased tenfold to 5 × 10⁸ m−3 below 1 km and remains at the background concentration of 5 × 10⁷ m−3 elsewhere to represent a pollution layer from 0 to 1 km (hereinafter referred to the P_01 simulation). Similarly, in the next three simulations, the initial values of parameter C remain 5 × 10⁷ m−3 in the background and are increased 10 times at 1–2 km, 2–3 km, and 3–5 km respectively (abbreviated as the P_12, P_23, and P_35 simulations respectively). The last simulation represents a quite polluted case (hereinafter referred to as the P_05 simulation), in which the initial value of the parameter is 5 × 10⁸ m−3 below 5 km and 5 × 10⁷ m−3 above 5 km. For all the simulations, the initial values of parameter C are horizontally homogeneous in the domain.
The simulated ideal case starts to form the cloud at 7 min. Precipitation starts to develop after 23 min and lasts until 70 min when the cloud dissipates. Therefore 20 min can be considered as the developing stage, 32 min as the mature stage, and after 40 min, the cloud gets into the dissipating stage.
3. Results
3.1. The Mechanisms for Aerosols Entering the Deep Convective Cloud
Figure 2 shows the vertical cross-sections of the concentration of aerosols (including both inactivated and activated CCN) across the domain center (also the center of the cloud) at 20 min, corresponding to the developing stage of the convective cloud. The combination of the wind field and the distribution of aerosols shows the transport of aerosols in the cloud. The outlines of the cloud (red lines) are similar between different simulations because aerosols just entered the cloud for a few minutes, and have not made remarkable impacts on the development of the cloud. However, the distributions of aerosols are quite different in each simulation, which depends on the initial positions of the aerosol layer and the thermal bubble.
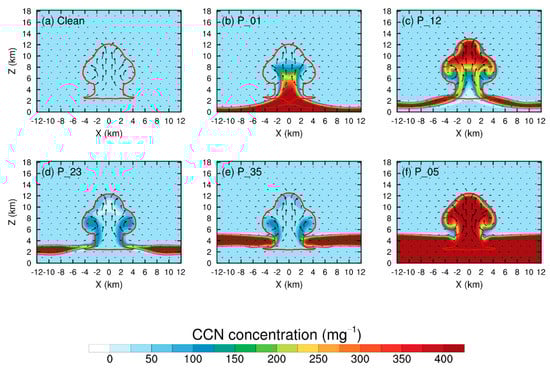
Figure 2.
The vertical cross-sections of the deep convective cloud across the domain center at 20 min in the (a) Clean, (b) P_01, (c) P_12, (d) P_23, (e) P_35 and (f) P_05 simulations respectively. The colored shading represents the concentrations of CCN (including both inactivated and activated CCN). The arrows represent the wind field and the arrow length is proportional to wind speed. The red lines are the contours of 1.0 g kg−1 total mixing ratio of hydrometeors.
In the P_01 simulation, where the aerosol layer is below the thermal bubble initially, as the bubble lifts and convection develops, aerosols are pumped into the cloud by updrafts from the cloud base. As can be seen in Figure 2b, aerosols are mostly in the convective core area and cannot disperse out of the updrafts.
In the P_12 simulation, the bubble is immersed in the aerosol layer initially and thus contains a high concentration of aerosols. P_12 and P_01 simulations have distinct differences in the aerosol distribution. The bubble carries aerosols into the cloud as it ascends to the cloud top. The upper part of the cloud, therefore, has a high concentration of aerosols. In the lower part of the cloud, aerosol concentration is low in the convective core region because the updraft from below cloud base carries clean air into the cloud, which can be considered as the pumping of clean air into the cloud. At cloud edges in the lower part of the cloud, the convergence also entrains a considerable number of aerosols into the cloud. Although the high concentration of aerosols may not all become activated as CCNs because of the limitation of water vapor, the activated CCNs are still several times higher than that in the P_01 simulation (figure not shown).
In the P_23 and P_35 simulations, the aerosol layer lies above the bubble initially, and the bubble does not contain aerosols with high concentrations. When the bubble ascends, it penetrates the aerosol layer above it, and aerosols are entrained into the cloud mainly from cloud edges. Therefore, aerosols are mostly distributed at cloud edges in these two simulations. The convective core is almost absent of aerosols.
As for P_05, the most polluted simulation, aerosols enter the cloud as the bubble carries aerosols up. At the same time, aerosols are also able to enter the cloud by pumping from the cloud base, as well as entrainment from cloud top and edges, because the aerosol layer of P_05 simulation is a combination of the other four polluted simulations.
The vertical cross-sections of aerosol concentration shown in Figure 3 are for 32 min for the six simulations. Precipitation has developed at this moment. In the P_01 simulation (Figure 3b), as the precipitation occurs, downdraft appears near the cloud base and cuts down the upward transport of aerosols. Therefore, the number of aerosols that entered the cloud and subsequently activated as CCNs is limited. Aerosols are mainly distributed at the cloud anvil and higher part of the convective core, as the aerosols entering the cloud through pumping are transported upwards. In the downdraft region around the cloud base, aerosol concentration is low.
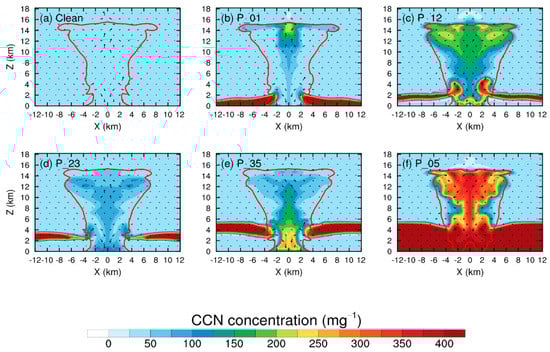
Figure 3.
The same as Figure 2 but at 32 min in the (a) Clean, (b) P_01, (c) P_12, (d) P_23, (e) P_35 and (f) P_05 simulations respectively.
Similarly, the strong effect of the precipitation-induced downdraft on the vertical transport of aerosol is also shown in the P_12 simulation. The middle and upper parts of the convection contain a high concentration of aerosols. At cloud edges in the lower part of the cloud, where the updraft and horizontal convergence exist, a significant number of aerosols still can be transported into the cloud. However, not many aerosols can be seen at the center of the convective cloud, where precipitation-induced downdrafts exist. It is also noted that the convergence near 2 km also makes part of the CCNs at the cloud base deposit to the ground. The concentration of activated CCNs in P_12 is remarkably higher than in the P_01 simulation (figure not shown).
For the P_23 and P_35 simulations, the concentration of aerosol in the cloud is quite low. In the upper part of the cloud, aerosols are distributed near the convective core and dispersed into the lower parts of the anvil. Other regions with a high concentration of aerosol are the downdraft area and the lateral boundaries near the cloud base. The P_35 simulation has more aerosols below the cloud base because the polluted layer extends to the region where horizontal convergence exists.
For the P_05 simulation, the aerosol distribution is quite even inside the cloud. The convective core and the upper part of the cloud abound with aerosols of high concentration. The aerosol concentration is high even in the downdraft region. The concentration of activated CCNs is also much higher than the other simulations (figure not shown).
The vertical profiles and time series of the CCN activation rate are shown in Figure 4. We see that activation mainly happens between 2 km and 3 km, which is the height of the cloud base. When air parcels are lifted to this height and reach supersaturation, CCNs can activate and become cloud droplets. In general, the activation rates in the P_01 and P_23 simulations are about 2–3 times as high as in the Clean simulation. The P_35 simulation has an activation rate very similar to the Clean simulation at the cloud base, but has a higher activation rate between 3 km and 6 km, because the aerosols are initially in the layer of 3–5 km layer. In these simulations, CCNs enter the cloud mainly through pumping or entrainment. In the P_12 simulation, the activation rate is much higher than the other simulations because the bubble is immersed in the aerosol layer initially. The activation rate in the P_05 simulation is even higher, both at the cloud base and in the layer between 3 km and 6 km.
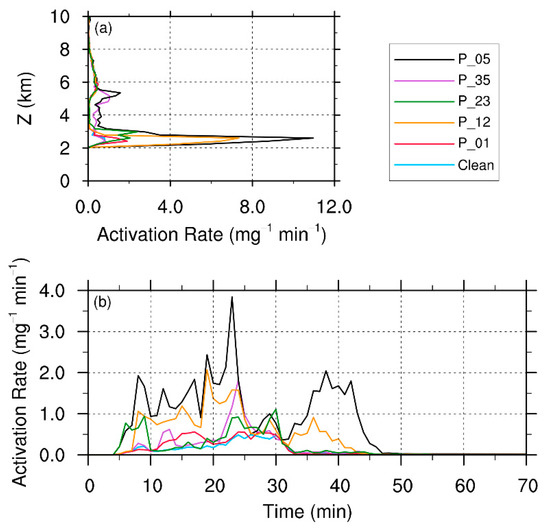
Figure 4.
The (a) vertical profiles and (b) time series of CCN activation rate in all the simulations. The average region is a column with the center at the domain center, 10 km radius, and 24 km height. The vertical distribution is time-averaged from 0 to 70 min.
For all the simulations, the activation rate roughly has a peak from 5 to 30 min (Figure 4b). The activation rates of the P_12 and P_05 simulations maintain high levels in the developing stage of the convection, which is due to the high efficiency of aerosol lifting with the bubble. However, when precipitation forms, the activation rate of CCN becomes weaker. The P_12 and P_05 simulations have a second activation peak after 35 min when the cloud is still in the mature stage. This is because a remarkable number of aerosols are entrained into the cloud and activated by the horizontal convergence and weak updraft near the lateral boundary of the cloud.
3.2. The Response of Precipitation and Microphysical Processes to the Vertical Profile of Aerosol Concentration
We select a circular area with the center at the domain center and a radius of 10 km, which covers the convection and precipitation area for all six simulations. The time series of the area-averaged precipitation rates and accumulated precipitation under different aerosol vertical distributions are shown in Figure 5d,e, and the average area is the circle mentioned above. In the Clean simulation, precipitation begins at 24 min and reaches the largest peak of 0.22 mm min−1 at 31 min. Then the precipitation rate has two smaller peaks: 0.10 mm min−1 at 39 min, and 0.05 mm min−1 at 50 min, but remains a decay tendency in general.
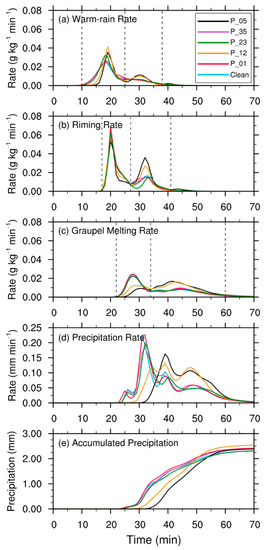
Figure 5.
The time series of column-averaged (a) warm-rain rate, (b) riming rate, and (c) graupel melting rate, and area-averaged (d) precipitation rates, (e) accumulated precipitation of all the simulations. The dashed lines in (a–c) are the dividing lines for the rate peaks of the three microphysical processes. The column-averaged region is the same as the column in Figure 4, and the area-averaged region is the same as the base of the column.
In the P_01, P_23, and P_35 simulations, the variation of precipitation rate with time is similar to the Clean simulation: not only the beginning time but also the peak times are almost simultaneous; the rates at the largest peak and the smaller peaks are also close to each other, indicating that the effect of aerosol on precipitation rate is not significant in these simulations.
In the P_12 and P_05 simulations, the precipitation rate is remarkably lower than the other cases, because of the large number of CCNs activated in the cloud. The beginning time of precipitation is delayed to 28 min in the P_12 simulation and even to 32 min in the P_05 simulation. The peaks of precipitation rate are also weaker and the peak times also have a delay in the two simulations. This indicates the aerosol-induced precipitation suppression effect in these two cases. The average precipitation rates of the two simulations do not change significantly with time: they remain higher than 0.07 mm min−1 for more than 20 min and start to decay at a much later time than the other simulations. As a result, the lower accumulated precipitation in the earlier stage due to precipitation delay is offset by the higher precipitation in the later stage. Finally, the accumulated precipitation amount for the whole convection period is similar in all the six simulations and has a difference of less than 10% (Figure 5e).
To explain the precipitation characteristics in the six simulations, the microphysics are compared here. Figure 6 shows the number and mass mixing ratios of the 5 hydrometeors at 20 min. The number mixing ratio of cloud droplets progressively increases from the Clean simulation to P_01, P_23, P_35, P_12, and P_05 simulations, as the activated CCN concentration is increased. The P_12 and P_05 simulations in particular show significantly higher number concentrations of cloud droplets than the other four simulations. This is strong evidence of the Twomey [10] effect. For rain water, the Clean, P_01, P_23, and P_35 simulations are similar in both number and mass mixing ratios. However, the P_12 and P_05 simulations have a higher number mixing ratio, and significantly lower mass mixing ratio. This indicates that the CCN-induced warm rain suppression is only seen in the P_12 and P_05 simulations but not in the other three polluted simulations. The graupel mass mixing ratios of P_12 and P_05 simulations are slightly higher than the other simulations, and are also distributed at higher altitudes. Cloud ice and snow are low in all the six simulations because little has been generated at this moment.
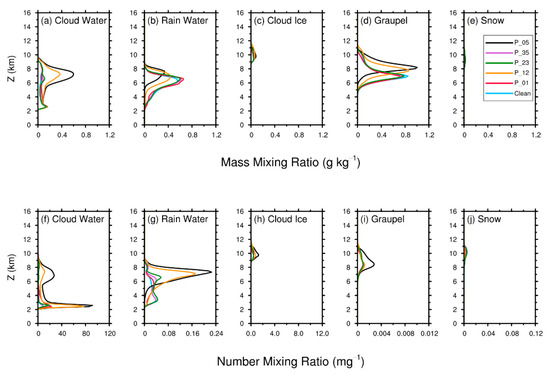
Figure 6.
The horizontally averaged vertical profiles of the mass mixing ratios (upper row) and number mixing ratios (bottom row) of all hydrometeors at 20 min. Hydrometeors including cloud water, rain water, cloud ice, graupel, and snow are shown from left to right respectively. The horizontal average region is a circular area with the center at the domain center and a radius of 10 km (the same as the base of the column region in Figure 4).
Figure 7 shows the vertical profiles of hydrometeors at 32 min. The number and mass mixing ratios of cloud droplets do not show much difference in the six simulations. At this moment, the surface precipitation rate has the largest peak in the Clean, P_01, P_23, and P_35 simulations (as can be seen in Figure 5d), and the rain water mixing ratios of these four simulations reach the maxima at the surface (Figure 7b). Precipitation just begins in the P_12 simulation, and has not started in the P_05 simulation (Figure 5d). Their rain water mixing ratios at the surface are small and zero, respectively (Figure 7b). For graupels, both mass and number mixing ratios are significantly higher in P_12 and P_05 than in the other four simulations. Cloud ice and snow mainly concentrate at the cloud anvil and higher part of the cloud. The amount of these two hydrometeors is still low at this moment, and is comparable with the amount of graupel only in the dissipating stage of the cloud (figure not shown). As these two hydrometers mainly stay at high altitudes and have smaller mass mixing ratios, they are not directly related to surface precipitation.
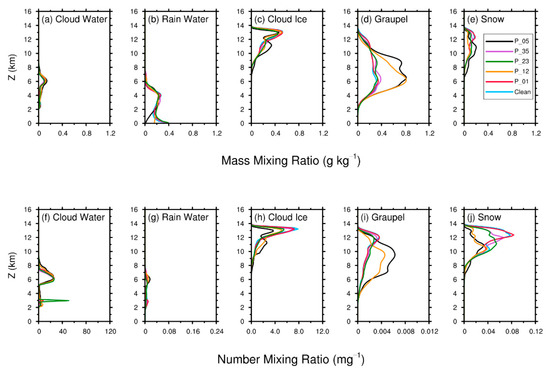
Figure 7.
The same as Figure 6 but at 32 min. Upper row: the vertical profiles of mass mixing ratios of all hydrometeors. Bottom row: the vertical profiles of number mixing ratios of all hydrometeors.
The following discussion mainly focuses on three hydrometers: cloud water, rain water, and graupel. The related microphysical processes that are important to the convective cloud include warm-rain, riming, and graupel melting. Cloud droplets grow to raindrops through condensation and collision-coalescence (i.e., warm-rain process). Simultaneously, cloud droplets and raindrops are transported above the freezing level and then graupels form mainly through the riming process. Falling graupels then melt to become raindrops below the freezing level and form precipitation.
Figure 5a shows the rate of the warm-rain process, which represents the conversion from cloud water to rain water, and includes the auto-conversion of cloud droplets and accretion of cloud droplets by raindrops. In the Clean simulation, after 10 min from the beginning, the warm-rain rate increases rapidly and reaches a peak of 0.025 g kg−1 min−1 at 18 min. In the P_01, P_23, and P_35 simulations, although more activated CCNs lead to more cloud droplets (Figure 6f) compared to the Clean simulation, the warm rain rates are similar in these four simulations. This is consistent with the results shown in Figure 6b,g, that the four simulations have similar rain water amounts. The reason is that droplet size is not significantly changed in the four simulations, and hence the warm rain process is not significantly affected by CCNs. The aerosol-induced warm rain suppression only occurs in the two high-CCN simulations: P_12 and P_05. In these two simulations, with much more CCNs activated, cloud droplets have a much higher number mixing ratio (Figure 6f) and smaller size, although the cloud water mass mixing ratio is much higher (Figure 6a). As a result, warm-rain processes begin later in these two simulations (Figure 5a). However, once the warm rain processes are initiated, the warm-rain rates are remarkably higher in these two simulations, because enough time has been provided for the conversion from cloud droplets to raindrops. Meanwhile, cloud droplets are transported to higher altitudes, as the convective cloud develops.
As cloud droplets and raindrops are transported above freezing level, ice-phase particles including cloud ice, snow and graupel generate and grow. Because the amount of ice and snow is relatively small in the developing and mature stages, we only focus on graupel here. Among the sources of graupel, riming is the dominant process and about one order of magnitude stronger than the other processes (figure not shown). Figure 5b shows the riming rate in the cloud, including the accretion of cloud droplets and raindrops by graupels and snows. In the Clean simulation, riming begins at 17 min and strengthens rapidly, reaches a peak of 0.062 g kg−1 min−1 at 20 min and then turns down immediately. The time of the first peak is simultaneous in all the simulations, but the peak rate is a little lower in P_12 and P_05. This seems strange, since the mass mixing ratios of both graupel and liquid water (including cloud water and rain) are considerably higher than in other simulations (Figure 6a,b,d). The reason is that both graupel particles and raindrops are smaller in the P_12 and P_05 simulations (this can be deduced qualitatively by comparing the mass and number mixing ratios of hydrometeors among different simulations in Figure 6), thus the collection efficiencies between graupel particles and droplets are also lower, which offsets the enhancement of collection by increased mass mixing ratios of the hydrometeors (Cheng et al., 2010 [20]). In addition, vertical distributions of liquid water at higher altitudes in P_12 and P_05 lead to higher vertical distributions of riming rate and hence graupel at higher altitudes (Figure 6d).
When graupels grow larger, they fall and melt to raindrops below the freezing level. For the Clean simulation, the melting process begins at 22 min and reaches the maximum of 0.025 g kg−1 min−1 at 28 min (Figure 5c), which leads to the first peak of precipitation rate at 31 min (Figure 5d). For P_01, P_23, and P_35 simulations, the situations are almost the same. For P_12 and P_05, graupels are smaller and they are distributed at higher altitudes. Therefore, they need more time to fall below the freezing level and thus melting processes begin later and are much weaker at the beginning. In the meantime, warm-rain rates of P_12 and P_05 reach the second peak at 30 min (Figure 5a), thus not only the raindrops melted from graupels but also the raindrops formed by the warm-rain process contribute together to the early stage precipitation in the two simulations (Figure 5d). Moreover, for P_12 and P_05, the riming rates during the first peak period (17–27 min) are only a little weaker than other simulations, while graupel melting processes begin later and are much weaker. Both factors determine that graupel mixing ratios in P_12 and P_05 are much higher in other simulations (Figure 7d).
During the second peak period of riming rate (27–41 min), as graupels fall into mixed-phase levels continuously, riming rates in all the simulations reach a smaller peak. (Figure 5b). With much more graupels falling, the smaller peaks of P_12 and P_05 are much higher than other simulations, which furthermore increase the mixing ratios of graupel. Subsequently, the graupel melting rates of P_12 and P_05 are stronger in the second peak period of melting (34–60 min) and lead to stronger precipitation in the later stage (Figure 5d).
In general, the impact of the vertical distribution of aerosol on the cloud is essentially to affect the concentration of aerosols entering the cloud through different mechanisms at first, then to affect the activated CCN concentration inside the cloud, and subsequently the differences in activated CCN concentration lead to the differences in cloud microphysics and precipitation.
An additional simulation is also performed with the initial value of the parameter C equal to 1.4 × 10⁸ m−3 (at standard sea-level conditions) below 5 km and 5 × 10⁷ m−3 above 5 km, which maintains the vertically integrated aerosol number similar to the other polluted simulations. This simulation refers to P_05C (where “C” represents a cleaner condition than the P_05 simulation).
In P_05C, aerosols can also enter the cloud through the three transport mechanisms mentioned in Section 3.1 (figure not shown), which is the same as P_05. As shown in Figure A2, the CCN activation rate in P_05C is higher at the cloud base, and higher most of the time in time series than the Clean, P_01, P_23, and P_35 simulations, while it is lower than the P_12 and P_05 simulations. The rates of microphysical processes and precipitation in P_05C also show features between the group of Clean, P_01, P_23, P_35 and the group of P_12 and P_05 (Figure A3). These results also agree with the conclusions above.
4. Conclusions and Discussions
A series of idealized simulations in the WRF model with an aerosol layer at different heights are performed to understand the response of a deep convective cloud to the vertical distribution of aerosol. Five polluted conditions with aerosol layers located at 0–1 km, 1–2 km, 2–3 km, 3–5 km, and 0–5 km respectively are simulated, and a simulation with a clean aerosol condition is performed as a reference. In these idealized simulations, a thermal bubble is released at 1.5 km height, and the atmosphere is initialized by a real sounding profile of a convective cloud case from Beijing, China.
This study finds that the mechanisms for aerosols entering the cloud determine the concentration of activated CCN, which is very critical for the following aerosol–cloud interaction. There are three different transport mechanisms, depending on the initial relative height of the aerosol layer and the thermal bubble. For the simulation with an aerosol layer (0–1 km) below the bubble initially, aerosols are pumped into the cloud by updrafts from the cloud base as the bubble lifts. For the simulations with aerosol layers (2–3 km and 3–5 km) above the bubble, the bubble penetrates the aerosol layer when it ascends, and aerosols are entrained into the cloud from cloud edges. These two transport mechanisms are not very efficient and the concentration of activated CCN is limited in the cloud. For the simulations where the bubble is immersed in the aerosol layer (1–2 km and 0–5 km) initially, aerosols enter the cloud mainly by lifting with the bubble. This is the most efficient among the three mechanisms and transports much more aerosols into the cloud, leading to a high concentration of activated CCN in the cloud. Therefore, the impact of the vertical distribution of aerosol on the cloud is essentially to affect the concentration of activated CCN at first, and the differences in activated CCN lead to the difference in the strength of microphysical processes and precipitation. This conclusion is different from previous studies (Lebo 2014 [25]; Marinescu et al. 2017 [26]), who found that aerosols from different heights affect microphysical processes in different regions, and hence have different importance to the deep convective system.
The differences in activated CCN concentration in the six simulations affect the microphysical processes and precipitation remarkably. The six simulations can be divided into two groups.
For the clean simulation (no polluted aerosol layer) and simulations with aerosol layers at 0–1 km, 2–3 km, and 3–5 km, where aerosols are transported into the cloud inefficiently, activated CCNs are limited, droplet number concentration is relatively low, droplet size is relatively large, and the microphysics does not have much difference between the four simulations. Droplets lifted to high altitudes are collected by graupels through the riming process. The graupel particles fall off the freezing level and melt into raindrops. These microphysical processes lead to a peak in the time series of surface precipitation rate, almost at the same time for the four simulations.
For the simulations with aerosol layers at 1–2 km and 0–5 km, where aerosols are transported into the cloud very efficiently, more activated CCNs delay the warm-rain process, and more numerous but smaller droplets are transported to higher altitudes by the updrafts. Meanwhile, graupel particles growing through riming also become more numerous but smaller, and are distributed at higher altitudes. Therefore, graupels fall more slowly, melt later, and delay the surface precipitation. However, the delay of precipitation can stimulate stronger precipitation in the later stage of the convection, because the later melting of graupels and stronger riming lead to a much higher mass mixing ratio of graupels, more melting, and stronger surface precipitation subsequently.
Although the time series of precipitation rate indeed shows differences between the two groups, there is little difference in the accumulated precipitation at the end of the convection.
The mechanisms of how aerosols from different heights enter a deep convective cloud are elucidated in this study, and the impact of aerosol vertical distribution on an idealized deep convective cloud is investigated. In conclusion, to what extent the CCN aerosols affect deep convective systems significantly depends on the relative altitudes of the aerosol layer and the thermal bubble, which determines the mechanisms for aerosols entering the cloud, the concentration of activated CCN, and the subsequent microphysical processes and precipitation.
This study is only based on an idealized case simulation. The idealized cases are designed to isolate the microphysical processes from the very complicated dynamical processes for the mesoscale deep convective systems. The effects of radiation, surface fluxes, wind shear, terrain, and Coriolis acceleration are not considered so that we can focus on the microphysical processes. However, the aerosol effects as mentioned in the Introduction may depend considerably on environmental factors, such as the strength of wind shear (Fan et al., 2009 [35]), relative humidity (Tao et al., 2007 [36]), and convective available potential energy (Lee et al., 2008 [37]). The effects of aerosols serving as ice nuclei (IN) are also neglected in our study. These factors need to be considered in future works.
Author Contributions
Conceptualization, H.X., X.D. and M.Z.; methodology, H.X., M.Z., X.D., R.Z. and Y.R.; software, M.Z. and X.D.; validation, M.Z.; formal analysis, M.Z., H.X., X.D., R.Z. and Y.R.; investigation, M.Z. and H.X.; resources, H.X.; data curation, M.Z., X.D. and H.X.; writing—original draft preparation, M.Z. and H.X.; writing—review and editing, H.X., M.Z., X.D., R.Z. and Y.R.; visualization, M.Z. and X.D.; supervision, H.X.; project administration, H.X.; funding acquisition, H.X. All authors have read and agreed to the published version of the manuscript.
Funding
This research was supported by the Chinese NSF grants 42005059 and 41930968.
Institutional Review Board Statement
Not applicable.
Informed Consent Statement
Not applicable.
Acknowledgments
Discussions with Jost Heitzenberg, Wei-Chyung Wang, Guoxing Chen and Yang Li are greatly appreciated. We also thank the three anonymous reviewers for comments and suggestions that greatly improved the manuscript.
Conflicts of Interest
The authors declare no conflict of interest.
Appendix A

Figure A1.
The initial vertical profiles of the number concentrations of aerosols that serve as cloud condensation nuclei used at model initialization in the (a) Clean, (b) P_01, (c) P_12, (d) P_23, (e) P_35 and (f) P_05 simulations respectively. Note the unit of concentration is changed to ‘mg−1′ for a more intuitive comparison.

Figure A2.
The (a) vertical profiles and (b) time series of CCN activation rate in all the simulations. Similar to Figure 4 but the P_05C simulation is included in.

Figure A3.
The time series of the rates of the three microphysical processes, precipitation rates, and accumulated precipitation of all the simulations. Similar to Figure 5 but the P_05C simulation is included in.
References
- Zhang, Q.; Ma, X.C.; Tie, X.; Huang, M.; Zhao, C. Vertical Distributions of Aerosols under Different Weather Conditions: Analysis of in-Situ Aircraft Measurements in Beijing, China. Atmos. Environ. 2009, 43, 5526–5535. [Google Scholar] [CrossRef]
- Liu, P.; Zhao, C.; Zhang, Q.; Deng, Z.; Huang, M.; Ma, X.; Tie, X. Aircraft Study of Aerosol Vertical Distributions over Beijing and Their Optical Properties. Tellus Ser. B Chem. Phys. Meteorol. 2009, 61, 756–767. [Google Scholar] [CrossRef]
- Sun, X.; Yin, Y.; Sun, Y.; Sun, Y.; Liu, W.; Han, Y. Seasonal and Vertical Variations in Aerosol Distribution over Shijiazhuang, China. Atmos. Environ. 2013, 81, 245–252. [Google Scholar] [CrossRef]
- Chen, P.; Zhang, Q.; Quan, J.; Gao, Y.; Huang, M.; Zhao, D.; Meng, J. Vertical Profiles of Aerosol Concentration in Beijing. Res. Environ. Sci. 2012, 25, 1215–1221. [Google Scholar]
- Bertschi, I.T.; Jaffe, D.A.; Jaeglé, L.; Price, H.U.; Dennison, J.B. PHOBEA/ITCT 2002 Airborne Observations of Transpacific Transport of Ozone, CO, Volatile Organic Compounds, and Aerosols to the Northeast Pacific: Impacts of Asian Anthropogenic and Siberian Boreal Fire Emissions. J. Geophys. Res. Atmos. 2004, 109, 1–16. [Google Scholar] [CrossRef]
- Bertschi, I.T.; Jaffe, D.A. Long-Range Transport of Ozone, Carbon Monoxide, and Aerosols to the NE Pacific Troposphere during the Summer of 2003: Observations of Smoke Plumes from Asian Boreal Fires. J. Geophys. Res. D Atmos. 2005, 110, 1–14. [Google Scholar] [CrossRef]
- Verma, S.; Boucher, O.; Venkataraman, C.; Reddy, M.S.; Müller, D.; Chazette, P.; Crouzille, B. Aerosol Lofting from Sea Breeze during the Indian Ocean Experiment. J. Geophys. Res. Atmos. 2006, 111. [Google Scholar] [CrossRef]
- Liang, Q.; Jaeglé, L.; Jaffe, D.A.; Weiss-Penzias, P.; Heckman, A.; Snow, J.A. Long-Range Transport of Asian Pollution to the Northeast Pacific: Seasonal Variations and Transport Pathways of Carbon Monoxide. J. Geophys. Res. D Atmos. 2004, 109, 1–16. [Google Scholar] [CrossRef]
- Lelieveld, J.; Berresheim, H.; Borrmann, S.; Crutzen, P.J.; Dentener, F.J.; Fischer, H.; Feichter, J.; Flatau, P.J.; Heland, J.; Holzinger, R.; et al. Global Air Pollution Crossroads over the Mediterranean. Science 2002, 298, 794–799. [Google Scholar] [CrossRef]
- Twomey, S. The Influence of Pollution on the Shortwave Albedo of Clouds. J. Atmos. Sci. 1977, 34, 1149–1152. [Google Scholar] [CrossRef]
- Albrecht, B.A. Aerosols, Cloud Microphysics, and Fractional Cloudiness. Science 1989, 245, 1227–1230. [Google Scholar] [CrossRef]
- Ackerman, A.S.; Toon, O.B.; Stevens, D.E.; HeymsÞeld, A.J.; Ramanathan, V.; Welton, E.J. Reduction of Tropical Cloudiness by Soot. Science 2000, 288, 1042–1047. [Google Scholar] [CrossRef]
- Liu, G.; Shao, H.; Coakley, J.A.; Curry, J.A.; Haggerty, J.A.; Tschudi, M.A. Retrieval of Cloud Droplet Size from Visible and Microwave Radiometric Measurements during INDOEX: Implication to Aerosols’ Indirect Radiative Effect. J. Geophys. Res. Atmos. 2003, 108. [Google Scholar] [CrossRef]
- Andreae, M.O.; Rosenfeld, D.; Artaxo, P.; Costa, A.A.; Frank, G.P.; Longo, K.M.; Silva-Dias, M.A.F. Smoking Rain Clouds over the Amazon. Science 2004, 303, 1337–1342. [Google Scholar] [CrossRef] [PubMed]
- Khain, A.; Rosenfeld, D.; Pokrovsky, A. Aerosol Impact on the Dynamics and Microphysics of Deep Convective Clouds. Q. J. R. Meteorol. Soc. 2005, 131, 2639–2663. [Google Scholar] [CrossRef]
- Rosenfeld, D.; Lohmann, U.; Raga, G.B.; O’dowd, C.D.; Kulmala, M.; Fuzzi, S.; Reissell, A.; Andreae, M.O. Flood or Drought: How Do Aerosols Affect Precipitation? Science 2008, 321, 1309–1313. [Google Scholar] [CrossRef] [PubMed]
- Fan, J.; Rosenfeld, D.; Ding, Y.; Leung, L.R.; Li, Z. Potential aerosol indirect effects on atmospheric circulation and radiative forcing through deep convection. Geophys. Res. Lett. 2012, 39. [Google Scholar] [CrossRef]
- Lebo, Z.J.; Morrison, H.; Seinfeld, J.H. Are simulated aerosol-induced effects on deep convective clouds strongly dependent on saturation adjustment? Atmos. Chem. Phys. 2012, 12, 10059–10114. [Google Scholar] [CrossRef]
- Grabowski, W.W. Untangling Microphysical Impacts on Deep Convection Applying a Novel Modeling Methodology. J. Atmos. Sci. 2015, 72, 2446–2464. [Google Scholar] [CrossRef]
- Cheng, C.T.; Wang, W.C.; Chen, J.P. Simulation of the Effects of Increasing Cloud Condensation Nuclei on Mixed-Phase Clouds and Precipitation of a Front System. Atmos. Res. 2010, 96, 461–476. [Google Scholar] [CrossRef]
- Li, X.; Zhang, Q.; Xue, H. The Role of Initial Cloud Condensation Nuclei Concentration in Hail Using the WRF NSSL 2-Moment Microphysics Scheme. Adv. Atmos. Sci. 2017, 34, 1106–1120. [Google Scholar] [CrossRef]
- Morrison, H.; Grabowski, W.W. Cloud-System Resolving Model Simulations of Aerosol Indirect Effects on Tropical Deep Convection and Its Thermodynamic Environment. Atmos. Chem. Phys. 2011, 11, 10503–10523. [Google Scholar] [CrossRef]
- Fan, J.; Leung, L.R.; Rosenfeld, D.; Chen, Q.; Li, Z.; Zhang, J.; Yan, H. Microphysical Effects Determine Macrophysical Response for Aerosol Impacts on Deep Convective Clouds. Proc. Natl. Acad. Sci. USA 2013, 110. [Google Scholar] [CrossRef]
- Grabowski, W.W.; Morrison, H. Untangling Microphysical Impacts on Deep Convection Applying a Novel Modeling Methodology. Part II: Double-Moment Microphysics. J. Atmos. Sci. 2016, 73, 3749–3770. [Google Scholar] [CrossRef]
- Lebo, Z.J. The Sensitivity of a Numerically Simulated Idealized Squall Line to the Vertical Distribution of Aerosols. J. Atmos. Sci. 2014, 71, 4581–4596. [Google Scholar] [CrossRef]
- Marinescu, P.J.; van den Heever, S.C.; Saleeby, S.M.; Kreidenweis, S.M.; DeMott, P.J. The Microphysical Roles of Lower-Tropospheric versus Midtropospheric Aerosol Particles in Mature-Stage MCS Precipitation. J. Atmos. Sci. 2017, 74, 3657–3678. [Google Scholar] [CrossRef]
- Fridlind, A.M.; Ackerman, A.S.; Jensen, E.J.; Heymsfield, A.J.; Poellot, M.R.; Stevens, D.E.; Wang, D.; Miloshevich, L.M.; Baumgardner, D.; Lawson, R.P.; et al. Evidence for the Predominance of Mid-Tropospheric Aerosols as Subtropical Anvil Cloud Nuclei. Science 2004, 304, 718–722. [Google Scholar] [CrossRef][Green Version]
- Skamarock, W.C.; Klemp, J.B.; Dudhia, J.; Gill, D.O.; Barker, D.; Duda, M.G.; Huang, X.; Wang, W.; Powers, J.G. A Description of the Advanced Research WRF Version 3. Univ. Corp. Atmos. Res. 2008. NCAR/TN-475+STR. [Google Scholar] [CrossRef]
- Fu, J.; Chen, S.; Shen, X.; Zhang, X.; Quan, W. Comparative Study of the Cause of Rainfall and Its Forecast Biases of TWO Cold Vortex Rainfall Events in North China. Meteorol. Mon. 2019, 045, 606–620. [Google Scholar]
- Ziegler, C.L. Retrieval of Thermal and Microphysical Variables in Observed Convective Storms. Part 1: Model Development and Preliminary Testing. J. Atmos. Sci. 1985, 42, 1487–1509. [Google Scholar] [CrossRef]
- Mansell, E.R. On Sedimentation and Advection in Multimoment Bulk Microphysics. J. Atmos. Sci. 2010, 67, 3084–3094. [Google Scholar] [CrossRef]
- Mansell, E.R.; Ziegler, C.L.; Bruning, E.C. Simulated Electrification of a Small Thunderstorm with Two-Moment Bulk Microphysics. J. Atmos. Sci. 2010, 67, 171–194. [Google Scholar] [CrossRef]
- Mansell, E.R.; Ziegler, C.L. Aerosol Effects on Simulated Storm Electrification and Precipitation in a Two-Moment Bulk Microphysics Model. J. Atmos. Sci. 2013, 70, 2032–2050. [Google Scholar] [CrossRef]
- Twomey, S. The nuclei of natural cloud formation part II: The Supersaturation in Natural Clouds and the Variation of Cloud Droplet Concentration. Geofis. Pura E Appl. 1959, 43, 243–249. [Google Scholar] [CrossRef]
- Fan, J.; Yuan, T.; Comstock, J.M.; Ghan, S.; Ovchinnikov, M. Dominant role by vertical wind shear in regulating aerosol effects on deep convective clouds. J. Geophys. Res. Atmos. 2009, 114. [Google Scholar] [CrossRef]
- Tao, W.-K.; Li, X.; Khain, A.; Matsui, T.; Lang, S.; Simpson, J. Role of atmospheric aerosol concentration on deep convective precipitation: Cloud—Resolving model simulations. J. Geophys. Res. Atmos. 2007, 112. [Google Scholar] [CrossRef]
- Lee, S.S.; Donner, L.J.; Phillips, V.T.J.; Ming, Y. The dependence of aerosol effect on clouds and precipitation on cloud-system organization, shear and stability. J. Geophys. Res. Atmos. 2008, 113. [Google Scholar] [CrossRef]
Publisher’s Note: MDPI stays neutral with regard to jurisdictional claims in published maps and institutional affiliations. |
© 2021 by the authors. Licensee MDPI, Basel, Switzerland. This article is an open access article distributed under the terms and conditions of the Creative Commons Attribution (CC BY) license (https://creativecommons.org/licenses/by/4.0/).