Article

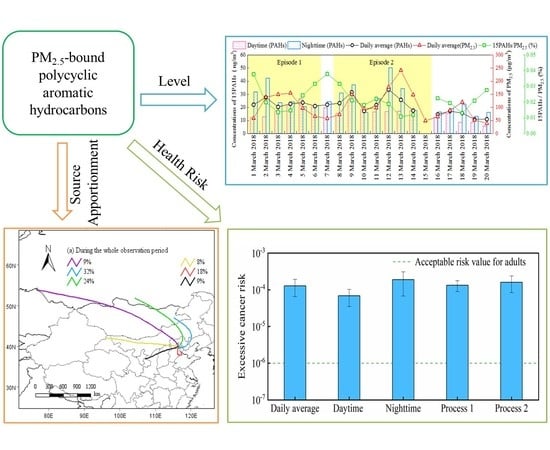
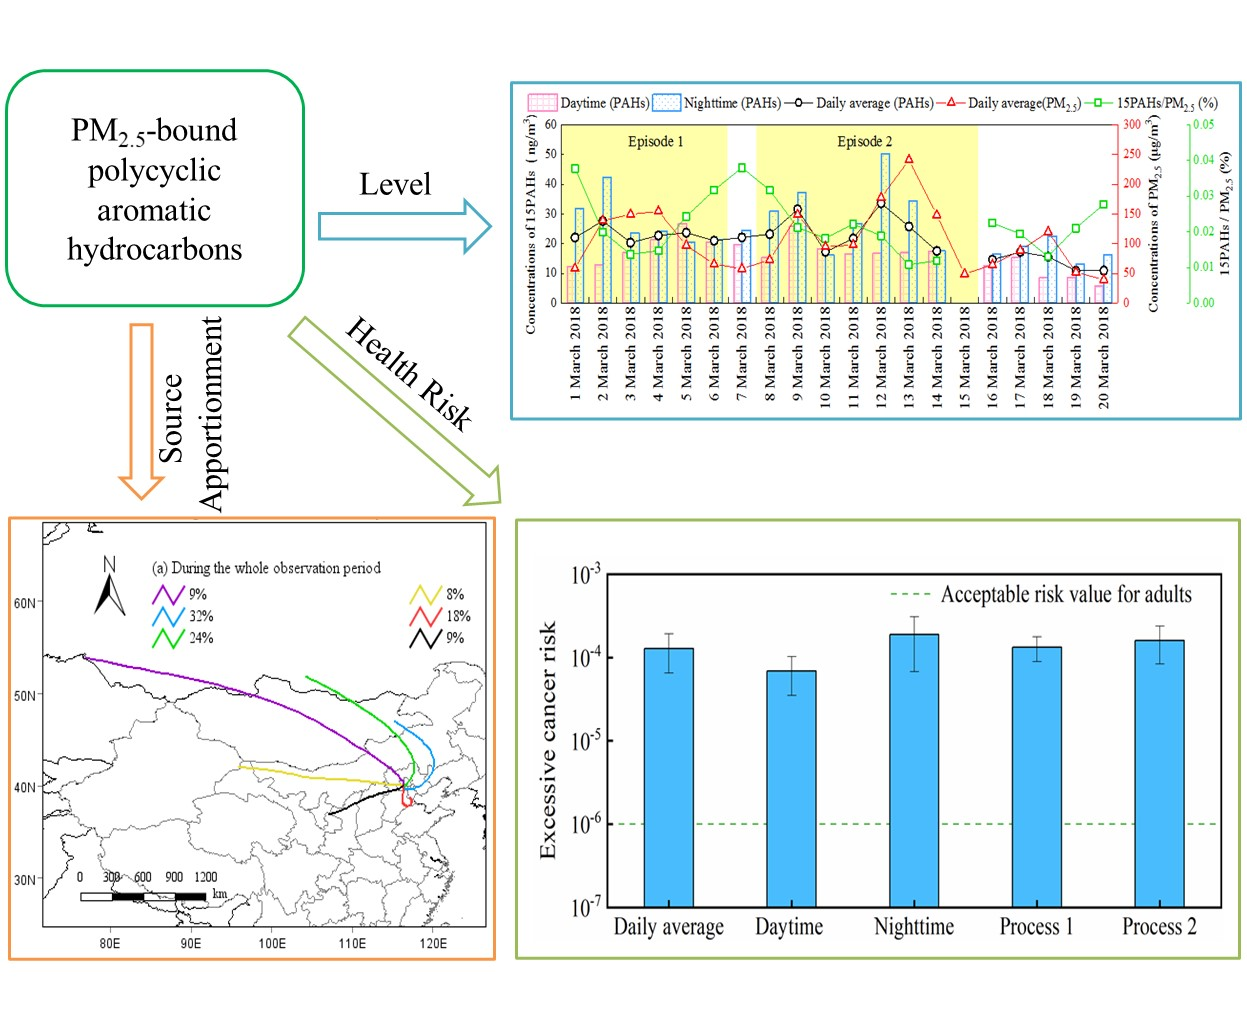
Characteristics and Health Risk Assessment of PM2.5-Bound PAHs during Heavy Air Pollution Episodes in Winter in Urban Area of Beijing, China

1
Department of Urban Construction, Beijing City University, Beijing 100083, China
2
State Key Laboratory of Environmental Criteria and Risk Assessment, Chinese Research Academy of Environmental Sciences, Beijing 100012, China
3
College of Earth Sciences, Jilin University, Changchun 130061, China
4
Beijing Municipal Research Institute of Environmental Protection, National Engineering Research Center of Urban Environmental Pollution Control, Beijing 100037, China
*
Author to whom correspondence should be addressed.
These authors contributed equally to this work.
Atmosphere 2021, 12(3), 323; https://doi.org/10.3390/atmos12030323
Submission received: 17 December 2020 / Revised: 19 February 2021 / Accepted: 22 February 2021 / Published: 1 March 2021
(This article belongs to the Section Aerosols)

Abstract

:
PM2.5 level has decreased significantly in Beijing in recent years due to the strict air quality control measures taken in Jingjinji Region and the surrounding areas. However, the variation characteristics of the concentrations of PM2.5-bound polycyclic aromatic hydrocarbons (PAHs) in Beijing in recent years are still not so clear. In order to understand the pollution status of PM2.5-bound PAHs in Beijing, fifteen PAHs were measured in a typical urban area of Beijing from 1 March to 20 March 2018. The average mass concentration of the 15 PAHs was 21 ng/m3 and higher in the nighttime than that in the daytime. The proportion of 4-ring PAHs in 15 PAHs was highest (43%), while 6-ring PAHs was lowest (10%). The levels of PAHs were higher during heavy pollution episodes than those in non-heavy pollution episodes, and the proportions of 5- and 6-ring PAHs were increased during a heavy pollution episode. PAHs posed obvious carcinogenic risks to the exposed populations, and the risk was higher during heavy pollution episodes than the average value of the whole monitoring period. The main sources of PAHs were traffic emissions and coal/biomass burning. Air masses from the south-southeast had a great influence on the PM2.5 levels during a heavy pollution episode. It is recommended that not only the PM2.5 levels but also the PAHs levels bounded in PM2.5 should be controlled to protect human health in Beijing.

Graphical Abstract

1. Introduction

Polycyclic aromatic hydrocarbons (PAHs) are a group of organic compounds composed of two or more fused benzene rings and widely found in air, soil, and water [1,2,3]. They also are teratogenic, mutagenic, and persistent organic pollutants which can be bio-enriched and transported over long distances and cause great harm to human health [4,5]. According to the International Agency for Research on Cancer (IARC), some PAHs (like benzo(a)pyrene) are carcinogenic to humans. Both natural sources (like geological dust and forest fire) and anthropogenic sources could release PAHs into the environment. Anthropogenic sources include industrial-related sources, traffic-related sources, and domestic-related sources [2,6]. PAHs in ambient air exist in the gas phase and particulate phase. PAHs with 2–3 aromatic rings are mainly gaseous, and harmful PAHs with 4 or more aromatic rings are mainly particulate (especially PM2.5) [6,7]. PM2.5, with a small particle size, can penetrate into bronchioles and alveoli of the human body and can migrate a long distance in the atmosphere. Therefore, the harm of PM2.5-bound PAHs to human health cannot be ignored. In addition, due to global distillation and grasshopper effects, PAHs can gradually migrate to the polar regions of the earth, thus causing global pollution [6,8]. Therefore, sources and environmental fate of PM2.5-bound PAHs have become a research focus in the field of environmental science [9].
Studies on the pollution characteristics and health risk assessments of PAHs in urban and rural areas have been carried on since the 1980s and 1990s internationally [10,11,12]. The distribution of PAHs in gas and aerosol phases has been analyzed [13,14], and qualitative and quantitative methods for source analysis have also been established [15,16]. In the past twenty years, researchers have conducted studies on the concentrations, composition characteristics, sources, and human health risks of PAHs in PM2.5 in Beijing [1,17,18,19,20,21,22]. The results showed that the concentration of PM2.5-bound PAHs in Beijing was high and had obvious seasonal variation characteristics, which was usually highest in winter, followed by autumn, spring and summer. In addition, the concentration of PM2.5-bound PAHs was significantly higher during the heating period than that in the non-heating period [2,5,17]. The PM2.5-bound PAHs in Beijing were mainly 3–6 ring PAHs. Wang et al. [1] found that PAHs with more than 4 rings accounted for 79% of the PM2.5 in Beijing. Duan et al. [5] found that PAHs with more than 4 rings accounted for 96% of the PM2.5 during the heating period in Beijing. The human health risk of PAHs in PM2.5 in Beijing cannot be ignored. Wang et al. [23] found that the incremental lifetime cancer risk (ILCR) of adults and children exposed to PAHs exceeded the acceptable risk for humans, and the ILCR of adults was higher than that of children. Source apportionment results showed that PM2.5-bound PAHs in Beijing mainly came from vehicle exhaust emissions, coal combustion, and biomass burning such as plant burning, among which, the concentration of PAHs in the heating period was greatly affected by coal combustion [2,18,23].
With the development of society and economy and the acceleration of urbanization, regional heavy air pollution with PM2.5 as the primary pollutant occurred frequently in autumn and winter in the early 2010s, especially in the Beijing–Tianjin–Hebei region and its surrounding areas. In order to improve the ambient air quality, the Air Pollution Prevention and Control Action Plan was issued in 2013 in China, which clearly required Beijing to control its annual mean concentration of PM2.5 at around 60 μg/m3 in 2017. The Beijing–Tianjin–Hebei and Surrounding Area Air Pollution Prevention and Control Work Plan in 2017 [24] identified the Beijing–Tianjin–Hebei air pollution transport channel (“2 + 26” cities). The plan focuses on improving regional ambient air quality and implements joint regional air pollution prevention and control. The Beijing Municipal Environmental Status Bulletin [25] showed that the annual mean concentration of PM2.5 in Beijing in 2018 was 51 μg/m3, 46% higher than the national standard value. The number of days with heavy pollution and severe pollution was 15, with an incidence of 4.1%, which was 43 days less than that of 2013. The target in the Air Pollution Prevention and Control Action Plan was successfully achieved.
With the continuous strengthening of the prevention and control of air pollution in Beijing, the concentration of PM2.5 in Beijing has shown a downward trend [23,26]. However, heavy air pollution episode with PM2.5 as the primary pollutant still occurs in Beijing in autumn and winter. Studies have shown that atmospheric particulates, such as PM2.5, in urban areas of China often contain relatively high concentrations of PAHs [27] when heavy air pollution occurs. In order to understand the pollution status of PAHs in PM2.5 during heavy air pollution episodes when the concentration of PM2.5 is generally decreasing in Beijing, a 20-day continuous monitoring of PM2.5 was carried out in an urban area of Beijing in March 2018. The concentration, composition, and variation characteristics of PM2.5-bound PAHs during the heavy air pollution episodes were analyzed. The human health risk of toxic PAHs was assessed, and the sources of PAHs were identified. Based on the backward trajectory analysis, the impact of long-distance air mass transport on PM2.5 was analyzed. The results can provide a scientific basis for accurately understanding the pollution characteristics of PM2.5-bound PAHs during heavy air pollution episodes in Beijing, correctly evaluating the impact of PM2.5 on human health and developing effective PM2.5 prevention and control measures.

2. Materials and Methods

2.1. Sample Collection

The sampling site was located at the Supersite for Urban Air Comprehensive Observation and Research at the Chinese Research Academy of Environmental Sciences in Chaoyang District of Beijing (40°02′28″ N, 116°24′46″ E) (Figure 1). It is about 15 m above the ground and surrounded by residential areas and commercial–residential areas. There are no obvious local industrial pollution sources. Therefore, it is representative for studying the ambient air pollution status of typical urban areas in Beijing.
PM2.5 samples were collected by a high-volume PM2.5 sampler (TE-6070VFC- PM2.5, Thermo Fisher, USA) with an airflow rate of 1.13 m3/min. The sampling filters were quartz filters (203 mm × 254 mm, Whatman Company, UK). The PM2.5 sampler was installed on the roof of Supersite for Urban Air Comprehensive Observation, and the distance between the sampling port and the platform ground in accordance with the related standards (HJ 618-2011). The samples were collected from 1 March to 20 March 2018. Samples were collected in the daytime and nighttime every day for 10 h (daytime: 9:00–19:00; nighttime: 21:00–07:00 of the next day). A lab blank (i.e., a filter was sealed and stored frozen directly) and a program blank (i.e., a filter was placed in the PM2.5 sampler for 10 min without turning on the instrument) were collected during the sampling period. A total of 40 PM2.5 samples were collected during this monitoring, and there were 20 samples in both daytime and nighttime. Moreover, a total of 2 blank samples were collected. After collection, the PM2.5 samples were wrapped with roasted aluminum foil, sealed with a plastic bag, and frozen at −18 °C until analysis.
During the monitoring period, the monitoring data of conventional pollutants were obtained from the site of Beijing Olympic Sports Center in the National Ambient Air Quality Monitoring Network [28]. The site is located in Chaoyang District of Beijing. Its building configuration and pollutant analysis methods strictly comply with the national technical regulations. Furthermore, the ambient air quality monitoring data can reflect the air quality around the monitoring site. PM10 data are missing on 13 and 14 March 2018. Meteorological data such as temperature (T), relative humidity (RH), and wind speed during the monitoring period were obtained from Beijing Nanyuan Airport Station in the Global Weather Precise Forecast Network [29].

2.2. Sample Pre-Treatment and Analysis

The mass concentration of particulate matters was analyzed by gravimetric analysis (HJ 618-2011). The PM2.5 filters were weighed before and after sampling using an analytical balance (CPA225D, 0.01 mg), and the weights were recorded. The blank and sampling filters were equilibrated in a chamber with constant temperature and humidity for at least 24 h before weighing (T: 25 °C, RH: 50%). The same filters were re-equilibrated in the chamber for 1 h under the same conditions and re-weighed.
Method for PAHs analysis was described in detail in previous studies [30,31]. In brief, the filters were cut and then extracted with dichloromethane/methanol (2:1, v/v) under ultrasonication for three times. The extracts were concentrated with a rotary evaporator (RE-2000A) under vacuum and dried with pure nitrogen. Then, N,O-bis-(trimethylsilyl) trifluoroacetamide (BSTFA) was added into the concentrated extracts for derivatization (temperature: 70 °C, duration: 3 h). After derivatization, n-tridecane was added as internal standards. Then, the derivatives were analyzed by GC-MS (GC, 7890A; MS, 5975C, Agilent Co., USA). DB-5MS fused silica capillary column (Agilent Co., USA) was used in the gas chromatograph. GC heating procedure was as follows: the temperature rose from 50 °C to 120 °C at a rate of 15 °C/min, and then rose to 300 °C at a rate of 5 °C/min and kept at 300 °C for 16 min. For the mass spectrometer, it was selected the electron impact mode at 70 eV and a scanning range of 50–650 Da.
Due to the high volatility of some compounds such as naphthalene (Nap), acenaphthene (Ace), acenaphthylene (Acy), and fluorene (Flu), they were not accurately quantitatively analyzed. In this study, 15 PAHs were analyzed, including phenanthrene (Phe) and anthracene (Ant) with 3 rings; fluoranthene (Flt), pyrene (Pyr), benzo[a]anthracene (BaA) and chrysene (Chr) with 4 rings; benzo[b]fluoranthene (BbF), benzo[k]fluoranthene (BkF), benzo[a] fluoranthene (BaF), benzo[e]pyrene (BeP), benzo[a]pyrene (BaP), perylene (Per), and dibenz[a,h]anthracene (DBA) with 5 rings; and indeno [1,2,3-cd] pyrene (IP) and benzo[ghi]perylene (Bghip) with 6 rings (Figure S1). Except for BaF, BeP, and Per with 5 rings, the other 12 PAHs were contained in the 16 priority control PAHs stipulated by the US EPA. The major ions of PAHs for identification were shown in Table S1.

2.3. Quality Assurance and Quality Control

Samples were collected and analyzed under strict quality control. Before sampling, the filters were wrapped with aluminum foil and then burned for 6 h at 450 °C in a muffle furnace (SX3-8-10ASP, China) to remove the organic compounds on the filters. All glass instruments used in sample pretreatment were washed, wrapped with aluminum foil respectively, and then burned for 6 h at 450 °C in the muffle furnace to prevent cross-contamination. The ratios of the limit of detection (LOD) and the detection quantification (LOQ) of the target compounds to the signal-to-noise ratio were 3:1 and 10:1, respectively, and the LOD and LOQ of the target compounds were obtained by calculating the signal-to-noise ratio of the target compounds separately according to previous studies [32,33,34]. In the present work, the LOD and LOQ of PAHs were in the range of 0.003–0.008 and 0.01–0.027 ng/μL (Table S1). Blank samples analysis showed no serious contamination (<5% of real samples). Before each injection, the injection needles were clean with n-hexane to prevent cross-contamination among samples. The Recoveries of all target compounds were between 80% and 120%. The data reported here are all corrected for the blanks.

2.4. Data Processing

The daily mean concentrations of conventional pollutants and Ambient Air Quality Index (AQI) were calculated using the air quality sub-index calculation method in the Ambient Air Quality Index Technical Regulations (Trial) (HJ 633-2012), which issued by the Ministry of Ecology and Environment of China. In this study, the daily mean concentrations of PM2.5 and PAHs were the average of the daytime value and nighttime value of the day. If the daytime and/or nighttime values were missing, the daily mean values were not calculated.

2.4.1. Human Health Risk Assessment

BaP equivalent concentration (BaPeq) is an index of toxicity associated with PAHs exposure. It is calculated as following [35]:
BaP eq = C i × TEF i
where BaPeq is BaP equivalent concentration in the ambient air (ng/m3); Ci is the mass concentration of the ith PAH (ng/m3); TEFi is the toxic equivalent factor of the ith PAH (dimensionless) (Table 1).
Excessive cancer risk (ECR) via inhaling PAHs is calculated as following:
ECR = BaP eq × UR BaP
where ECR is lifetime excessive cancer risk (dimensionless); BaPeq is BaP equivalent concentration in the ambient air and is from Equation (1), (ng/m3); URBaP is unit cancer risk. According to World Health Organization (WHO), lifetime (70 years) exposure to an environment with a BaP mass concentration of 1 ng/m3 results in 8.7 × 10⁻⁵ (ng/m3)−1 of cancer risk through inhalation, for every 1,000,000 people exposed to an environment with a BaP mass concentration of 1 ng/m3, there are 87 cases of cancer caused by chronic BaP inhalation [36,37].

2.4.2. Source Identification of PAHs

In this study, the sources of PAHs in PM2.5 were identified using the characteristic ratio method, principal component analysis (PCA), and backward trajectory analysis.
PAHs emitted from different fuels or under different combustion conditions are different, and the physical properties and gas/solid phase distribution of PAHs are different with different molecular weights. Therefore, the source of PAHs can be preliminarily identified according to the range of specific species ratio [35]. In this study, BaA/(Chr + BaA), Flt/(Pyr + Flt), BaP/BghiP, and IP/(IP + BghiP) were selected to identify the sources of PAHs (Table 2). PCA is a multivariate statistical analysis method for qualitatively analyzing the pollution source types of target pollutants [38]. In this study, the sources of PAHs in PM2.5 were identified using PCA (SPSS Statistics 17, USA). The component matrix was rotated by varimax rotation. Furthermore, the pollution sources represented by the obtained principal component were determined according to the contribution variance of the characteristic PAHs. Generally, Phe and Ant are from biomass burning [39], BaA is a specific pollutant from coal combustion [40], and BghiP, DBA, IP, and Per are specific pollutants from vehicle exhaust emissions [41,42].
The lagrangian backward trajectory model (HYSPLIT–4) was used for traceability analysis. The model is developed by the Air Resources Laboratory of the US National Oceanic and Atmospheric Administration (NOAA) (http://www.arl.noaa, accessed on 17 December 2020). The meteorological data were from the Global Data Assimilation System (GDAS) dataset [45]. In order to understand the impact of air masses from different regions and transmission paths on PAHs concentration at the monitoring site, a 48 h backward trajectory analysis of air masses at 500 m of the monitoring site was performed at different periods based on the relevant meteorological data of latitude and longitude and the simulation period of the monitoring site.

3. Results and Discussions

3.1. Overview of Ambient Air Quality and Meteorological Conditions

The daily mean temperature ranged from 0.5 to 11 °C with an average of 4.7 °C (Figure 2). The daily mean relative humidity ranged from 19% to 75% with an average of 47% (Figure 2). Moreover, the daily mean wind speed ranged from 1.1 to 4.2 m/s with an average of 2.1 m/s (Figure 2 and Figure S2). It was mainly cloudy during the monitoring period, and there was a short snowfall from 8:00 am to 2:00 pm on 17 March. Central heating in Beijing ended on 20 March, and the monitoring ended on the same day.
During the monitoring period, the daily concentrations of the SO2, NO2, CO, O3, PM10, and PM2.5 were 2.6–22 μg/m3 (average: 11 μg/m3), 16–118 μg/m3 (average: 57 μg/m3), 0.34–2.7 mg/m3 (average: 1.1 mg/m3), 31–135 μg/m3 (average: 74 μg/m3), 38–202 μg/m3 (average: 90 μg/m3), and 16–244 μg/m3 (average: 87 μg/m3), respectively (Figure 2). All daily concentrations of SO2, CO, and daily maximum 8 h average of ozone (O3 MDA-8) at the site were lower than the secondary standard 24 h limits set in the National Ambient Air Quality Standards of China (GB3095-2012). The daily concentrations of NO2, PM10, and PM2.5 were above the secondary standard 24 h limits in 2, 3, and 9 days, respectively. The PM2.5 pollution was serious in the study area during the monitoring period. There were two obvious heavy PM2.5 pollution episodes, which were 1–6 March (episode 1) and 8–15 March (episode 2).
During the whole monitoring period, the daily mean mass concentrations of PM2.5 in ambient air in the study area ranged from 40 to 241 μg/m3, with an average of 106 μg/m3 (Figure 3). The daily mean concentrations of PM2.5 were less than the limit (75 μg/m3, 24 h, GB 3095-2012) in only 6 days. The mass concentration of PM2.5 ranged from 25 to 234 μg/m3 with an average of 109 μg/m3 in the daytime, while it ranged from 46 to 248 μg/m3 with an average of 103 μg/m3 in the nighttime (Figure 3). The mass concentrations of PM2.5 in the daytime were obviously higher than those in the nighttime in 8 days and significantly lower than those in the nighttime in 11 days (Figure 3).

3.2. Levels and Compositions of PAHs

During the monitoring period, the daily mean mass concentrations of 15 PM2.5-bound PAHs ranged from 11 to 34 ng/m3, with an average of 21 ng/m3 and accounting for 0.22‰ of the daily mean mass concentrations of PM2.5 (Table 3). Flt was the most abundant species (4.7 ng/m3), followed by Phe (4.6 ng/m3) and BbF (2.4 ng/m3), accounting for 22%, 22%, and 11% of the daily mean mass concentration of 15 PM2.5-bound PAHs, respectively, with a cumulative proportion of 55%.
In the daytime, the levels of 15 PAHs ranged from 5.9 to 27 ng/m3, with an average of 16 ng/m3 (Table 3). The levels of Phe, Flt, and Pyr were higher than others, accounting for 65% of the total 15 PAHs. In the nighttime, the levels of 15 PAHs ranged from 13 to 50 ng/m3, with an average of 26 ng/m3 (Table 3). Flt, Phe, and Pyr were also higher than others, accounting for 48% of the total 15 PAHs. The level of 15 PAHs was lower in the daytime than that in the nighttime, but the proportions of the Phe, Flt, and Pyr, three PAHs with higher individual concentrations, in the total PAHs were higher in the daytime than those in the nighttime.
During episode 1, the levels of 15 PM2.5-bound PAHs ranged from 20 to 28 ng/m3, with an average of 23 ng/m3 (Table 3). Phe was the most abundant species, followed by Flt and Pyr, accounting for 57% of the totals. During episode 2, the levels of 15 PAHs ranged from 17 to 34 ng/m3, with an average of 24 ng/m3 (Table 3). Flt was the most abundant species, followed by Phe and BbF, accounting for 53 of the totals. The average levels of 15 PM2.5-bound PAHs were higher in the two heavy air pollution episodes than that in the whole monitoring period. The three individual PAHs with higher mass concentrations were Phe, Flt, and Pyr in episode 1, while they were Flt, Phe, and BbF in episode 2 (Table 3).
In recent years, the levels of PM2.5-bound PAHs in Beijing during the heating period showed a downward trend. In 1997, 2003, 2005, 2006, 2013, 2014, and 2015, they were 272 ng/m3, 268 ng/m3, 326 ng/m3, 338 ng/m3, 250 ng/m3, 89 ng/m3, and 73 ng/m3, respectively [1,17,18,19,20,21,22]. The average daily mean mass concentration of 15 PM2.5-bound PAHs was 21 ng/m3 in this study, higher than that of developed countries such as Spain (1.1 ng/m3), Greece (7.0 ng/m3), Japan (0.53 ng/m3), and New Zealand (0.31 ng/m3) [46,47,48]. In summary, although the level of PM2.5-bound PAHs in Beijing has a significant downward trend, the pollution status is still serious. In this study, the variation of the total PAHs mass concentrations in PM2.5 was similar to that of the BaP mass concentrations, and their Pearson correlation coefficient R2 was 0.85 (Figure 4). Therefore, BaP can reflect the pollution level of total PM2.5-bound PAHs in the study area.
During the monitoring period, the proportions of daily mean mass concentrations of PAHs with different ring numbers in the study area were: 4-ring PAHs (43%) > 3-ring PAHs (24%) > 5-ring PAHs (23%) > 6-ring PAHs (10%) (Figure 5). There was a significant difference in the composition of PAHs between daytime and nighttime. In the nighttime, the proportion of 5-ring and 6-ring PAHs increased significantly by 8.8% and 3.3% on average, respectively, while the proportion of 3-ring and 4-ring PAHs decreased by 8.0% and 4.1% on average, respectively. During the two heavy air pollution episodes, the proportions of daily mean mass concentrations of PAHs with different ring numbers did not change significantly. When AQI < 50 (1 and 20 March) and AQI > 200 (3, 13, and 14 March), there was a significant difference in the composition of PAHs in PM2.5. When AQI > 200, the proportion of 5-ring and 6-ring PAHs increased significantly by 12% and 4.5%, respectively; the proportion of 3-ring and 4-ring PAHs decreased by 7.8% and 8.2%, respectively.
The average value of daily mean BaP mass concentration in PM2.5 during the monitoring period was 0.82 ng/m3, significantly lower than that during the heating periods of Beijing in 2003 [49], 2008, and 2009 [50], 2015 and 2016 [27], and 2017 [51] (Figure 6), lower than that observed at the monitoring site of Jiangsu Academy of Environmental Sciences in the winter of 2014, higher than that observed at the monitoring site of Jiangsu Environmental Monitoring Center in the winter of 2015 [52], and significantly higher than that observed in Atlanta, USA, in the winter of 2004 [6]. The results show that the BaP mass concentration in PM2.5 in this study is decreasing, but still relatively high.

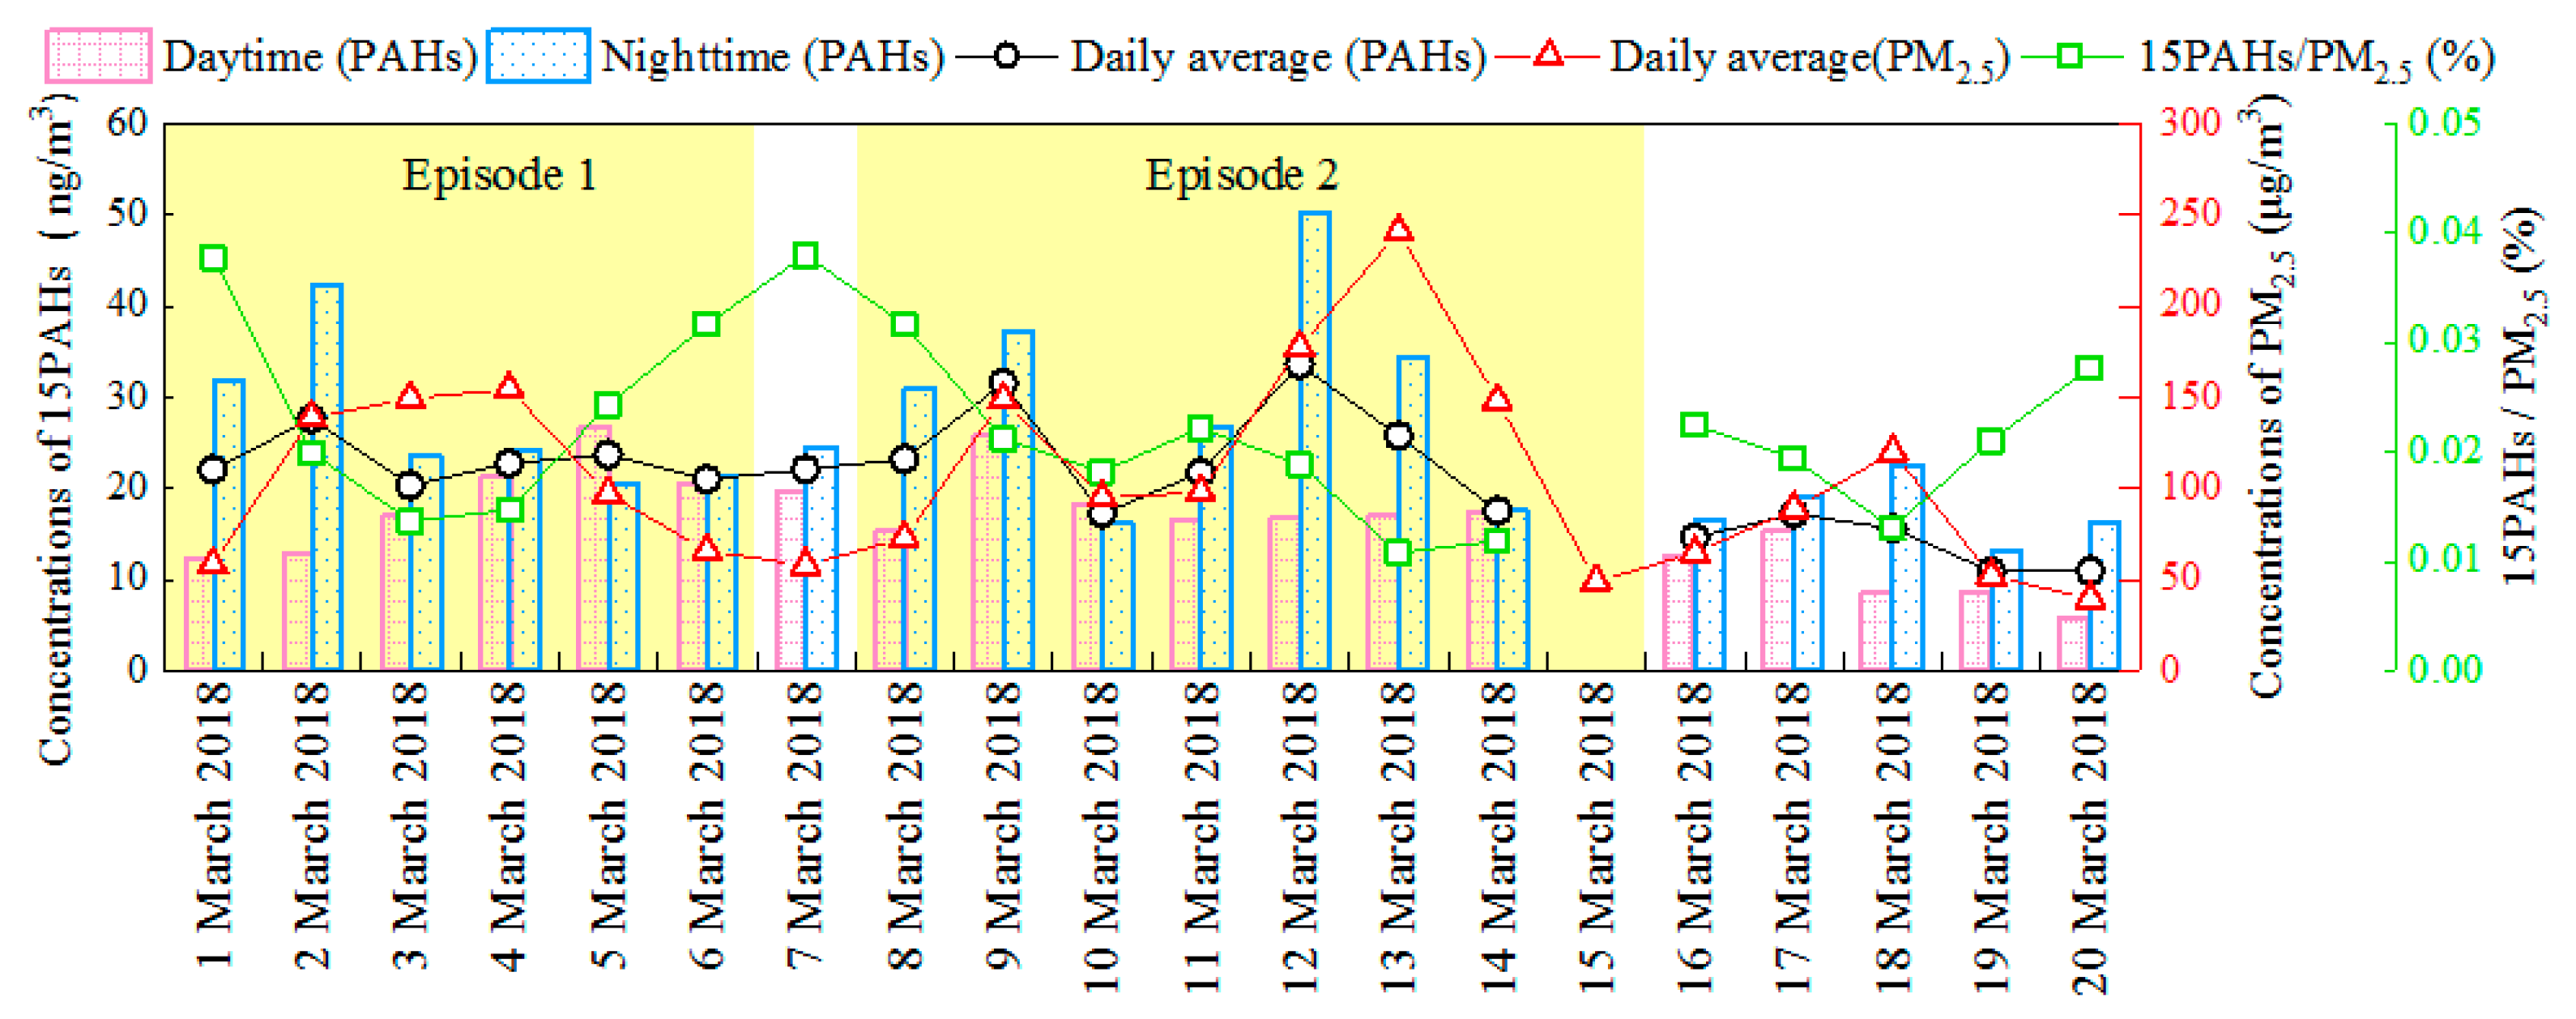
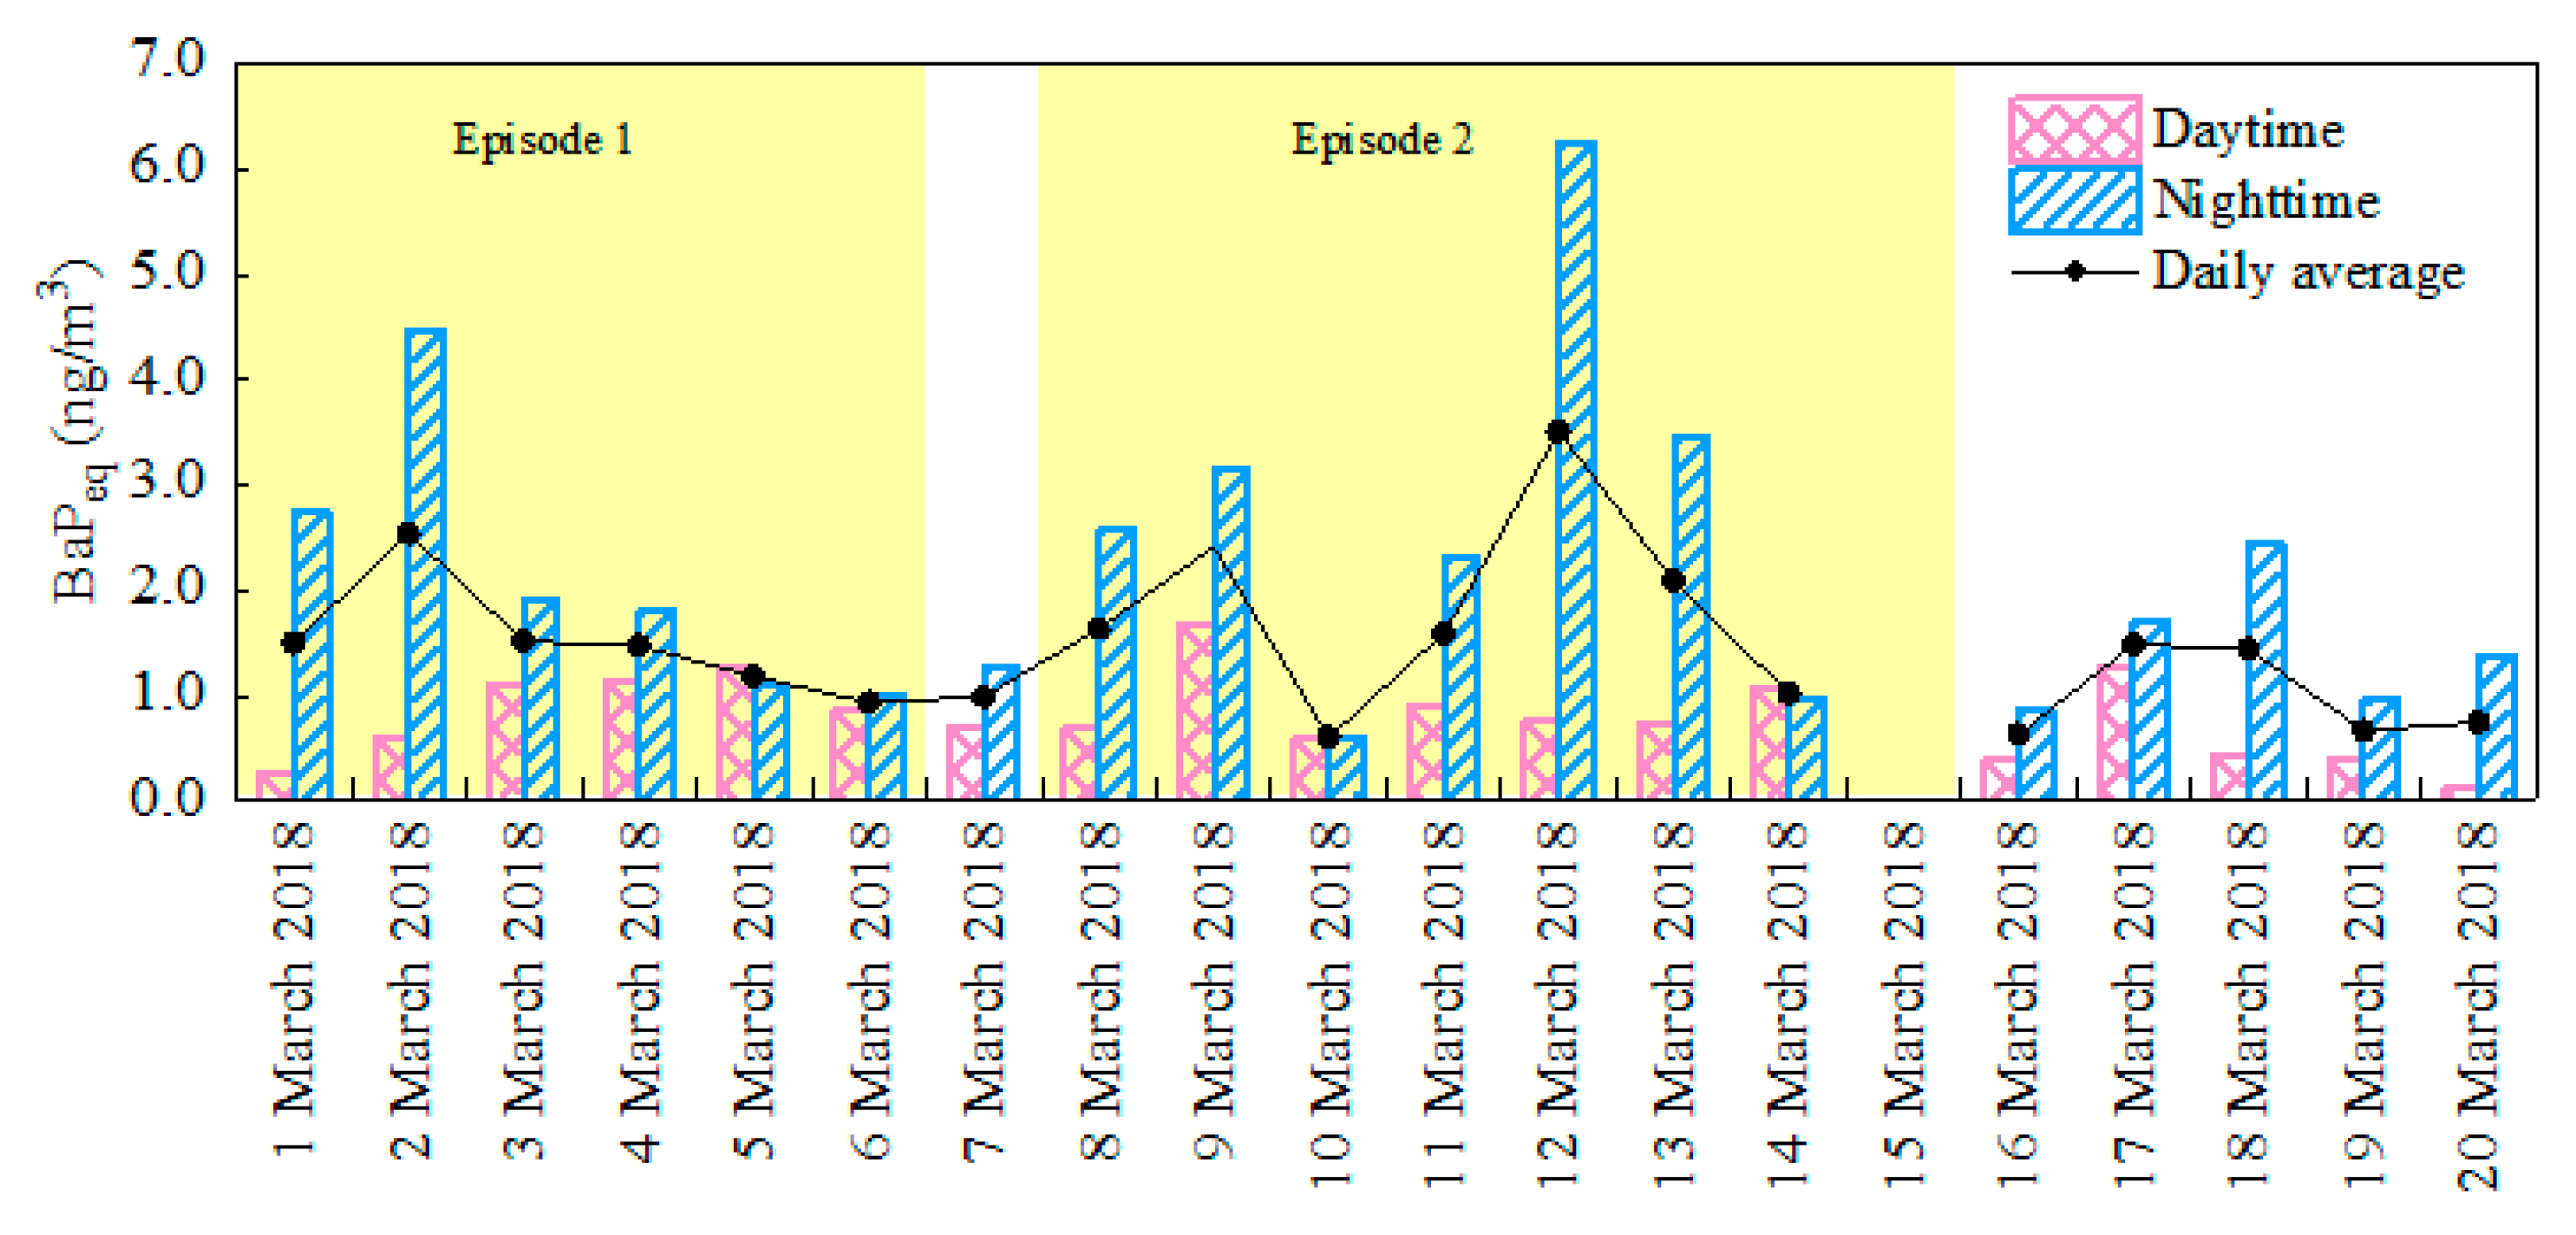
3.3. Variations of PAHs

There were five variation circles in the mass concentration of 15 PAHs (Figure 7). Before March 15 (except for 2, 9, and 13 March), the mass concentrations of 15 PAHs were relatively stable and most were lower than the average value of 21 ng/m3. On 2, 9, 12, and 13 March, the predominant wind direction was south wind or southeast, and the relative humidity was high, which was not conducive to pollutant diffusion. Therefore, the mass concentrations of 15 PAHs in these days were significantly higher than the average value and reached the highest (34 ng/m3) on 12 March. After 15 March, there was no heavy air pollution episode, and heating was about to end. The mass concentrations of 15 PAHs were significantly lower than the average value of the whole monitoring period. As the concentrations of PM2.5 were higher, the concentrations of 15 PAHs became higher too, while the proportions of 15 PAHs in PM2.5 became lower.
Nineteen days of complete monitoring were conducted in the study area. The mass concentrations of 15 PAHs were higher in the nighttime than those in the daytime for 15 days (Figure 7). On 1–4, 7–9, 11–13, 16–20 March, the relative humidity was higher in the nighttime than that in the daytime, and the temperature was slightly lower than that in the daytime. Therefore, PAHs were more likely to adsorb on the surface of PM2.5 in the nighttime. As a result, the mass concentration of 15 PAHs was higher in the nighttime than that in the daytime. On 5 and 10 March, it was cloudy, with southerly or southwesterly winds dominating in the daytime. The meteorological conditions were relatively stable, which was not conducive to the diffusion of pollutants. As a result, the mass concentration of PAHs during the daytime was higher than that in the nighttime in these two days. On 6 and 14 March, the mass concentration of PAHs showed little diurnal difference, with a difference of less than 1 ng/m3; and the diurnal difference of mean temperatures was not obvious. The south wind or southeast wind was dominant on 6 March and the east wind or northeast wind was dominant on 14 March. The relative humidity during the same period of the two days was higher than that in other monitoring days (except for heavy atmospheric pollution days), and PAHs were more likely to adsorb on the surface of PM2.5, which affected the mass concentration of 15 PAHs in PM2.5.
Both heavy air pollution episodes occurred before 15 March. During the two heavy air pollution episodes, the average daily mean mass concentrations of 15 PAHs were 23 ± 2.6 ng/m3 and 24 ± 6.4 ng/m3, respectively. In episode 1, the mass concentration of 15 PAHs in PM2.5 accumulated to the highest value, and then gradually decreased to a lower level due to the favorable meteorological conditions for PAHs diffusion. In episode 2, however, the mass concentration of 15 PAHs in PM2.5 increased and then decreased transiently, then gradually accumulated until it reached the highest value, then dropped to the lowest level. In general, the change of daily mean mass concentration of 15 PAHs in PM2.5 during episode 2 was greater than that in episode 1.

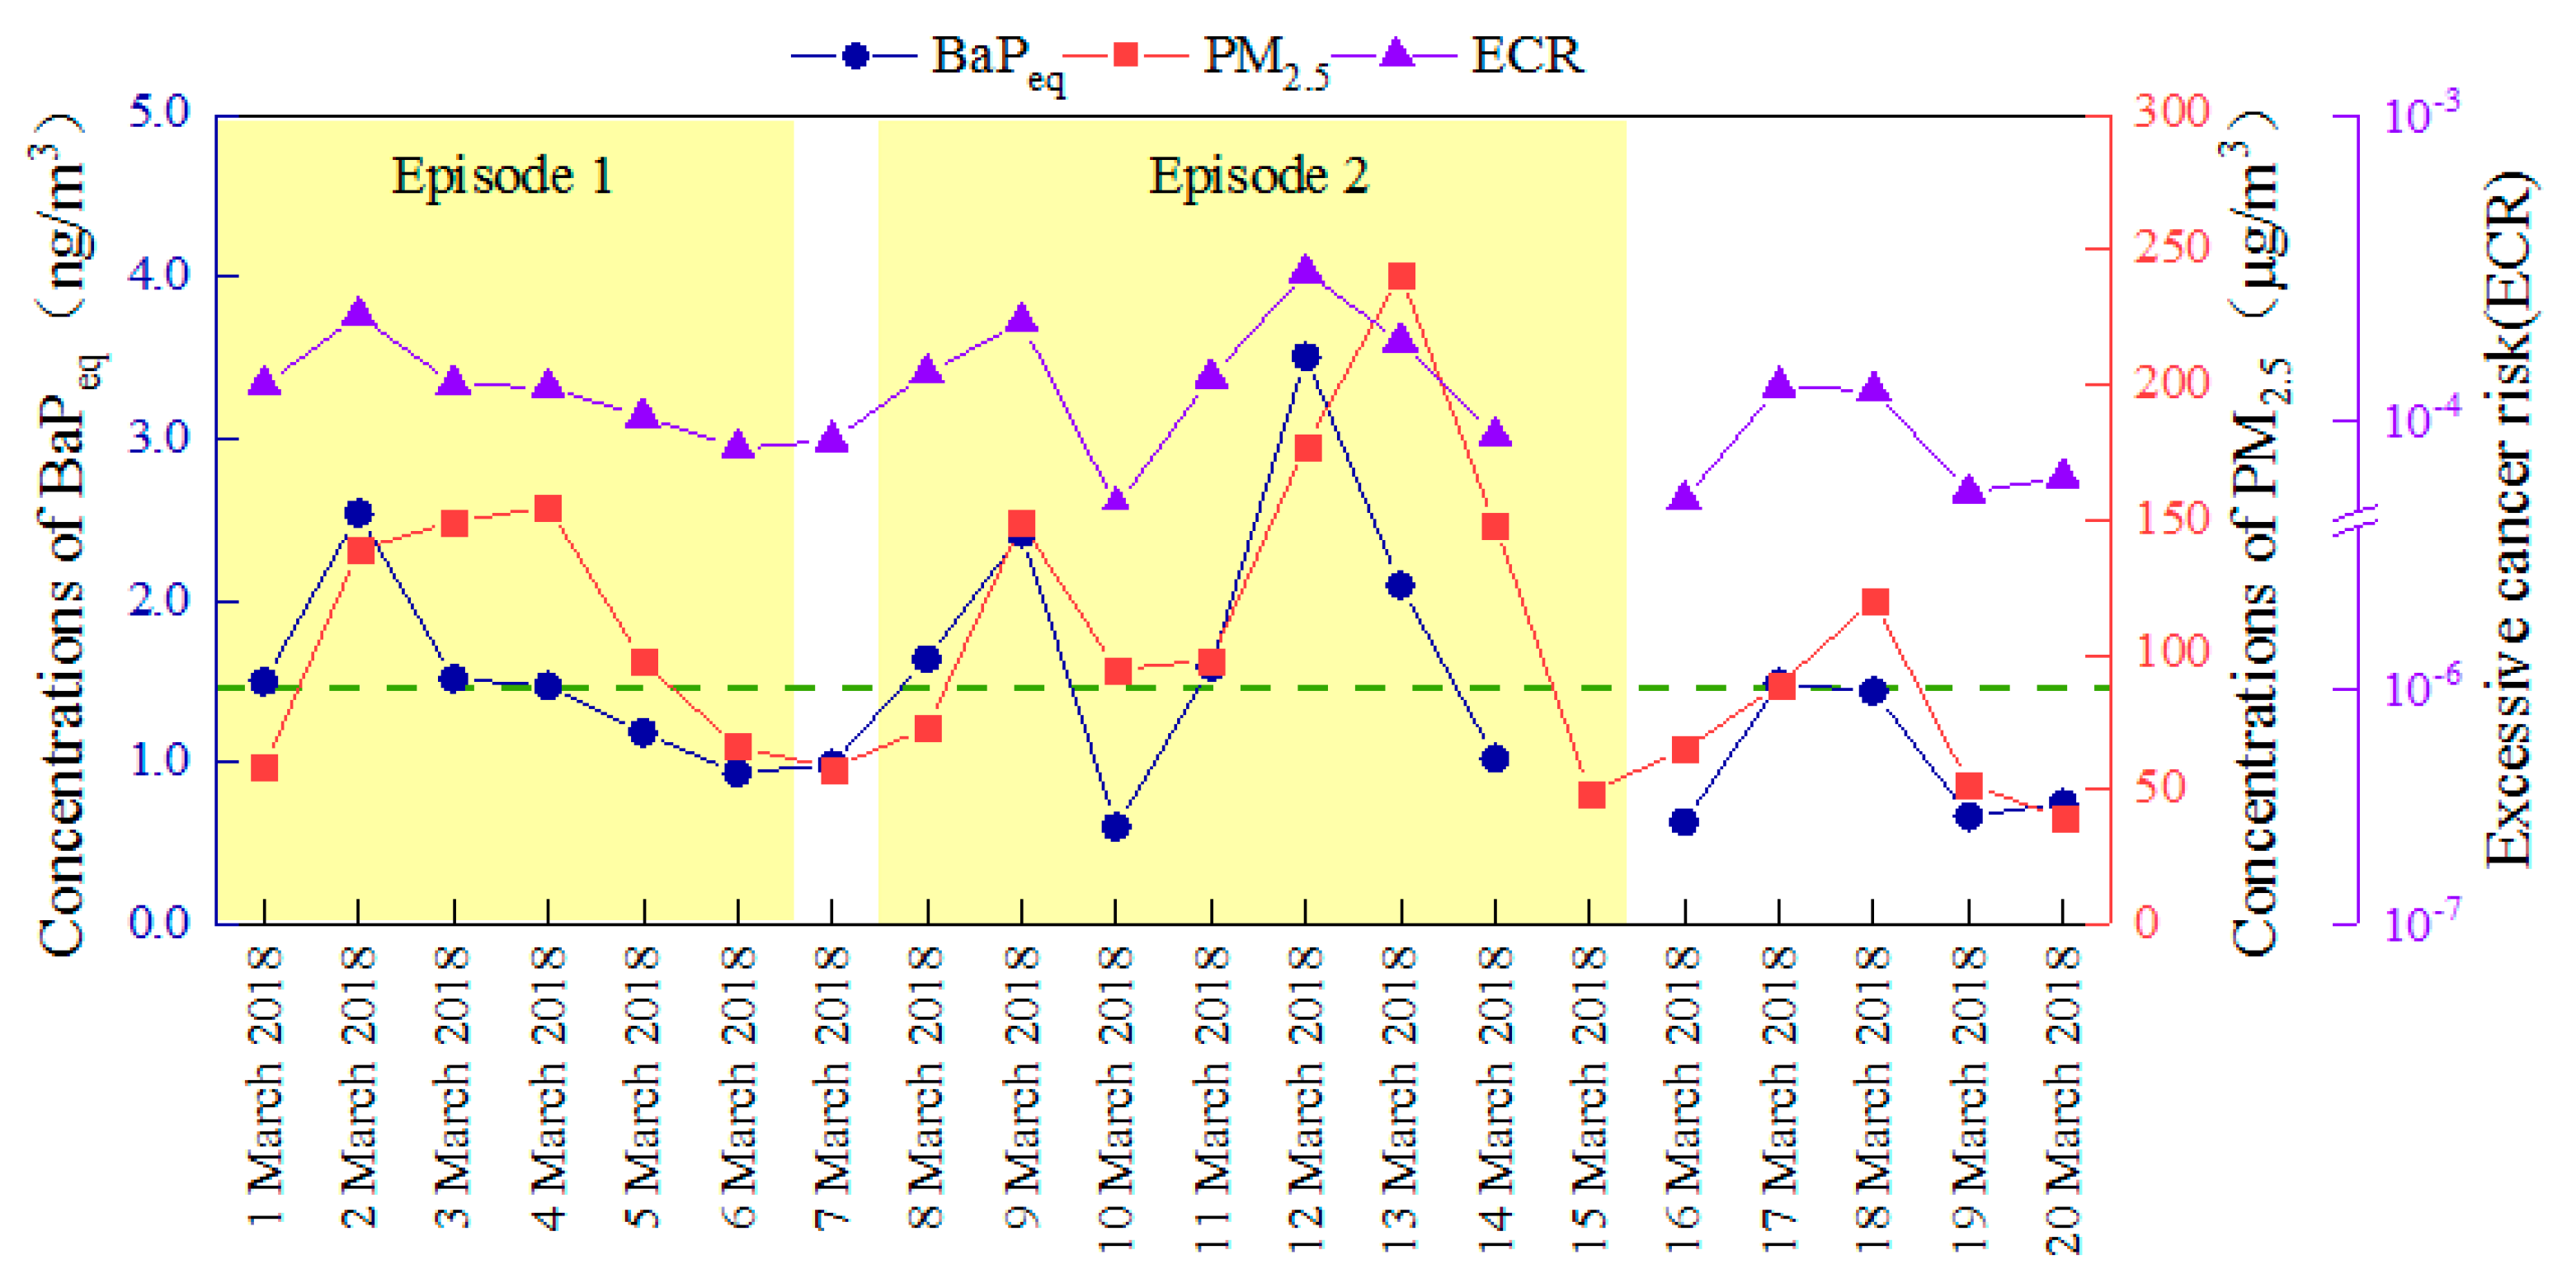
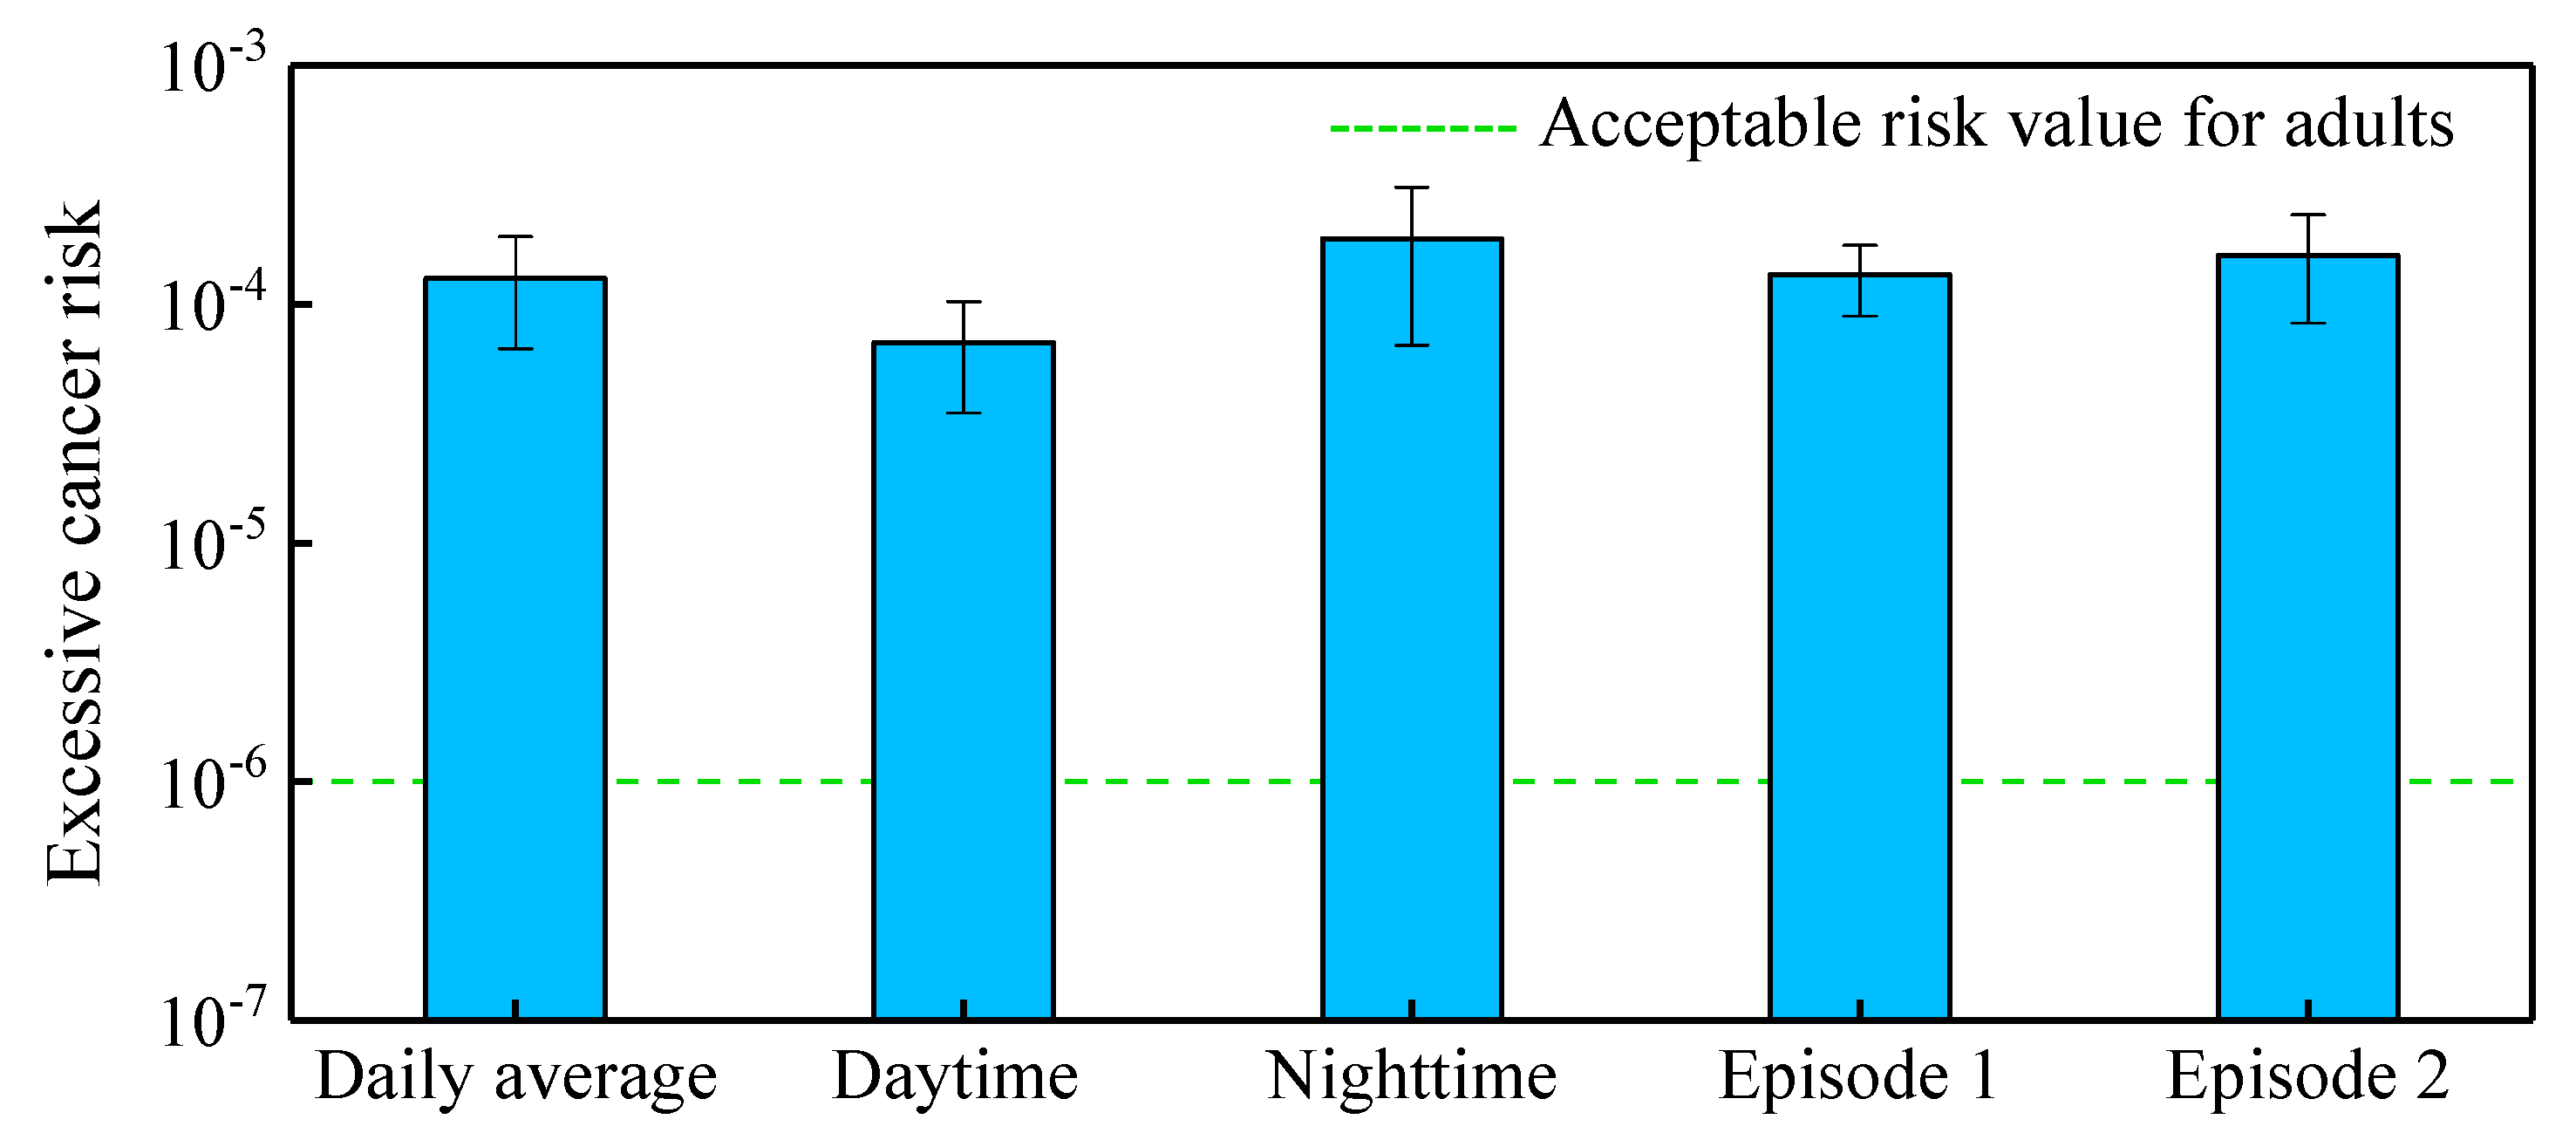
3.4. Health Risk Assessment of PAHs

The daily mean value of the total BaPeq mass concentration of PAHs in the study area during the monitoring period ranged from 0.60 to 3.5 ng/m3, with a mean of 1.5 ng/m3 (Figure 8). Among them, BaP, BbF, and DBA had a greater contribution to the BaPeq mass concentration of PAHs, with a cumulative contribution of 79%. The contribution of 5- and 6-ring PAHs to the mass concentration of BaPeq reached 92%, which was consistent with the results of Chen et al. [36] (94%). The total BaPeq mass concentrations of PAHs in the daytime and nighttime were 0.11–1.7 ng/m3 and 0.60–3.5 ng/m3, respectively, with an average of 0.79 ng/m3 and 2.2 ng/m3, respectively. The total BaPeq mass concentration was significantly higher in the nighttime than that in the daytime, which might be because PAHs are easily decomposed under light conditions [18]. The total BaPeq mass concentrations of PAHs in episode 1 and episode 2 were 0.93–2.5 ng/m3 and 0.60–3.5 ng/m3, respectively, with an average of 1.5 ng/m3 and 1.8 ng/m3. The range of the total BaPeq mass concentration was larger in episode 2 than that in episode 1, and the mean value was also higher in episode 2 than that in episode 1.
The ECRs of 15 PAHs in the study area ranged from 5.3 × 10⁻⁵ to 3.1 × 10⁻⁴, with a mean of 1.3 × 10⁻⁴, which was higher than the acceptable risk value (1 × 10⁻⁶) (Figure 9). Although this value was lower than that of northern Chinese cities such as Taiyuan (2.0 × 10⁻³) [53], it was higher than those of southern Chinese cities such as Nanjing (1.07 × 10⁻⁵) [52], New Zealand (2.1 × 10⁻⁵), and Japan (4.6 × 10⁻⁵) [46]. As the concentrations of PM2.5 and BaPeq became higher, the ECR became higher too (Figure 9). The ECRs of PAHs in the daytime and nighttime were 6.9 × 10⁻⁵ and 1.9 × 10⁻⁴, respectively (Figure 10). Although the daytime value was low, it was still greater than 10−6 (Figure 10). During the two heavy air pollution episodes, the ECRs of PAHs were 1.3 × 10⁻⁴ and 1.6 × 10⁻⁴, respectively. The ECRs of PAHs were higher in heavy air pollution episodes than that in non-heavy air pollution episodes, and significantly higher than the acceptable risk. Effective measures should be taken in Beijing to protect human health.

3.5. Source Identification of PAHs
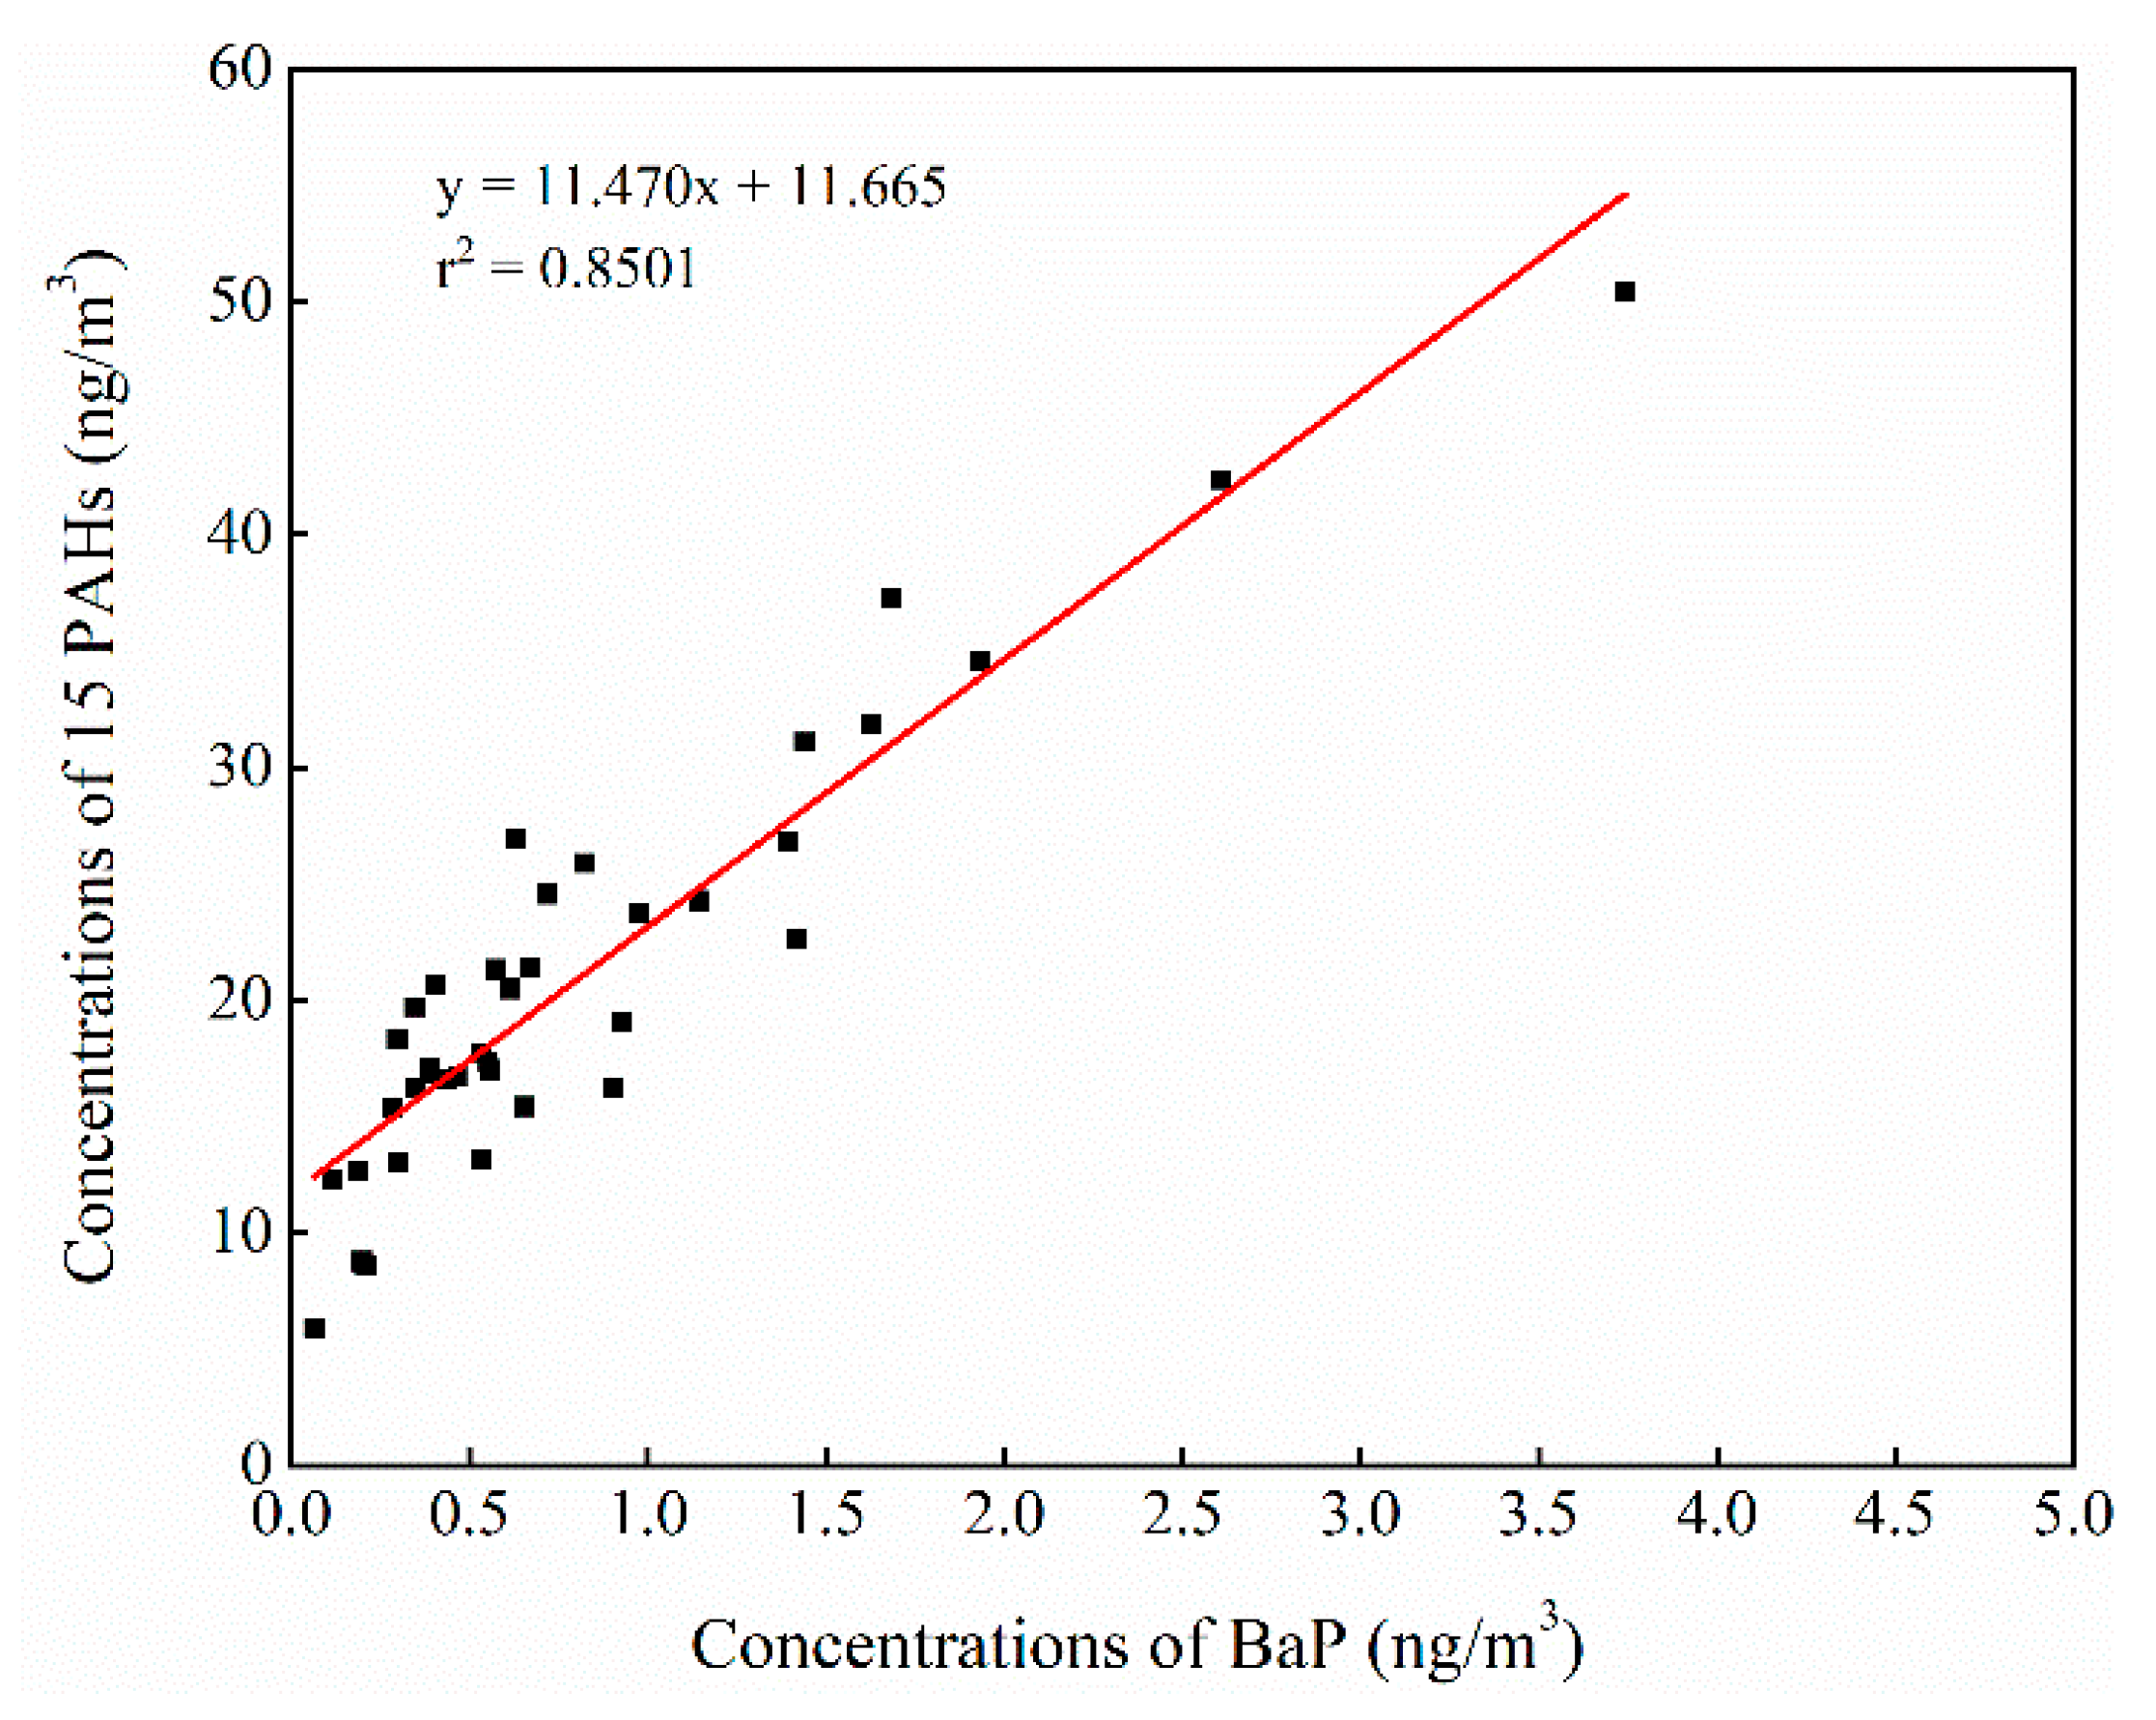
3.5.1. Ratio Method

During the monitoring period, the ratios of Flt/(Pyr + Flt) and IP/(IP + BghiP) were 0.63–0.70 and 0.47–0.51, respectively, with an average of 0.67 and 0.50 (Figure 11a). All Flt/(Pyr + Flt) ratios were greater than 0.50, indicating that biomass and coal combustion influenced PAHs in the study area during the monitoring period. All IP/(IP+ BghiP) ratios were close to 0.50, indicating that motor vehicle exhaust emissions influenced PAHs in PM2.5 in the study area, but the PAHs in PM2.5 were also affected by diesel and gasoline combustion emissions. Therefore, the main sources of PAHs during the monitoring period were coal and biomass combustion and motor vehicle exhaust emission. The ratios of Flt/(Pyr+Flt) and IP/(IP+BghiP) were 0.66–0.72 and 0.43–0.56 in the daytime and 0.60–0.70 and 0.47–0.51 in the nighttime, indicating that PAHs in PM2.5 were affected by biomass and coal combustion emission sources in the daytime and by motor vehicle exhaust emission sources in the nighttime (Figure 11a). The ratios of Flt/(Pyr + Flt) and IP/(IP + BghiP) were 0.63–0.69 and 0.49–0.51 in episode 1, 0.65–0.70 and 0.47–0.51 in episode 1, respectively (Figure 11b). The difference was slight, indicating that there was no significant difference in sources of PAHs in the two pollution episodes, both biomass and coal combustion and motor vehicle exhaust emission influenced PAHs in PM2.5 in the study area.
During the monitoring period, the ratios of BaA/(BaA + Chr) and BaP/BghiP were 0.29–0.47 and 0.58–0.89, respectively, with an average of 0.40 and 0.73 (Figure 12a), indicating that both traffic and non-traffic emission sources affected the PAHs in PM2.5 in the study area during the monitoring period. The ratios of BaA/(BaA+Chr) and BaP/BghiP were 0.25–0.37 and 0.49–0.67 in the daytime and 0.33–0.50 and 0.58–0.95 in the nighttime (Figure 12a), indicating that PAHs in PM2.5 were mainly from traffic emissions in the daytime and from non-traffic emissions in the nighttime. The ratios of BaA/(BaA + Chr) and BaP/BghiP were 0.35–0.47 and 0.59–0.89 in episode 1 and 0.29–0.45 and 0.64–0.86 in episode 2 (Figure 12b). The difference was slight, indicating that the PAHs in PM2.5 in the two heavy air pollution episodes were affected by both traffic and non-traffic emissions. In summary, there were two main sources of PAHs in PM2.5 in the study area during the monitoring period, namely, traffic emission sources (motor vehicle exhaust emission sources) and non-traffic emission sources (coal and biomass combustion emission sources). PAHs in PM2.5 were mainly affected by non-traffic emission sources in the daytime, which might be due to the PAHs emitted by biomass and coal combustion in residential buildings and restaurants surrounding the sampling site in the daytime. Residents and most restaurants were at rest at night surrounding the sampling site, therefore, traffic emission sources might be the main sources of PAHs in PM2.5 in the nighttime.

3.5.2. PCA Source Identification

Two main factors were extracted during the monitoring period. Factor 1 was characterized by high loadings of BghiP, IP, DBA, BbF, and BkF, so factor 1 represented fossil fuel combustion emission sources. Factor 2 was characterized by high loadings of Phe, Ant, Flt, and Pyr, so factor 2 represented biomass combustion emission sources. During the monitoring period, the explained variance contribution rates of factors 1 and 2 were about 72% and 24%, respectively, indicating that the concentration of PAHs in PM2.5 was affected by both vehicle exhaust emission sources and biomass burning emission sources (Table 4). Two main factors were also extracted for the daytime and nighttime. The explained variance contribution rates of factor 1, which represented fossil fuel combustion emission sources, were about 64% and 73%, respectively; and the explained variance contribution rates of factor 2, which represented biomass burning emission sources, were about 29% and 24%, respectively (Table 4). The explained variance contribution rate of biomass burning was higher in the daytime than that in the nighttime, indicating that the concentration of PAHs in PM2.5 was affected by biomass combustion emission from restaurants and residential buildings in the daytime. This was consistent with the results obtained from the characteristic ratio method.

3.5.3. Backward Trajectory Analysis

During the whole observation period, atmospheric air masses in the study area mainly came from three directions (Figure 13a), namely, north-northwest (Mongolia, the border of Russia and Inner Mongolia of China), west-southwest (Shanxi, western Hebei and Henan), and south-southeast (Tianjin, Shandong and eastern Hebei), the frequencies of air masses from the three directions were 65%, 17% and 18%, respectively (Figure 13a). In episode 1, the air masses that came from these three directions were 44%, 24%, and 32%, respectively (Figure 13b). In episode 2, the frequencies of air masses from these three directions were 31%, 36%, and 33%, respectively (Figure 13c). In summary, the PM2.5 levels in the study area were affected by long-distance transport of air masses from north-northwest, west-southwest, and south-southeast during the monitoring period, and the air mass transport from the south-southeast had a greater impact on the concentrations of PM2.5 during heavy pollution days. It is recommended that strengthened control policies for not only local sources but also sources from transport channels should be implemented to reduce PM2.5 levels in Beijing.

4. Conclusions

The mean daily mass concentration of PM2.5-bound PAHs was 21 ng/m3 in an urban area of Beijing, and obviously higher in the nighttime than that in the daytime. For PAHs with different ring numbers, 4-ring PAHs accounted for the highest proportion, 3- and 5-ring PAHs accounted for comparable proportions, and 6-ring PAHs accounted for the lowest proportion. The proportions of 5- and 6-ring PAHs were significantly higher in the nighttime than that in the daytime. The mass concentrations of PM2.5-bound PAHs were significantly higher during heavy air pollution episodes than that during non-heavy air pollution episodes, and the proportions of 5- and 6-ring PAHs were significantly higher than those non-heavy air pollution episodes. Although the concentration of PM2.5 has decreased significantly in Beijing in recent years, the pollution of PM2.5-bound is still serious in Beijing during the heavy air pollution episode with PM2.5 as the primary pollutant.
The ECR of PAHs was 1.3 × 10⁻⁴ in the typical urban areas of Beijing. The ECRs of PM2.5-bound PAHs were higher during the two heavy air pollution episodes than the average value of the whole monitoring period, and much higher than human acceptable risk (1 × 10⁻⁶), suggesting PAHs posed obvious carcinogenic risks to the exposed populations. During the monitoring period, PM2.5-bound PAHs were mainly from traffic emission sources and coal and biomass burning emission sources and were affected by coal and biomass burning emission sources in the daytime and by traffic emission sources in the nighttime. The influence of regional transport on PM2.5 could not be ignored in the study area during the monitoring period. During heavy air pollution episodes, the contribution of regional transport increased obviously. It is recommended that not only the PM2.5 levels but also the PAHs levels should be controlled to protect human health in Beijing.

Supplementary Materials

The following are available online at https://www.mdpi.com/2073-4433/12/3/323/s1.

Author Contributions

Conceptualization, H.L.; investigation, Y.J. and Y.R.; methodology, H.L.; software, L.Z. and H.Z.; visualization, F.G. and Y.Y.; writing—original draft, M.L. and Y.J.; writing—review and editing, M.L., Y.J. and H.L. All authors have read and agreed to the published version of the manuscript.

Funding

This research was funded by the 2018 annual Graduation Practice Training Program of Beijing City University and the programs from Beijing Municipal Science and Technology Commission (No. Z181100005418015).

Institutional Review Board Statement

Not applicable.

Informed Consent Statement

Not applicable.

Data Availability Statement

The data presented in this study are available in supplementary material.

Conflicts of Interest

All authors declare no conflict of interest.

References

  1. Wang, Y.; Zhang, S.; Li, X.; Guo, X.; Wang, Y. Seasonal Varition and Source Identification of Polycyclic Aromatic Hydrocarbons(PAHs) in airborne Particulates of Beijing. Environ. Chem. 2010, 29, 369–375. [Google Scholar]
  2. Shi, C.; Qu, Y.; Mao, X. Analysis and pollution characteristics of polycyclic aromatic hydrocarbons(PAHs) in PM2.5. Environ. Chem. 2015, 34, 1417–1423. [Google Scholar]
  3. Zhang, T.; Peng, L.; Li, Y.; LIiu, H.; Wang, Y.; Wang, Y. Chemical Characteristics of PM2. 5 Emitted from Cooking Fumes. Res. Environ. Sci. 2016, 29, 183–191. [Google Scholar]
  4. Christian, E.; Markus, K.; Vera, S.; Renato, Z. High time resolution and size-segregated analysis of aerosol bound polycyclic aromatic hydrocarbons. Environ. Sci. Technol. 2005, 39, 4213–4219. [Google Scholar] [CrossRef]
  5. Duan, F.; He, K.; Ma, Y. Concentrationand sources of atmospheric polycyclic aromatic hydrocarbons(PAHs) in PM2.5 in Beijing. Acta Sci. Circumstantiae 2009, 29, 1363–1371. [Google Scholar]
  6. Li, Z.; Porter, E.N.; Sjödin, A.; Needham, L.L.; Lee, S.; Russell, A.G.; Mulholland, J.A. Characterization of PM2.5-bound polycyclic aromatic hydrocarbons in Atlanta—Seasonal variations at urban, suburban, and rural ambient air monitoring sites. Atmos. Environ. 2009, 43, 4187–4193. [Google Scholar] [CrossRef]
  7. Topinka, J.; Schwarz, L.; Wiebel, F.; Cerna, M.; Wolff, T. Genotoxicity of urban air pollutants in the Czech Republic. Mutat. Res. Toxicol. Environ. Mutagen. 2000, 469, 83–93. [Google Scholar] [CrossRef]
  8. Chen, Y.-C.; Chiang, H.-C.; Hsu, C.-Y.; Yang, T.-T.; Lin, T.-Y.; Chen, M.-J.; Chen, N.-T.; Wu, Y.-S. Ambient PM2.5-bound polycyclic aromatic hydrocarbons (PAHs) in Changhua County, central Taiwan: Seasonal variation, source apportionment and cancer risk assessment. Environ. Pollut. 2016, 218, 372–382. [Google Scholar] [CrossRef]
  9. Liu, J.; Man, R.; Ma, S.; Li, J.; Wu, Q.; Peng, J. Atmospheric levels and health risk of polycyclic aromatic hydrocarbons (PAHs) bound to PM 2.5 in Guangzhou, China. Mar. Pollut. Bull. 2015, 100, 134–143. [Google Scholar] [CrossRef]
  10. Panther, B.; Hooper, M.; Tapper, N. A comparison of air particulate matter and associated polycyclic aromatic hydrocarbons in some tropical and temperate urban environments. Atmos. Environ. 1999, 33, 4087–4099. [Google Scholar] [CrossRef]
  11. Mantis, J.; Chaloulakou, A.; Samara, C. PM10-bound polycyclic aromatic hydrocarbons (PAHs) in the Greater Area of Athens, Greece. Chemosphere 2005, 59, 593–604. [Google Scholar] [CrossRef] [PubMed]
  12. Vasilakos, C.; Levi, N.; Maggos, T.; Hatzianestis, J.; Michopoulos, J.; Helmis, C. Gas–particle concentration and characterization of sources of PAHs in the atmosphere of a suburban area in Athens, Greece. J. Hazard. Mater. 2007, 140, 45–51. [Google Scholar] [CrossRef]
  13. Finizio, A.; Mackay, D.; Bidleman, T.; Harner, T. Octanol-air partition coefficient as a predictor of partitioning of semi-volatile organic chemicals to aerosols. Atmos. Environ. 1997, 31, 2289–2296. [Google Scholar] [CrossRef]
  14. Paasivirta, J.; Sinkkonen, S.; Mikkelson, P.; Rantio, T.; Wania, F. Estimation of vapor pressures, solubilities and Henry’s law constants of selected persistent organic pollutants as functions of temperature. Chemosphere 1999, 39, 811–832. [Google Scholar] [CrossRef]
  15. Park, S.S.; Kim, Y.J. Source contributions to fine particulate matter in an urban atmosphere. Chemosphere 2005, 59, 217–226. [Google Scholar] [CrossRef] [PubMed]
  16. Harrison, R.M.; Smith, A.D.J.T.; Luhana, L. Source Apportionment of Atmospheric Polycyclic Aromatic Hydrocarbons Collected from an Urban Location in Birmingham, U.K. Environ. Sci. Technol. 1996, 30, 825–832. [Google Scholar] [CrossRef]
  17. Wang, C.; Zhang, L.; Dao, X.; Lv, Y.; Teng, E.; Li, G. Pollution characteristics and source identification of polycyclic aromatic hydrocarbons in airborne particulates of Beijing-Tianjin-Hebei Region, China. China Environ. Sci. 2015, 35, 1–6. [Google Scholar]
  18. Li, X.; Guo, X.; Liu, X.; Wang, Y. Pollution Characteristics of PAHs in the Atmospheric Aerosols in winter time of Beijig. Environ. Chem. 2008, 27, 490–493. [Google Scholar]
  19. Feng, B.; Li, L.; Xu, H.; Wang, T.; Wu, R.; Chen, J.; Zhang, Y.; Liu, S.; Ho, S.S.H.; Cao, J.; et al. PM2.5-bound polycyclic aromatic hydrocarbons (PAHs) in Beijing: Seasonal variations, sources, and risk assessment. J. Environ. Sci. 2019, 77, 11–19. [Google Scholar] [CrossRef]
  20. Zeng, F.; Wang, G.; Tian, J.; Yu, T.; Zhang, H. Pollution characteristics and source apportionment of PAHs in atmospheric aerosols of some regions in Beijing. Acta Sci. Circumstantiae 2002, 22, 284–288. [Google Scholar]
  21. Zhang, D.; Ma, Y.; He, K.; Duan, F.; Jia, Y.; Okuda, T.; Tanaka, S. Characteristics of Polycycl ic Aromatic Hydrocarbons (PAHs) on Airborne Particulates in Beijing. Environ. Sci. 2006, 27, 1269–1275. [Google Scholar]
  22. Chang, J.; Shen, J.; Tao, J.; Li, N.; Xu, C.; Li, Y.; Liu, Z.; Wang, Q. The impact of heating season factors on eight PM2.5-bound polycyclic aromatic hydrocarbon (PAH) concentrations and cancer risk in Beijing. Sci. Total Environ. 2019, 688, 1413–1421. [Google Scholar] [CrossRef]
  23. Wang, H.; Zang, X.; Ma, L.; Li, J.; Yan, G.; Qu, L.; Zhao, M.Q. Health risk assessment of inhabitants exposed to polycyclic aromatic hydrocarbons and particulate matter in air in Changping district of Beijing. J. Environ. Health 2016, 33, 999–1002. [Google Scholar]
  24. Work Plan for Air Pollution Prevention and Control in Beijing-Tianjin-Hebei and Surrounding Areas in 2017. Available online: http://dqhj.mee.gov.cn/dtxx/201703/t20170323_408663.shtml (accessed on 6 March 2020).
  25. Beijing Ecology Environmental Statement. Available online: http://sthjj.beijing.gov.cn/bjhrb/resource/cms/2019/05/2019050915390769405.pdf (accessed on 7 March 2020).
  26. Chao, S.; Liu, J.; Chen, Y.; Cao, H.; Zhang, A. Implications of seasonal control of PM2.5-bound PAHs: An integrated approach for source apportionment, source region identification and health risk assessment. Environ. Pollut. 2019, 247, 685–695. [Google Scholar] [CrossRef]
  27. Gao, Y.; Ji, H. Characteristics of polycyclic aromatic hydrocarbons components in fine particle during heavy polluting phase of each season in urban Beijing. Chemosphere 2018, 212, 346–357. [Google Scholar] [CrossRef]
  28. Wang, X. Available online: http://beijingair.sinaapp.com/ (accessed on 6 March 2019).
  29. WunderGround. Available online: https://www.wunderground.com/history/monthly/cn/beijing/ZBNY/date/2018-3 (accessed on 15 March 2019).
  30. Li, J.; Wang, G.; Ren, Y.; Wang, J.; Wu, C.; Han, Y.; Zhang, L.; Cheng, C.; Meng, J. Identification of chemical compositions and sources of atmospheric aerosols in Xi’an, inland China during two types of haze events. Sci. Total Environ. 2016, 566, 230–237. [Google Scholar] [CrossRef]
  31. Ren, Y.; Li, H.; Meng, F.; Wang, G.; Zhang, H.; Yang, T.; Li, W.; Ji, Y.; Bi, F.; Wang, X. Impact of emission controls on air quality in Beijing during the 2015 China Victory Day Parade: Implication from organic aerosols. Atmos. Environ. 2019, 198, 207–214. [Google Scholar] [CrossRef]
  32. Bandowe, B.A.M.; Meusel, H.; Huang, R.-J.; Ho, K.; Cao, J.; Hoffmann, T.; Wilcke, W. PM2.5-bound oxygenated PAHs, nitro-PAHs and parent-PAHs from the atmosphere of a Chinese megacity: Seasonal variation, sources and cancer risk assessment. Sci. Total Environ. 2014, 473-474, 77–87. [Google Scholar] [CrossRef] [PubMed]
  33. Li, Y.; Liu, X.; Liu, M.; Li, X.; Meng, F.; Wang, J.; Yan, W.; Lin, X.; Zhu, J.; Qin, Y. Investigation into atmospheric PM2.5-borne PAHs in Eastern cities of China: Concentration, source diagnosis and health risk assessment. Environ. Sci. Process. Impacts 2016, 18, 529–537. [Google Scholar] [CrossRef] [PubMed]
  34. Ren, Y.; Zhou, B.; Tao, J.; Cao, J.; Zhang, Z.; Wu, C.; Wang, J.; Li, J.; Zhang, L.; Han, Y.; et al. Composition and size distribution of airborne particulate PAHs and oxygenated PAHs in two Chinese megacities. Atmos. Res. 2017, 183, 322–330. [Google Scholar] [CrossRef]
  35. Malcolm, H.M.; Dobson, S. The Calculation of an Environmental Assessment Level (EAL) for Atmospheric PAHs Using Relative Potencies; Department of the Environment: London, UK, 1994.
  36. Chen, Y.; Li, X.; Zhu, T.; Han, Y.; Lv, D. PM2.5-bound PAHs in three indoor and one outdoor air in Beijing: Concentration, source and health risk assessment. Sci. Total Environ. 2017, 586, 255–264. [Google Scholar] [CrossRef]
  37. World Health Organization. Air Quality Guideline for Europe, 2nd ed.; WHO Regional Office: Copenhagen, Denmark, 2000. [Google Scholar]
  38. Duan, F.K.; He, K.B.; Ma, Y.L.; Yang, F.M.; Yu, X.C.; Cadle, S.H.; Chan, T.; Mulawa, P.A. Concentration and chemical characteristics of PM2.5 in Beijing, China: 2001–2002. Sci. Total Environ. 2006, 355, 264–275. [Google Scholar] [CrossRef] [PubMed]
  39. Wang, W.; Huang, M.-J.; Kang, Y.; Wang, H.-S.; Leung, A.O.; Cheung, K.C.; Wong, M.H. Polycyclic aromatic hydrocarbons (PAHs) in urban surface dust of Guangzhou, China: Status, sources and human health risk assessment. Sci. Total Environ. 2011, 409, 4519–4527. [Google Scholar] [CrossRef]
  40. Khalili, N.R.; Scheff, P.A.; Holsen, T.M. PAH source fingerprints for coke ovens, diesel and, gasoline engines, highway tunnels, and wood combustion emissions. Atmos. Environ. 1995, 29, 533–542. [Google Scholar] [CrossRef]
  41. Hamid, N.; Syed, J.H.; Junaid, M.; Mahmood, A.; Li, J.; Zhang, G.; Malik, R.N. Elucidating the urban levels, sources and health risks of polycyclic aromatic hydrocarbons (PAHs) in Pakistan: Implications for changing energy demand. Sci. Total Environ. 2018, 165–175. [Google Scholar] [CrossRef]
  42. Wang, L.; Wang, L.; Shi, X.; Lu, X. Distribution Characteristics and Source Analysis of Polycyclic AromaticHydrocarbons(PAHs) in Surface Dust of Xian City, China. Environ. Sci. 2016, 37, 1279–1286. [Google Scholar]
  43. Fernández, P.; Grimalt, J.O.; Vilanova, R.M. Atmospheric Gas-Particle Partitioning of Polycyclic Aromatic Hydrocarbons in High Mountain Regions of Europe. Environ. Sci. Technol. 2002, 36, 1162–1168. [Google Scholar] [CrossRef]
  44. De La Torre-Roche, R.J.; Lee, W.-Y.; Campos-Díaz, S.I. Soil-borne polycyclic aromatic hydrocarbons in El Paso, Texas: Analysis of a potential problem in the United States/Mexico border region. J. Hazard. Mater. 2009, 163, 946–958. [Google Scholar] [CrossRef] [Green Version]
  45. Air Resources Laboratory. Available online: http://ready.arl.noaa.gov/archives.php (accessed on 15 January 2020).
  46. Kalisa, E.; Nagato, E.; Bizuru, E.; Lee, K.; Tang, N.; Pointing, S.; Hayakawa, K.; Archer, S.; Lacap-Bugler, D. Pollution characteristics and risk assessment of ambient PM2.5-bound PAHs and NPAHs in typical Japanese and New Zealand cities and rural sites. Atmos. Pollut. Res. 2019, 10, 1396–1403. [Google Scholar] [CrossRef]
  47. Tolis, E.I.; Saraga, D.E.; Lytra, M.K.; Papathanasiou, A.C.; Bougaidis, P.N.; Prekas-Patronakis, O.E.; Ioannidis, I.I.; Bartzis, J.G. Concentration and chemical composition of PM2.5 for a one-year period at Thessaloniki, Greece: A comparison between city and port area. Atmos. Environ. 2015, 113, 197–207. [Google Scholar] [CrossRef]
  48. Villar-Vidal, M.; Lertxundi, A.; De Dicastillo, M.M.L.; Alvarez, J.; Marina, L.S.; Ayerdi, M.; Basterrechea, M.; Ibarluzea, J. Air Polycyclic Aromatic Hydrocarbons (PAHs) associated with PM2.5 in a North Cantabric coast urban environment. Chemosphere 2014, 99, 233–238. [Google Scholar] [CrossRef] [PubMed]
  49. Dameng, L.; Shaopeng, G.; Xianghua, A. Distribution and Source Apportionment of Polycyclic Aromatic Hydrocarbons from Atmospheric Particulate Matter PM2.5 in Beijing. Adv. Atmos. Sci. 2008, 25, 297–305. [Google Scholar]
  50. Wu, Y.; Yang, L.; Zheng, X.; Zhang, S.; Song, S.; Li, J.; Hao, J. Characterization and source apportionment of particulate PAHs in the roadside environment in Beijing. Sci. Total Environ. 2014, 470, 76–83. [Google Scholar] [CrossRef] [PubMed]
  51. Dong, X.; Wang, Q.; Yang, Y.; Liu, T.; Wang, Q.; Wu, Y.; Fang, J. Characterization of ambient PM2.5 and PAHs during 2017 Spring Festival in urban and suburb areas of Beijing. Environ. Chem. 2018, 37, 2191–2198. [Google Scholar]
  52. Kong, S.; Yan, Q.; Zheng, H.; Liu, H.; Wang, W.; Zheng, S.; Yang, G.; Zheng, M.; Wu, J.; Qi, S.; et al. Substantial reductions in ambient PAHs pollution and lives saved as a co-benefit of effective long-term PM2.5 pollution controls. Environ. Int. 2018, 114, 266–279. [Google Scholar] [CrossRef] [PubMed] [Green Version]
  53. Guo, Z.; Liu, D.; Lin, T.; Li, J.; Yu, Z.; Zhang, G. Concentration, source identification, and exposure risk assessment of PM2.5-bound PAHs and nitro-PAHs in the atmosphere of Taiyuan. Acta Sci. Circumstantiae 2018, 38, 1102–1108. [Google Scholar]
Figure 1. Sampling site location and its surrounding environment.
Atmosphere 12 00323 g001
Figure 2. Daily variation of the concentration of PM10, PM2.5, SO2, NO2, CO, O3, ambient air quality index (AQI), and meteorological conditions in the study area during the monitoring period.
Atmosphere 12 00323 g002
Figure 3. Daily and diurnal variation of PM2.5 mass concentrations in the study area during the monitoring period.
Atmosphere 12 00323 g003
Figure 4. Linear relationship of 15 PAHs and benzo[a]pyrene (BaP) in the study area during the monitoring period.
Atmosphere 12 00323 g004
Figure 5. Proportions of PAHs with different rings in the study area during the monitoring period.
Atmosphere 12 00323 g005
Figure 6. Comparison of BaP mass concentrations in PM2.5 in the study area with other regions.
Atmosphere 12 00323 g006
Figure 7. Daily and diurnal variation of mass concentrations of 15 PAHs in the study area during the monitoring period.
Atmosphere 12 00323 g007
Figure 8. Daily and diurnal variation of BaP equivalent concentration (BaPeq) mass concentrations in PAHs during the monitoring period.
Atmosphere 12 00323 g008
Figure 9. Variation of BaPeq, PM2.5, and excessive cancer risk (ECR) in the study area during the monitoring period.
Atmosphere 12 00323 g009
Figure 10. Comparison of excessive cancer risk of PAHs in the study area during the monitoring period.
Atmosphere 12 00323 g010
Figure 11. Variation of fluoranthene (Flt)/(Flt + pyrene (Pyr)) and indeno [1,2,3-cd] pyrene (IP)/(IP + benzo[ghi]perylene (BghiP)) during the monitoring period: (a) Flt/(Flt + Pyr) VS. IP/(IP + BghiP), (b) Flt/(Flt + Pyr) VS. IP/(IP + BghiP).
Atmosphere 12 00323 g011
Figure 12. Variation of BaP/BghiP and BaA(BaA + Chr) during the monitoring period: (a) BaP/BghiP VS. BaA/(BaA + Chr), (b) BaP/BghiP VS. BaA/(BaA + Chr).
Atmosphere 12 00323 g012
Figure 13. Backward trajectory clustering analysis in the study area: (a) during the whole observation period, (b) episode 1, (c) episode 2.
Atmosphere 12 00323 g013
Table 1. The toxic equivalent factors of polycyclic aromatic hydrocarbons (PAHs) [35].
Compounds of PAHsAbbreviationRingsTEF
PhenanthrenePhe30.001
AnthraceneAnt30.01
FluorantheneFlt30.001
PyrenePyr40.001
Benzo[a]anthraceneBaA40.1
ChryseneChr40.01
Benzo[b]fluorantheneBbF50.1
Benzo[k]fluorantheneBkF50.1
Benzo[e]pyreneBeP50.01
Benzo[a]pyreneBaP51
PerylenePer50.001
Dibenz[a,h]anthraceneDBA51
Indeno[1,2,3-cd]pyreneIP60.1
Benzo[ghi]peryleneBghip60.01
Table 2. PAHs diagnostic ratios used as a source indicator.
Diagnostic RatiosValueIndicator SourceReferences
BaA/(Chr + BaA)<0.20petroleum sources[19]
0.20–0.35mixed combustion sources
>0.35combustion sources
Flt/(Pyr + Flt)<0.40petroleum sources[43]
0.40–0.50petroleum combustion sources
>0.35coal and biomass combustion sources
BaP/BghiP<0.60non-traffic emission sources[19]
>0.60traffic emission sources
IP/(IP + BghiP)0.20–0.50petroleum sources and gasoline combustion sources[44]
0.40–0.50diesel combustion sources
Table 3. Mean and ranges of mass concentrations of PAHs in the study area during the monitoring period (ng/m3).
SpeciesDaily Mean
(n = 38)
Daytime
(n = 19)
Nighttime
(n = 19)
Episode 1
(n = 12)
Episode 2
(n = 14)
Phenanthrene
Phe
4.6 ± 1.3
2.3–6.8
4.4 ± 1.5
2.1–7.5
4.7 ± 1.3
2.4–7.1
5.3 ± 1.0
4.4–7.0
4.8 ± 0.65
4.1–5.6
Anthracene
Ant
0.23 ± 0.06
0.12–0.33
0.21 ± 0.07
0.11–0.35
0.24 ± 0.06
0.13–0.36
0.24 ± 0.05
0.18–0.31
0.25 ± 0.03
0.22–0.28
Fluoranthene
Flt
4.7 ± 1.2
2.6–6.3
4.3 ± 1.4
2.0–7.2
5.0 ± 1.2
3.0–6.7
5.2 ± 0.81
3.9–6.2
5.2 ± 0.60
4.3–6.3
Pyrene
Pyr
2.3 ± 0.57
1.3–3.3
1.9 ± 0.61
0.80–3.2
2.6 ± 0.77
1.6–4.1
2.5 ± 0.32
1.9–2.8
2.6 ± 0.43
2.0–3.3
Benzo[a]anthracene
BaA
0.84 ± 0.48
0.32–2.1
0.38 ± 0.20
0.07–0.79
1.3 ± 0.94
0.36–3.9
0.93 ± 0.43
0.57–1.7
1.0 ± 0.61
0.32–2.1
Chrysene
Chr
1.2 ± 0.57
0.50–2.6
0.81 ± 0.37
0.16–1.6
1.6 ± 1.0
0.69–4.3
1.3 ± 0.35
0.91–1.9
1.6 ± 0.69
0.76–2.6
Benzo[b]fluoranthene
BbF
2.4 ± 1.1
1.0–5.0
1.5 ± 0.77
0.19–3.0
3.3 ±2.0
0.96–8.6
2.5 ± 0.75
1.6–3.8
2.9 ± 1.4
1.1–5.1
Benzo[k]fluoranthene
BkF
0.49 ± 0.24
0.19–1.1
0.30 ± 0.14
0.04–0.58
0.67 ± 0.42
0.26–1.8
0.47 ± 0.13
0.31–0.70
0.66 ± 0.28
0.28–1.1
Benzo[a]fluoranthene
BaF
0.23 ± 0.12
0.08–0.60
0.10 ± 0.05
0.02–0.21
0.36 ± 0.24
0.11–1.1
0.24 ± 0.09
0.15–0.41
0.28 ± 0.16
0.09–0.60
Benzo[e]pyrene
BeP
0.84 ± 0.42
0.32–1.9
0.50 ± 0.26
0.07–1.0
1.2 ± 0.77
0.39– 3.4
0.87 ± 0.29
0.49–1.4
1.1 ± 0.52
0.40–2.0
Benzo[a]pyrene
BaP
0.82 ± 0.44
0.31–2.1
0.40 ± 0.21
0.06–0.82
1.2 ± 0.85
0.35–3.7
0.85 ± 0.33
0.12–1.5
1.0 ± 0.56
0.32–2.1
Perylene
Per
0.18 ± 0.09
0.06–0.42
0.07 ± 0.04
0.01–0.14
0.28 ± 0.18
0.09–0.77
0.18 ± 0.07
0.12–0.31
0.22 ± 0.12
0.06–0.42
Dibenz[a,h]anthracene
DBA
0.14 ± 0.07
0.04–0.31
0.09 ± 0.05
0.02–0.21
0.20 ± 0.13
0.02–0.55
0.14 ± 0.05
0.09–0.22
0.17 ± 0.10
0.04–0.31
Indeno[1,2,3-cd]pyrene
IP
1.1 ± 0.50
0.44–2.2
0.67 ± 0.37
0.09–1.6
1.5 ± 0.91
0.40–3.8
1.1 ± 0.37
0.67–1.7
1.3 ± 0.64
0.45–2.2
Benzo[ghi]perylene
Bghip
1.1 ± 0.54
0.45–2.5
0.67 ± 0.37
0.11–1.4
1.6 ± 1.0
0.40–4.4
1.1 ± 0.39
0.68–1.8
1.3 ± 0.71
0.45–2.5
15 PAHs21 ± 6.11
1–34
16 ± 5.5
5.9–27
26 ± 9.91
3–50
23 ± 2.62
0–28
24 ± 6.41
7–34
15PAHs/PM2.5
(‰)
0.22 ± 0.08
0.11–0.38
0.17 ± 0.07
0.07–0.30
0.28 ± 0.10
0.14–0. 53
0.24 ± 0.10
0.14–0.38
0.19 ± 0.07
0.11–0.32
Table 4. Principal component analysis (PCA) results of PAHs in PM2.5 in the study area during the monitoring period.
Compounds of PAHsRingsDuring the Monitoring PeriodDaytimeNighttime
Factor 1Factor 2Factor 1Factor 2Factor 1Factor 2
Phe3−0.0280.9800.1940.962−0.0620.977
Ant30.0860.9750.1460.9670.0670.969
Flt30.3010.9400.2800.9510.3440.926
Pyr40.6150.7430.4670.8700.6270.711
BaA40.9600.2070.9130.3490.9570.218
Chr40.9570.2510.8730.4440.9620.238
BbF50.9710.1540.9370.2940.9810.161
BkF50.9770.1760.9090.2700.9620.189
BaF40.9660.1770.9500.2520.9720.134
BeP50.9790.1520.9370.2450.9790.153
BaP50.9840.1450.9730.2180.9840.137
Per50.9720.1780.9340.2040.9760.191
DBA50.9450.1350.7340.1760.9600.103
IP60.9810.1210.9560.2200.9880.083
Bghip60.9880.1050.9760.1170.9900.085
% of variance722464287323
Bold numbers: PAHs with high loadings.
Publisher’s Note: MDPI stays neutral with regard to jurisdictional claims in published maps and institutional affiliations.

