Article

Synoptic Causes and Socio-Economic Consequences of a Severe Dust Storm in the Middle East

by
Nick Middleton
1,*,
Saviz Sehat Kashani
2,
Sara Attarchi
3,
Mehdi Rahnama
2 and
Sahar Tajbakhsh Mosalman
2
1
St Anne’s College, University of Oxford, Oxford OX2 6HS, UK
2
Atmospheric Science and Meteorological Research Center (ASMERC), Tehran 1193653471, Iran
3
Department of Remote Sensing and GIS, Faculty of Geography, University of Tehran, Tehran 1193653471, Iran
*
Author to whom correspondence should be addressed.
Atmosphere 2021, 12(11), 1435; https://doi.org/10.3390/atmos12111435
Submission received: 28 September 2021 / Revised: 18 October 2021 / Accepted: 22 October 2021 / Published: 30 October 2021
(This article belongs to the Section Air Quality)

Abstract

:
Dust storms represent one of the most severe, if underrated, natural hazards in drylands. This study uses ground observational data from meteorological stations and airports (SYNOP and METARs), satellite observations (MODIS level-3 gridded atmosphere daily products and CALIPSO) and reanalysis data (ERA5) to analyze the synoptic meteorology of a severe Middle Eastern dust storm in April 2015. Details of related socio-economic impacts, gathered largely from news media reports, are also documented. This dust storm affected at least 14 countries in an area of 10 million km2. The considerable impacts were felt across eight countries in health, transport, education, construction, leisure and energy production. Hospitals in Saudi Arabia, Qatar and the UAE experienced a surge in cases of respiratory complaints and ophthalmic emergencies, as well as vehicular trauma due to an increase in motor vehicle accidents. Airports in seven countries had to delay, divert and cancel flights during the dust storm. This paper is the first attempt to catalogue such dust storm impacts on multiple socio-economic sectors in multiple countries in any part of the world. This type of transboundary study of individual dust storm events is necessary to improve our understanding of their multiple impacts and so inform policymakers working on this emerging disaster risk management issue.

1. Introduction

Dust storms are a characteristic feature of the climate of the Middle East, where major regions of wind erosion activity are located on the Tigris-Euphrates alluvial plains (eastern Syria, Iraq and the Iran–Iraq border), the deserts of the Arabian Peninsula, and southeastern Iran [1,2,3,4]. Dust storm events often transport large amounts of mineral dust over many hundreds of kilometers and have multiple Earth system impacts [5,6]. Desert dust transported by storms in the Middle East and Southwest Asia has effects on marine primary production [7], marine sediments of the Indian Ocean and adjacent seas [8] and the Indian summer monsoon [9].
Desert dust also presents a range of hazards to human society during its entrainment, transport and deposition [10] and the socio-economic impacts of dust storms can be classified as disasters according to the terminology adopted by the UN Office for disaster risk reduction (UNDRR), which defines a disaster as “a serious disruption of the functioning of a community or a society at any scale due to hazardous events interacting with conditions of exposure, vulnerability and capacity, leading to one or more of the following: human, material, economic and environmental losses and impacts” [11]. Nonetheless, dust storms are generally underrated relative to other types of natural disaster [12]. Most of the research that has been conducted into the direct and indirect impacts of desert dust on society is focused on individual sectors, including human health [13,14], solar and wind power production [15,16], the transport industry [17], the oil and gas industry [18], agriculture [19,20], water quality [21] and changes to the albedo of ice, with consequences for runoff and water availability [22]. There are few studies of how individual dust storm events impact multiple socio-economic sectors, and those dust events that have been examined in this way are entirely confined to effects in a single country [23,24,25,26,27], despite the fact that long-range transport of dust frequently crosses international boundaries [28,29,30,31,32]. The aim of this paper is to start filling this gap in the literature by analyzing a severe dust storm that occurred in early April 2015 affecting a very large area of the Middle East and Southwest Asia. Using a range of observational and reanalysis datasets, the synoptic causes of this major dust storm are evaluated prior to systematic documentation of the event’s impacts on numerous socio-economic sectors in several countries. As far as we are aware, this study represents the first attempt to catalogue such transboundary dust storm impacts on multiple socio-economic sectors in multiple countries anywhere in the world.

2. The Severe Dust Storm of Early April 2015

The dust storm studied here occurred in the An Nafud Desert in northern Saudi Arabia on 1 April 2015 and transported material initially eastward, affecting southern Iraq, Kuwait and southwestern Iran on the same day, and progressively south-eastward to affect Bahrain, Qatar, United Arab Emirates and the lower Persian Gulf on 2 April, Oman and Yemen on 3 April, crossed the Red Sea to affect Eritrea, Djibouti and Somaliland on 4 April and crossed the Arabian Sea to reach the west coast of India by 6 April [33]. From the source area in northern parts of the Arabian Peninsula to the coast of India, and from southern Iran to the Red Sea coast of Africa, this severe dust storm affected at least 14 countries in an area roughly 4000 km × 2500 km, or 10 million km2.
A number of studies have focused on various aspects of this severe dust storm, including synoptic analyses and modelling simulations [34,35], impacts on aerosol optical properties and the radiation budget [36], radioactivity associated with the event [37] and the long-range transport of mineral dust to India [38,39]. The impacts of this dust storm on air quality and health in Qatar were the subject of studies [40,41,42], but no other socio-economic impacts have been the focus of specific investigation, to our knowledge, in any of the 14 countries affected.

3. Data and Methods

3.1. Observed Meteorological Data

Observational data from synoptic meteorological stations (SYNOP reports) and airports (meteorological aerodrome reports, or METARs) were used to establish the occurrence of atmospheric dust, visibility and wind speed. Visibility data related to the presence of hydrometeors such as fog and mist are separated by considering relative humidity (RH) greater than 75% and present weather as filters. The present weather codes used at meteorological stations that reflect dust-related phenomena are shown in Appendix A.

3.2. Moderate Resolution Imaging Spectroradiometer (MODIS) Aerosol Data

Data on atmospheric aerosols were taken from the level-3 atmosphere daily global product (MOD08_D3), which contains daily grid average values (1 degree equal-angle latitude-longitude grid) of parameters related to atmospheric aerosol particle properties. These parameters are derived from the four level-2 MODIS atmosphere products MOD04_L2, MOD05_L2, MOD06_L2, and MOD07_L2. In this study, the Deep Blue (DB) retrieved Aerosol Optical Depth (AOD) data were used. The DB algorithm, when applied to MODIS inputs, retrieves AOD at 550 nm from land scenes that are free of clouds and snow/ice.

3.3. ERA5 Global Reanalysis Dataset

In order to analyze the weather conditions and other parameters related to the dust episode, the ERA5 reanalysis dataset was used. ERA5 is the fifth generation of the European Centre for Medium-Range Weather Forecasts (ECMWF) atmospheric reanalyzes of the global climate and available at http://apps.ecmwf.int/datasets (accessed on 10 December 2019). ERA5 provides hourly estimates of a large number of atmospheric, land and oceanic climate variables and is based on the Integrated Forecasting System (IFS) Cy41r2. It has a 31-km horizontal resolution and 137 vertical levels, from the surface of the Earth to 0.01 hPa, or about 80 km. The IFS is coupled to a soil model, the parameters of which are also designated as surface parameters [43].

3.4. CALIPSO

The Cloud-Aerosol Lidar and Infrared Pathfinder Satellite Observation (CALIPSO) satellite provides data about the vertical structure of aerosol distribution. This is of great importance especially in places where no ground station data are available [44]. The instrument transmits polarized light and measures the return signal. The presence and shape of aerosols determine the amount of depolarization ratio and attenuated backscattering signals. This dust storm event was observed and tracked by three CALIPSO products: aerosol sub-type, depolarization ratio and attenuated backscattering signals.

3.5. Media Reports

Details of socio-economic impacts related to the dust storm were gathered from media reports. The news media consulted were: al Jazeera, Arab News, Doha News, Gulf News, Gulf Times, Khaleej Times, Saudi Gazette, Times of India, The Indian Express, Pakistan Today, Reuters, www.bbc.co.uk (accessed on 10 April 2021), www.daijiworld.com (accessed on 19 March 2021), www.emirates247.com (accessed on 20 March 2021), www.marhaba.qa (accessed on 19 March 2021), www.irna.ir (accessed on 22 March 2021), www.thenationalnews.com/uae (accessed on 9 April 2021) and www.thepeninsulaqatar.com (accessed on 9 April 2021).

4. Synoptic Analysis

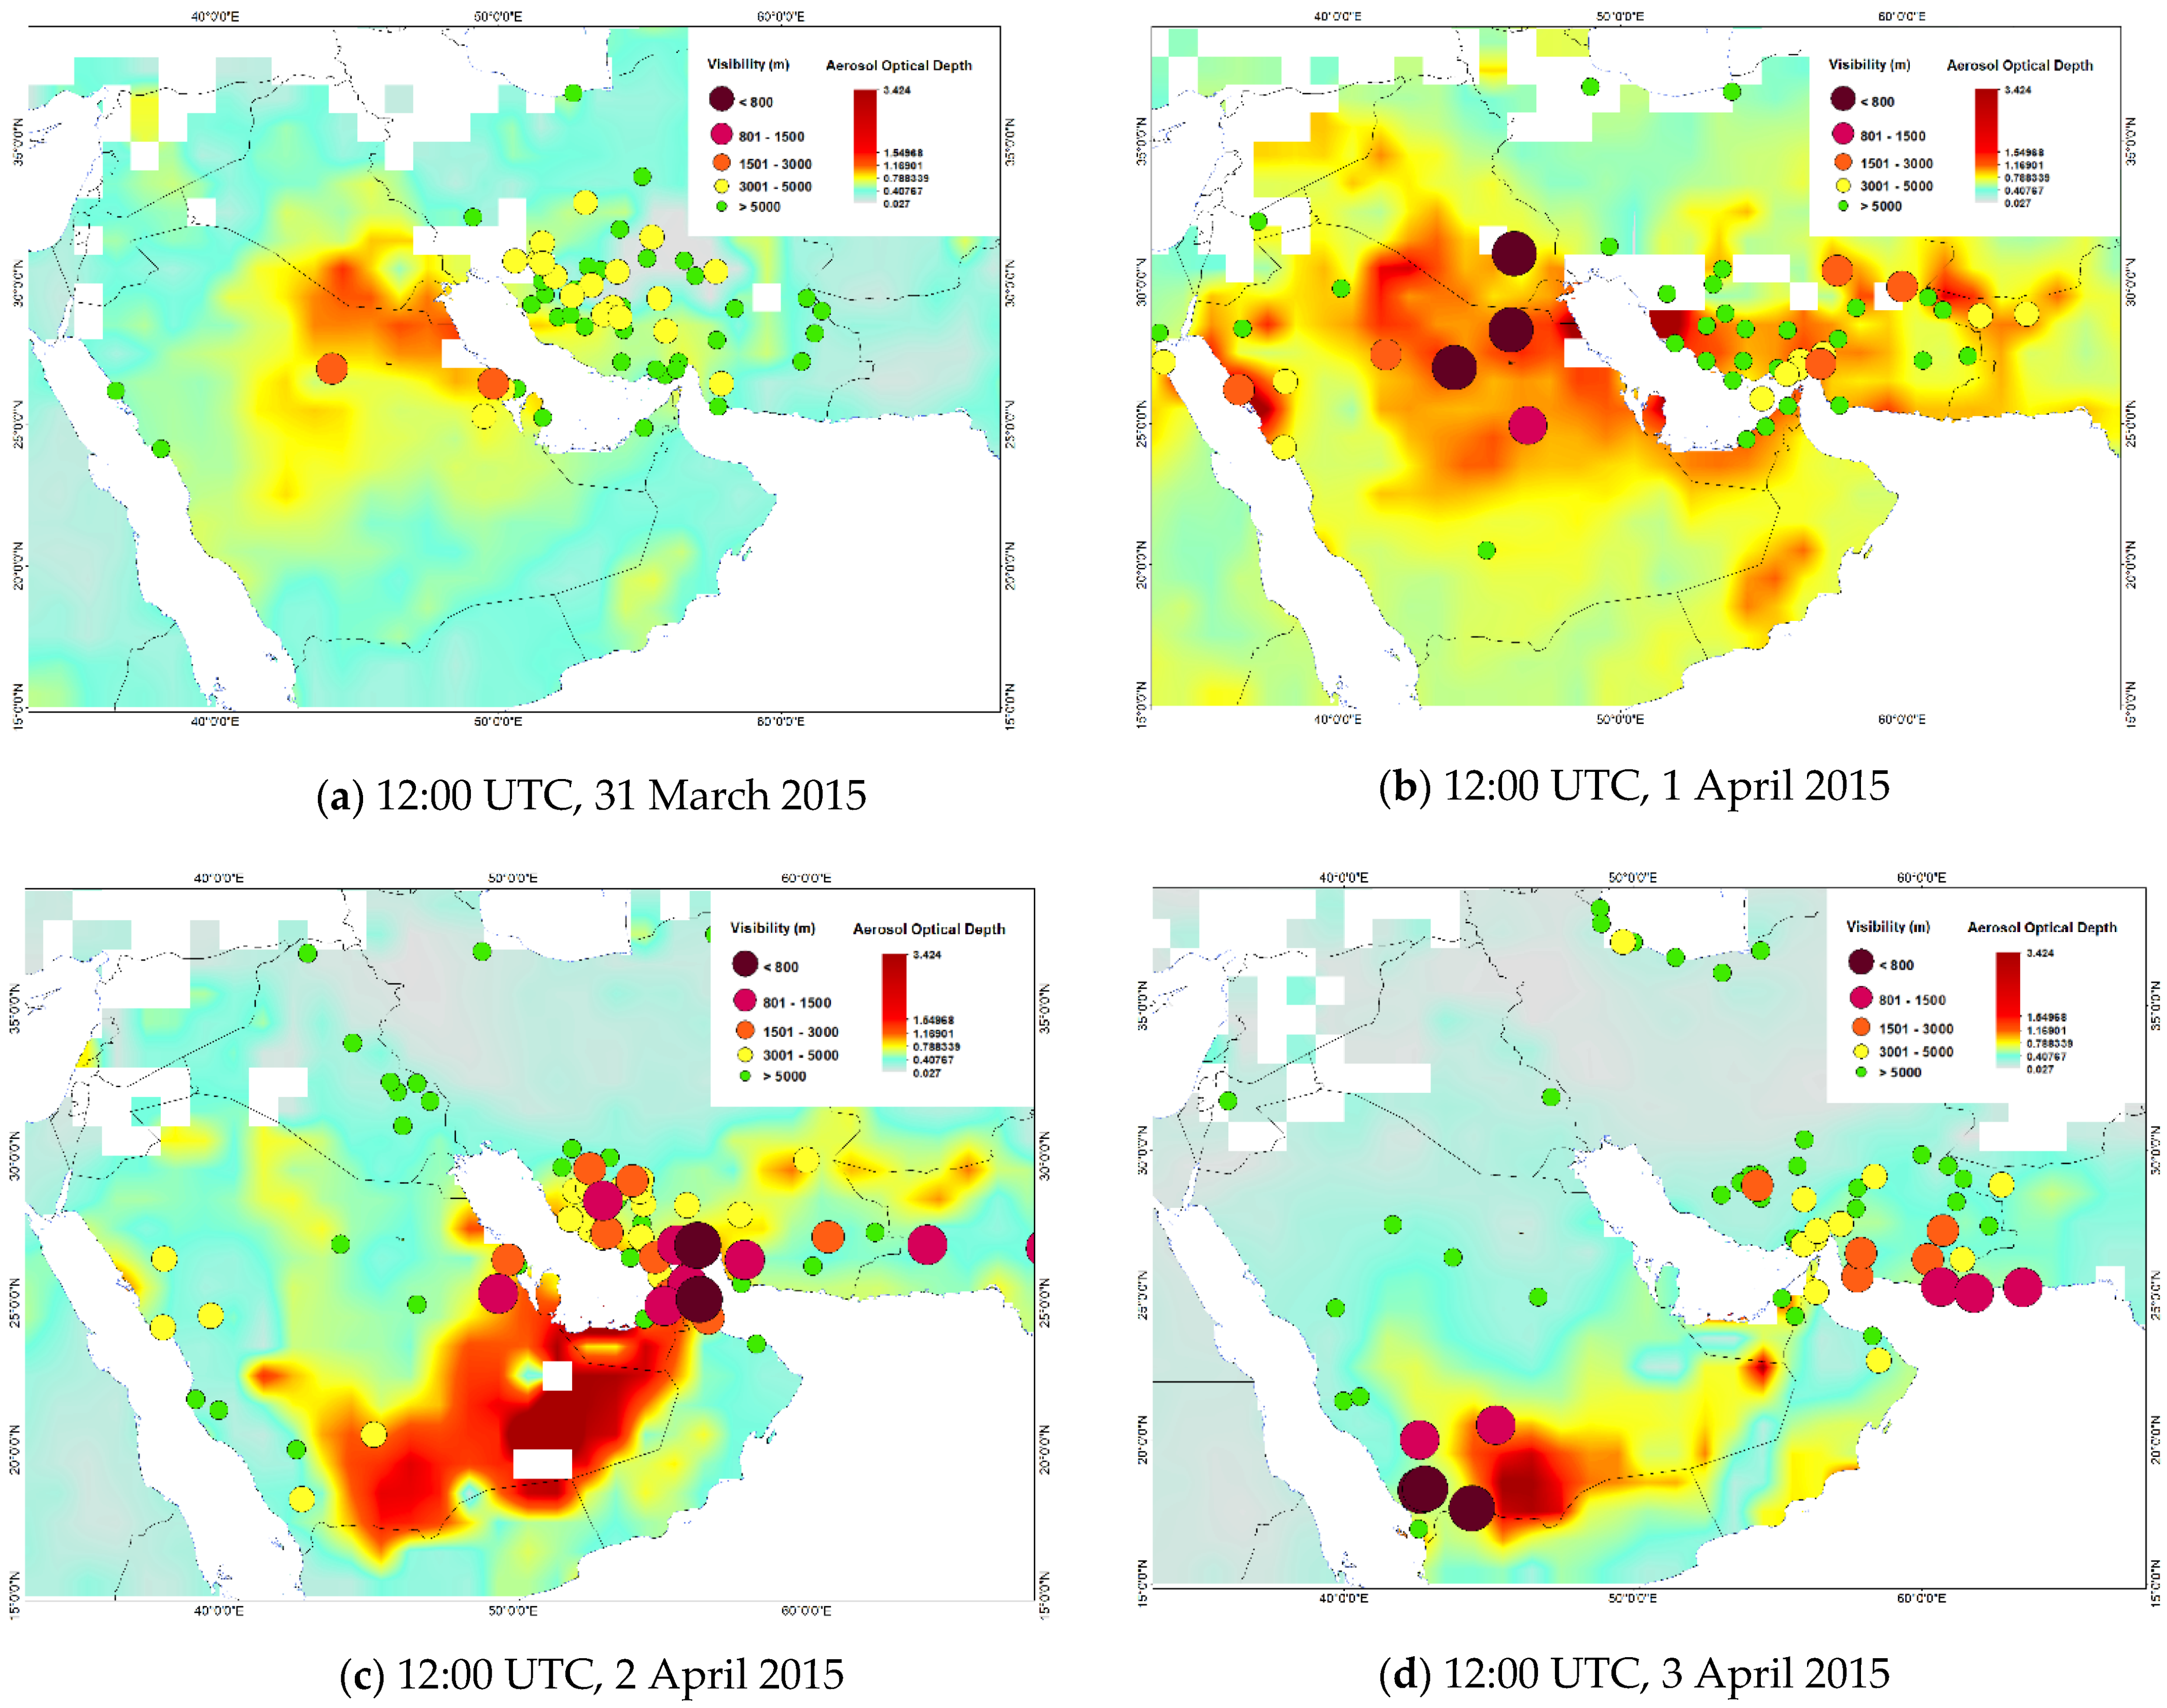
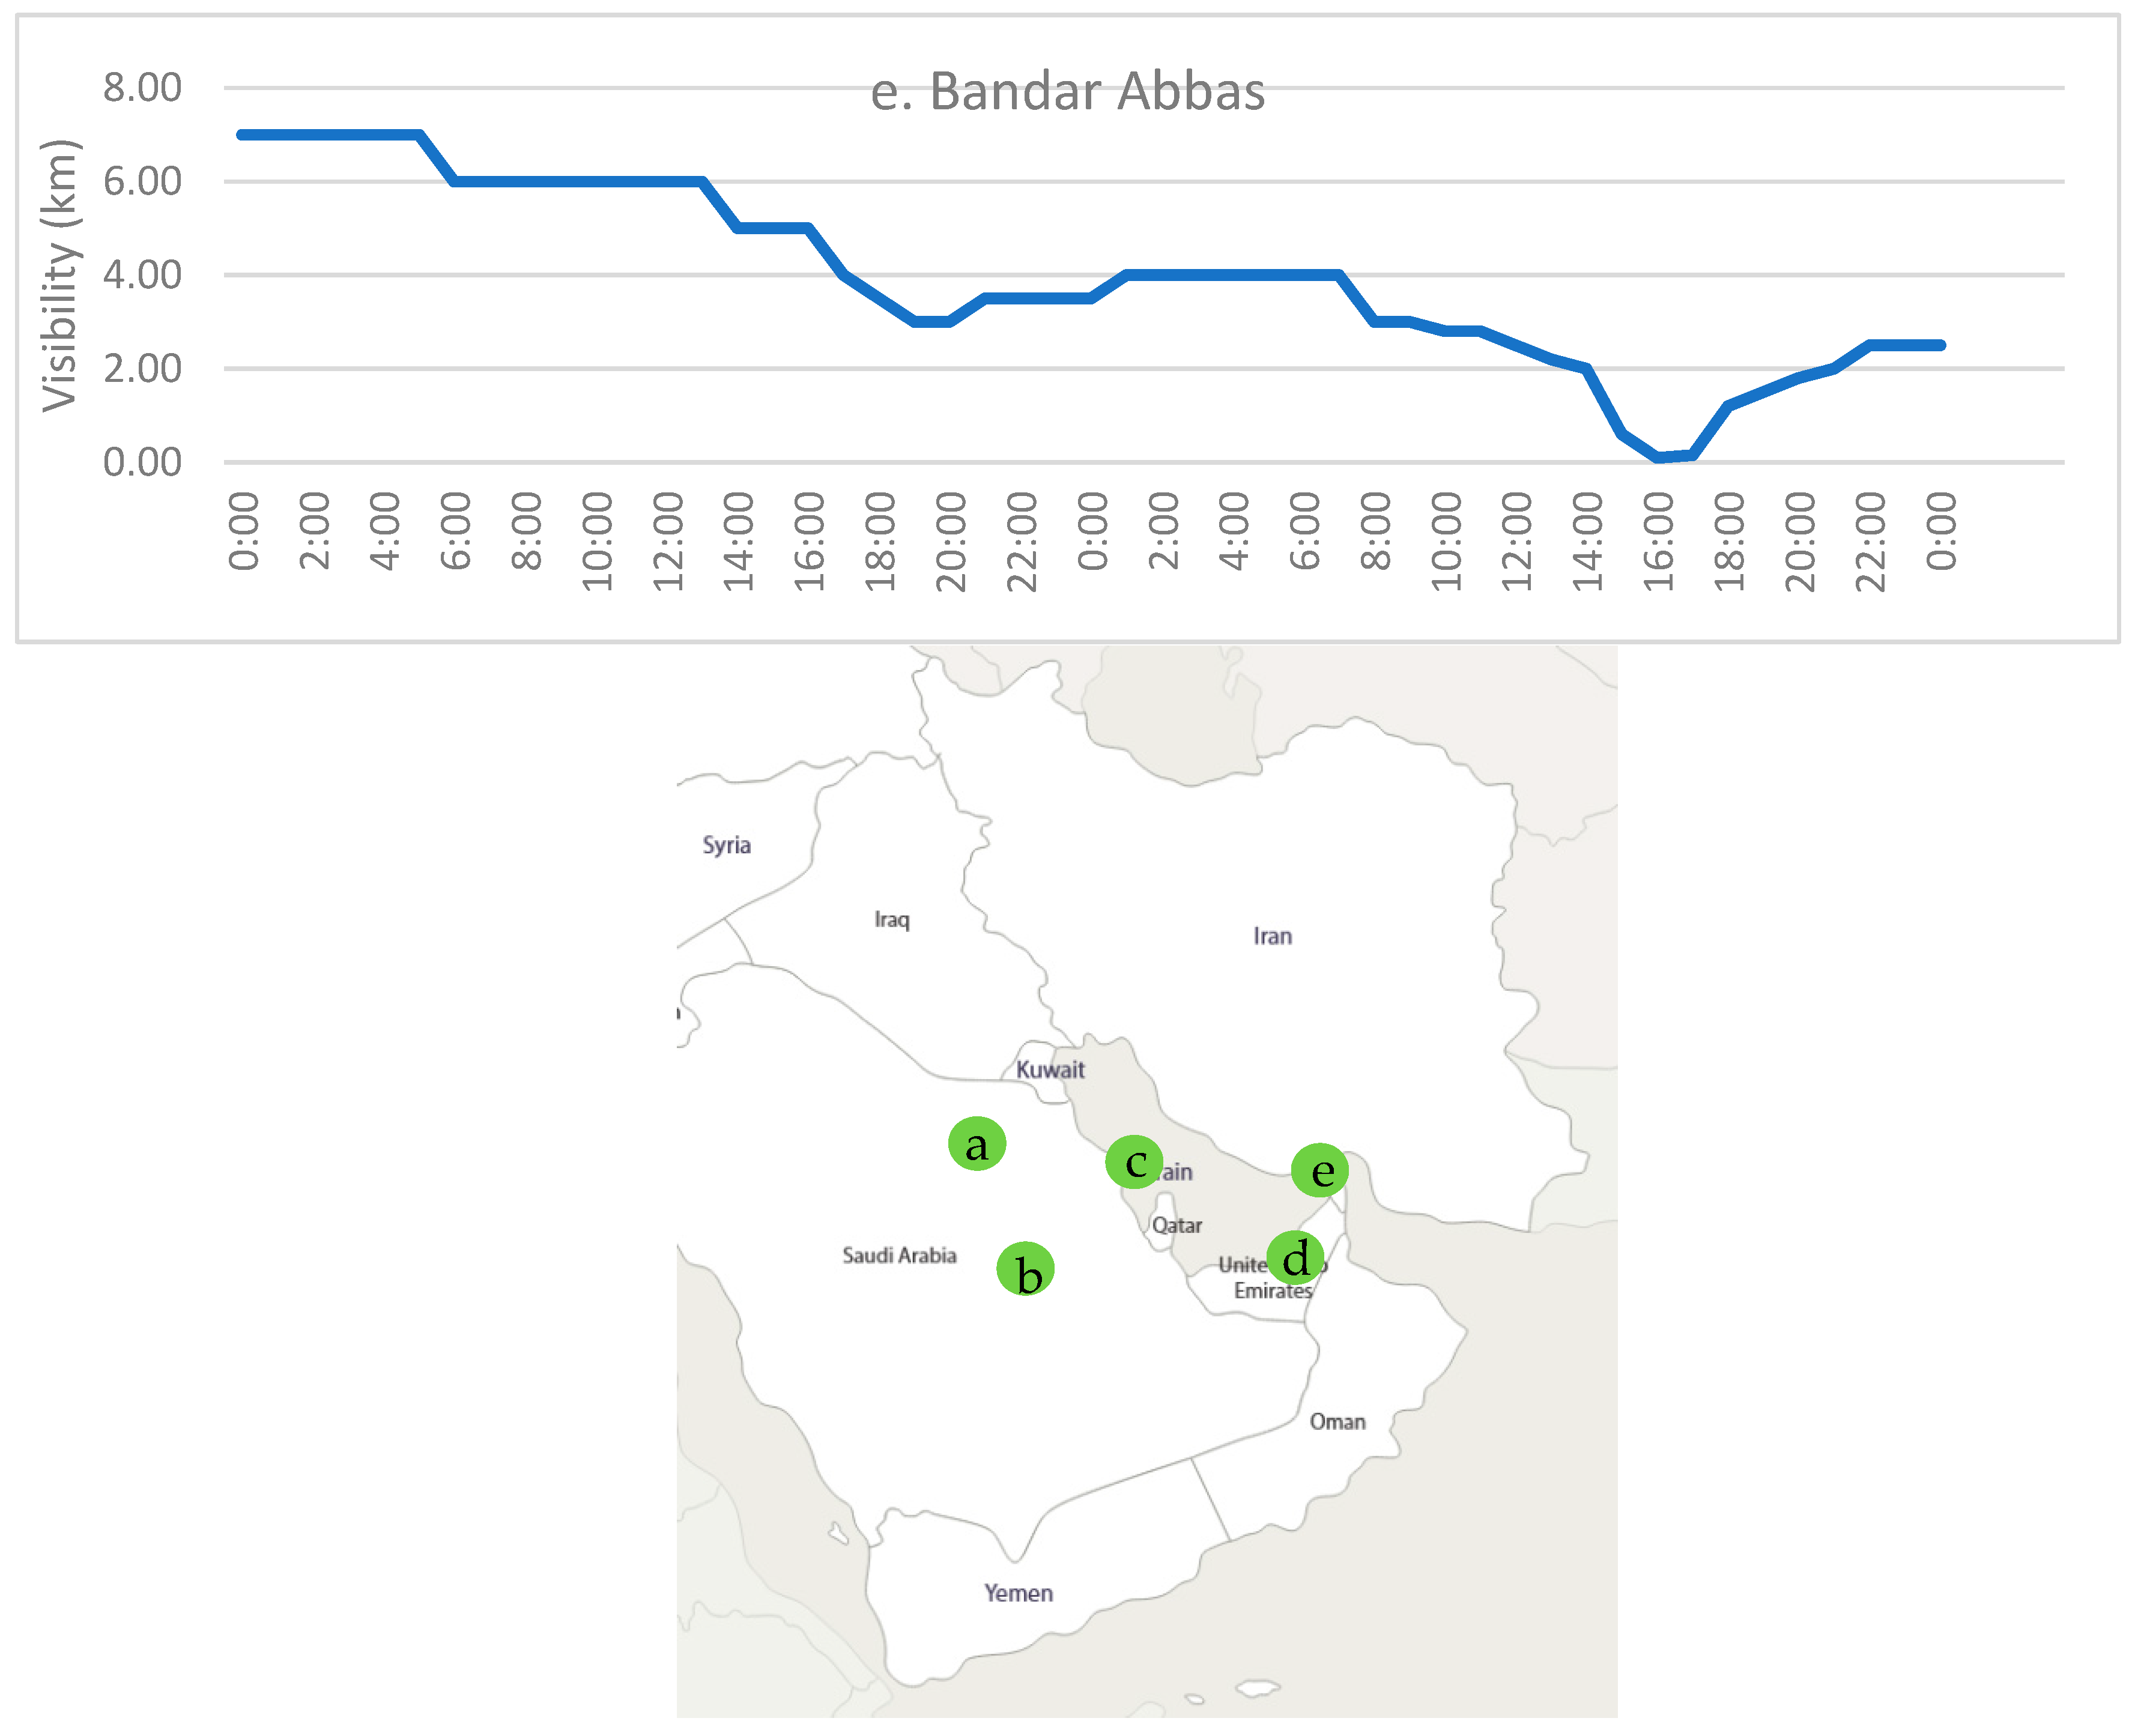
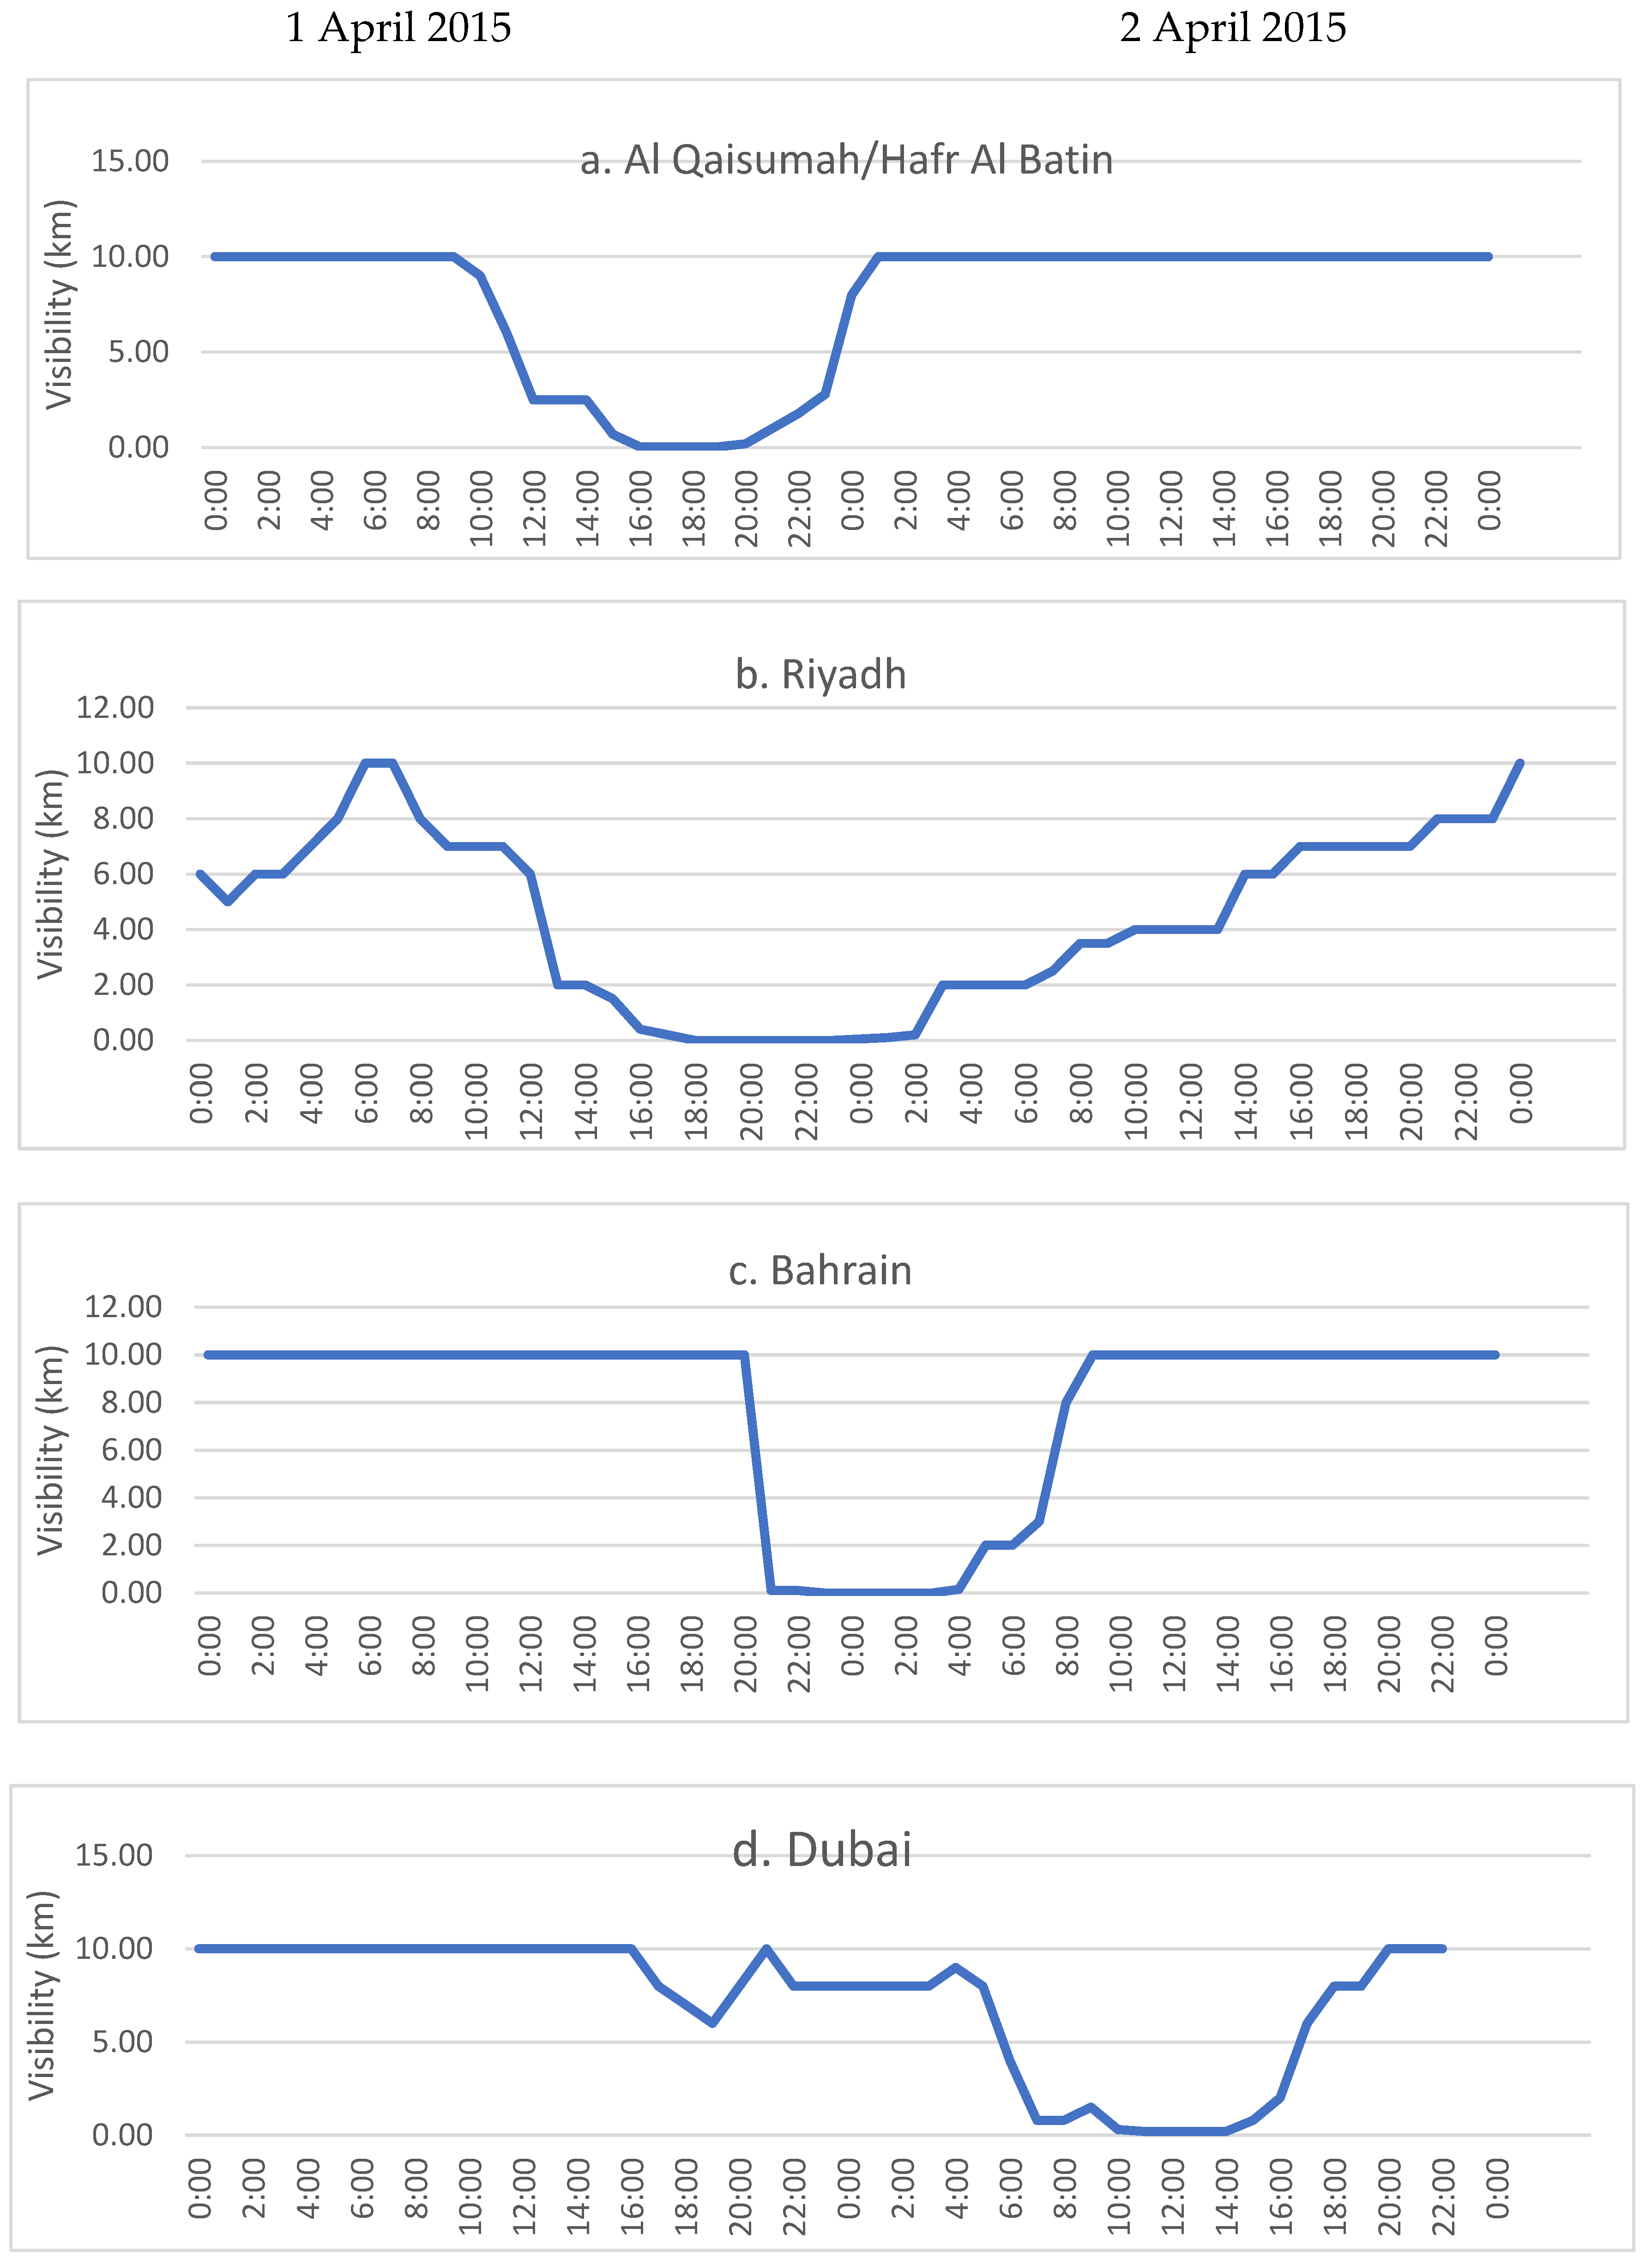
4.1. Analysis of SYNOP Stations and Satellite Remote Sensing of the Dust Event

Visibility data recorded at synoptic meteorological stations is used with MODIS DB AOD land images to track the dust storm and the transport of dust across the Arabian Peninsula and beyond between 31 March and 3 April, as shown in Figure 1. Large-scale dust-raising began on 1 April between 06:00 UTC (at which time reporting stations in northern Saudi Arabia recorded visibilities >3000 m) and 09:00 UTC (when Gassim reported a visibility of <800 m and three other stations reported visibilities of <1500 m). By 12:00 UTC, visibility had deteriorated to <800 m at Al-Dawadami and Al-Qaisumah in Saudi Arabia and Nasiriya in Iraq. At 12:00 UTC on 2 April, visibilities <800 m were reported at the southern end of the Persian Gulf (in the UAE and southeastern Iran). By 12:00 UTC on 3 April, visibilities <800 m were reported at stations in Yemen and southwestern Saudi Arabia and visibilities <1500 m were also reported on the Makran coast of Iran and Pakistan.

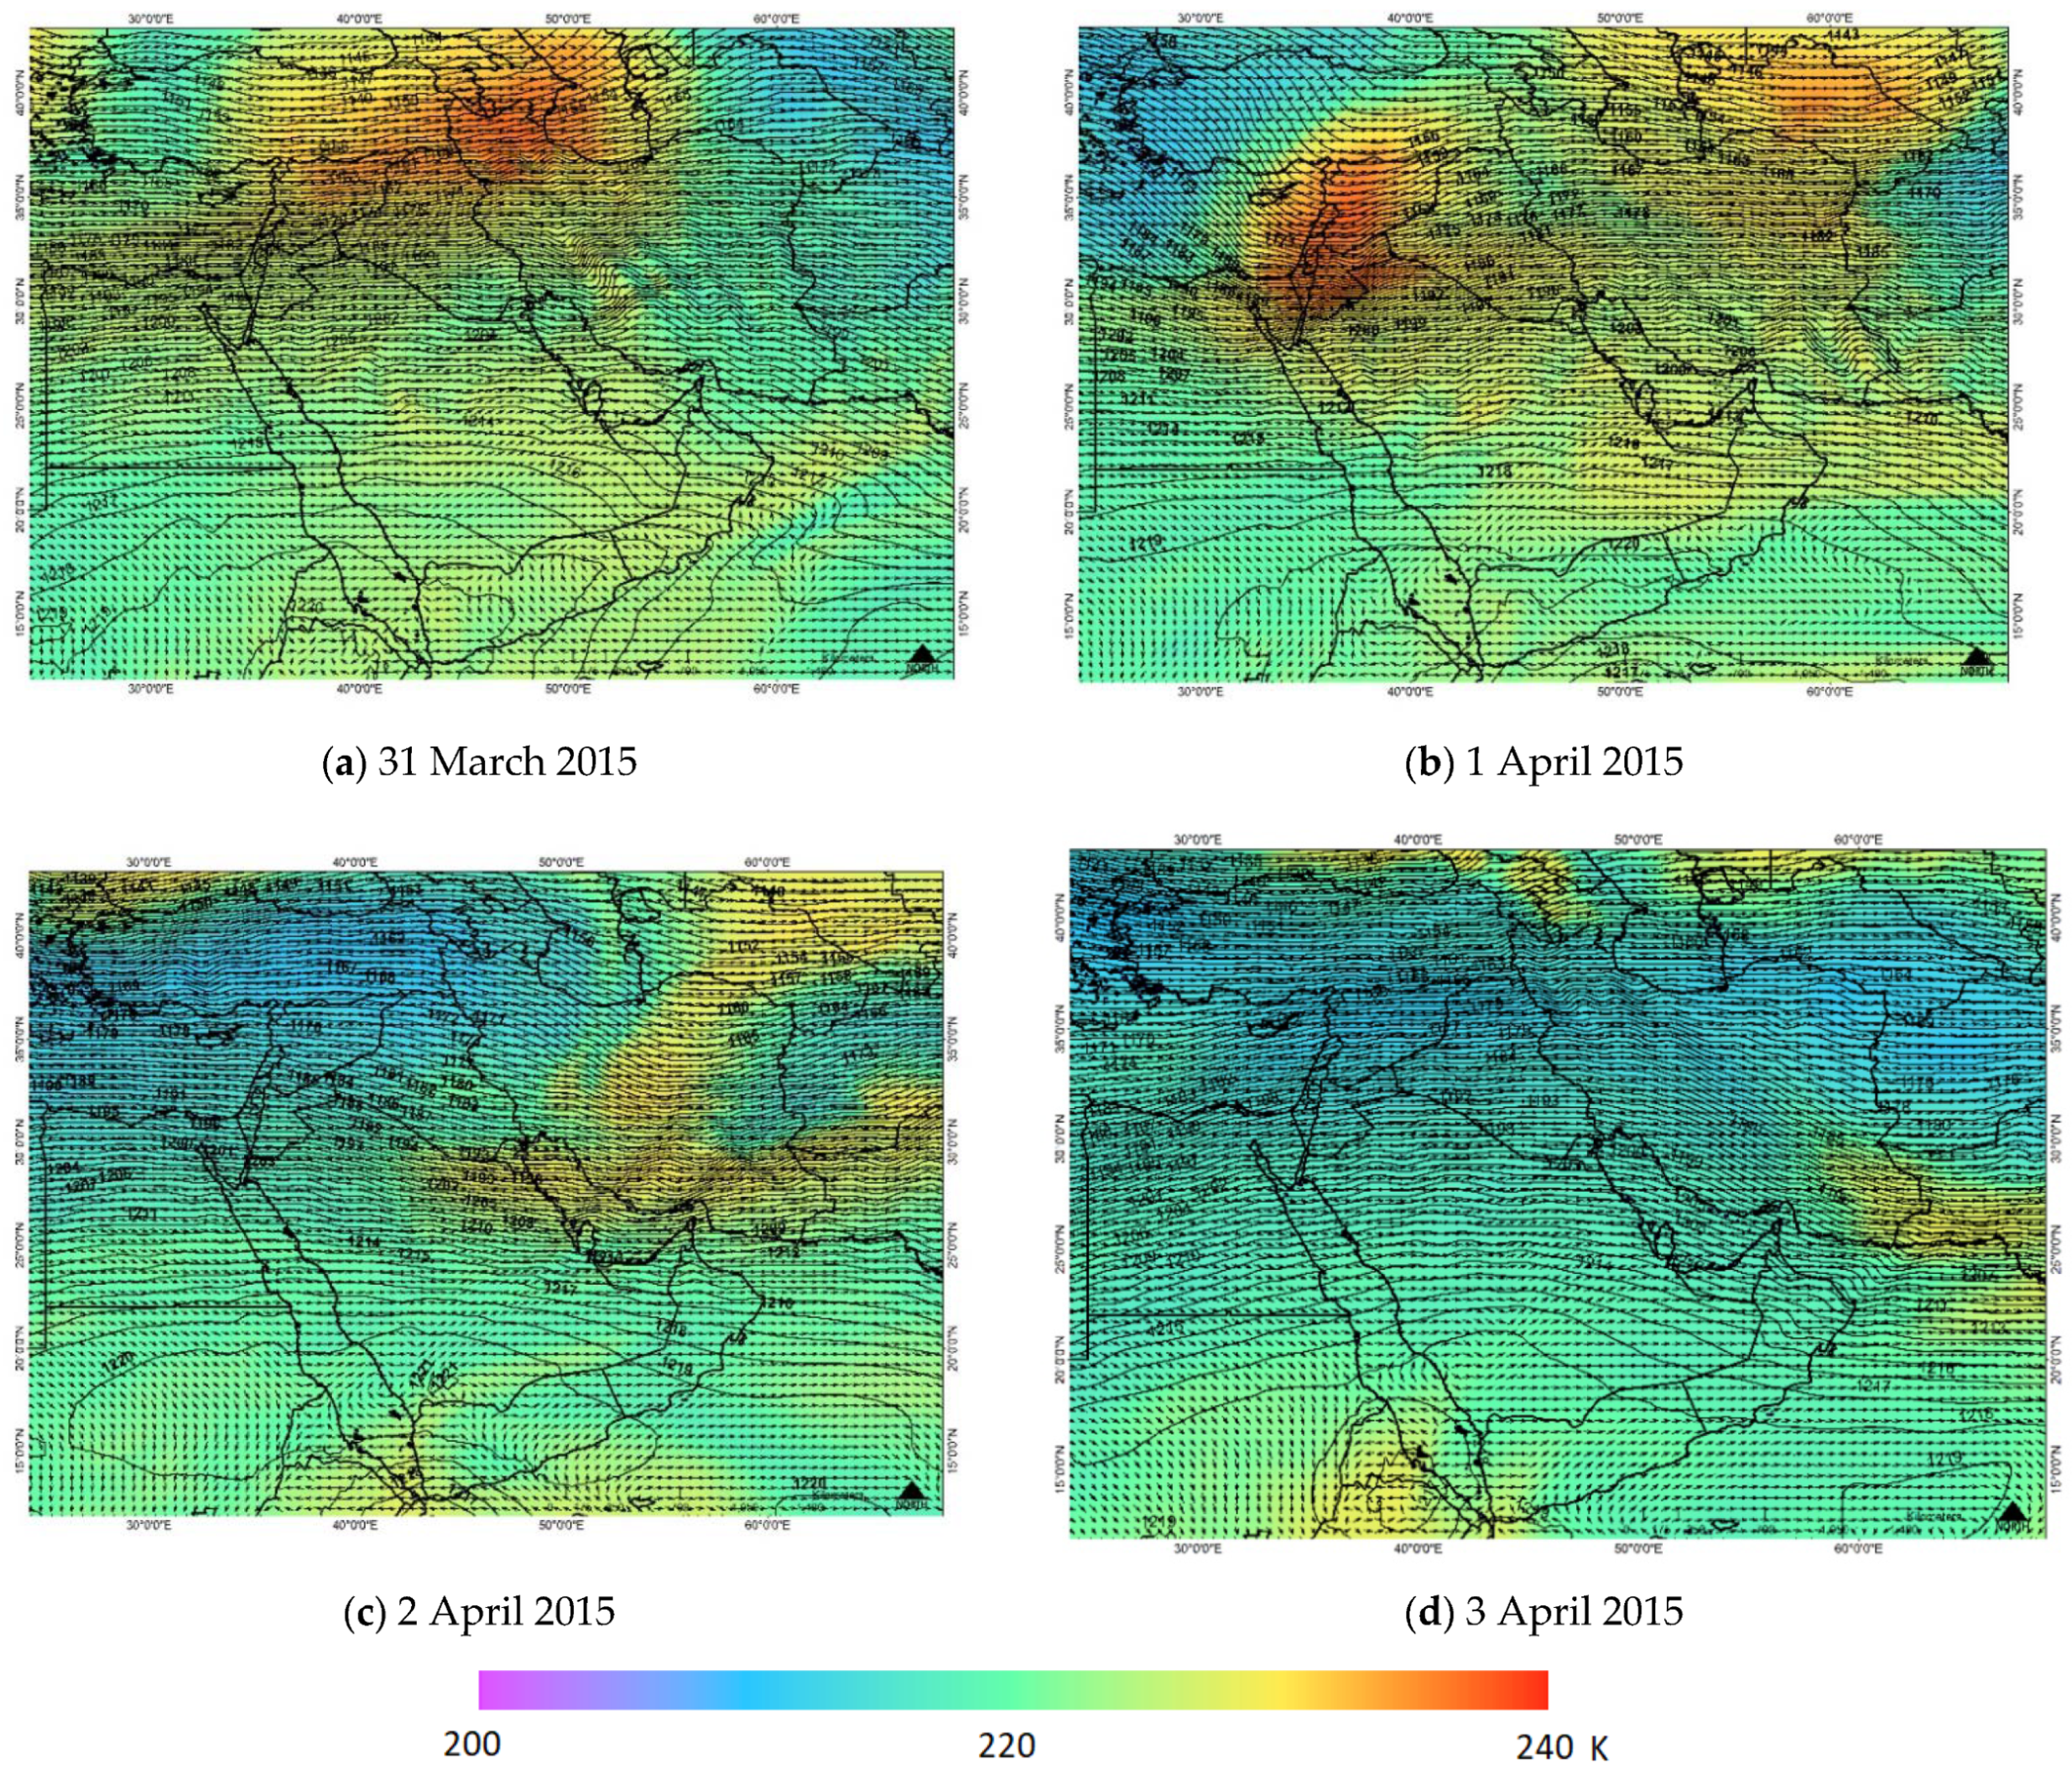
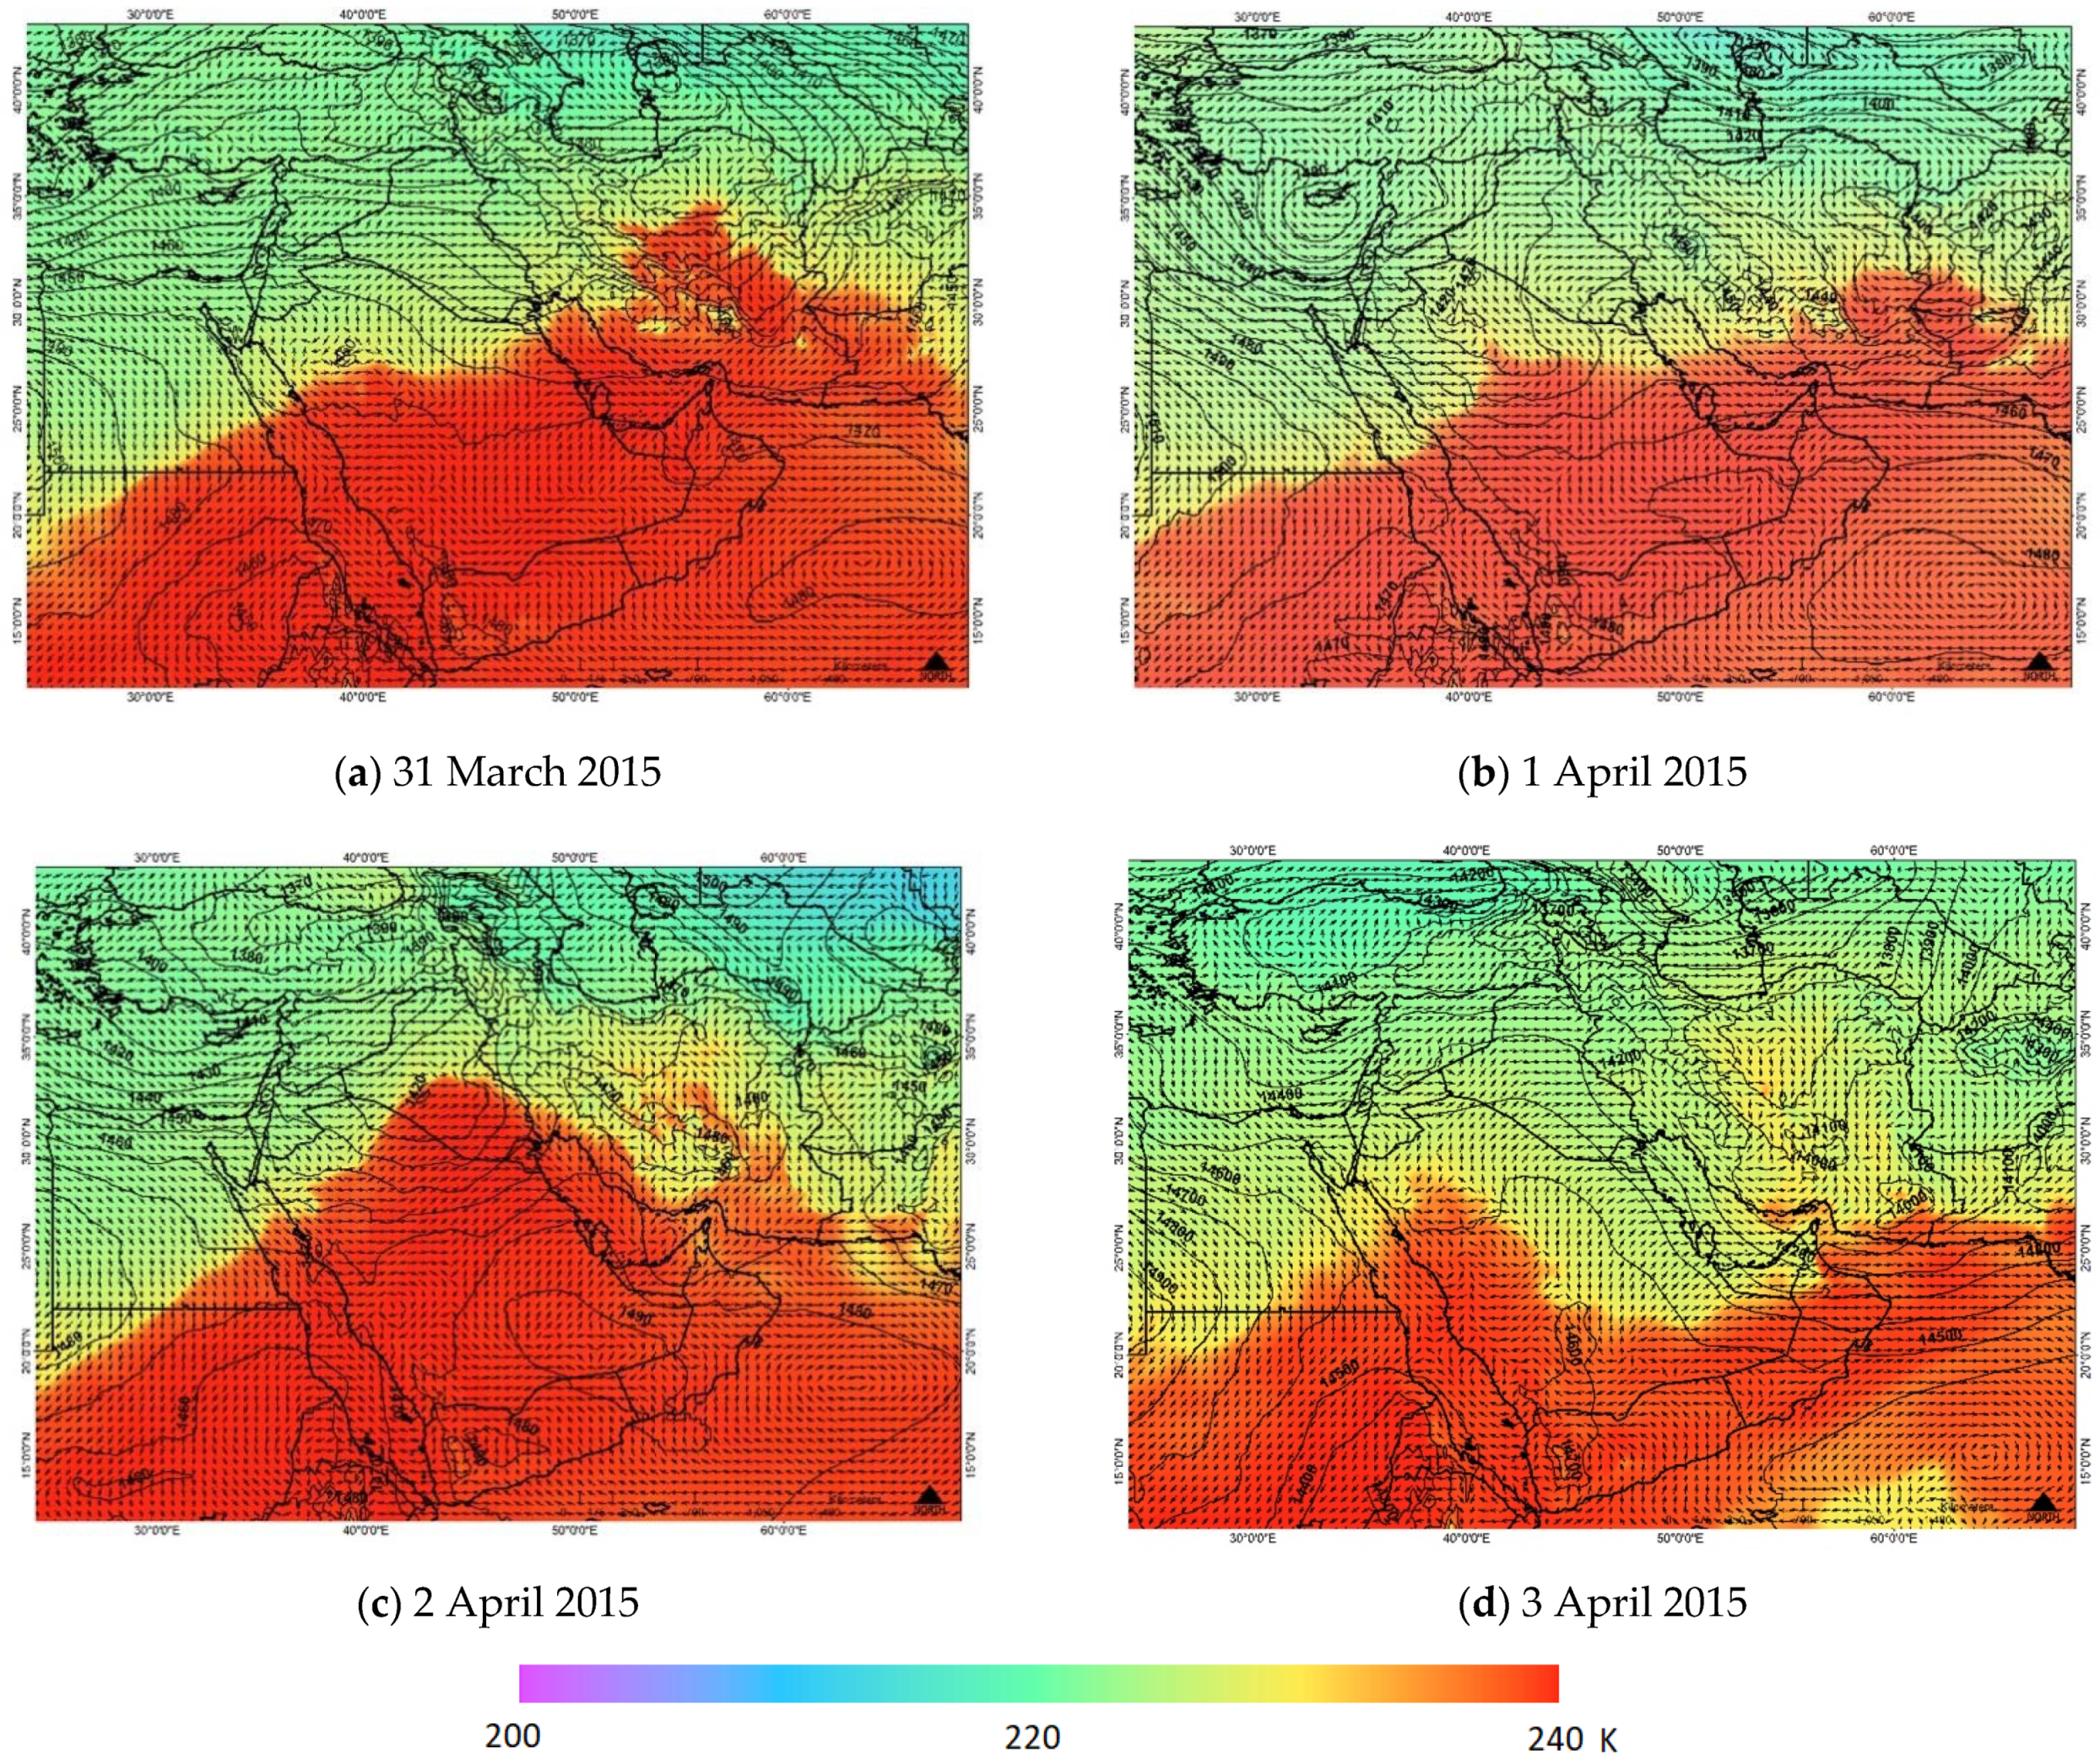
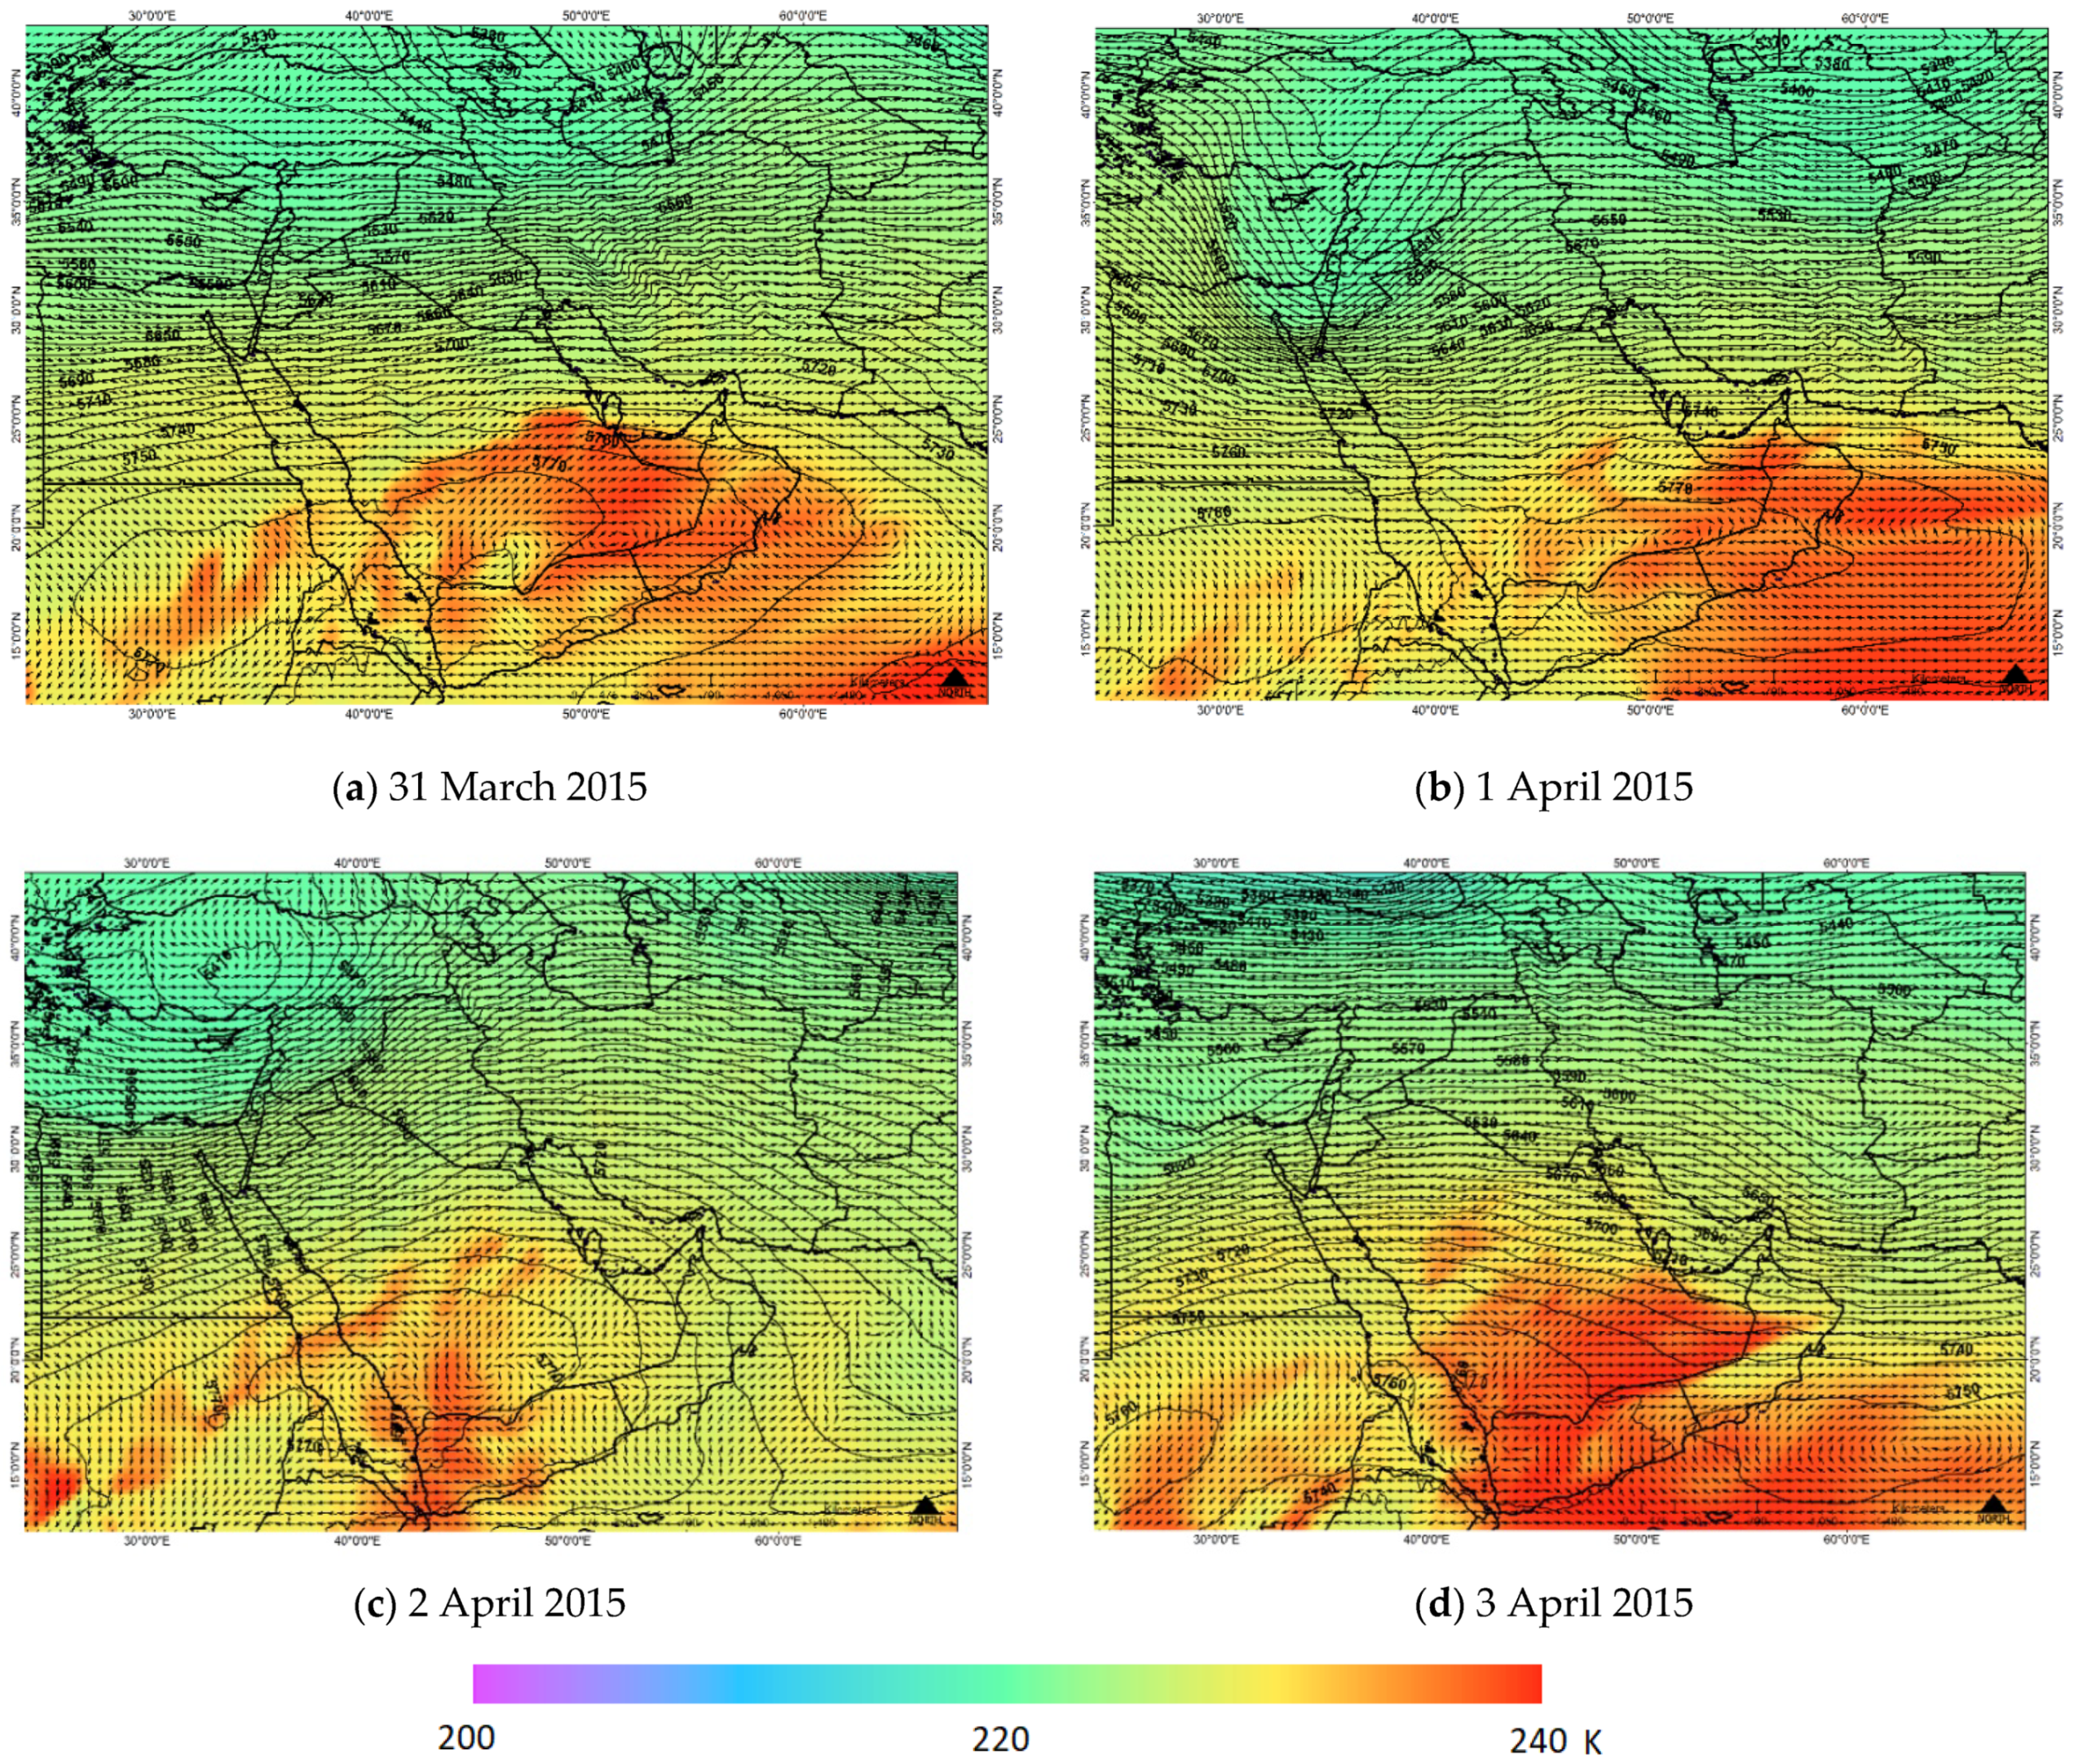
4.2. Synoptic Analysis of the Dust Storm

The synoptic conditions associated with the evolution of the dust storm were reviewed using ERA5 reanalysis data. The meteorological dust genesis mechanism was analyzed using the geopotential height, wind vectors and air temperature fields at 850 hPa, as shown in Figure 2. A cold front passed over the Arabian Peninsula with south-westerly winds leading the frontal passage in the eastern coastal area (Figure 2b). On 2 April (Figure 2c), a low-geopotential height center was visible in southeast Iran, with temperatures of more than 297 K, extending as a trough across the Persian Gulf to Saudi Arabia. The presence of a core of high geopotential height over Saudi Arabia created a strong geopotential gradient along the Persian Gulf and strong winds from southern Iraq and northern Saudi Arabia down the Persian Gulf. These winds, generated behind a low-pressure system as it moved across the dust source region in northern Saudi Arabia, represent a typical post-frontal dust storm, the like of which is common in northern areas of the Arabian Peninsula during winter and spring months [45,46].
The mid-tropospheric situation, shown in Figure 3, indicates the eastward movement of a trough from the eastern Mediterranean to the southern part of the Persian Gulf between 31 March and 3 April. The aggregation of geopotential height contours over the Persian Gulf, southern Iraq, northeastern Saudi Arabia and southeastern Iran indicates the formation of a pressure gradient in these areas leading to an increase in wind speed, especially on 1 and 2 April.
Zonal winds in the upper troposphere (200 hPa) and temperature from 31 March to 3 April are shown in Figure 4. Ahead of the front, the subtropical jet stream, with core wind speeds of >70 m/s, is clearly seen on 31 March stretching from northern Egypt to western Iran. On 1 April, the polar jet stream, behind the front, becomes visible over Greece and Turkey with a core wind speed >40 m/s, and these two jets converge into a single jet stream on 2 April and begin to dissipate the following day. This jet stream convergence translates momentum towards the surface, with a powerful effect on near-surface winds, leading to widespread dust-raising on 1 April. Over the following days, the suspended dust moves in a generally southeastward direction following the surface wind pattern.

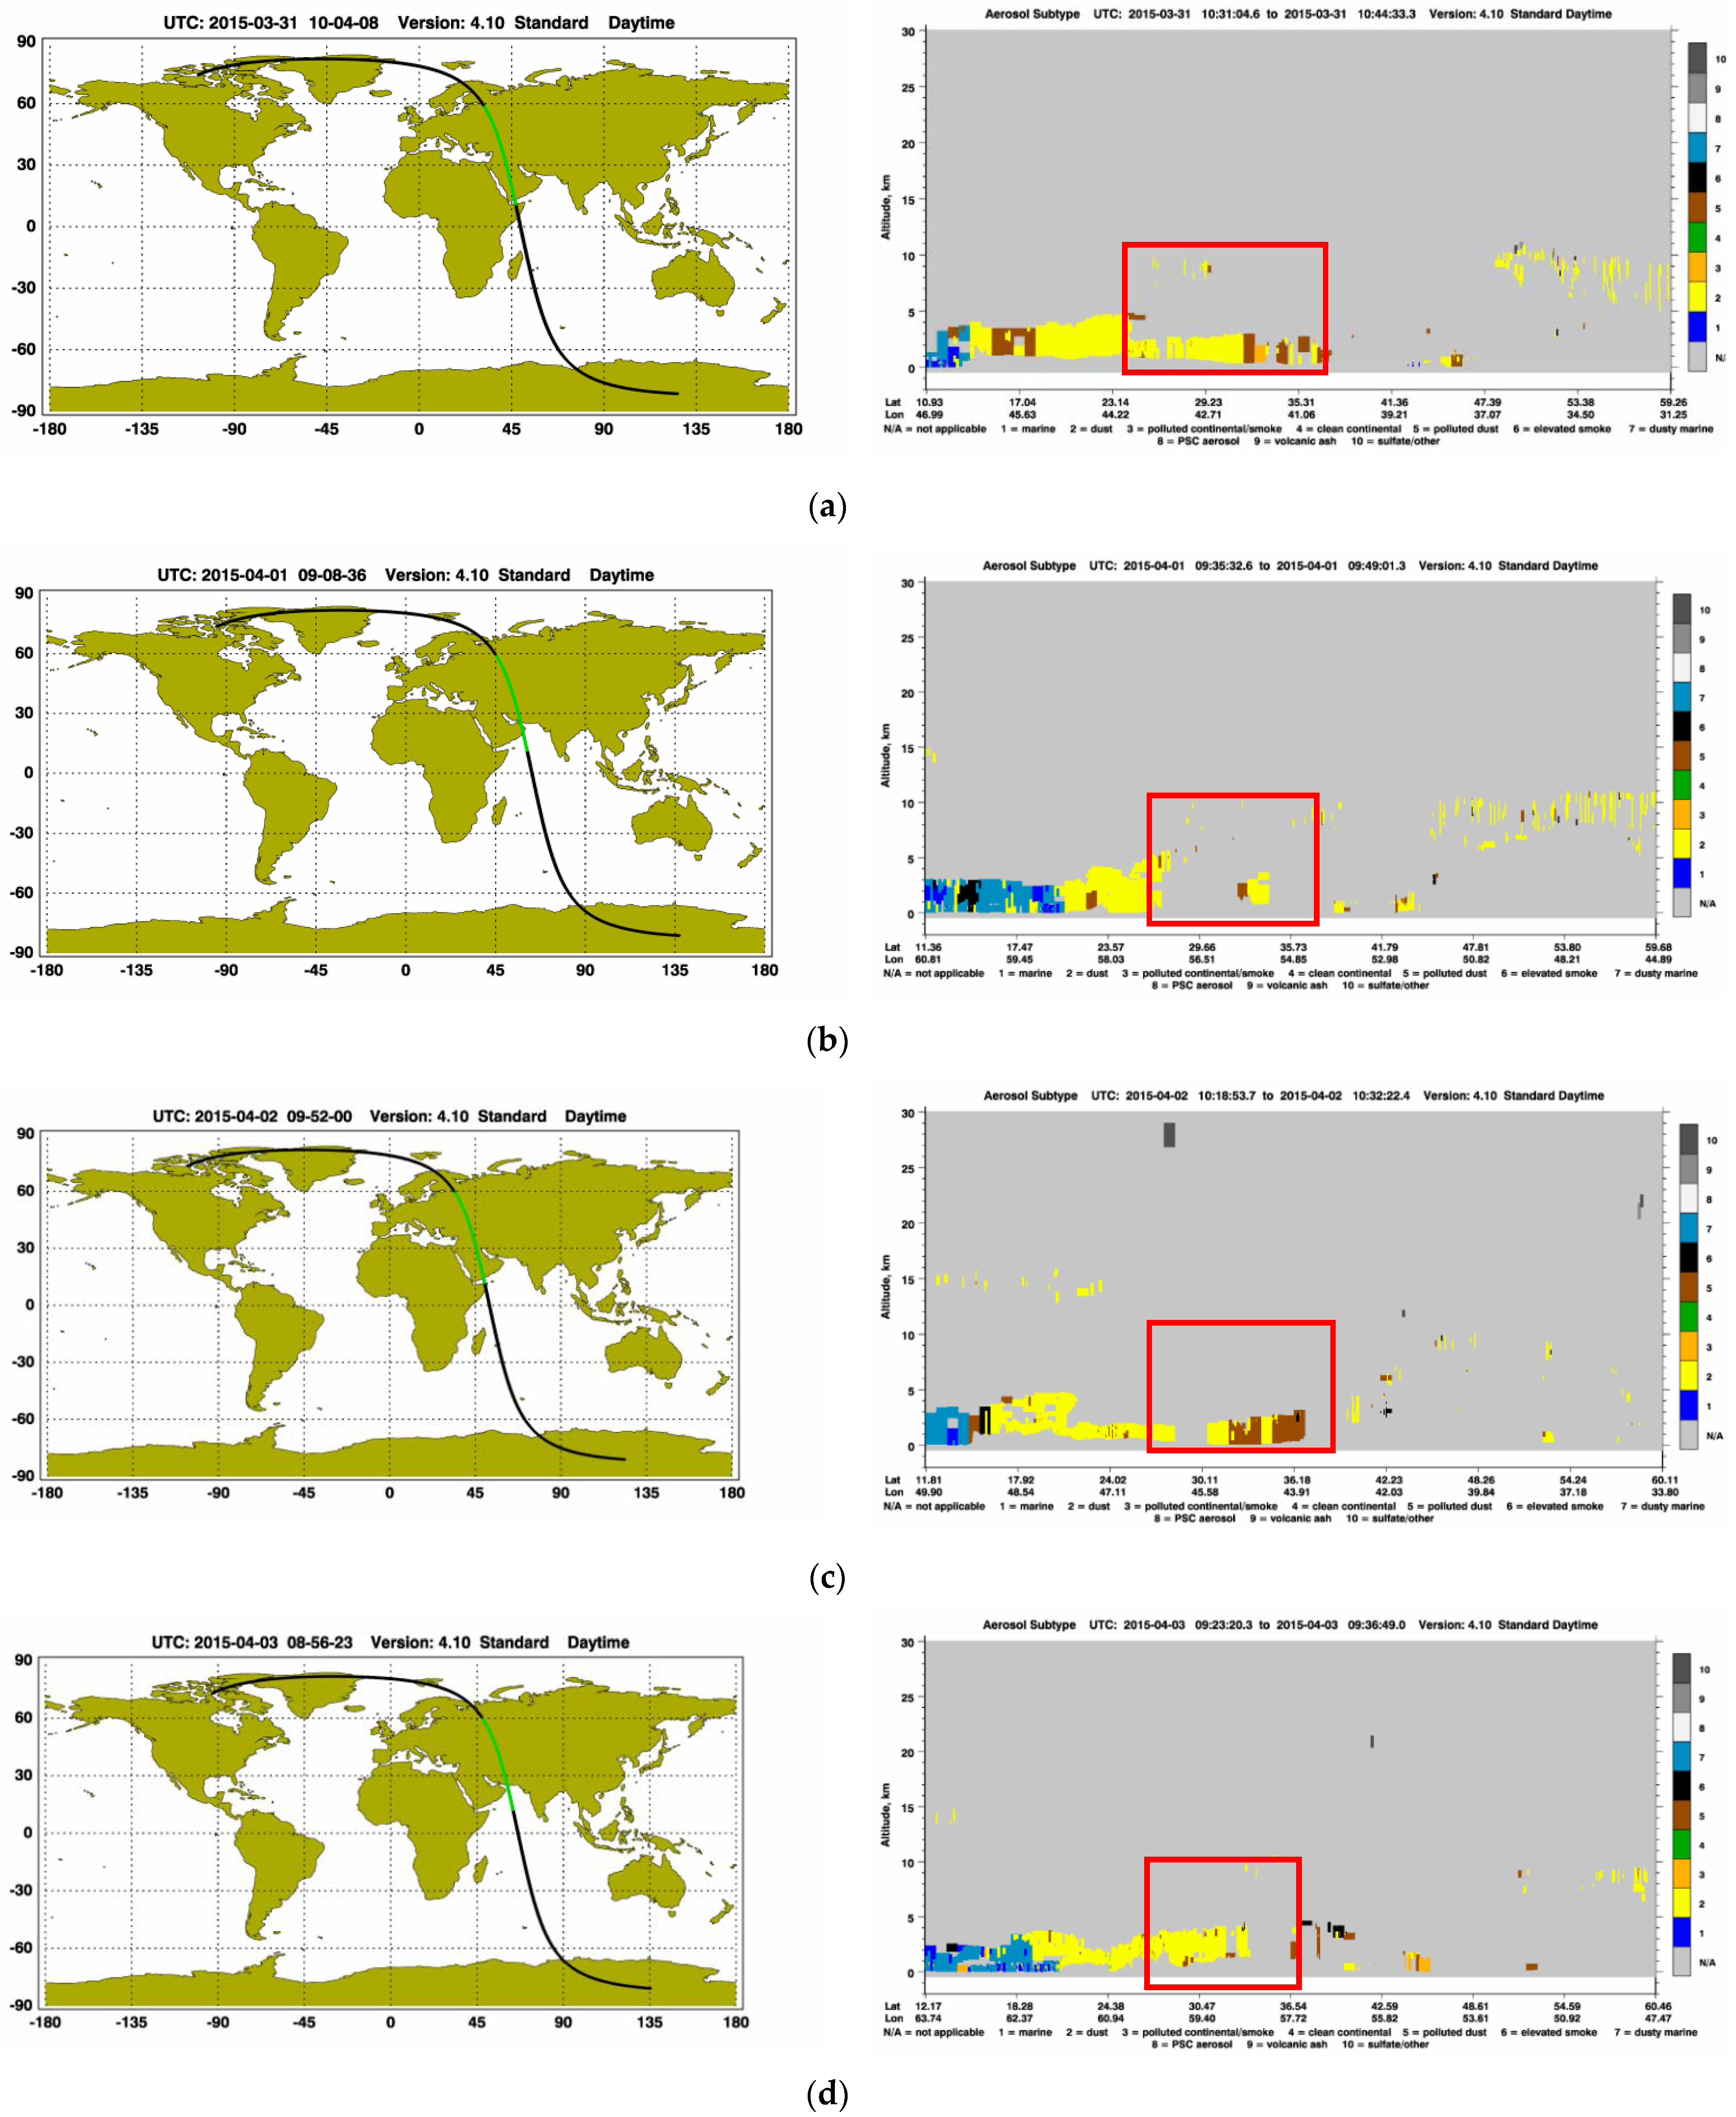
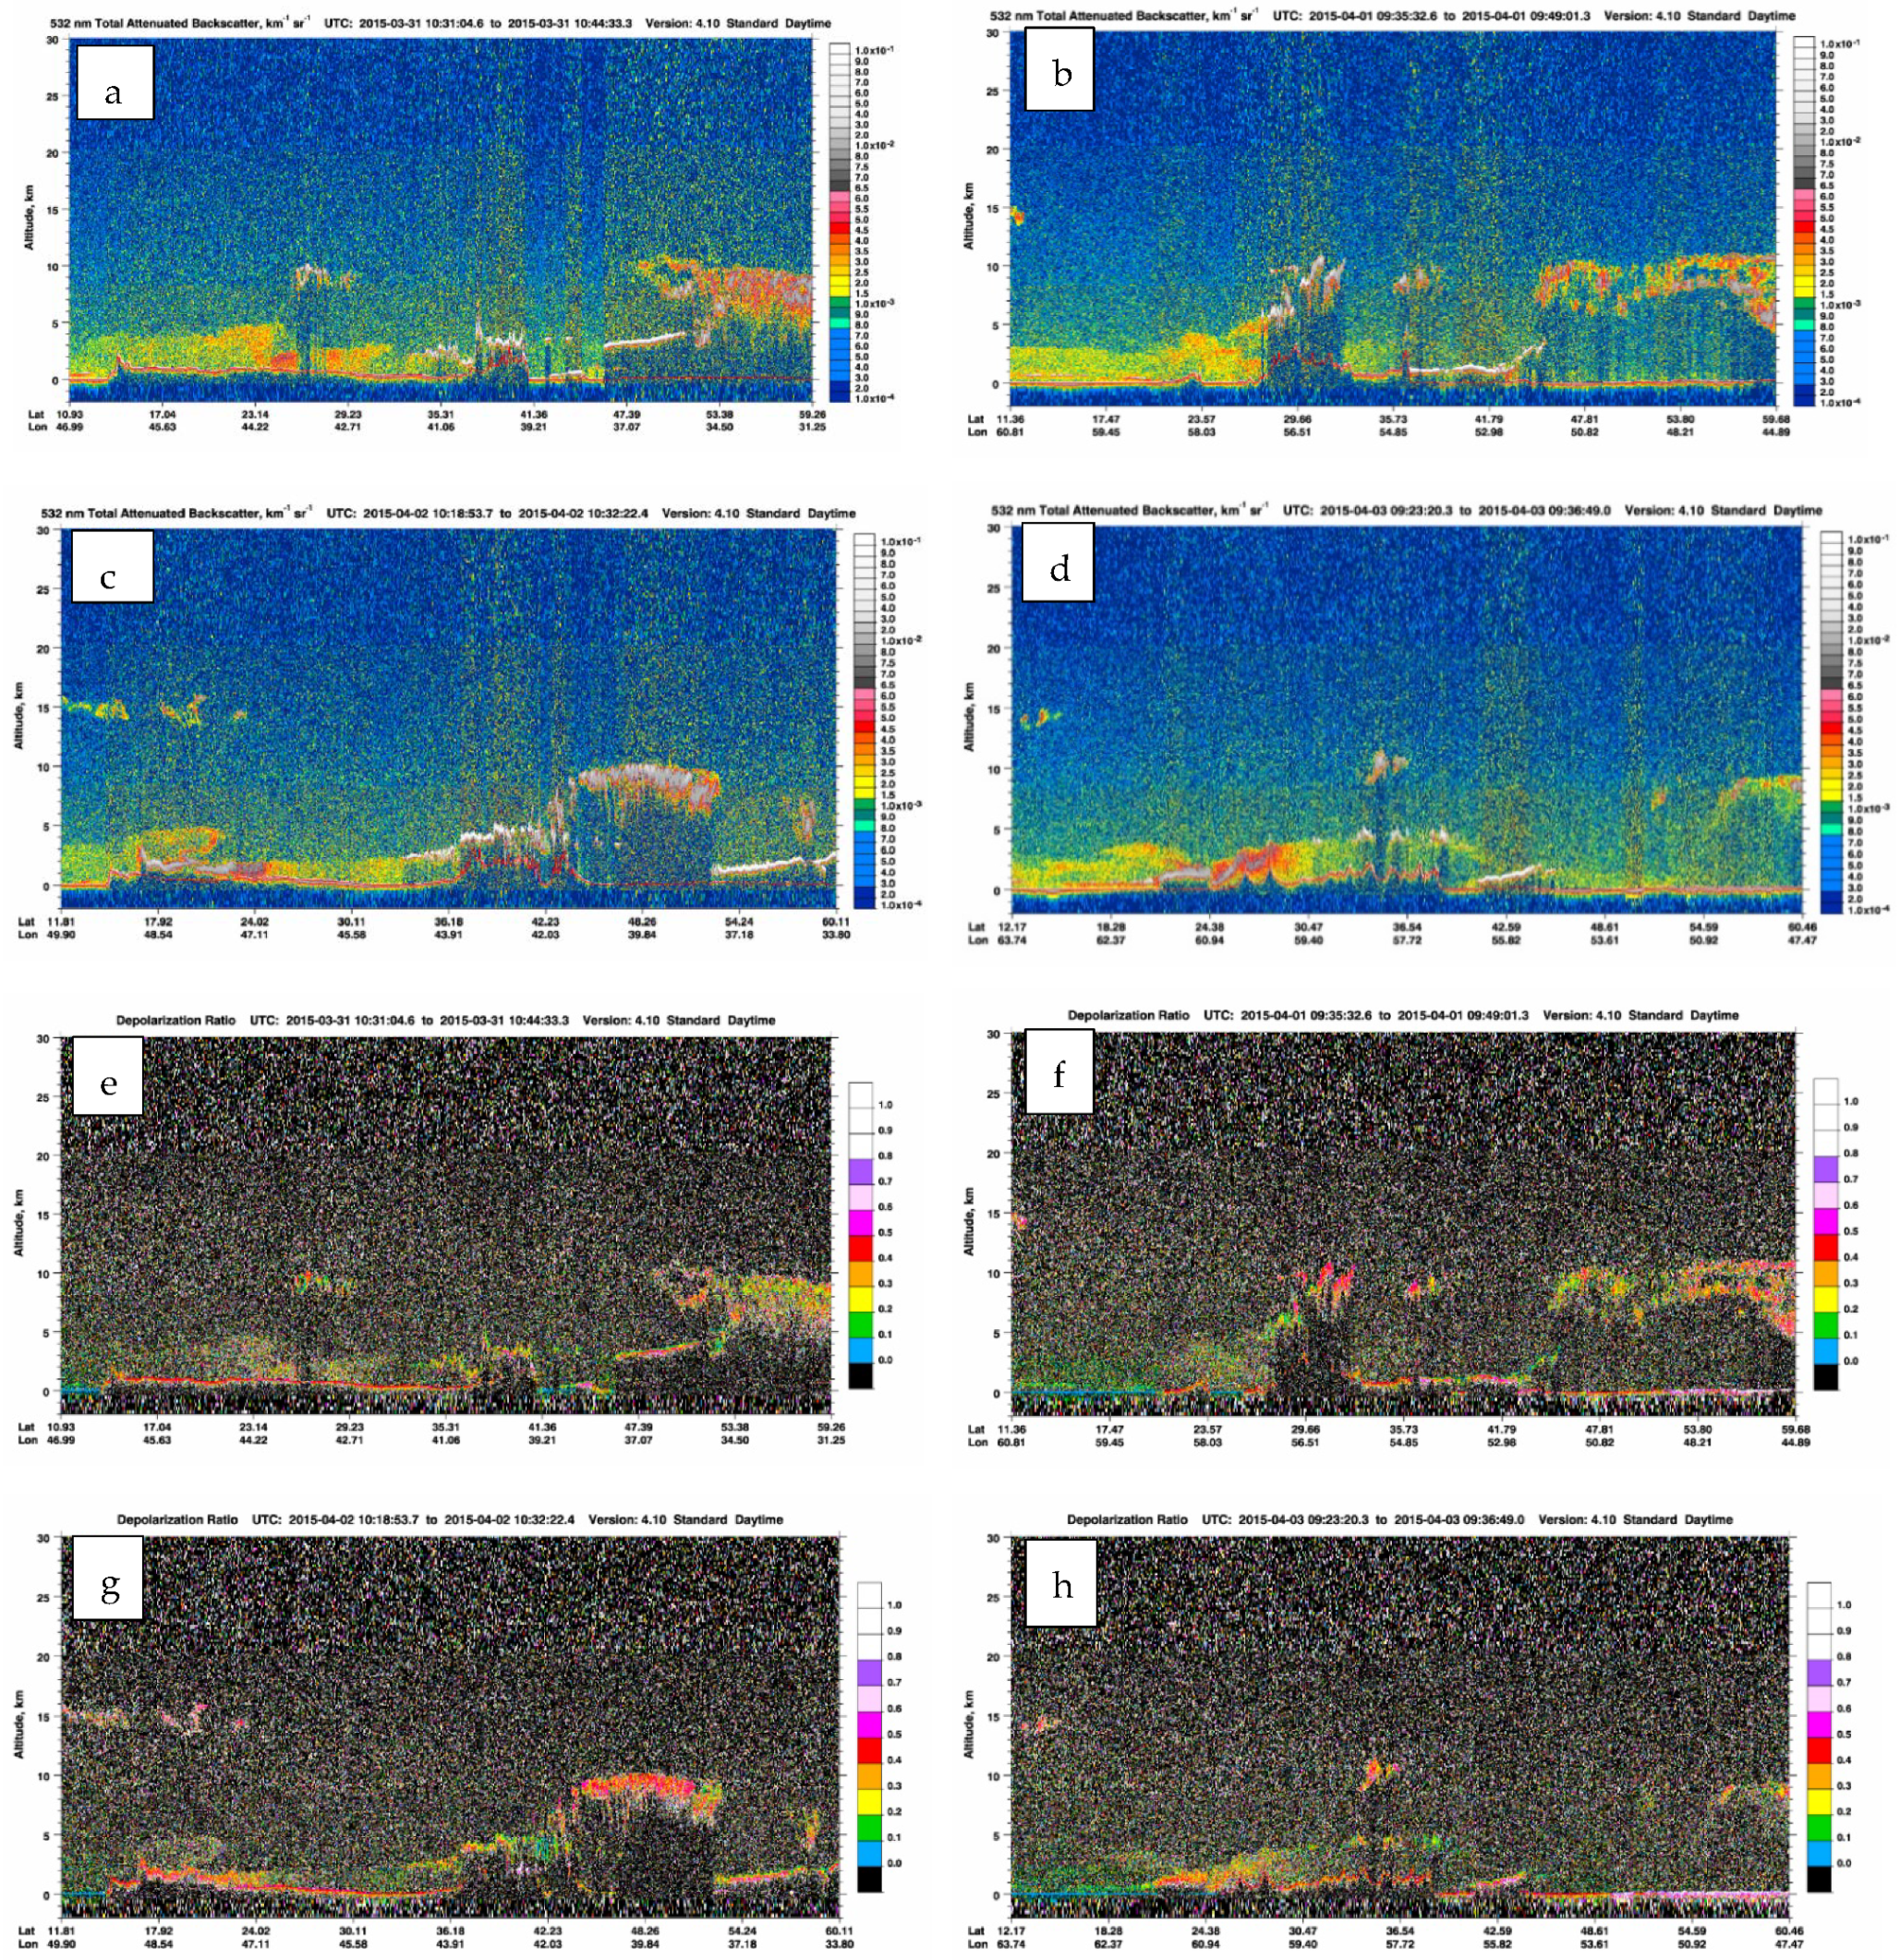
4.3. CALIPSO Data Analysis

The spatial and vertical distribution of dust during this event was also monitored using output from the CALIPSO satellite. Figure 5 shows lidar data recorded as CALIPSO passed over the study area between 31 March and 3 April 2015. The left panel shows the CALIPSO path and right panel shows CALIPSO aerosol subtype products. The strength of attenuated backscatter signal (Figure 6) reveals weak dust between latitudes 25°–35°, and longitude 54°–60° on 1 April 2015, while on 3 April 2015, a significant amount of dust is observed in this region. The average backscatter signal near 3.5 × 10⁻³ was observed on 1 April 2015 that has increased to 8 × 10⁻³ in this area.
Figure 5 (right panel) shows the aerosol subtypes in the CALIPSO product from 31 March to 3 April 2015, in which yellow represents dust particles and brown represents polluted dust (a combination of dust and smoke). Visual interpretation reveals that dust (yellow color) was observed on all four days, although some differences between the days are obvious. On 2 April, a mix of dust and polluted dust (brown color) is clear, and polluted dust was also apparent on 31 March.
The depolarization ratio (Figure 6) at 532 nm is the ratio of perpendicular polarization to parallel polarization of the 532 nm attenuated backscatter coefficient. The depolarization ratio of the backscattered signal is affected by aerosol shape (irregular particles increase the depolarization ratio). Nearly spherical particles show a depolarization ratio near to zero, while large values are reported for non-spherical particles. Therefore, it serves as a good indicator for discriminating dust aerosols from water clouds, ice clouds and smoke [47]. The depolarization ratios were between 0.1 and 0.2 on 31 March (Figure 6). The values increased to between 0.3 and 0.4 on 1 April, and the higher values are also observed on 2 April, although at a lower altitude in comparison to the previous day. The depolarization ratios on 3 April 2015 were between 0.2 and 0.4. In general, the average depolarization ratios during 31 March to 3 April were between 0.3 and 0.4 which is typical for dust [48,49,50]. The comparison shows that there is consistency between the dust optical properties derived from the lidar and other observations in the region.

5. Socio-Economic Impacts

This severe dust storm resulted in a wide range of socio-economic impacts across the region. The effects were felt in several sectors—including health, education, construction, transport, leisure and energy production—across at least eight countries, as summarized in Table 1.
Concerns over the health effects of the storm resulted in the closure of schools in Qatar and Saudi Arabia. At 22:35 local time on 1 April, the Supreme Education Council in Qatar cited “extreme weather conditions” in a tweet announcing that students at all schools would have a holiday the following day, and that all school examinations scheduled to be held that day would be postponed. Schools were also closed for the day on 2 April in central and eastern provinces of neighbouring Saudi Arabia.
An impromptu national holiday was announced in Saudi Arabia, and in Abu Dhabi several recreational events were cancelled due to health and safety considerations. The final stage of the Abu Dhabi Desert Challenge Rally was called off because it was impossible to provide air evacuation to the rally drivers, in case of accidents. Helicopter support is essential to ensure competitor safety, but the choppers were unable to take off in visibility as low as 100 m.
In parts of the Persian Gulf visibility reached near-zero on 1–2 April along with high winds. King Abdul Aziz Port in Dammam, Saudi Arabia, suspended shipping arrivals and departures on 1 April. The following day, Shahid Rajaee port outside Bandar Abbas, Iran’s largest container port, was closed. The Coast Guard in Qatar, in cooperation with the Emiri Air Force, responded to an SOS from a fishing boat on the evening of 1–2 April, and eventually rescued 11 fishermen who had experienced zero visibility and 45-knot winds.
The potential impact on human health is indicated by PM10 data collected from various sources and shown in Table 2. National 24-h mean safety standards were greatly exceeded in Qatar, the UAE, Iran and even in India. The immediate health impacts in Qatar, where the dust-front of the storm arrived at around 22:00 local time on 1 April, have been assessed by Irfan et al. [41,42]. Qatar’s only tertiary care centre, Hamad General Hospital, activated its full emergency department incident response early in the morning (between 04:30 and 05:00) on 2 April due to the surge in the number of cases. Most of these were people suffering from respiratory complaints, vehicular trauma and ophthalmic emergencies. Within 12 h of the onset of the dust storm, the hospital’s emergency department received 254 cases with respiratory illness, which compares with an average of 20–40 respiratory cases per day for the 7 days before and after the storm. A similar spike occurred in motor vehicle crash cases, which increased five-fold during the storm, even though it is almost certain that fewer drivers were on the roads. A notable increase in motor vehicle accidents also occurred in Saudi Arabia and the UAE.
Airports in seven countries across the region had to delay, divert and cancel flights during the dust storm due to a combination of severely reduced visibility and high wind speeds. An impression of how the dust-front progressively affected regional visibility is shown in Figure 7, created using METARs at five airports on 1 and 2 April. The arrival of the dust-front was also accompanied by high winds. At Riyadh international airport, visibility was reduced to 0 m at 17:35 local time, when wind speed was 46.3 km/h. At 18:00, gusts of 68.5 km/h were recorded. At Bahrain international airport, visibility dropped from 7000 m at 20:30 local time to 100 m at 21:00, at which time the wind speed was 14.8 km/h. At 22:00, visibility was still 100 m, but wind speed was 37 km/h, with gusts up to 59.3 km/h. Some airports ceased to produce METARs for several hours during the storm, including Hamad international airport in Doha where the last report on 1 April was made at 14:00 and reports did not resume until 06:30 on 2 April.
An indication of how flight schedules were affected by the dust storm is given in Table 3 which shows the daily overall on time performance (OTP) at four international airports from 1 to 3 April. OTP is defined as the percentage of flights that arrive within 15 min of scheduled arrival time, and is typically around 90%, but dropped to 75% at Hamad international airport, Doha, Qatar on 1 April and even lower at Dubai and two airports in Saudi Arabia at Riyadh and Dammam. On 2 April, the OTP at both Riyadh and Dammam was less than 7%, and less than 41% at Dubai and Doha, where better instrument landing technology allowed more air traffic to keep to schedules. The OTPs for all four airports improved on 3 April, although they were still low.
The dust storm affected 76% of 1526 scheduled flights on Saudi Arabia’s national airline, Saudia, over the period 1–3 April. A total of 465 Saudia flights or 33% of those scheduled—both domestic and international—were cancelled over those three days, with another 678 flights delayed, and 19 others re-routed to other destinations as a result of the dust storm [53]. Riyadh’s King Khaled international airport, which was closed for seven hours until its runaway was cleared for landing at 04:00 on 2 April, reported that 164,500 of its passengers were affected by the storm over the three days 1–3 April.
In Yemen, the storm affected Operation Raahat, an Indian mission to airlift civilians from the war-torn country. An Air India pilot described visibility at Sanaa airport, which was below 50 m when he landed on 3 April, as like “flying almost blind-folded” [54].
Across the Persian Gulf, airports on the coast of Iran were also affected. Data from the Civil Aviation Organization of the Islamic Republic of Iran shown in Table 4 indicates that 15 domestic flights were cancelled or diverted over the three-day period due to disruption by the dust storm at airports at Booshehr and Kharg Island in the northern Persian Gulf and at Kish Island, Qeshm Island, Bandar Abbas and Chabahar further to the southeast. Most of these flights were in or out of Tehran’s Mehrabad domestic airport, but a flight to Mashhad was also diverted.
An insight into the impact of this dust storm event on the generation of electricity by the region’s solar power plants is given by [51] who studied the effects on the performance of photovoltaic (PV) panels at two locations in Oman: Muscat and Nizwa. They note that the dust-front arrived over Oman during the nighttime of 2–3 April, so that the highest potential effect due to backscattering and absorption of solar radiation by dust in the atmosphere did not apply. On 3 April, PV performance at Muscat was 37% less than the previous day, largely due to soiling of the panels by dust deposited, but with some decrease due to atmospheric scattering. As atmospheric dust cleared over the following days, PV performance improved. It is interesting to note that there was no evidence of soiling observed at the Nizwa site, suggesting that strong winds had effectively cleaned the panels.

6. Discussion

The hazardous aspects of dust storms have become an issue of increasing concern in many parts of the world in recent years, a rise to prominence reflected in the fact that member states of the UN General Assembly have adopted resolutions on combating sand and dust storms every year since 2015. This emerging dust storm disaster risk is also likely to be intensified in many drylands because of climate change: projections indicate an expansion of the global dryland area [55] and the risk of drought is also expected to increase [56], both trends that would lead to higher levels of dust storm activity. The Middle East is an important region in this regard, being located centrally in the so-called Dust Belt, a wide stretch of dryland with numerous persistent dust sources that extends from the west coast of the Sahara to northeast Asia [57]. Middle Eastern dust storms on a geographical scale as large as the severe event of early April 2015 do not occur every year, but they are not infrequent. Events on a similarly large scale have been reported in early March 2009 [58,59], and mid-March 2012 [60,61], and each of these events affected multiple countries. The synoptic climatology of such large-scale Middle Eastern dust storms is relatively well understood, but studies of the socio-economic impacts of such events are rare. Indeed, to the best of our knowledge this paper presents the first attempt to document dust storm impacts on multiple socio-economic sectors in multiple countries in any part of the world.
Dust storms occur rather more frequently than most other types of natural hazard and, as this paper demonstrates, their impacts on society can be widespread, severe and complex. However, policymakers hoping to tackle this emerging disaster risk management issue face a lack of information and a poor understanding of the socio-economic impacts of the phenomenon. A significant attempt to support countries in collecting data on the impacts of dust storms has been made recently by a body of the UN Economic and Social Commission for Asia and the Pacific (ESCAP): The Asia and Pacific Centre for Development of Disaster Information Management (APDIM). UNESCAP-APDIM [62] has produced guidelines on monitoring and reporting the effects of sand and dust storms through the Sendai Framework Monitoring to help supply decision-makers with the sort of information they need on which to base policy. Many of the impacts of dust storms are transboundary, as in the example studied in this paper, so documentation, assessment and monitoring of the impacts of these events is an international issue, requiring international cooperation [63,64,65]. Multi-country transboundary studies of individual dust storm events are required to fully understand their multiple impacts, and this paper is intended to serve as an early example of what we hope will become a more common type of assessment.

7. Conclusions

The severe dust storm that originated in the An Nafud Desert of Saudi Arabia on 1 April 2105 transported dust across an area of 10 million km2 over the following days, affecting at least 14 countries in the Middle East, Southwest Asia and the Horn of Africa. The synoptic meteorology of this event is analyzed using ground observational data from meteorological stations and airports, multiple satellite observations and reanalysis data (ERA5). This dust storm was created by the powerful winds associated with cyclogenesis involving the intrusion of a polar cold front into a subtropical warm front. High atmospheric concentrations of dust and associated very low visibility across the Arabian Peninsula resulted in socio-economic impacts in several sectors—including health, education, transport, construction, leisure and energy production—across eight countries.
A marked increase in motor vehicle accidents occurred in Saudi Arabia, Qatar and the UAE, where hospitals experienced a surge in cases of respiratory complaints, vehicular trauma and ophthalmic emergencies. Airports in seven countries across the region had to divert, delay and cancel flights during the dust storm due to the combination of severely reduced visibility and high wind speeds. The OTP at Riyadh and Dammam international airports was <7% on 2 April and more than 1000 flights on Saudi Arabia’s national airline, Saudia, were impacted over the period 1–3 April.
This study clearly demonstrates the multiple socio-economic impacts associated with such a severe dust storm, impacts that are transboundary and in this case were felt across eight countries. This type of transboundary study of individual dust storm events is necessary to improve our understanding of their multiple impacts and so inform policymakers whose job it is to tackle this emerging disaster risk management issue.

Author Contributions

Conceptualization, N.M. and S.S.K.; methodology, N.M., S.S.K., S.A., M.R. and S.T.M.; writing—original draft preparation, N.M., S.S.K., S.A., M.R. and S.T.M.; writing—review and editing, N.M., S.S.K., S.A., M.R. and S.T.M. All authors have read and agreed to the published version of the manuscript.

Funding

This research received no external funding.

Institutional Review Board Statement

Not applicable.

Informed Consent Statement

Not applicable.

Acknowledgments

This research was partly supported by the Islamic Republic of Iran Meteorological Organization (IRIMO). We want to thank the European Centre for Medium-Range Weather Forecasts (ECMWF) for providing reanalysis data, and the National Aeronautics and Space Administration (NASA) and the Centre National d’Etudes Spatiales (CNES) for providing and supporting level-3 MODIS gridded atmosphere daily global joint products and CALIPSO datasets. We also thank M.K. for PM10 readings, weatherspark.com (accessed on 1 October 2021) for METAR data and OAG for On Time Performance (OTP) flight data. Four anonymous reviewers also assisted with pertinent critical comments.

Conflicts of Interest

The authors declare no conflict of interest.

Appendix A

Table A1. SYNOP present weather (WW) codes relevant to atmospheric dust.
CodeDescription
5Haze
6Widespread dust in suspension in the air, not raised by wind at or near the station at the time of observation
7Dust or sand raised by wind at or near the station at the time of observation, but no well-developed dust whirl(s) or sand whirl(s), and no dust storm or sandstorm seen
9Dust storm or sandstorm within sight at the time of observation, or at the station during the preceding hour
30Slight or moderate dust storm or sandstorm-has decreased during the preceding hour
31Slight or moderate dust storm or sandstorm-no appreciable change during the preceding hour
32Slight or moderate dust storm or sandstorm-has begun or has increased during the preceding hour
33Severe dust storm or sandstorm-has decreased during the preceding hour
34Severe dust storm or sandstorm-no appreciable change during the preceding hour
35Severe dust storm or sandstorm-has begun or has increased during the preceding hour
98Thunderstorm combined with dust storm or sandstorm at time of observation-thunderstorm at time of observation
Source: extracted from [66].

References

  1. Middleton, N.J. Dust storms in the Middle East. J. Arid. Environ. 1986, 10, 83–96. [Google Scholar] [CrossRef]
  2. Barkan, J.; Kutiel, H.; Alpert, P. Climatology of dust sources in North Africa and the Arabian Peninsula, based on TOMS data. Indoor Built Environ. 2004, 13, 407–419. [Google Scholar] [CrossRef]
  3. Cao, H.; Amiraslani, F.; Liu, J.; Zhou, N. Identification of dust storm source areas in West Asia using multiple environmental datasets. Sci. Total Environ. 2015, 502, 224–235. [Google Scholar] [CrossRef]
  4. Hamzeh, N.; Karami, S.; Kaskaoutis, D.; Tegen, I.; Moradi, M.; Opp, C. Atmospheric dynamics and numerical simulations of six frontal dust storms in the Middle East region. Atmosphere 2021, 12, 125. [Google Scholar] [CrossRef]
  5. Goudie, A.S.; Middleton, N.J. Desert Dust in the Global System; Springer Science & Business Media: Berlin/Heidelberg, Germany, 2006. [Google Scholar]
  6. Knippertz, P.; Stuut, J.B.W. Mineral Dust—A Key Player in the Earth System; Springer Science & Business Media: Berlin/Heidelberg, Germany, 2014. [Google Scholar]
  7. Guieu, C.; Al Azhar, M.; Aumont, O.; Mahowald, N.; Lévy, M.; Éthé, C.; Lachkar, Z. Major impact of dust deposition on the productivity of the Arabian Sea. Geophys. Res. Lett. 2019, 46, 6736–6744. [Google Scholar] [CrossRef]
  8. Sirocko, F.; Garbe-Schönberg, D.; Devey, C. Processes controlling trace element geochemistry of Arabian Sea sediments during the last 25,000 years. Glob. Planet. Chang. 2000, 26, 217–303. [Google Scholar] [CrossRef]
  9. Jin, Q.; Wei, J.; Lau, W.K.; Pu, B.; Wang, C. Interactions of Asian mineral dust with Indian summer monsoon: Recent advances and challenges. Earth-Sci. Rev. 2021, 215, 103562. [Google Scholar] [CrossRef]
  10. Middleton, N.J. Desert dust hazards: A global review. Aeolian Res. 2017, 24, 53–63. [Google Scholar] [CrossRef]
  11. UNDRR. Disaster. 2021. Available online: https://www.undrr.org/terminology/disaster (accessed on 24 September 2021).
  12. Middleton, N.J.; Tozer, P.; Tozer, B. Sand and dust storms: Underrated natural hazards. Disasters 2019, 43, 390–409. [Google Scholar] [CrossRef]
  13. Khaniabadi, Y.O.; Daryanoosh, S.M.; Amrane, A.; Polosa, R.; Hopke, P.K.; Goudarzi, G.; Mohammadi, M.J.; Sicard, P.; Armin, H. Impact of Middle Eastern dust storms on human health. Atmos. Pollut. Res. 2017, 8, 606–613. [Google Scholar] [CrossRef]
  14. Soleimani, Z.; Teymouri, P.; Boloorani, A.D.; Mesdaghinia, A.; Middleton, N.; Griffin, D.W. An overview of bio-aerosol load and health impacts associated with dust storms: A focus on the Middle East. Atmos. Environ. 2020, 223, 117187. [Google Scholar] [CrossRef]
  15. Alshawaf, M.; Poudineh, R.; Alhajeri, N.S. Solar PV in Kuwait: The effect of ambient temperature and sandstorms on output variability and uncertainty. Renew. Sustain. Energy Rev. 2020, 134, 110346. [Google Scholar] [CrossRef]
  16. Papadopoulou, K.; Alasis, C.; Xydis, G.A. On the wind blade’s surface roughness due to dust accumulation and its impact on the wind turbine’s performance: A heuristic QBlade-based modeling assessment. Environ. Prog. Sustain. Energy 2020, 39, 13296. [Google Scholar] [CrossRef]
  17. AlKheder, S.; AlKandari, A. The impact of dust on Kuwait International Airport operations: A case study. Int. J. Environ. Sci. Technol. 2020, 17, 3467–3474. [Google Scholar] [CrossRef]
  18. Al-Hemoud, A.; Al-Dousari, A.; Misak, R.; Al-Sudairawi, M.; Naseeb, A.; Al-Dashti, H.; Al-Dousari, N. Economic impact and risk assessment of Sand and Dust Storms (SDS) on the oil and gas industry in Kuwait. Sustainability 2019, 11, 200. [Google Scholar] [CrossRef] [Green Version]
  19. Hatami, Z.; Rezvani Moghaddam, P.; Rashki, A.; Nasiri Mahallati, M.; Habibi Khaniani, B. Effects of dust deposition from two major dust source regions of Iran on wheat (Triticum aestivum L.) production. Int. J. Environ. Stud. 2017, 74, 991–1000. [Google Scholar] [CrossRef]
  20. Gross, A.; Tiwari, S.; Shtein, I.; Erel, R. Direct foliar uptake of phosphorus from desert dust. New Phytol. 2021, 230, 2213–2225. [Google Scholar] [CrossRef]
  21. Nativ, R.; Adar, E.; Dahan, O.; Nissim, I. Water salinization in arid regions—Observations from the Negev desert, Israel. J. Hydrol. 1997, 196, 271–296. [Google Scholar] [CrossRef]
  22. Hu, Z.; Kang, S.; Li, X.; Li, C.; Sillanpää, M. Relative contribution of mineral dust versus black carbon to Third Pole glacier melting. Atmos. Environ. 2020, 223, 117288. [Google Scholar] [CrossRef]
  23. Ai, N.; Polenske, K.R. Socioeconomic Impact Analysis of Yellow-dust Storms: An Approach and Case Study for Beijing. Econ. Syst. Res. 2008, 20, 187–203. [Google Scholar] [CrossRef]
  24. Miri, A.; Ahmadi, H.; Ekhtesasi, M.R.; Panjehkeh, N.; Ghanbari, A. Environmental and socio-economic impacts of dust storms in Sistan Region, Iran. Int. J. Environ. Stud. 2009, 66, 343–355. [Google Scholar] [CrossRef]
  25. Tozer, P.; Leys, J. Dust storms–what do they really cost? Rangel. J. 2013, 35, 131–142. [Google Scholar] [CrossRef] [Green Version]
  26. Al-Hemoud, A.; Al-Sudairawi, M.; Neelamanai, S.; Naseeb, A.; Behbehani, W. Socioeconomic effect of dust storms in Kuwait. Arab. J. Geosci. 2017, 10, 18. [Google Scholar] [CrossRef]
  27. Cuevas, E.; Milford, C.; Basart, S. (Eds.) Desert Dust Outbreak in the Canary Islands (February 2020): Assessment and Impacts. Global Atmosphere Watch (GAW); Report No. 259, WWRP 2021-1; World Meteorological Organization: Geneva, Switzerland, 2020. [Google Scholar]
  28. Badarinath, K.; Kharol, S.K.; Kaskaoutis, D.; Sharma, A.R.; Ramaswamy, V.; Kambezidis, H. Long-range transport of dust aerosols over the Arabian Sea and Indian region—A case study using satellite data and ground-based measurements. Glob. Planet. Chang. 2010, 72, 164–181. [Google Scholar] [CrossRef]
  29. Boloorani, A.D.; Nabavi, S.O.; Bahrami, H.A.; Mirzapour, F.; Kavosi, M.; Abasi, E.; Azizi, R. Investigation of dust storms entering Western Iran using remotely sensed data and synoptic analysis. J. Environ. Health Sci. Eng. 2014, 12, 124. [Google Scholar] [CrossRef] [Green Version]
  30. Al-Dousari, A.; Domenico, D.; Modi, A. Types, indications and impact evaluation of sand and dust storms trajectories in the Arabian Gulf. Sustainability 2017, 9, 1526. [Google Scholar] [CrossRef] [Green Version]
  31. Ledari, D.G.; Hamidi, M.; Shao, Y. Evaluation of the 13 April 2011 frontal dust storm in West Asia. Aeolian Res. 2020, 44, 100592. [Google Scholar] [CrossRef]
  32. Broomandi, P.; Karaca, F.; Guney, M.; Fathian, A.; Geng, X.; Kim, J.R. Destinations frequently impacted by dust storms originating from southwest Iran. Atmos. Res. 2021, 248, 105264. [Google Scholar] [CrossRef]
  33. EUMETSAT. The Spectrum of Dust Colours over the Arabian Peninsula. 2015. Available online: https://www.eumetsat.int/spectrum-dust-colours-over-arabian-peninsula (accessed on 1 May 2021).
  34. Beegum, N.; Gherboudj, I.; Chaouch, N.; Temimi, M.; Ghedira, H. Simulation and analysis of synoptic scale dust storms over the Arabian Peninsula. Atmos. Res. 2018, 199, 62–81. [Google Scholar] [CrossRef]
  35. Karagulian, F.; Temimi, M.; Ghebreyesus, D.; Weston, M.; Kondapalli, N.K.; Valappil, V.K.; Aldababesh, A.; Lyapustin, A.; Chaouch, N.; Al Hammadi, F.; et al. Analysis of a severe dust storm and its impact on air quality condi-tions using WRF-Chem modeling, satellite imagery, and ground observations. Air Qual. Atmos. Health 2019, 12, 453–470. [Google Scholar] [CrossRef] [Green Version]
  36. Fountoukis, C.; Harshvardhan, H.; Gladich, I.; Ackermann, L.; Ayoub, M.A. Anatomy of a Severe Dust Storm in the Middle East: Impacts on Aerosol Optical Properties and Radiation Budget. Aerosol Air Qual. Res. 2020, 20, 155–165. [Google Scholar] [CrossRef]
  37. Ababneh, Z.Q.; Ababneh, A.M.; Alsagabi, S.; Almasoud, F. A study of the radioactivity in the dust storm event of April 2015 in Arabian Peninsula. Radiat. Prot. Dosim. 2017, 179, 108–118. [Google Scholar] [CrossRef] [PubMed]
  38. Ghattargi, V.C.; Garg, M.; Raina, S.; Silva, J.D.; Pawar, S.P.; Rahi, P.; Shouche, Y.S. Assessment of airborne mi-crobial community in Indian cities during the Middle East dust storm. Curr. Sci. 2019, 117, 1693. [Google Scholar] [CrossRef]
  39. Aswini, M.; Kumar, A.; Das, S.K. Quantification of long-range transported aeolian dust towards the Indian peninsular region using satellite and ground-based data—A case study during a dust storm over the Arabian Sea. Atmos. Res. 2020, 239, 104910. [Google Scholar] [CrossRef]
  40. Argyropoulos, C.D.; Abraham, M.; Hassan, H.; Ashraf, A.M.; Fthenou, E.; Sadoun, E.; Kakosimos, K.E. Modelling of PM10 and PM2. 5 building infiltration during a dust event in Doha, Qatar. ProScience 2016, 3, 1–6. [Google Scholar] [CrossRef]
  41. Irfan, F.B.; Pathan, S.A.; Bhutta, Z.A.; Abbasy, M.E.; Elmoheen, A.; Alsaeidy, A.M.; Tariq, T.; Hugelmeyer, C.D.; Dardouri, H.; Khial, N.B.; et al. ED case presentations during the largest sandstorm in the Middle East. J. Emerg. Med. Trauma Acute Care 2016, 2016, 164. [Google Scholar] [CrossRef]
  42. Irfan, F.B.; Pathan, S.A.; Bhutta, Z.A.; Abbasy, M.E.; Elmoheen, A.; Elsaeidy, A.M.; Tariq, T.; Hugelmeyer, C.D.; Dardouri, H.; Shah, N.B.K.B.; et al. Health System Response and Adaptation to the Largest Sandstorm in the Middle East. Disaster Med. Public Health Prep. 2017, 11, 227–238. [Google Scholar] [CrossRef]
  43. Hersbach, H.; Bell, B.; Berrisford, P.; Hirahara, S.; Horányi, A.; Muñoz-Sabater, J.; Nicolas, J.; Peubey, C.; Radu, R.; Schepers, D.; et al. The ERA5 global reanalysis. Q. J. R. Meteorol. Soc. 2020, 146, 1999–2049. [Google Scholar] [CrossRef]
  44. Nguyen, H.D.; Riley, M.; Leys, J.; Salter, D. Dust storm event of February 2019 in Central and East Coast of Australia and evidence of long-range transport to New Zealand and Antarctica. Atmosphere 2019, 10, 653. [Google Scholar] [CrossRef] [Green Version]
  45. Wilkerson, W.D. Dust and Sand Forecasting in Iraq and Adjoining Countries; No. AWS/TN–91/001; Air Weather Service: Scott Afb, IL, USA, 1991. [Google Scholar]
  46. Hermida, L.; Merino, A.; Sanchez, J.L.; Fernández-González, S.; García-Ortega, E.; Lopez, L. Characterization of synoptic patterns causing dust outbreaks that affect the Arabian Peninsula. Atmos. Res. 2018, 199, 29–39. [Google Scholar] [CrossRef]
  47. McKendry, I.; Strawbridge, K.; Karumudi, M.L.; O’Neill, N.; Macdonald, A.M.; Leaitch, R.; Jaffe, D.; Cottle, P.; Sharma, S.; Sheridan, P.; et al. Californian forest fire plumes over Southwestern British Columbia: Lidar, sunphotometry, and mountaintop chemistry observations. Atmos. Chem. Phys. Discuss. 2011, 11, 465–477. [Google Scholar] [CrossRef] [Green Version]
  48. Barnaba, F.; Gobbi, G.P. Lidar estimation of tropospheric aerosol extinction, surface area and volume: Maritime and desert-dust cases. J. Geophys. Res. Space Phys. 2001, 106, 3005–3018. [Google Scholar] [CrossRef]
  49. Liu, Z.; Omar, A.; Vaughan, M.A.; Hair, J.; Kittaka, C.; Hu, Y.; Powell, K.; Trepte, C.; Winker, D.; Hostetler, C.; et al. CALIPSO lidar observations of the optical properties of Saharan dust: A case study of long-range transport. J. Geophys. Res. Atmos. 2008, 113. [Google Scholar] [CrossRef]
  50. Liu, Z.; Sugimoto, N.; Murayama, T. Extinction-to-backscatter ratio of Asian dust observed with high-spectral-resolution lidar and Raman lidar. Appl. Opt. 2002, 41, 2760–2767. [Google Scholar] [CrossRef] [Green Version]
  51. Al Badi, H.; Boland, J.; Bruce, D.; Albadi, M. Dust Event Impact on Photovoltaic Systems: Role of humidity in soiling and self-cleaning. In Proceedings of the 2018 IEEE International Conference on Smart Energy Grid Engineering (SEGE), Oshawa, ON, Canada, 12–15 August 2018; pp. 342–345. [Google Scholar]
  52. Tsiouri, V.; Kakosimos, K.E.; Kumar, P. Concentrations, sources and exposure risks associated with particulate matter in the Middle East Area—A review. Air Qual. Atmos. Health 2015, 8, 67–80. [Google Scholar] [CrossRef]
  53. Saudi Gazette. Sandstorms Cancel 465 Saudi Arabian Airlines Flights. 2015. Available online: https://english.alarabiya.net/News/gulf/2015/04/06/Sandstorms-cancel-465-Saudia-flights (accessed on 17 March 2021).
  54. Indian Express. Operation Raahat: Pilots Dealt with Dust Storm, Damaged Machines. 2015. Available online: https://indianexpress.com/article/india/india-others/operation-raahat-pilots-dealt-with-dust-storm-damaged-machines/ (accessed on 19 March 2021).
  55. Huang, J.; Yu, H.; Guan, X.; Wang, G.; Guo, R. Accelerated dryland expansion under climate change. Nat. Clim. Chang. 2016, 6, 166–171. [Google Scholar] [CrossRef]
  56. Naumann, G.; Alfieri, L.; Wyser, K.; Mentaschi, L.; Betts, R.A.; Carrao, H.; Spinoni, J.; Vogt, J.; Feyen, L. Global changes in drought conditions under different levels of warming. Geophys. Res. Lett. 2018, 45, 3285–3296. [Google Scholar] [CrossRef]
  57. Middleton, N.J. Variability and trends in dust storm frequency on decadal timescales: Climatic drivers and human impacts. Geosci. 2019, 9, 261. [Google Scholar] [CrossRef] [Green Version]
  58. Alharbi, B.H.; Maghrabi, A.L.; Tapper, N. The March 2009 dust event in Saudi Arabia: Precursor and supportive environment. Bull. Am. Meteorol. Soc. 2013, 94, 515–528. [Google Scholar] [CrossRef]
  59. Zhang, Y.; Liu, Y.; Kucera, P.A.; Alharbi, B.H.; Pan, L.; Ghulam, A. Dust modeling over Saudi Arabia using WRF-Chem: March 2009 severe dust case. Atmos. Environ. 2015, 119, 118–130. [Google Scholar] [CrossRef]
  60. Kunte, P.D.; Aswini, M.A. Detection and monitoring of super sandstorm and its impacts on Arabian sea—Remote sensing approach. Atmos. Res. 2015, 160, 109–125. [Google Scholar] [CrossRef]
  61. Prakash, P.J.; Stenchikov, G.; Kalenderski, S.; Osipov, S.; Bangalath, H. The impact of dust storms on the Arabian Peninsula and the Red Sea. Atmos. Chem. Phys. Discuss. 2015, 15, 199–222. [Google Scholar] [CrossRef] [Green Version]
  62. UNESCAP-APDIM. Guideline on Monitoring and Reporting the Impact of Sand and Dust Storms through the Sendai Framework Monitoring; APDIM: Tehran, Iran, 2020. [Google Scholar]
  63. Blondin, D.; Boin, A. Cooperation in the face of transboundary crisis: A framework for analysis. Perspect. Public Manag. Gov. 2020, 3, 197–209. [Google Scholar] [CrossRef] [Green Version]
  64. Middleton, N.J. Health in dust belt cities and beyond. BMJ 2020, 371, m3089. [Google Scholar] [CrossRef] [PubMed]
  65. Wu, Y.; Wen, B.; Li, S.; Guo, Y. Sand and dust storms in Asia: A call for global cooperation on climate change. Lancet Planet. Health 2021, 5, e329–e330. [Google Scholar] [CrossRef]
  66. WMO. Manual on Codes, International Codes Volume I.1, Annex II to the WMO Technical Regulations Part A–Al-Phanumeric Codes; WMO: Geneva, Switzerland, 2019. [Google Scholar]
Figure 1. Deep Blue Aerosol Optical Depth Land Images superimposed with visibility reduction recorded by synoptic stations in five categories (less than 800 m, 801–1500 m, 1501–3000 m, 3001–5000 m and more than 5000 m) between 31 March and 3 April 2015 (12:00 UTC) (ad).
Atmosphere 12 01435 g001
Figure 2. Contours indicate the daily 850 hPa geopotential heights (m) overlaid with 850 hPa wind vectors (m/s) and temperature (K) derived from ERA5 data from 31 March to 3 April 2015 (12:00 UTC) (ad).
Atmosphere 12 01435 g002
Figure 3. Contours indicating daily geopotential heights (m) in the mid-troposphere (500 hPa) overlaid with 500 hPa wind vectors (m/s) and temperature (K) derived from ERA5 data for the period 31 March to 3 April 2015 (12:00 UTC) (ad).
Atmosphere 12 01435 g003
Figure 4. The daily upper tropospheric (200 hPa) zonal winds (m/s) and temperature (K) derived from ERA5 ECMWF reanalysis data between 31 March and 3 April (12:00 UTC) (ad).
Atmosphere 12 01435 g004
Figure 5. CALIPSO path (left panel) and aerosol subtype vertical profile as derived from CALIOP measurements (right panel): (a) 31 March 2015, (b) 1 April 2015, (c) 2 April 2015, (d) 3 April 2015.
Atmosphere 12 01435 g005
Figure 6. Showing 532 nm total attenuated backscatter (km−1 sr−1) (31 March 2015–3 April 2015: (ad)), and depolarization ratio (31 March 2015–3 April 2015: (eh)).
Atmosphere 12 01435 g006
Figure 7. Variation in visibility reported at five airports, 1–2 April 2015, compiled from daily METAR reports.
Atmosphere 12 01435 g007aAtmosphere 12 01435 g007b
Table 1. Socio-economic impacts of Middle East dust storm event, 1–3 April 2015.
SectorImpacts
HealthQatar: Full emergency department incident response activated at Hamad General Hospital, Qatar’s only tertiary care centre, due to surge of hundreds of cases
UAE: Health warnings issued by National Emergency and Crisis Disaster Management Authority, advising adults and children with asthma or allergies to stay indoors; Dubai hospitals reported increase in patients complaining of breathing difficulties
Iran: Department of Environment announced the atmospheric dust concentration in Bandar Abbas was 30 times higher than recommended health level
EducationQatar: Schools closed 2 April
Saudi Arabia: Education Ministry closed schools in over 45 towns and cities in central and eastern provinces 2 April
ConstructionUAE, Sharjah: Construction workers told to stop work to ensure their safety until the storm and high winds passed
Road transportSaudi Arabia: Riyadh Traffic Department reported 354 traffic accidents that caused eight injuries in the Saudi capital during the dust storm on 1 April
UAE, Sharjah: 82 road traffic accidents blamed on dust event; Sharjah Roads & Transport Authority distributed face masks to commuters at Al Jubeil bus station
UAE, Dubai: 135 traffic accidents from 06:00 to 12:00 (2 April); bus services to Abu Dhabi stopped due to zero visibility
Qatar: ministry of interior issued alert to motorists, but motor vehicle crash hospital cases increased ×5 during the dust storm and one pedestrian was killed while crossing a street in low visibility
Maritime transportSaudi Arabia: King Abdul Aziz port in Dammam suspended all shipping arrivals and departures from 17:30 GMT on 1 April
Qatar: Coast Guard rescued 11 fishermen at sea 1–2 April
Iran: Shahid Rajaee port in Bandar Abbas closed on 2 April
AviationFlight delays, diversions and cancellations in Saudi Arabia: Riyadh (RUH), Dammam (DMM), Qassim (BSA), Al Qaisumah/Hafr al Batin (AQI) Bahrain: (BAH) Qatar: Doha (DIA) UAE: Dubai International (DXB), Al Maktoum International (DWC), Sharjah (SHJ), Ras Al Khaimah (RKT), Hafr al-Batin (AQI) Oman: Muscat (MCT) Yemen: Sanaa (SAH) Iran: Chabahar (ZBR), Qeshm (GSM), Kish (KIH), Bandar Abbas (BND), Bushehr (BUZ), Kharg (KHK)
OthersSaudi Arabia: National holiday declared on 2 April due to inclement weather, particularly for schools, government and private establishments; trains to and from Riyadh cancelled
UAE, Abu Dhabi: Adnoc Cycle Challenge postponed due to health and safety considerations. Desert Challenge Rally final stage cancelled due to health and safety considerations. Yas Drag Night (car and motorbike drag racing event) postponed.
UAE, Dubai: Dubai Municipality prohibited swimming at Dubai beaches
Oman: Power output from photovoltaic (PV) system at Muscat reduced by 37% on 3 April, the day after passage of the dust storm front, due to soiling and increased atmospheric turbidity
Source: media reports, [42,51].
Table 2. Particulate matter (PM) daily mean standards exceeded during the April 2015 dust storm event.
CountryNational Standard PM10 24-h Mean (μg/m3) *April 2015 Event PM10PM10 (μg/m3)April 2015 Reference
Iran50Bandar Abbas 2 April>1500Iranian Department of Environment
Saudi Arabia340Jeddah 2 April133 (city center); 155 (outskirts)Kadi (pers. com.)
Qatar150Doha 2 April>10,000 **[36]
UAE 150Abu Dhabi and Dubai 2 April>1500 ***[35]
India100Goa 6–9 April150–180[39]
Mumbai 7 April102.5[38]
* National standards from [52]. ** Exceeded the PM analyzer’s upper calibration limit of 10 mg/m3. *** Modelled value.
Table 3. Daily overall on time performance (OTP) at four international airports during the April 2015 dust storm event.
Airport (IATA 3-Letter Code)1 April2 April3 April
King Fahd International Airport, Dammam, Saudi Arabia (DMM)61.76.814.0
King Khalid International Airport, Riyadh, Saudi Arabia (RUH)49.45.35.8
Hamad International Airport, Doha, Qatar (DOH)75.035.555.3
Dubai International Airport, UAE (DXB)69.540.749.9
Note: OTP = percentage of flights within 15 min of scheduled arrival time and includes all flights cancelled at less than 48 hours’ notice.
Table 4. Domestic flights in Iran affected by the April 2015 dust storm event.
Date (2015)DepartureDestinationCancelledDiverted
1 AprilTehranKish Islando
1 AprilTehranKish Island o
1 AprilBooshehrMashhad o
1 AprilBooshehrTehran o
1 AprilBooshehrKharg Island o
1 AprilBandar AbbasTehran o
2 AprilTehranKish Islando
2 AprilTehranQeshm Island o
2 AprilBandar AbbasTehran o
3 AprilBandar AbbasKish Islando
3 AprilBooshehrTehran o
3 AprilTehranChabaharo
Publisher’s Note: MDPI stays neutral with regard to jurisdictional claims in published maps and institutional affiliations.

