Article

Source Apportionment and Health Risk Assessment of Heavy Metals in PM2.5 in Handan: A Typical Heavily Polluted City in North China

1
Department of Environmental Engineering, College of Energy and Environment Engineering, Hebei University of Engineering, Handan 056038, China
2
Hebei Key Laboratory of Air Pollution Cause and Impact, Handan 056038, China
*
Author to whom correspondence should be addressed.
Atmosphere 2021, 12(10), 1232; https://doi.org/10.3390/atmos12101232
Submission received: 28 July 2021 / Revised: 7 September 2021 / Accepted: 17 September 2021 / Published: 22 September 2021
(This article belongs to the Topic Air Pollution and Occupational Exposure)

Abstract

:
In order to determine the pollution sources and human health risks of metal elements in PM2.5, samples were collected by a large flow particulate matter sampler in the four seasons in 2013, 2015, and 2017 (January, April, July, and October). The mass concentrations of 10 metals (Ti, V, Cr, Mn, Ni, Cu, Zn, As, Cd, and Pb) were analyzed. The sources of heavy metals were identified by Unmix, and the potential non-carcinogenic/carcinogenic risk was evaluated. The influences of local and regional sources were also explored during the high-carcinogenic risk period (HCRP). The wind field and 72 h backward trajectories were performed to identify the potential local and regional sources in HCRP. The results showed that the average annual concentrations of PM2.5 in the urban area of Handan city were 105.14, 91.18, and 65.85 μg/m3 in 2013, 2015, and 2017, respectively. The average daily concentrations of the metals in PM2.5 in January were higher than that of April, July, and October. The average mass concentrations of the 10 heavy metal elements in PM2.5 were 698.26, 486.92, and 456.94 ng·m−3 in 2013, 2015, and 2017, respectively. The main sources of the metals in PM2.5 were soil dust sources, vehicular emissions, coal burning, and industrial activities. The carcinogenic risks of Cr and As were above 1 × 10⁻⁶ over the three years. Wind direction analysis showed that the potential local sources were heavy industry enterprises and the economic development zone. The backward trajectory analysis indicated that PM2.5 long transported from Shandong, Henan, and the surrounding cities of Handan had quite an impact on the heavy metals contained in the atmosphere of the studied area. The health risk assessment results demonstrated that the trend for non-carcinogenic risk declined, and there was no non-carcinogenic risk in 2017. However, the carcinogenic risk levels were high over the three years, particularly in January.

1. Introduction

A number of large-scale regional haze pollution events have occurred in Beijing–Tianjin–Hebei (BTH) since 2010. The BTH region is not only the political and cultural center, but also an important core industry area in China. For example, the air quality of 47.6% of the days in 2015 failed to meet Class II of China’s air quality standards in 13 cities of BTH. The proportion of days with mild, moderate, severe, and heavy pollution were 27.1%, 10.5%, 6.8%, and 3.2%, respectively [1]. The most haze-polluted regions in China were mainly located in BTH, especially in the south of Hebei Province [2,3]. Serious haze pollution affects human health and economic development. Some researchers have found that PM2.5 is closely related to the generation of haze [4,5].
Fine particulate matter (aerodynamic diameters < 2.5 µm) is detrimental to human health due to its small size that can easily go through the bronchus and deep into the blood. The complex compositions of particulate matter such as organic (OC) and elemental carbon (EC) and heavy metals can lead to a variety of diseases. Heavy metals, in particular, because of their high toxicity at low concentration thresholds, easy enrichment, and persistent bioavailability, pose a threat to human health through intake, specified as Class I carcinogens for humans by the International Agency for Research on Cancer (IARC) in 2013 [6,7]. For instance, excessive ingestion of Cr can cause irreversible damage to DNA and can produce respiratory inflammation [8]. As its compounds are heritable, mutagenic, and carcinogenic, poisoning of As can cause irreversible damage to the body by inducing abnormal apoptosis of cells [9]. Thus, source apportionment and health risk assessment of heavy metals in PM2.5 can be considered a productive method to provide a theoretical basis for investigating the local air pollution situation and implementing early preventive measures.
Anthropogenic sources provide a great contribution of heavy metals in PM2.5 that are known to originate from the combustion of fossil fuels, coal burning, soil dust, industrial emissions, vehicle emissions, and so on. Receptor models are commonly used for identifying pollution sources and quantifying source apportionments. Many researchers have applied different receptor models to qualitatively analyze the source species and quantitatively calculate the source contribution of the metals in PM2.5 [10,11,12]. Chemical mass balance (CMB), principal component analysis/factor analysis–multiple linear regression (PCA/FA-MLR), positive definite matrix factor analysis (PMF), and Unmix are common receptor models [13,14,15,16,17,18]. For evaluating the accuracy and applicability of identifying PM sources, Unmix was chosen in this study. The Unmix model is a simple yet effective tool for identifying possible source contributions without source profiles, which estimates the source profiles and contributions of sources using the singular value decomposition (SVD) method [19,20]. The source apportionment of PM by Unmix has been widely used.
Many researchers have ascertained that the pollution level in the heating period of air pollution is more serious than other times by studying pollution characteristics and identifying the source of PM2.5 [4,12,21,22,23,24,25]. As a typical heavy industry city, Handan has one of the worst ambient air qualities in China. Current studies regarding PM2.5 in Handan are mostly focused on the characteristics of the concentrations and origins, while seldom have studies assessed the human health risk in heavy metals throughout the four seasons, rather than only in the heating period [2,23,26]. To the best of our knowledge, regional mass transport has an impact on the concentration of PM2.5 [27]. When assessing the health risk of PM2.5-bound heavy metals, the effect of wind direction and long-distance air mass transport is vital. Combining the high human health risk period and wind direction can not only provide more details about the source information of heavy metals but can also be conducive to guiding residents to take more reasonable advanced protective measures.
The major objectives of this research were to: (a) Measure the concentrations of 10 elements (Ti, V, Cr, Mn, Ni, Cu, Zn, As, Cd, and Pb) in PM2.5 in January, April, July, and October in 2013, 2015, and 2017; (b) identify the sources of heavy metals by Unmix; (c) assess the health risks of heavy metals; (d) investigate the potential influence of wind direction and the air mass transboundary movement in the highest carcinogenic risk period (HCRP).

2. Materials and Methods
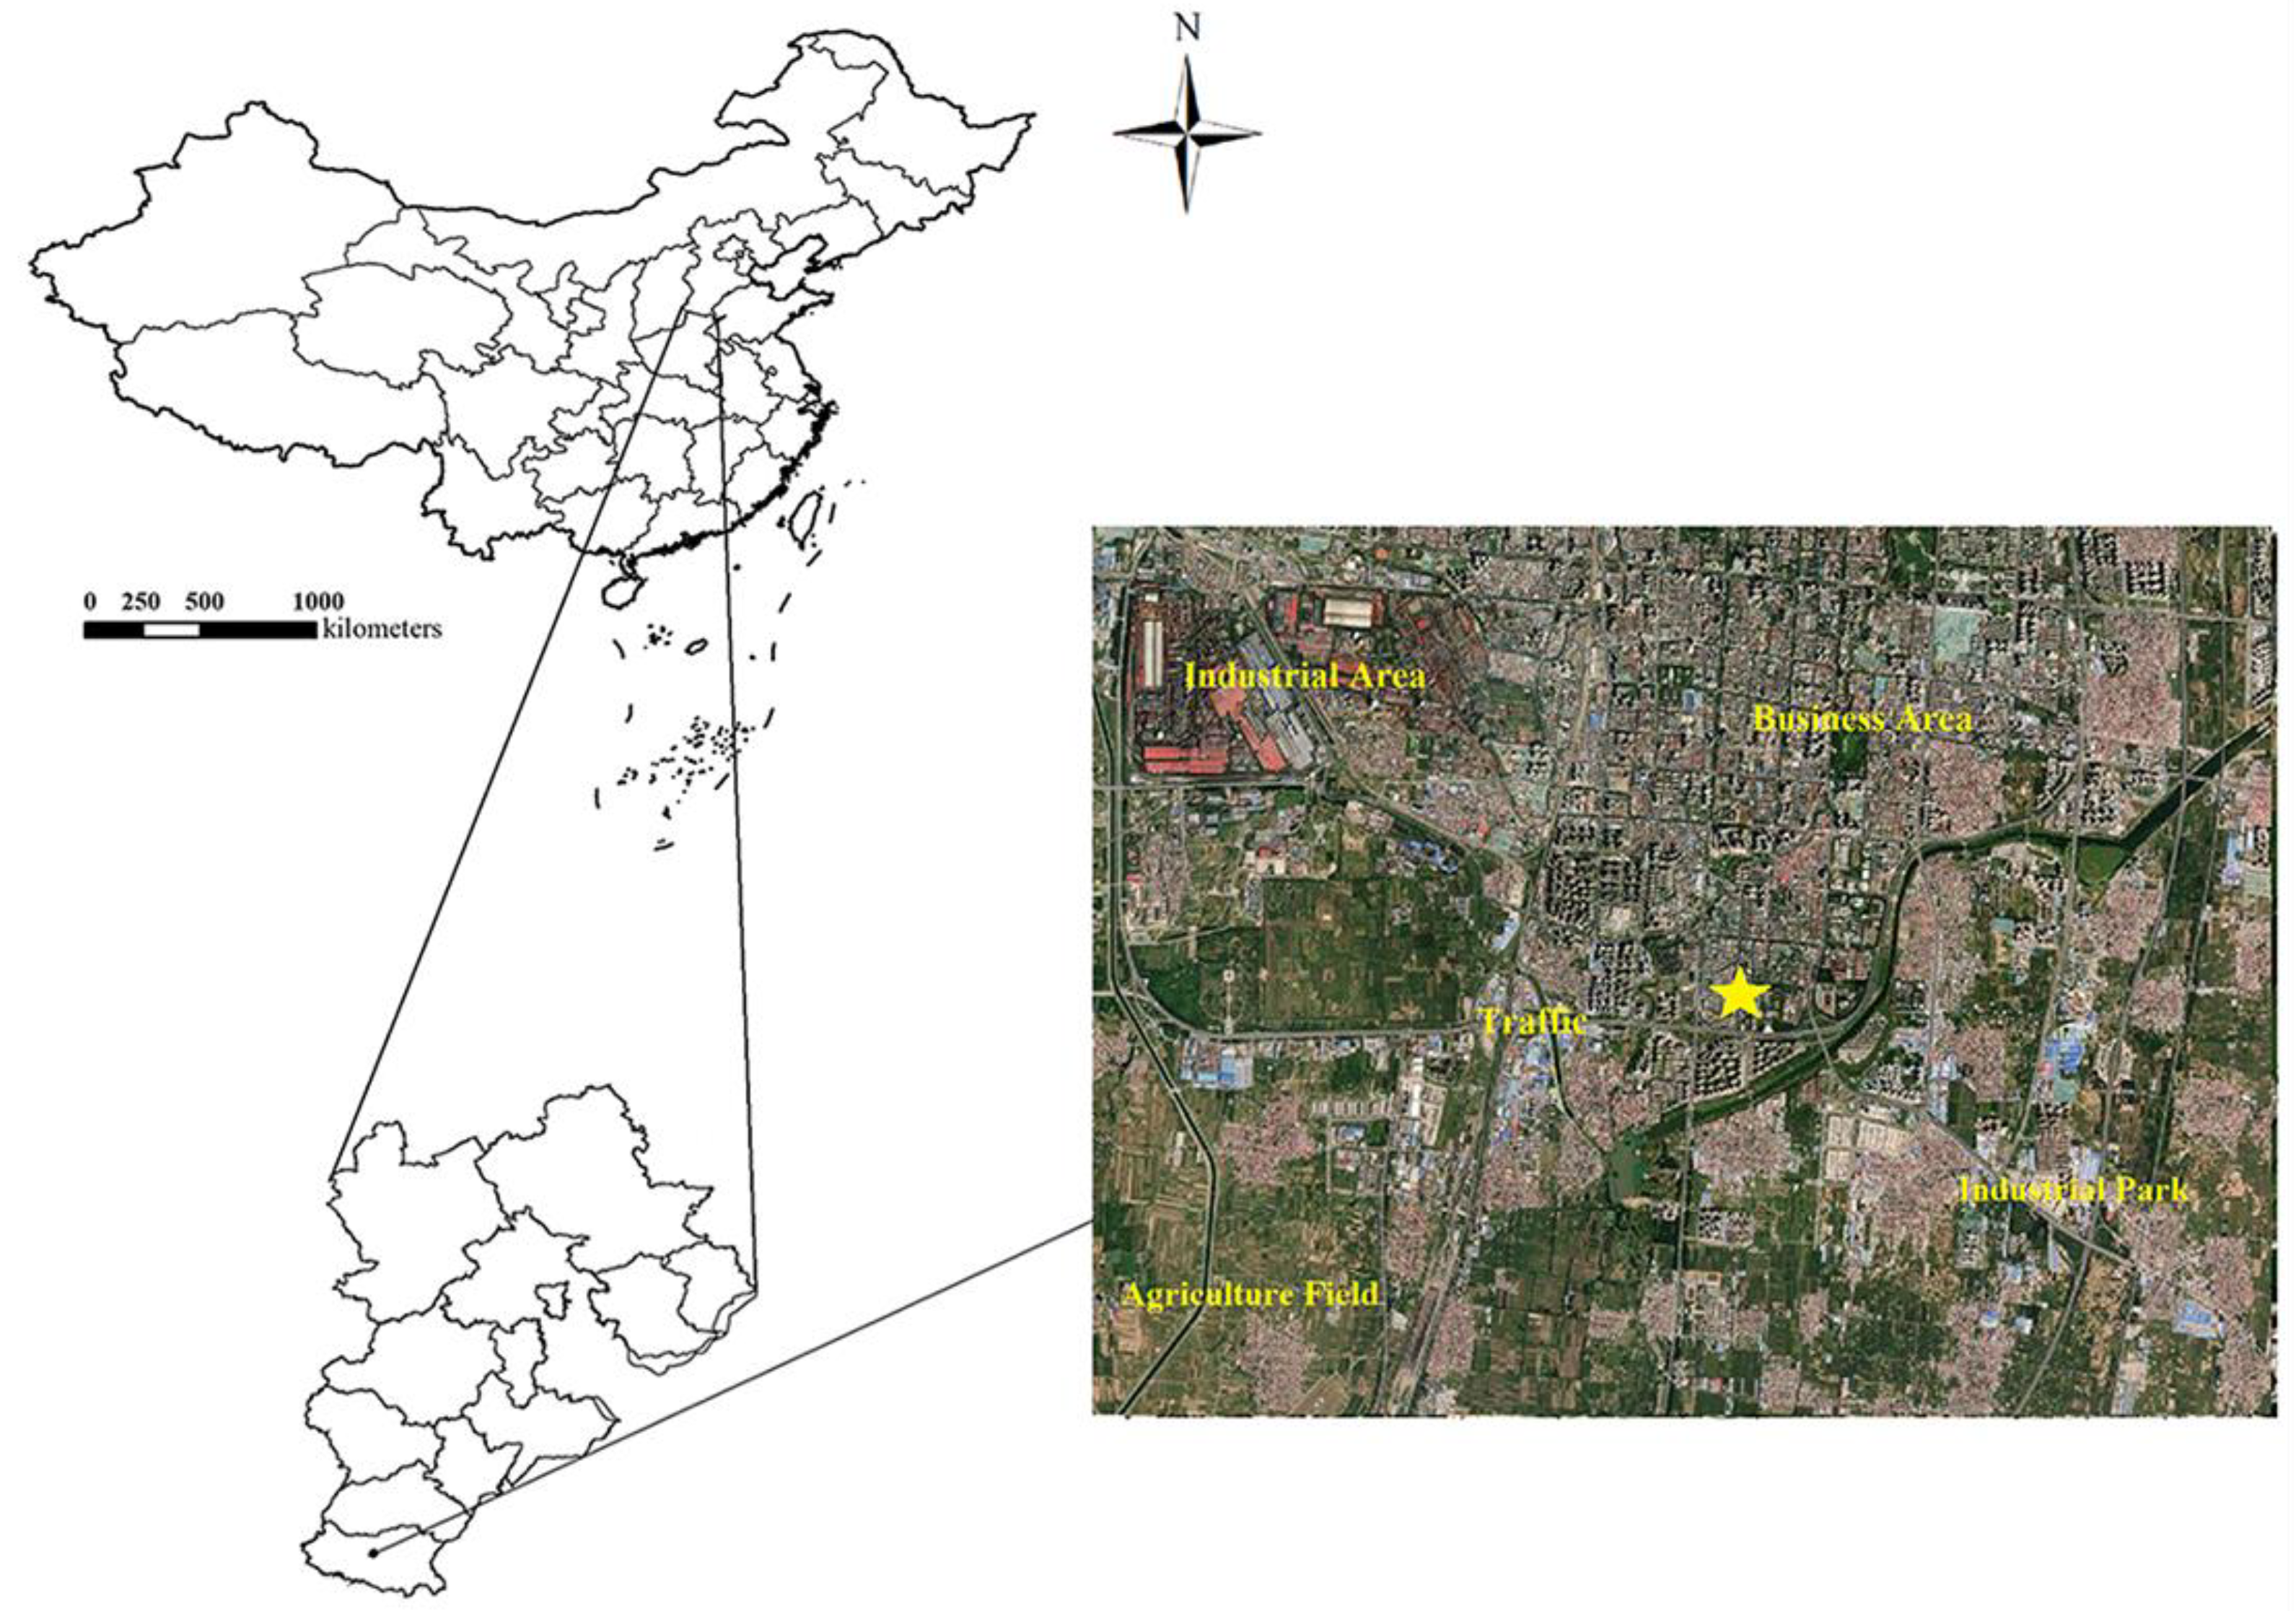
2.1. Sampling Site

Handan is located in the south of Hebei Province. It belongs to the boundary of Taihang Mountain and the North China Plain. The total urban area is 12,073.8 km2, and the resident population is 9,549,700. The main climate is temperate continental, and the average annual temperature is 13.5 °C. The sampling site (36.57° N, 114.51° E) is located on the roof of a four-floor building inside a university, approximately 12 m above the ground, as shown in Figure 1. The sampling period took place in January, April, July, and October in 2013, 2015, and 2017. The four months represent winter, spring, summer, and autumn, respectively. The PM2.5 samples were collected every day from 08:00 a.m. to 7:30 a.m. on the next day by a high-volume PM2.5 air sampler (Thermo Scientific Co. Rockford, AL, USA) with 20.3 cm × 25.4 cm quartz filters and a flow rate of 1.13 m3·min−1. A total of 355 PM2.5 samples were collected.

2.2. Chemical Analysis

A circle with a diameter of 2 cm was punched from the sample membrane, folded in half, and placed into a digestion tube made of polytetrafluoroethylene. Then, 8 mL of HNO3 and 0.5 mL of H2O2 were added to the digestion tube. The samples were dispelled by MARS model microwave digestion apparatus (CEM Inc, Matthews, NC, USA). All of the experimental reagents were of optimal grade, and the water used in the experiments was ultrapure water. The elements (Ti, V, Cr, Mn, Ni, Cu, Zn, As, Cd, and Pb) were measured by an X SERES 2 inductively coupled plasma mass spectrometer (ICP-MS) (ThermoFisher, Waltham, MA, USA). To guarantee the accuracy of the experiment, a blank sample was used for the control in this study. The experimental results showed that the background value of the metal elements in the blank filter membrane was lower than the detection limit of the instrument.
A total of 344 PM2.5 samples were measured for heavy metals. The concentrations of Cd and Ni in April, July, and October in 2013 were found to be below the detection limit.

2.3. Unmix

Unmix is recommended to quantify the source apportionments of heavy metals by USEPA. It is based on non-negativity constraints and reduces the dimension of data space by using the singular value decomposition (SVD) method to ascertain the number of sources [28], expressed as:
C i j = l = 1 p ( k = 1 p U i k D k l ) V l j + ε i j
where U is the n × p diagonal matrix, D is the p × p diagonal matrix, V is the p × m matrix, and εij is the error term that contains all of the variability in Cij but is exclusive of the first major principal components (p).
The self-design curve resolution of Unmix ensures the results of source contribution and apportionment, which obey the non-negative constraints within the allowable error bound of the model. The source contributions are considered to be a linear combination of the component in different unknown sources. The results of source composition and source contribution are positive. More specific graphical examples and algorithm details of Unmix can be seen in the user guide of Unmix [29].

2.4. Human Health Risk Assessment

The normal average daily dose (ADD; μg/m3) is used to represent non-carcinogenic metals such as V, Cr, Mn, Ni, As, and Cd, while the lifetime average daily dose (LADD; μg/m3) is used to represent carcinogenic metals such as Cr, Ni, As, Cd, and Pb [30,31,32].
The exposure dose rate can be calculated using the following equation:
ADD(LADD) = (C × ET × EF × ED)/AT
where C represents the concentration of heavy metals (μg/m3), ET is exposure time (h/day), EF is the exposure frequency (day/a), ED is the duration of exposure (a), and AT is the average exposure time (h).
The hazard quotient (HQ) can be calculated for non-carcinogenic risks based on the equation below:
H I = H Q = A D D RfC × 1000   μ g / m 3
where RfC refers to the inhalation reference concentrations (mg/m3), HQ is the hazard quotient for non-carcinogenic risks (dimensionless value), and HI is the sum of the HQ, which is used to assess the full potential of the non-carcinogenic risk caused by heavy metals. When the value of HI is greater than 1, the non-carcinogenic risk is unacceptable; when the value of HI is equal to or less than 1, the non-carcinogenic risk can be ignored.
The incremental lifetime cancer risk (ILCR) is calculated using the following equation:
C R T = C R = IUR × L A D D
where CRT is the sum of CR, CR is the total carcinogenic risk of heavy metals, and IUR is the inhalation unit risk (μg/m3)−1. When CR is greater than 10−4, the carcinogenic risk is unacceptable. When CR is between 1 × 10⁻⁶ and 1 × 10⁻⁴, the carcinogenic risk exists. When CR is less than 10−6, the carcinogenic risk can be ignored.
The parameters of the population exposure evaluation mode are listed in Tables S1 and S2 (Supplementary Materials), which exhibited relevant exposure and reaction parameters for metals entering the human body by the respiratory system. The parameters of USEPA have been extensively adopted to carry out health risk assessments in previous studies because of a lack local exposure parameter-related basic data. Nowadays, with the development of exposure parameter studies in China, to adapt to the situation of the local population in China, some parameters have been modified. In this study, suitable exposure parameters were chosen from the technical guidelines for risk assessment of contaminated sites that was released by the Ministry of Ecology and Environment of China [33]. Some studies about the target population exposure dose are closer to the actual results of the local area, which ensures that the results of health risk assessments are more reasonable and accurate [4,25,32].

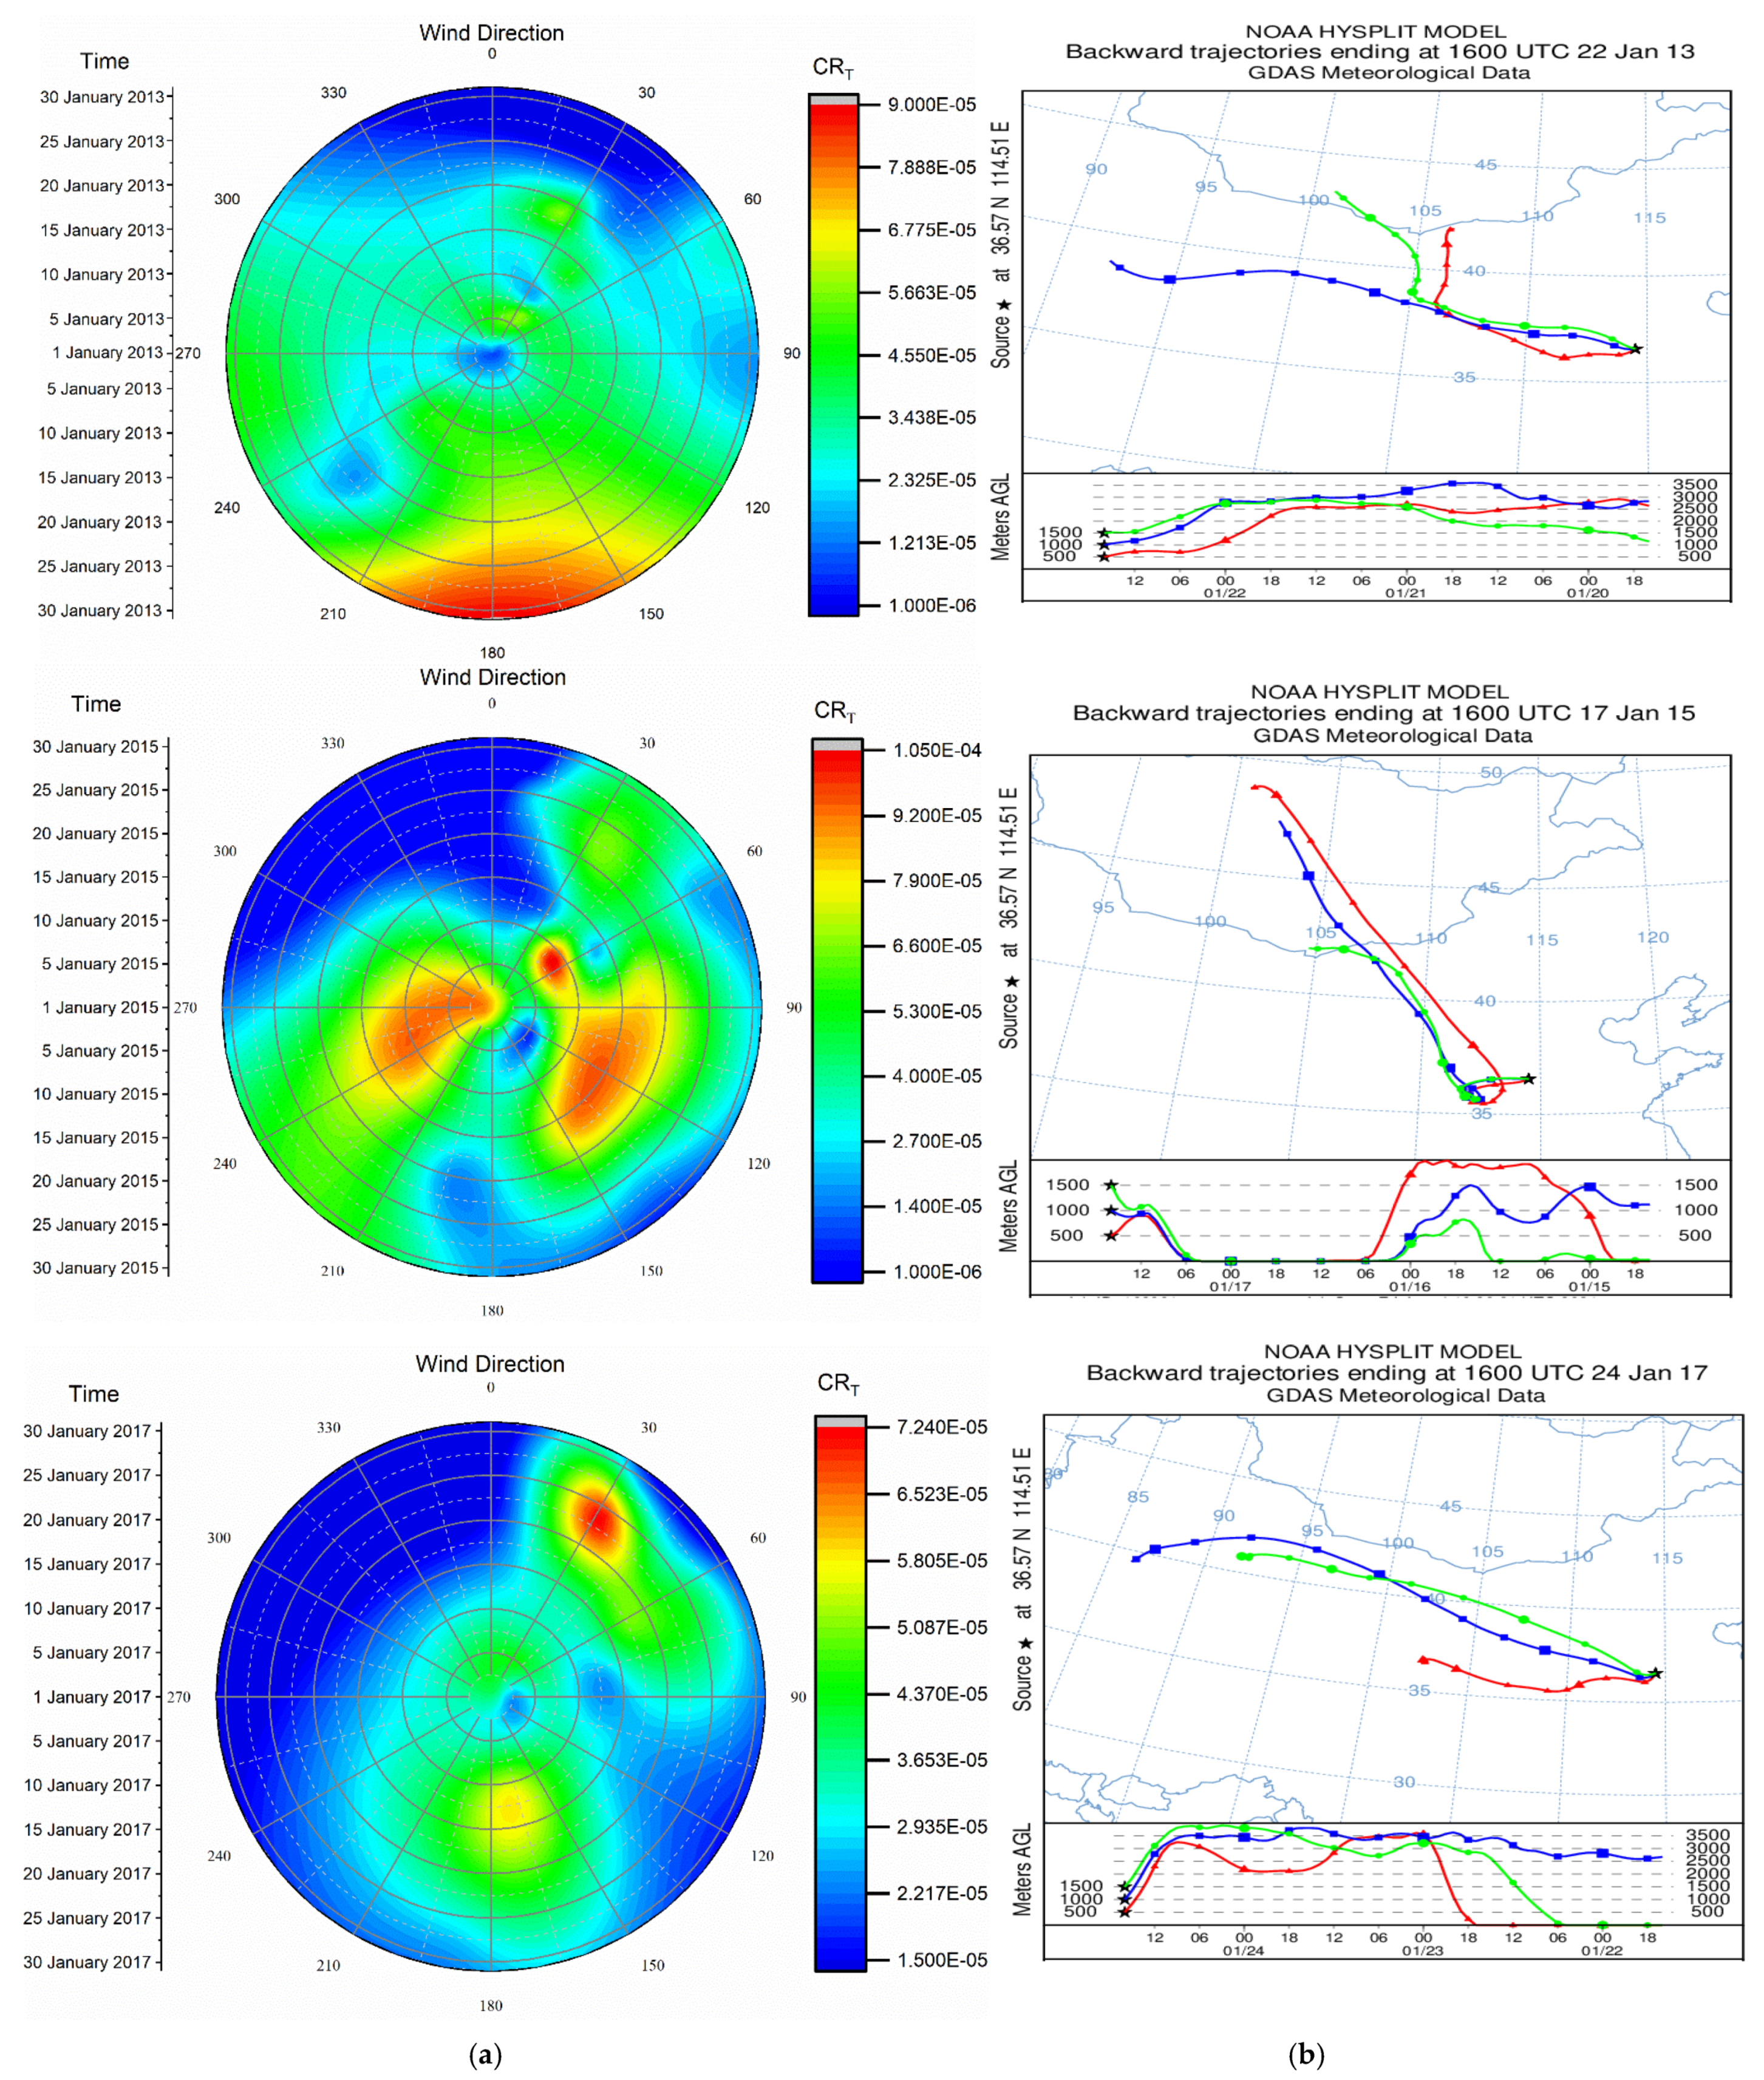
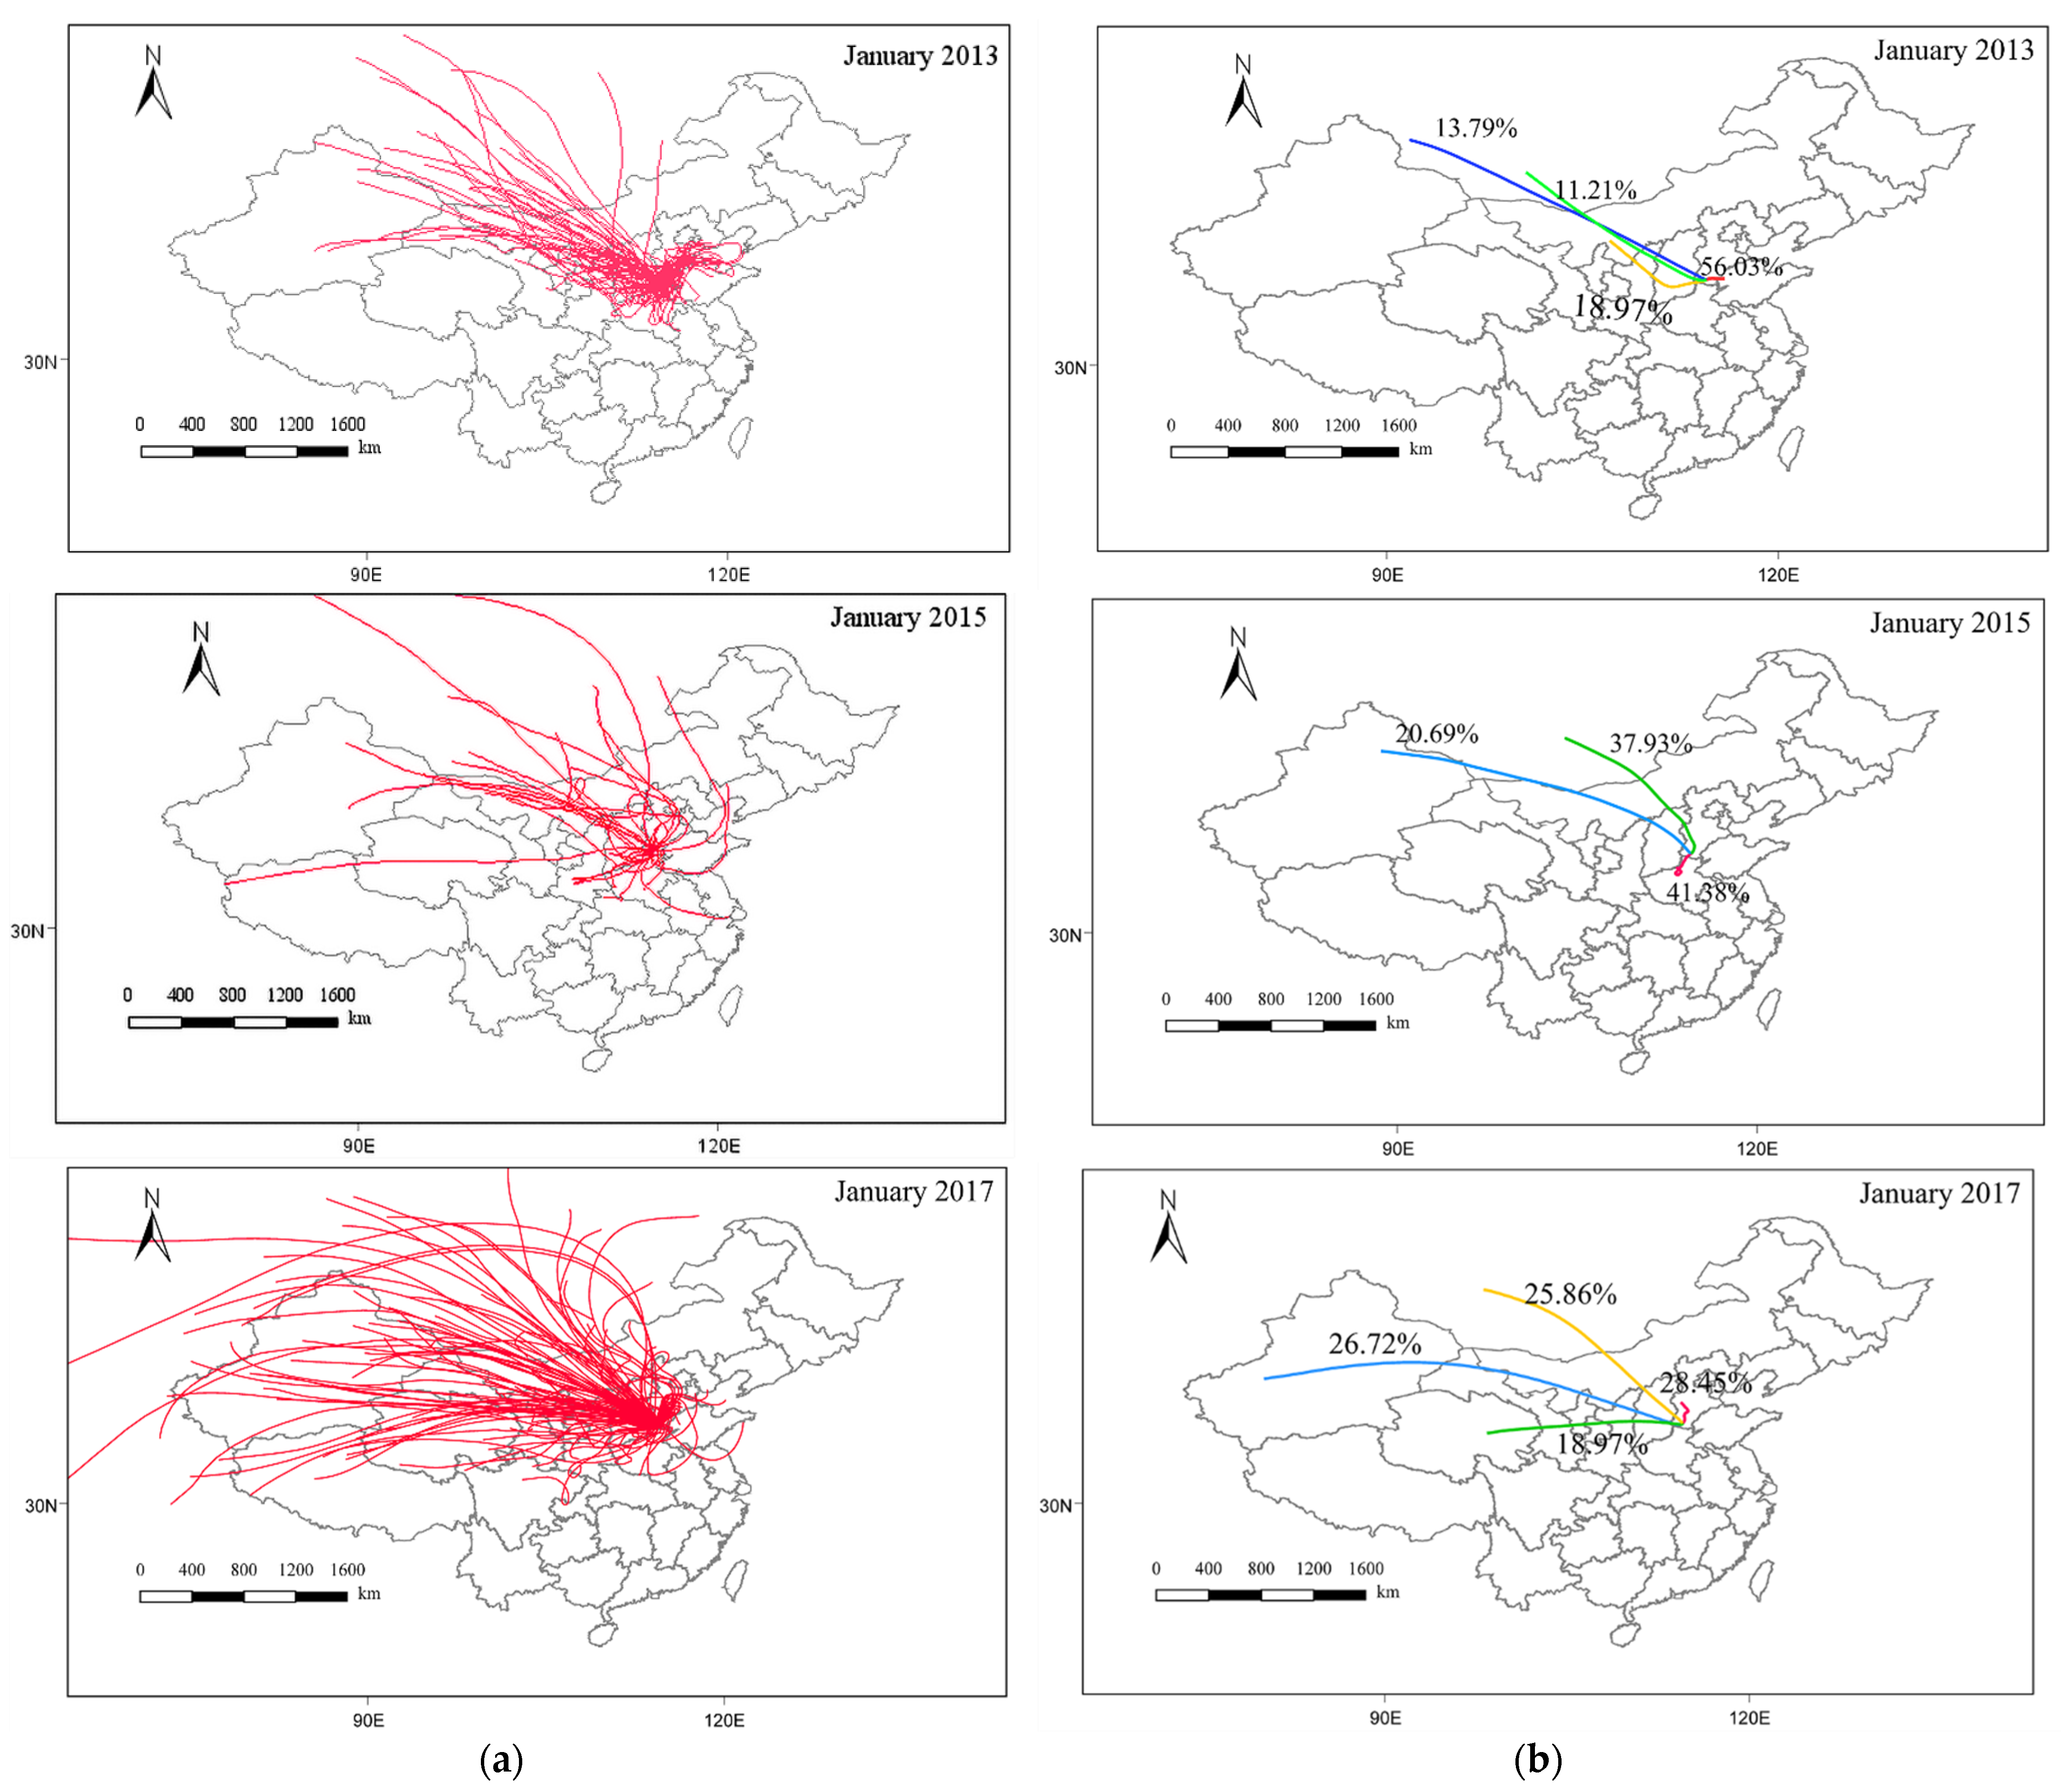
2.5. Air Mass Backward Trajectory and Cluster Analysis

The Hybrid Single-Particle Lagrangian Integrated Trajectory (HYSPLIT) model was developed by the National Oceanic and Atmospheric Administration (NOAA) (http://ready.arl.noaa.gov/HYSPLIT.php) (accessed on 11 June 2021). Global Data Assimilation System (GDAS) data can be downloaded from ftp://arlftp.arlhq.noaa.gov/pub/archives/gdas1 (accessed on 24 June 2021). HYSPLIT trajectory patterns were run online to generate 72 h backward trajectories.

3. Results

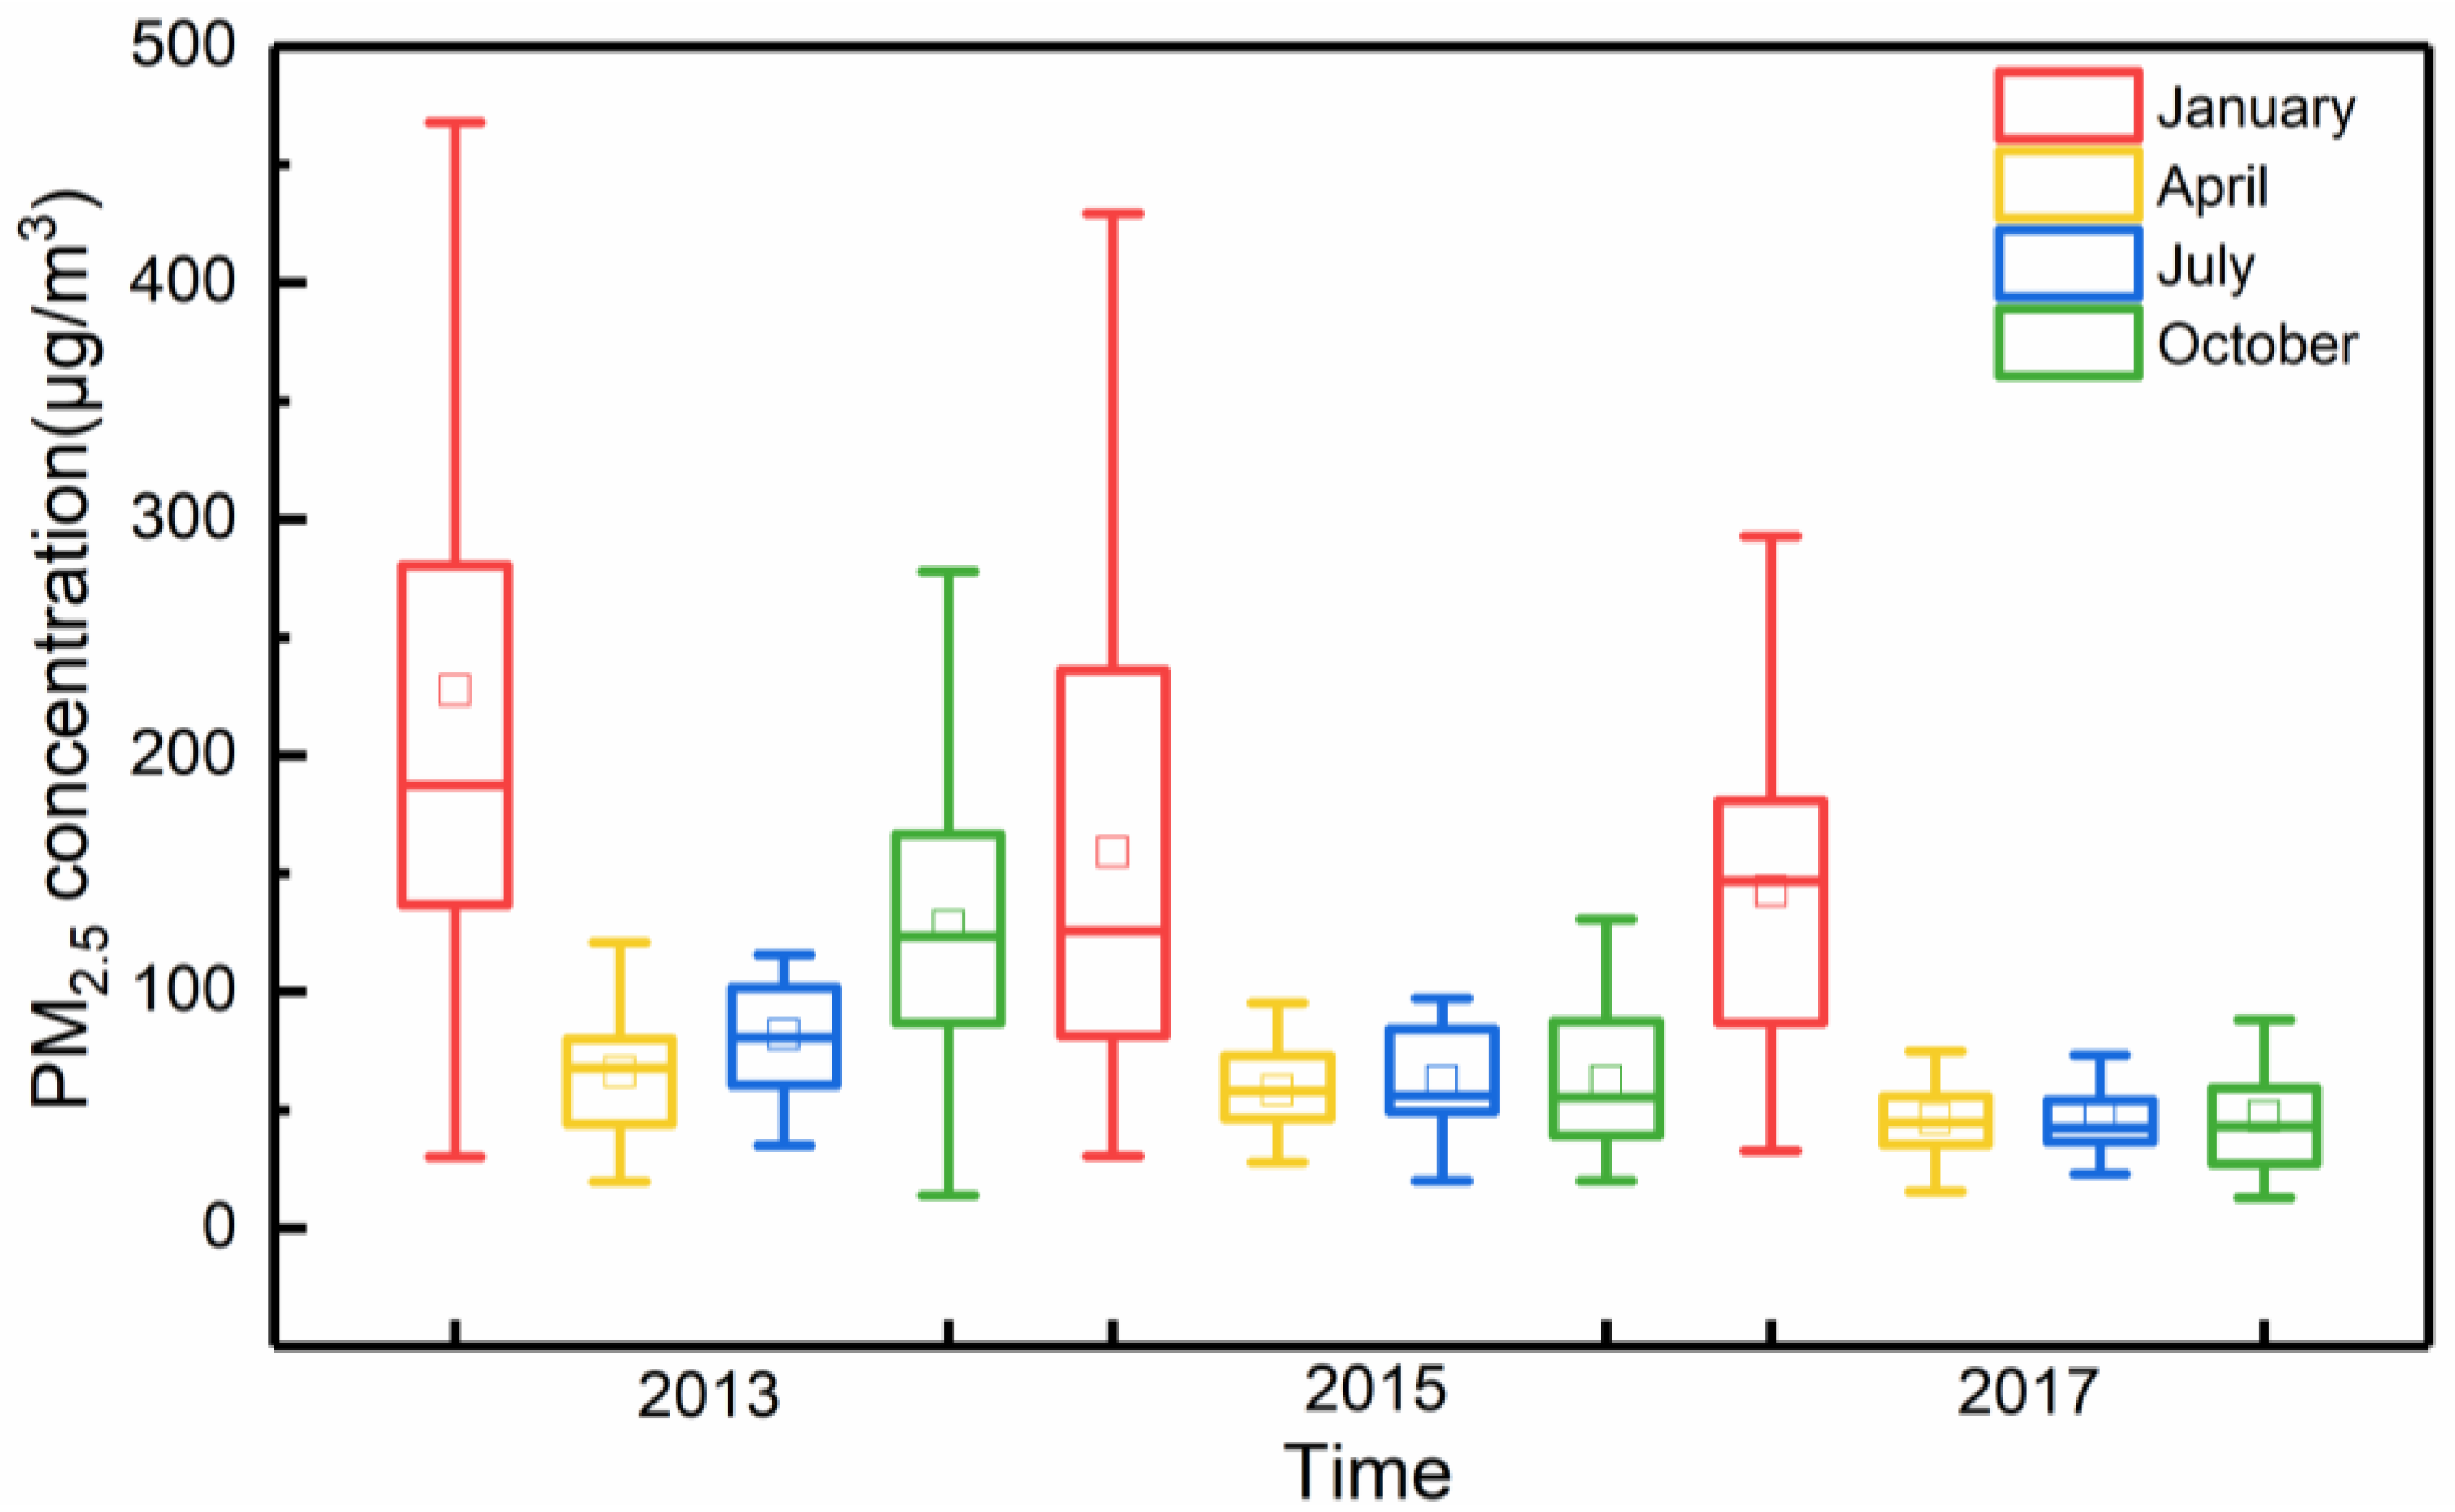
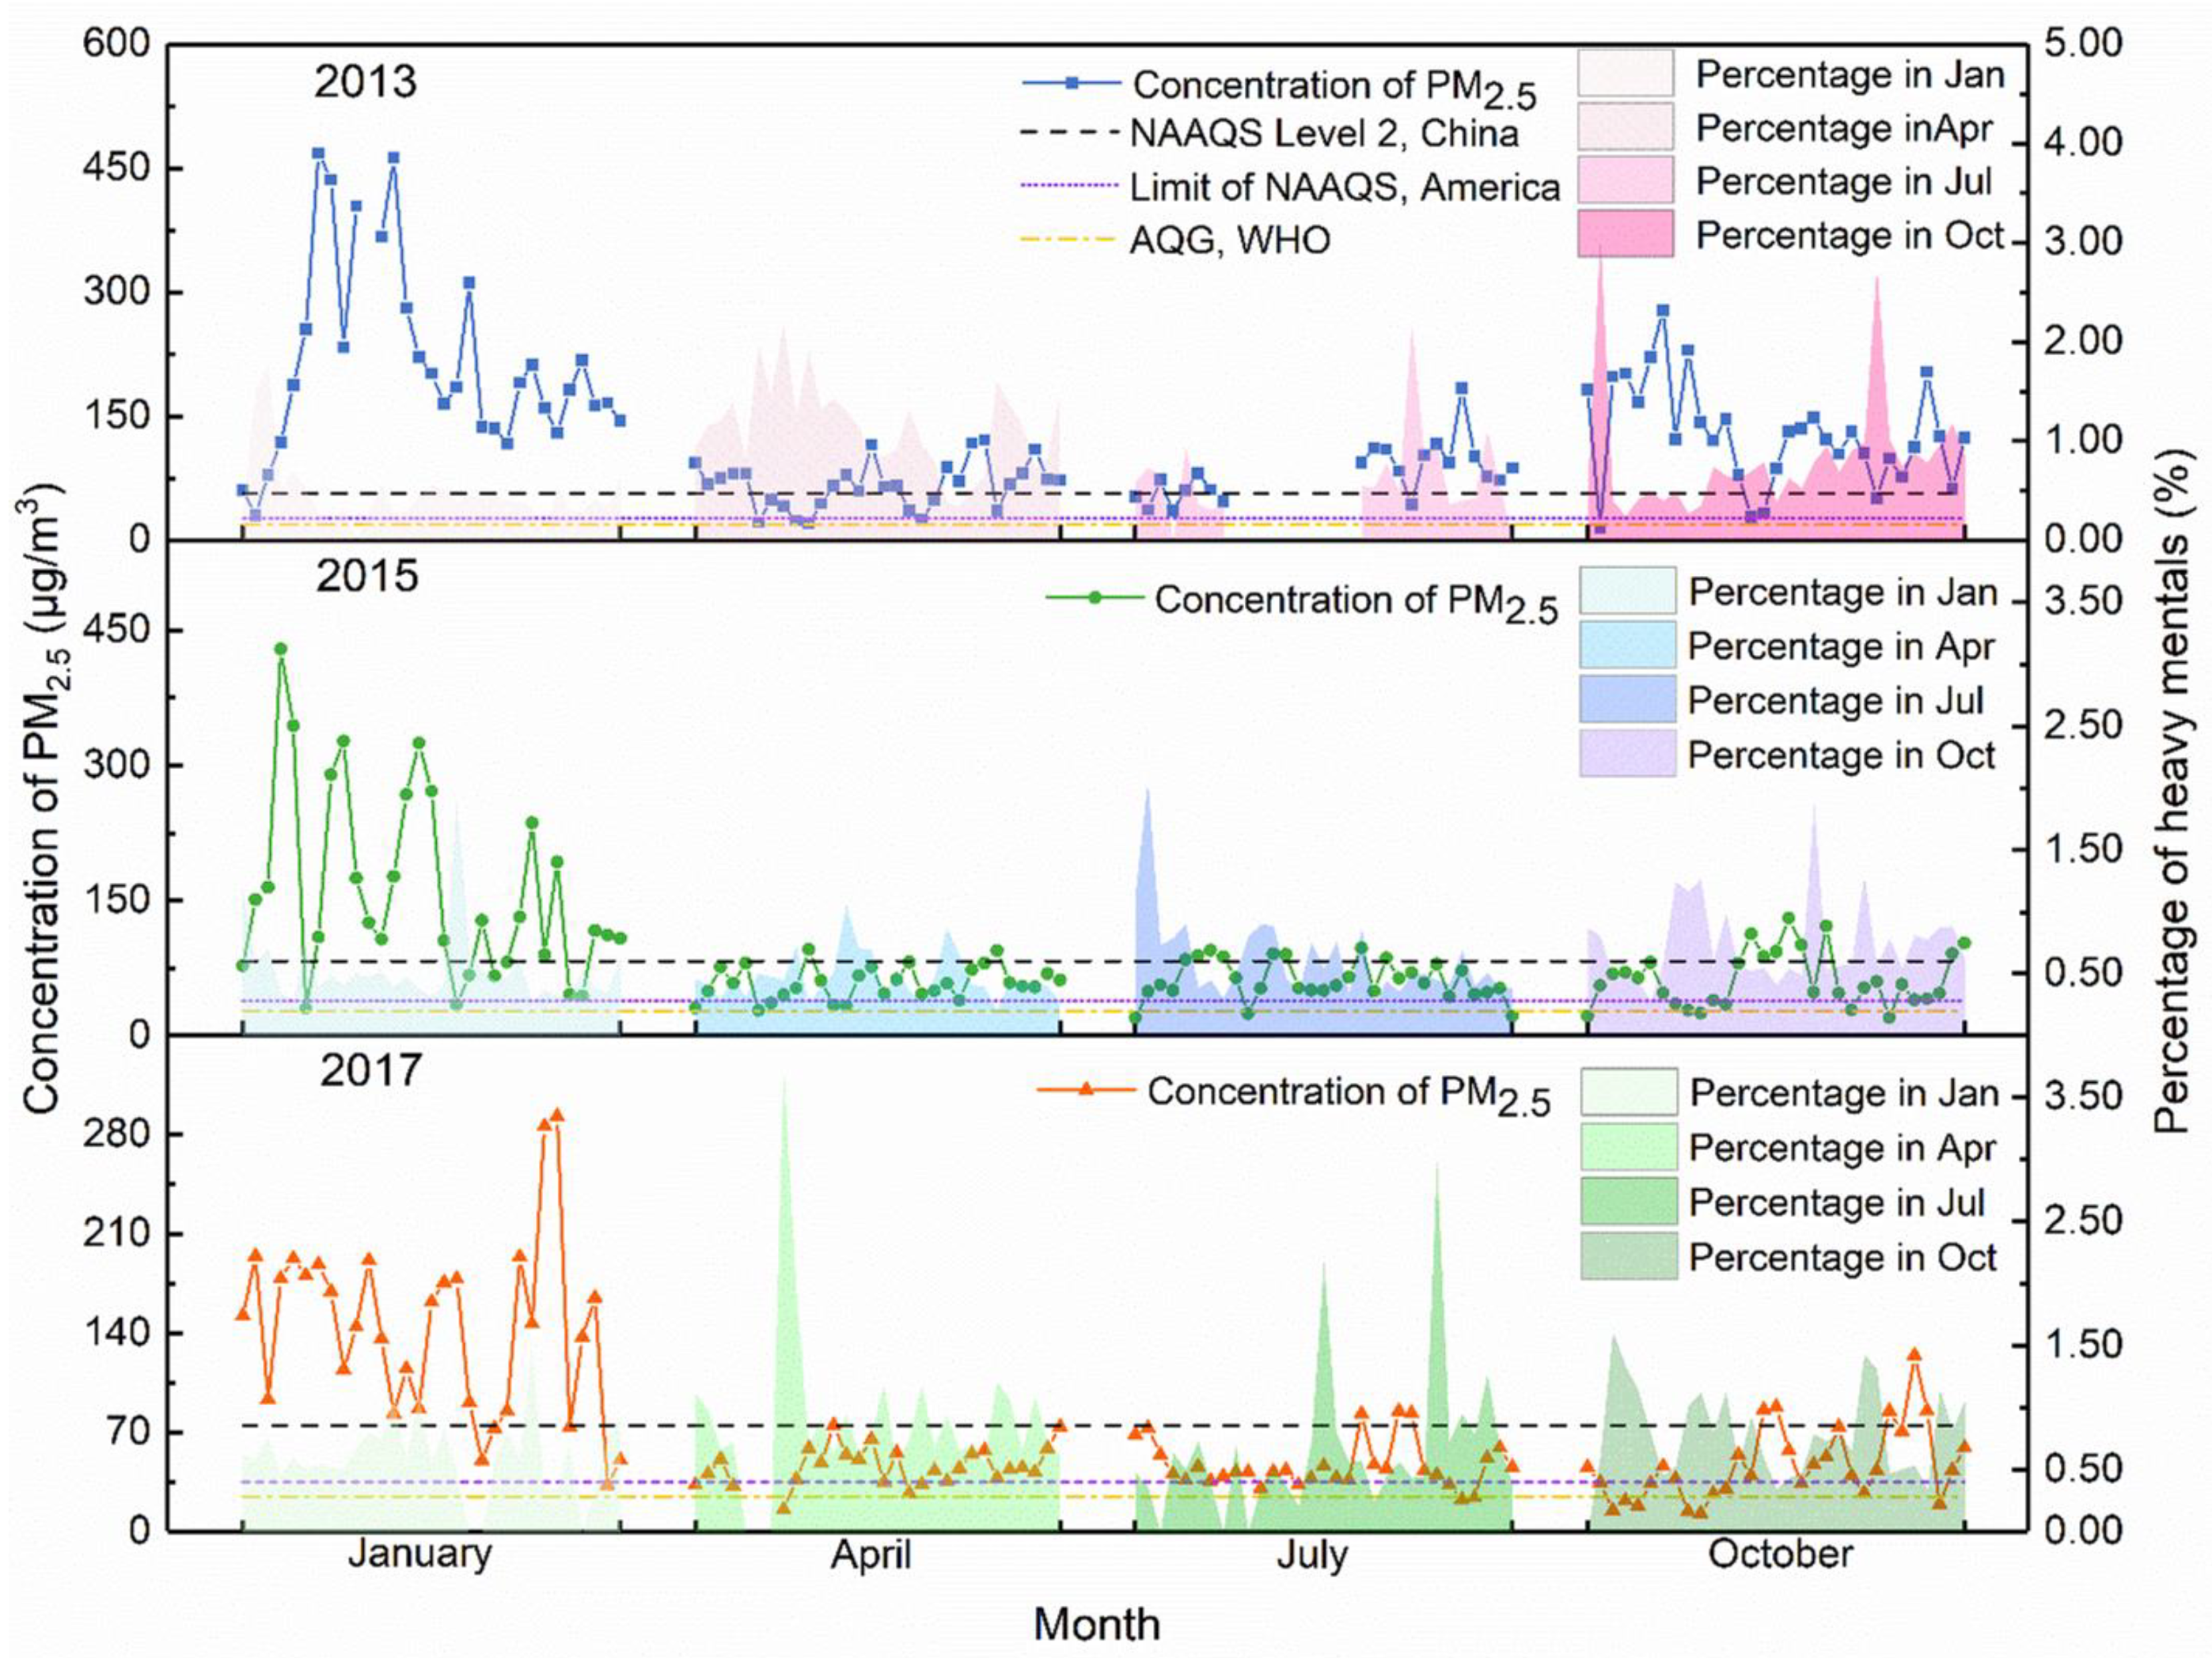
3.1. Pollution Characteristics of PM2.5

The average annual mass concentrations of PM2.5 in Handan in 2013, 2015, and 2017 were 105.14, 91.18, and 65.85 μg/m3, respectively, which shows a decreasing trend year by year. The monthly mean PM2.5 concentrations over the sampling period are shown in Figure 2. As shown in Figure 2, the concentration of PM2.5 in January was the highest. In Handan, the winter climate is mostly affected by the Siberian plateau. Inversion weather is predominant, and the height of the atmospheric boundary layer is low, which is not conducive to the effective diffusion of atmospheric pollutants at low temperatures and low wind speeds [34]. Other seasons have good air mobility and relatively high rainfall, which are conducive to the diffusion of pollutants.
The limit values for PM2.5 in the Chinese, USAEPA, and WHO standards are shown in Table 1. The PM2.5 secondary value of the Chinese Ambient Air Quality Standard (CAAQS) applies to residential areas, mixed areas of commercial traffic residents, cultural areas, industrial areas, rural areas, etc. It is worth mentioning that the standard of CAAQS is relatively lenient compared to the USEPA National Ambient Air Quality Standards (NAAQS) and the WHO Air Quality Guidelines (AQG).
Compared to 2013, the PM2.5 concentration in 2017 decreased by 39.29%, while it was still 2.88 times that of the annual limit (35 μg/m3) of Class Ⅱ of the CAAQS. The data indicate that the overall air quality status in Handan improved year by year, but it was still at a high pollution level (Figure 2). The concentration of PM2.5 showed significant time characteristics, with the highest PM2.5 concentrations in January in the same year, consistent with previous studies [38,39,40,41]. The average 24 h concentrations in January 2013, 2015, and 2017 were 227.70, 159.06, and 142.56 μg/m3, which significantly exceeded the 24 h average limit. There were 29, 25, and 26 days that exceeded the Class II limit in January 2013, 2015, and 2017, respectively. The highest PM2.5 concentration exceeded the Class II limit value of 8.73 times on 11 January 2013.

3.2. Pollution Characteristics of Heavy Metals in PM2.5

The mass concentration of PM2.5 and the proportions of the 10 measured elements during the sampling period are shown in Figure 3. The change in the metal element concentration showed a similar trend to PM2.5 (Figure S1). The monthly concentrations of the elements in January were greater than those of the other months (Table S3). The total concentrations of the 10 metal elements were 698.25 ± 373.20, 486.93 ± 338.54, and 456.94 ± 351.79 ng/m3 in 2013, 2015, and 2017, respectively, accounting for 0.69%, 0.43%, and 0.45% of the annual average total PM2.5 mass concentration. As shown in Figure 3, when the concentrations of PM2.5 were high, the proportion of metals were relatively low. In this study, the maximum proportion of metal elements in PM2.5 was 3.05% (2 October 2013). Water-soluble ions and organic carbon were the main components in PM2.5 on the heavily polluted days [26,42].
The annual average concentrations of the 10 metals in the sampling period are shown in Table 2. The concentrations of Zn and Pb were the highest in PM2.5. The CAAQS specifies that the annual average mass concentration limits of Cr (Ⅳ), As, Cd, and Pb in PM2.5 are 0.025, 6, 5, and 500 ng/m3, and the WHO specifies that the mass concentration limit of Ni in PM2.5 is 25 ng/m3. Cr poisoning is caused by Cr (Ⅳ), while hexavalent chromium in PM2.5 accounts for 13% of the total chromium [43]. Hence, the excess multiples of Cr (Ⅳ) were 32.41, 85.43, and 54.06 times that of the limit value of CAAQS in 2013, 2015, and 2017, respectively. The annual As concentrations were 5.19, 2.25, and 1.99 times, respectively. The annual concentrations of the other heavy metal elements were below the limits specified by WHO and CAAQS. Above all, Cr and As pollution in PM2.5 in Handan was particularly serious.
The coefficients of variation for the metal elements were greater than 0.5 in all years for PM2.5. Therefore, it can be preliminarily judged that the concentration of metal elements in PM2.5 varies greatly.

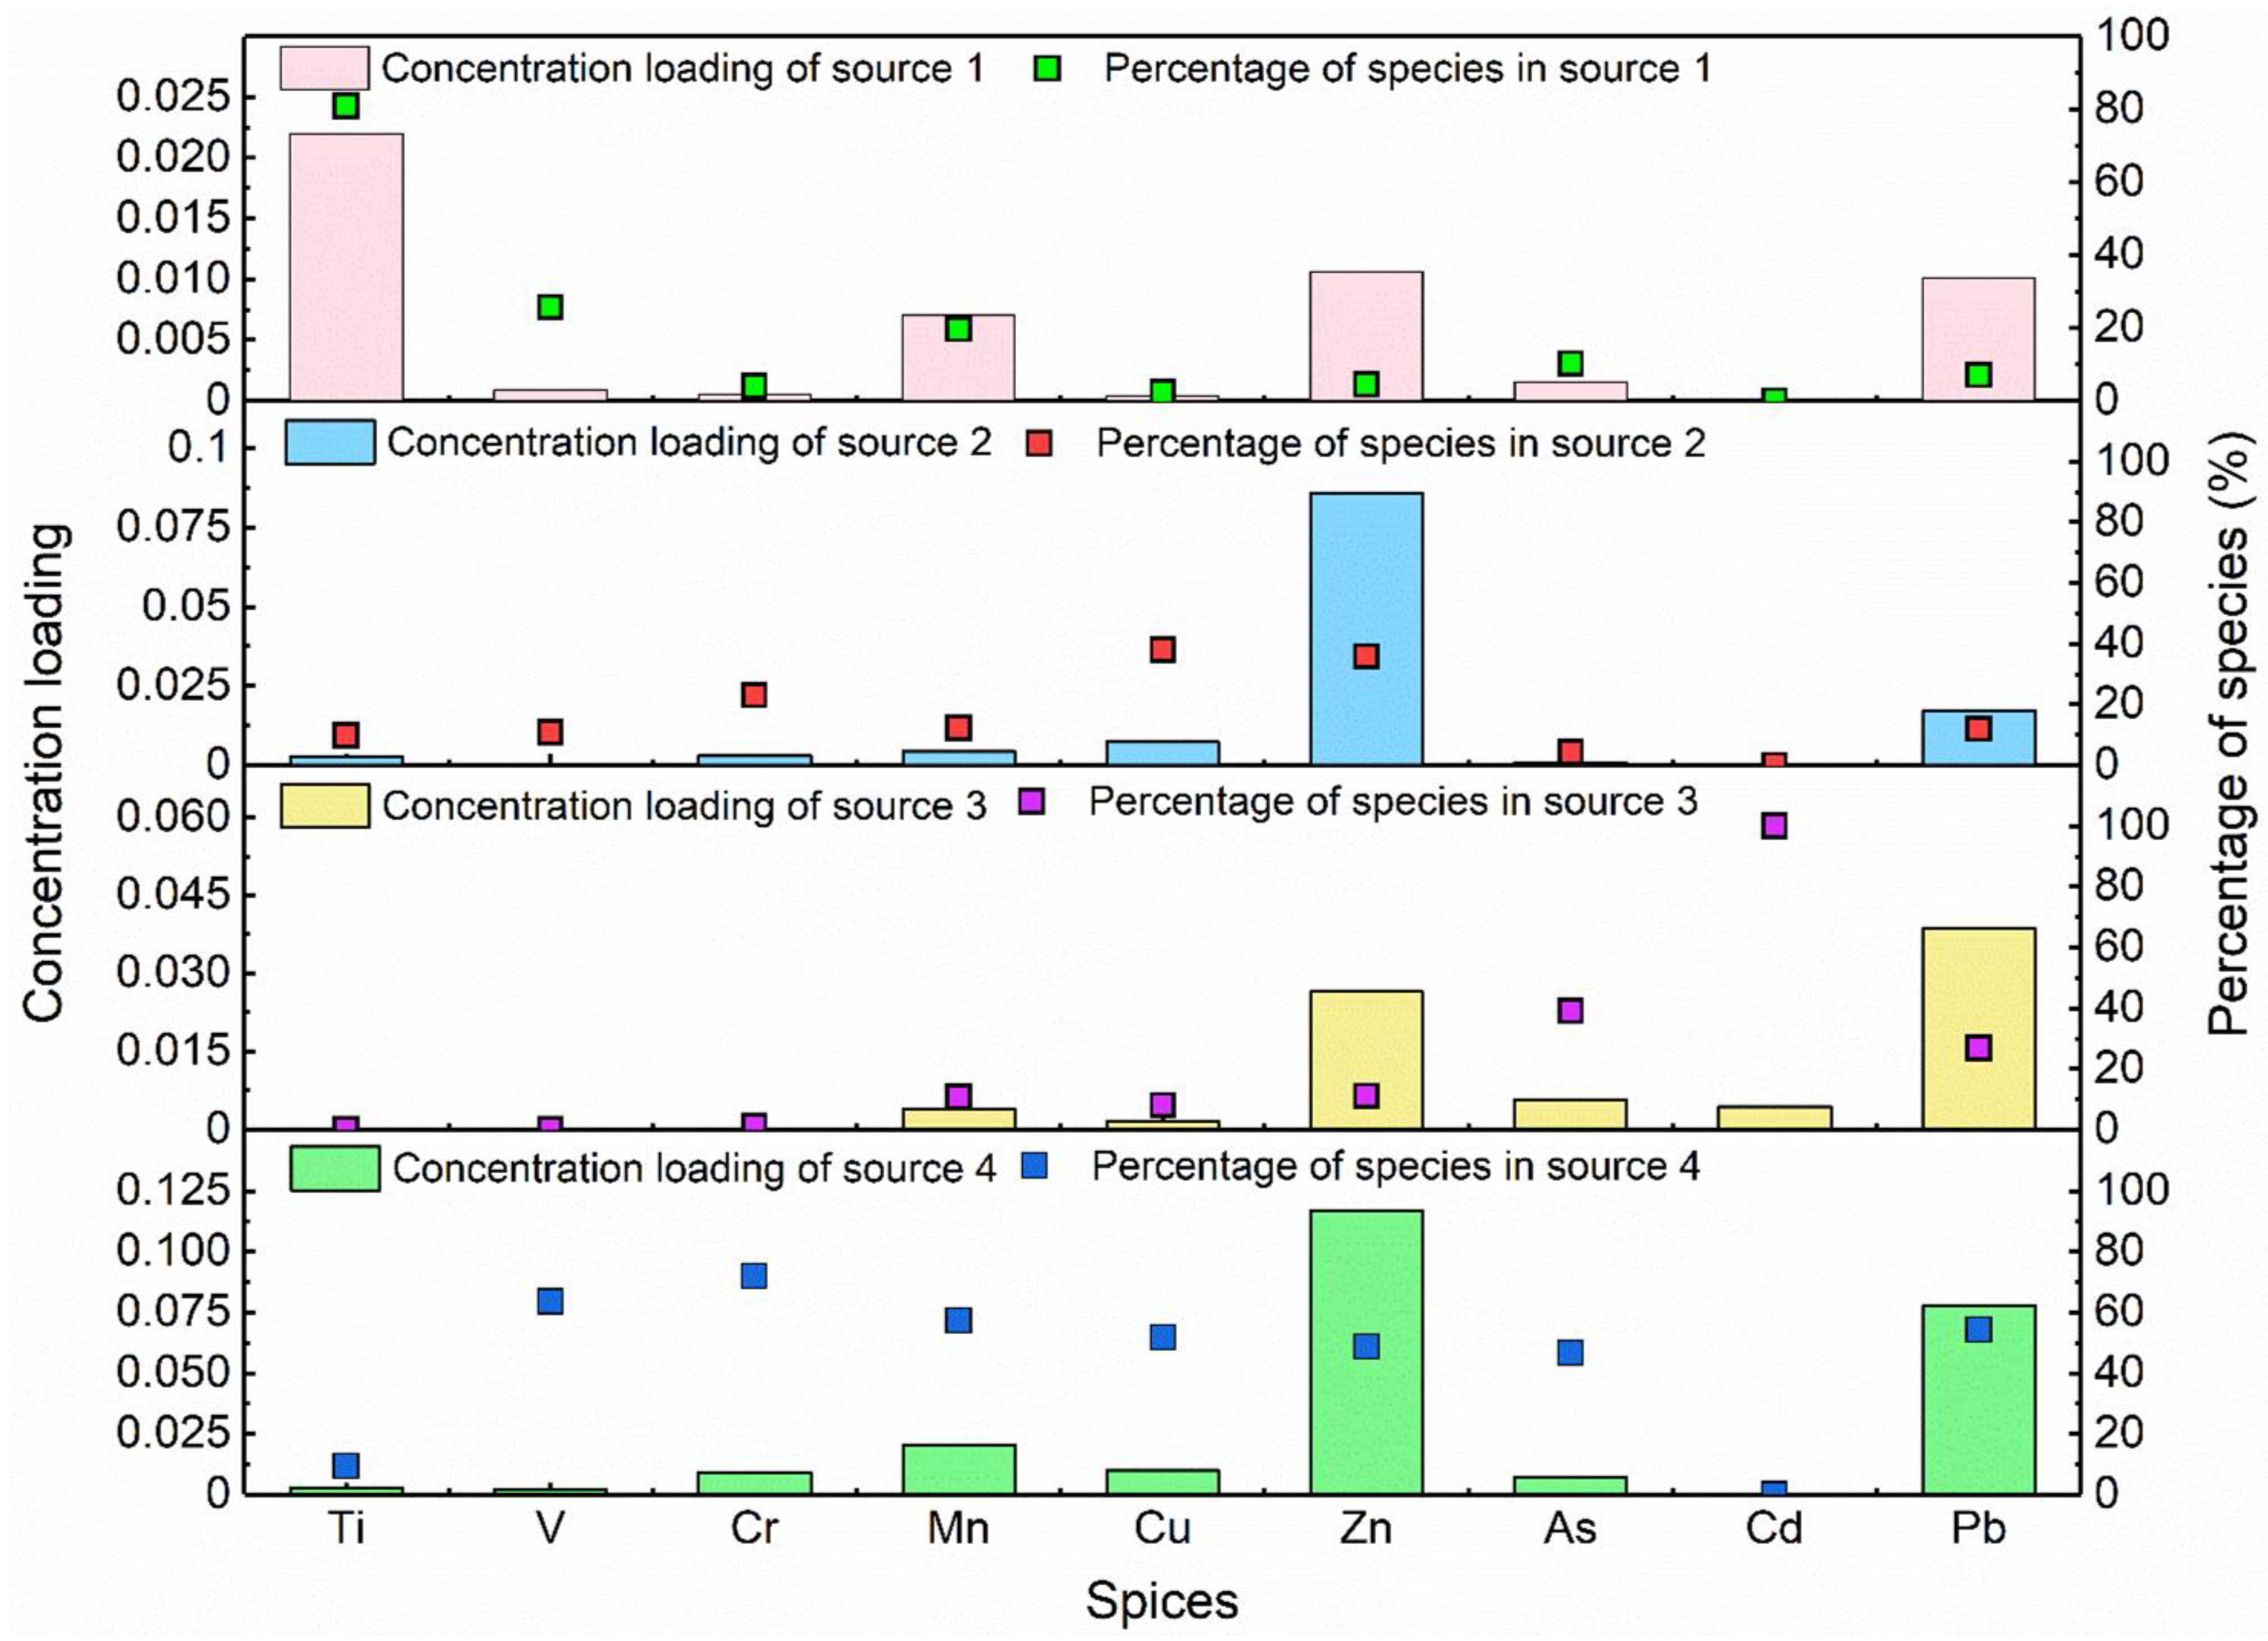
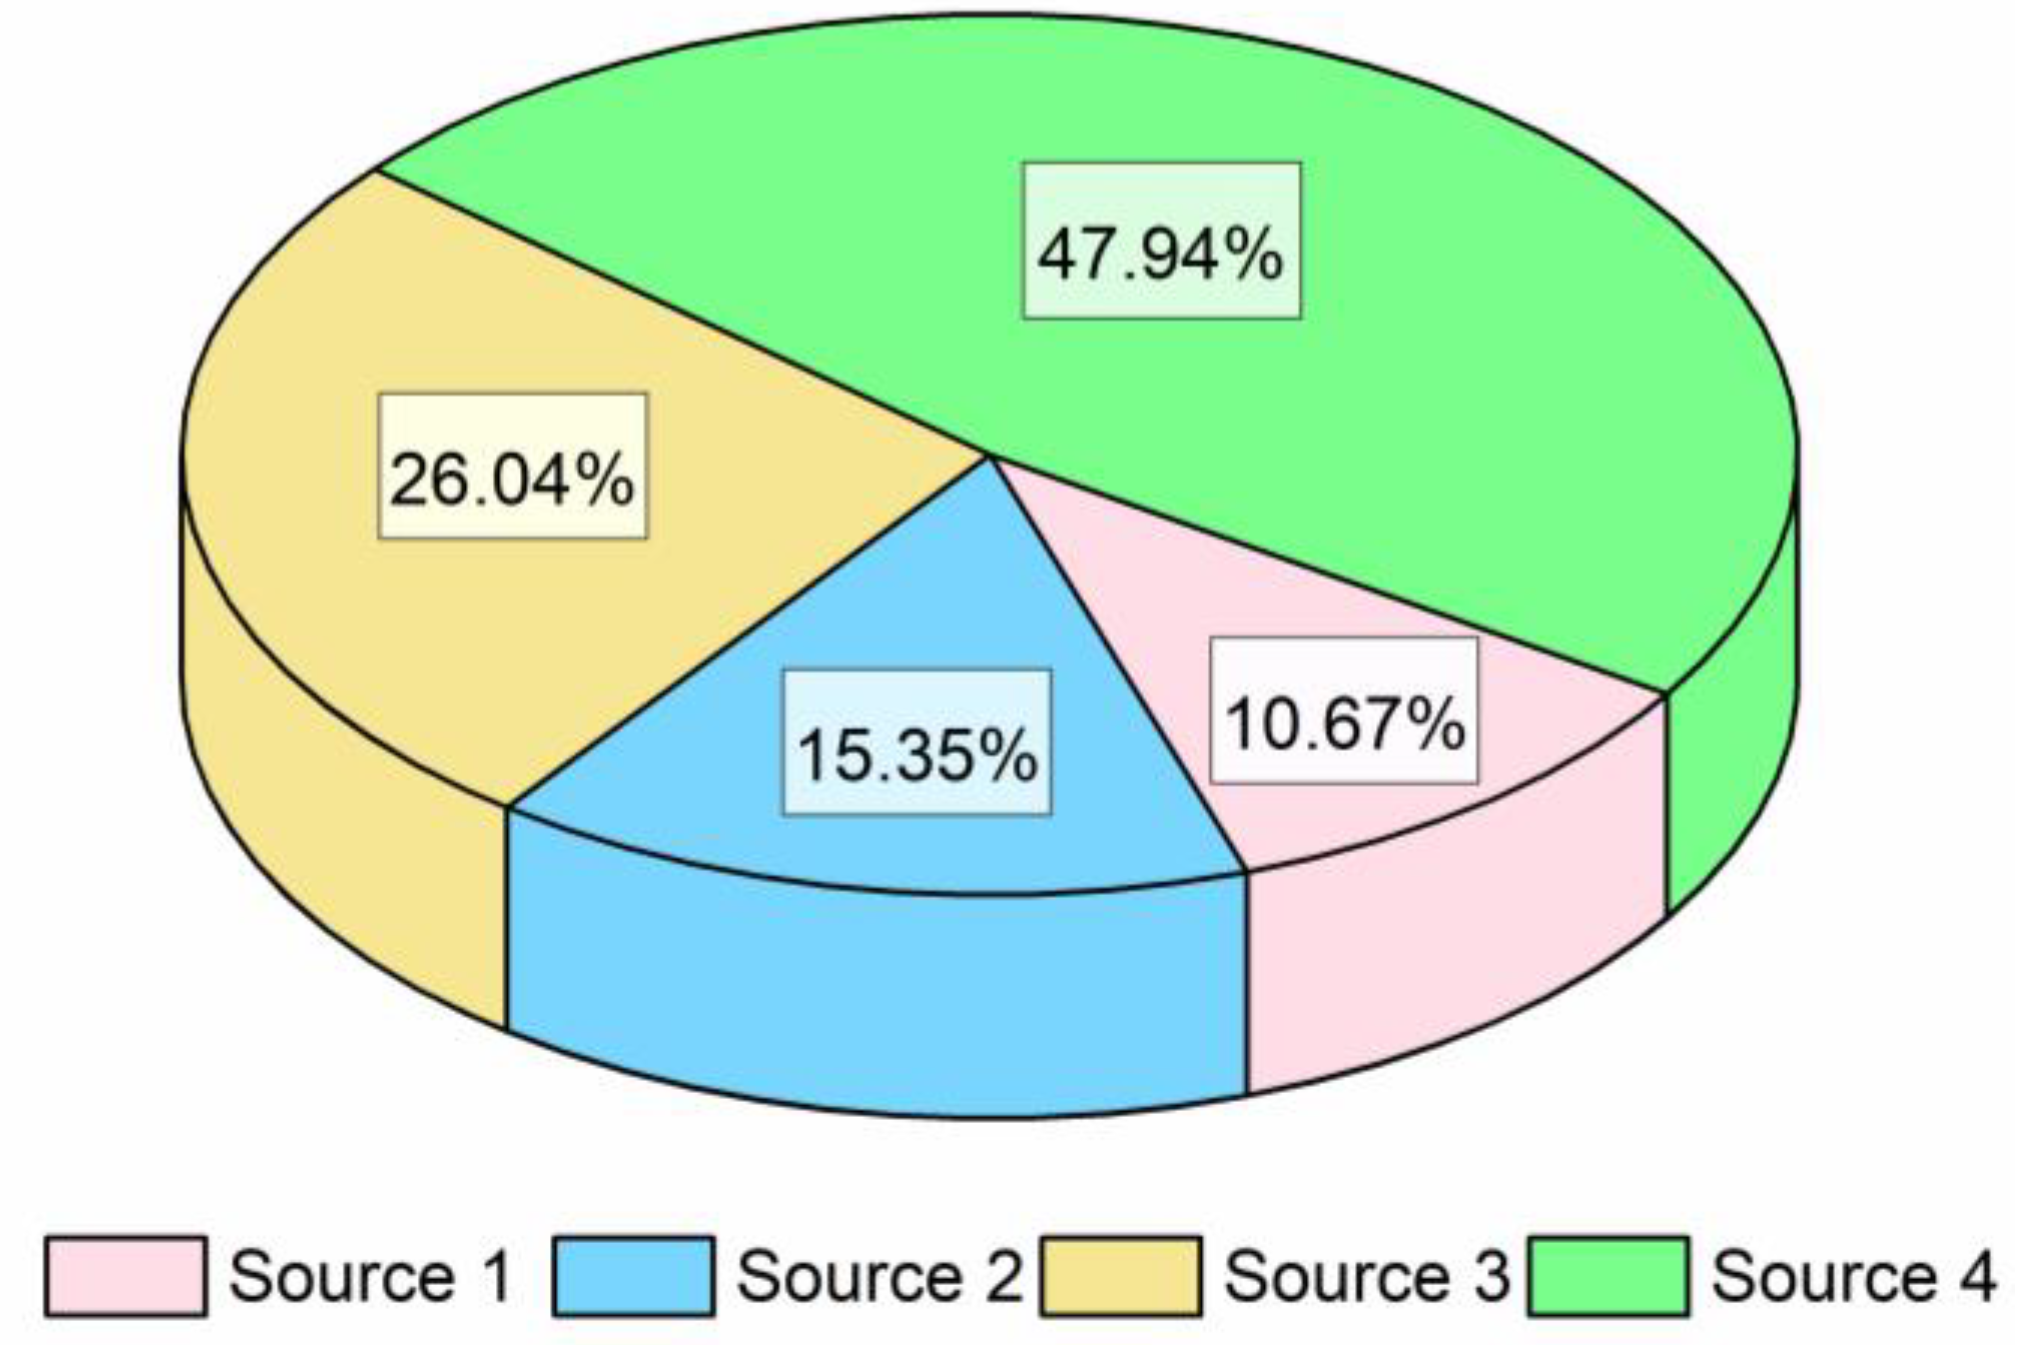
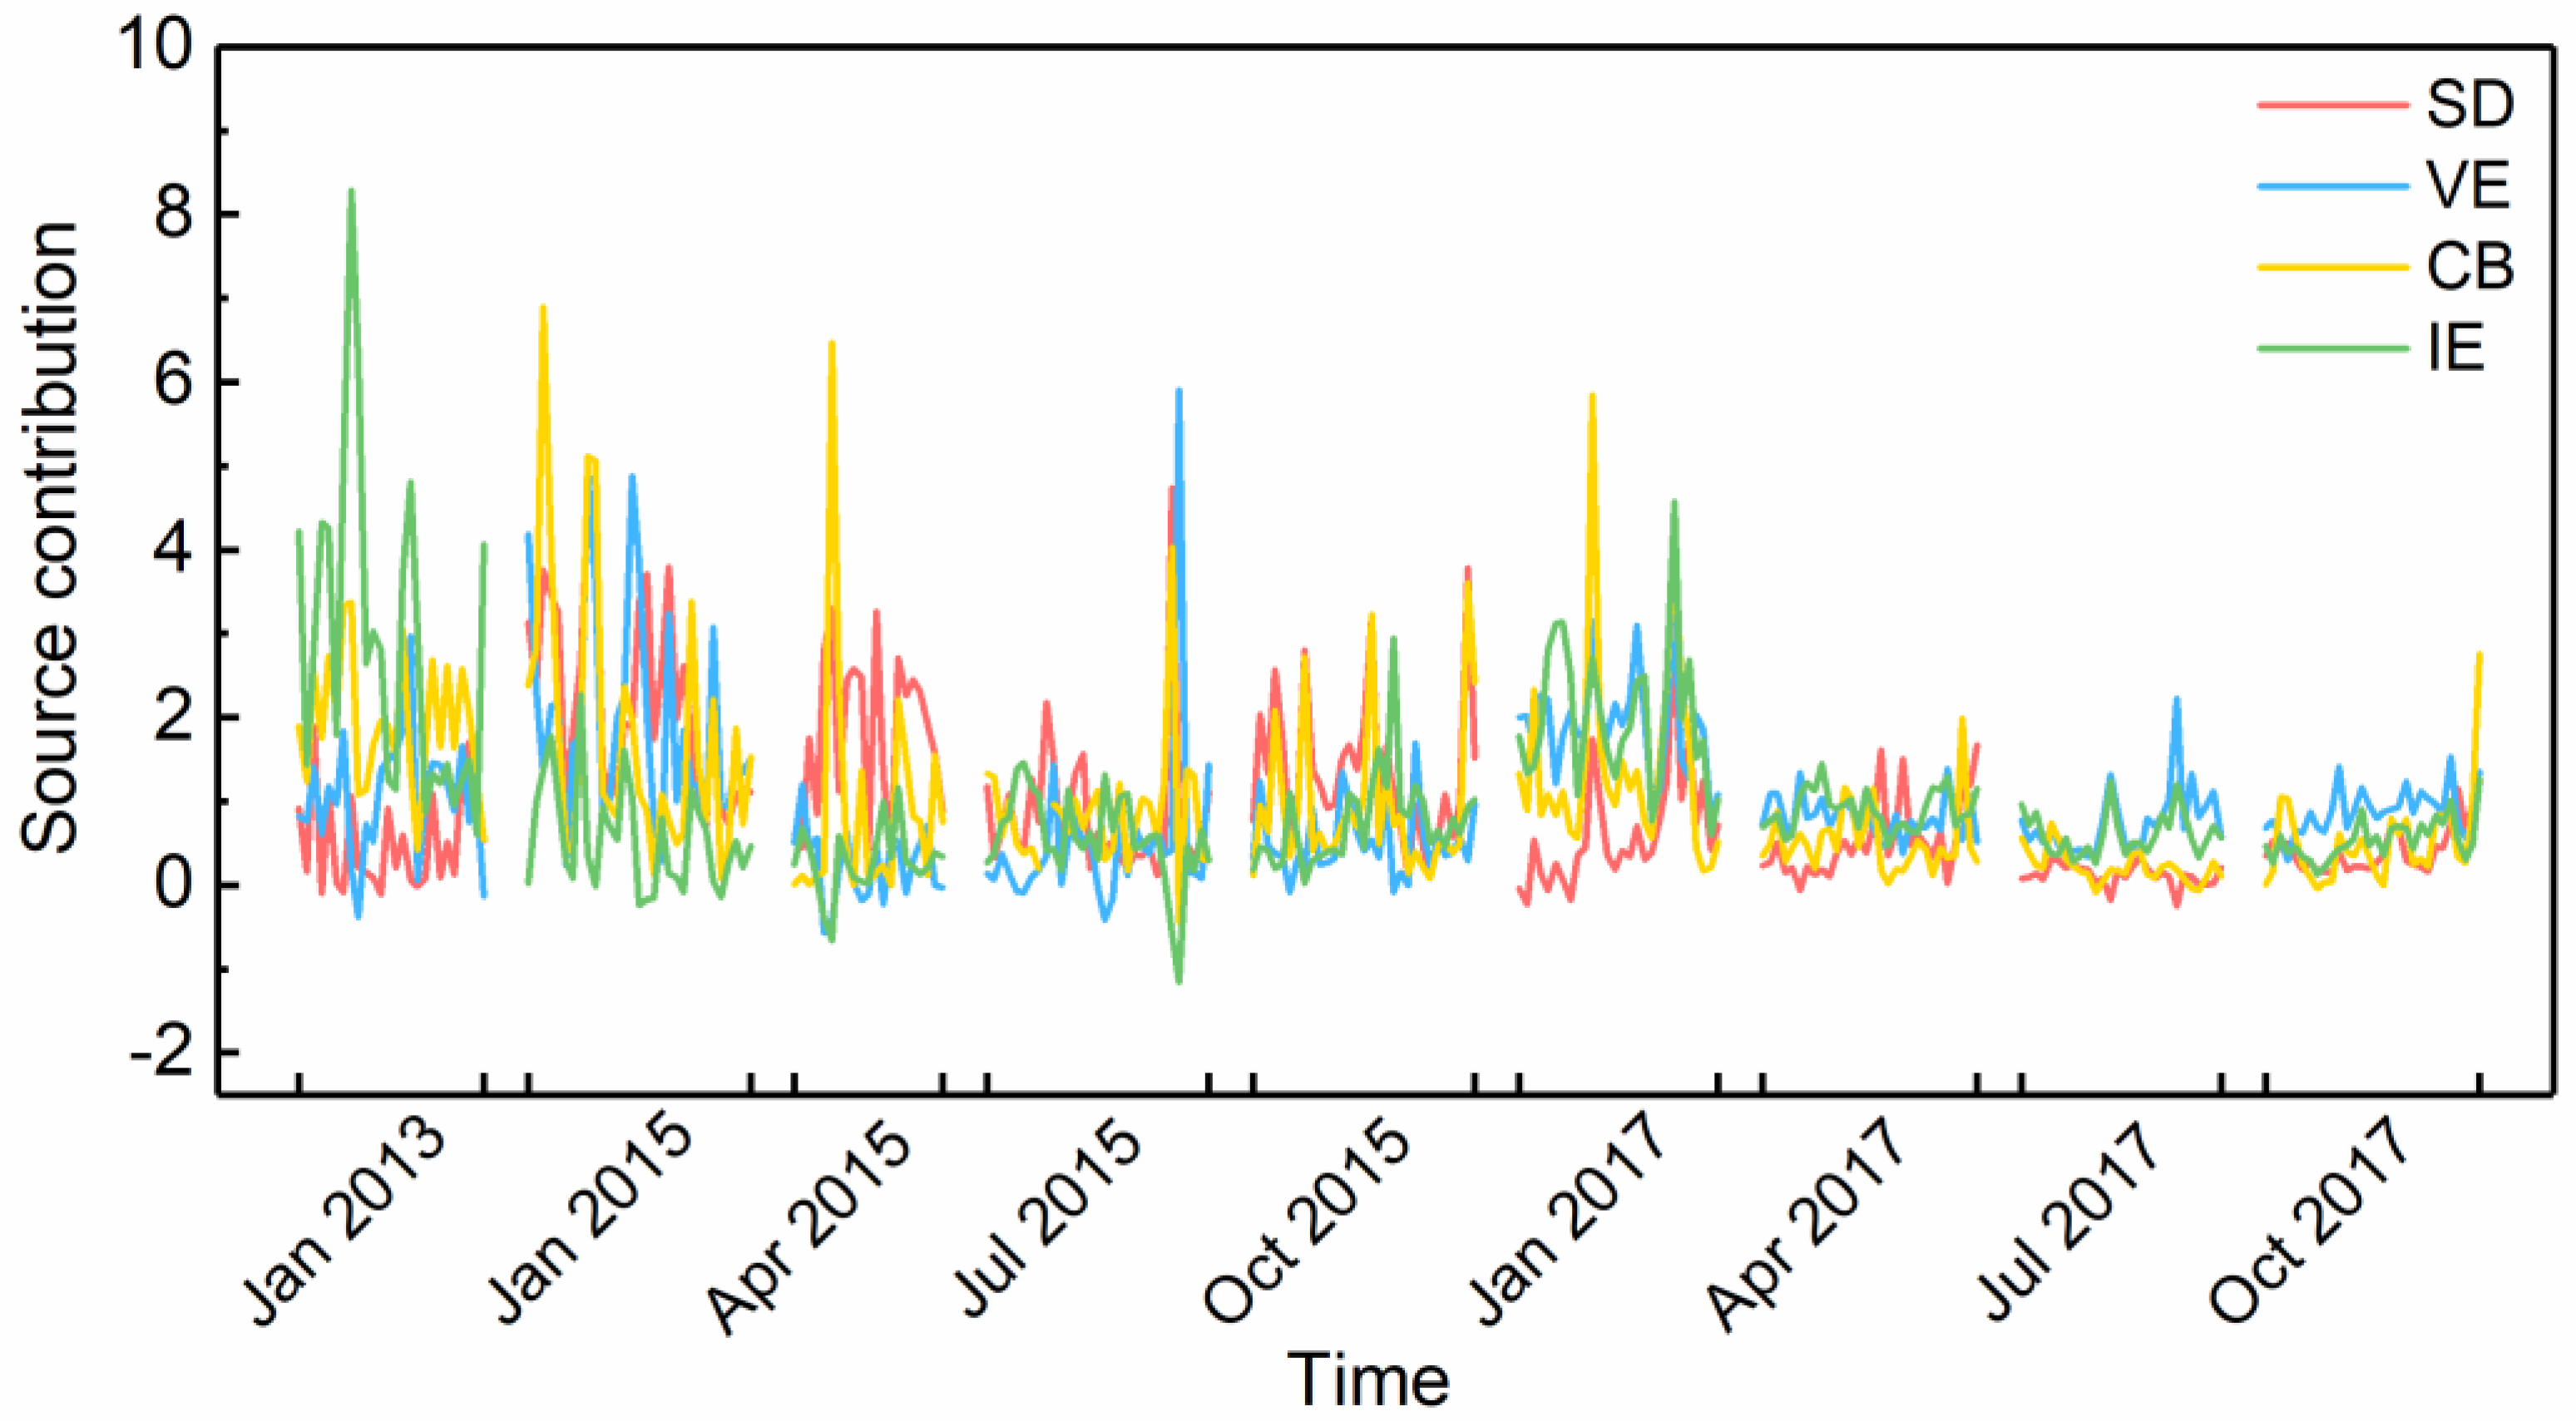
3.3. Source Apportionment by Unmix

The results of the source components of the metals in PM2.5 are shown in Figure 4. The numerical values for the solution’s diagnostic indicators (R2 = 0.85 and S/N ratio = 2.31) are consistent with the recommendations. Ni was excluded and four sources were identified from Unmix. The proportion of different pollution sources is shown in Figure 5, and the time series plot of the source contributions is shown in Figure 6.
Source 1 demonstrated high concentration loadings of Ti (80.82%) and Mn (26.53%). Ti and Mn are seen as sign species for crustal elements [19,44,45]. A small amount of the concentration loading of Mn came from ground praise dust [46]. The time series of the contribution of source 1 was at relatively low level throughout the three years. In particular, the contribution of source 1 in July was much lower than that of other months. The contribution of dust to the concentration of the heavy metals in PM2.5 was reduced due to the abundant rainfall in Handan in July. Hence, source 1 can be defined as a source from soil dust (SD).
Source 2 showed high concentration loadings of Cr (23.04%), Cu (37.95%), Cd (29.46%), and Zn (35.79%) and a few loadings of Pb (11.92%). The brakes of motor vehicles release Cr during their period of operation, which enrich in the environment. Atiemo et al. (2011) found that high concentrations of Cu and Zn come from tire abrasion, lubricants, and the wearing of brake linings [47]. Cd and Pb can be released from multiple different sources in the environment, such as vehicle emissions [13,48]. In addition, the contribution of source 2 was decreased in the three years, which are related to the measure for vehicle control. Above all, source 2 can be classified as vehicle emissions (VEs).
Source 3 demonstrated loadings of As (38.99%), Cd (70.54%), and Pb (26.89%). Cd in PM2.5 is mainly produced by coal dust such as coking plants and steel plants [49]. As is widely used as a marker for coal and fuel combustion. Ge et al. (2014) found that Pb is mainly attributed to civil coal combustion emissions [50]. Rural residents in the suburb of Handan are used to heating or cooking by large amounts of honeycomb coal in winter. Time series of source 3 contribution exhibited the highest contributions in January. January is attributed to the heating period in Handan, causing a large amount of PM emissions by burning coal. Therefore, we can deduce source 3 is from coal combustion (CB).
Source 4 was characterized by V, Cr, Mn, Cu, Zn, As, and Pb (63.54%, 71.89%, 57.29%, 51.85%, 48.75%, 46.59%, and 54.14%, respectively). V is commonly attributable to the combustion of heavy oil, while steel smelters use heavy oil as fuel [51]. Xu and Tao (2004) showed that Mn belongs to iron group elements, which has a similar atomic radius and chemical morphology to Fe, which leads to easy enrichment during iron ore formation [52]. Several metal manufacturing plants are located near the sampling site (such as Handan’s steel smelter, a coking plant, and a zinc plating processing plant) and could have had an influence on the monitoring. A range of tracer species (Cr, Cu, Zn, As, and Pb) have previously been used in China to recognize emissions from specific industries. For example, Yan et al. (2021) used Cr and Zn as tracers for industrial emissions in Luoyang, a typical industrial city like Handan [53]. Cheng et al. (2021) found that Cu, As, and Pb mainly come from metal smelting, manufacturing, and coating production activities in Jinan [54]. As is shown in Figure 6, source 4 exhibited high contributions in January 2015, which then subsequently gradually decreased, and was associated with the restricting capacity of some heavily polluted urban industries since 2015. This source was identified as industrial emissions (IEs).

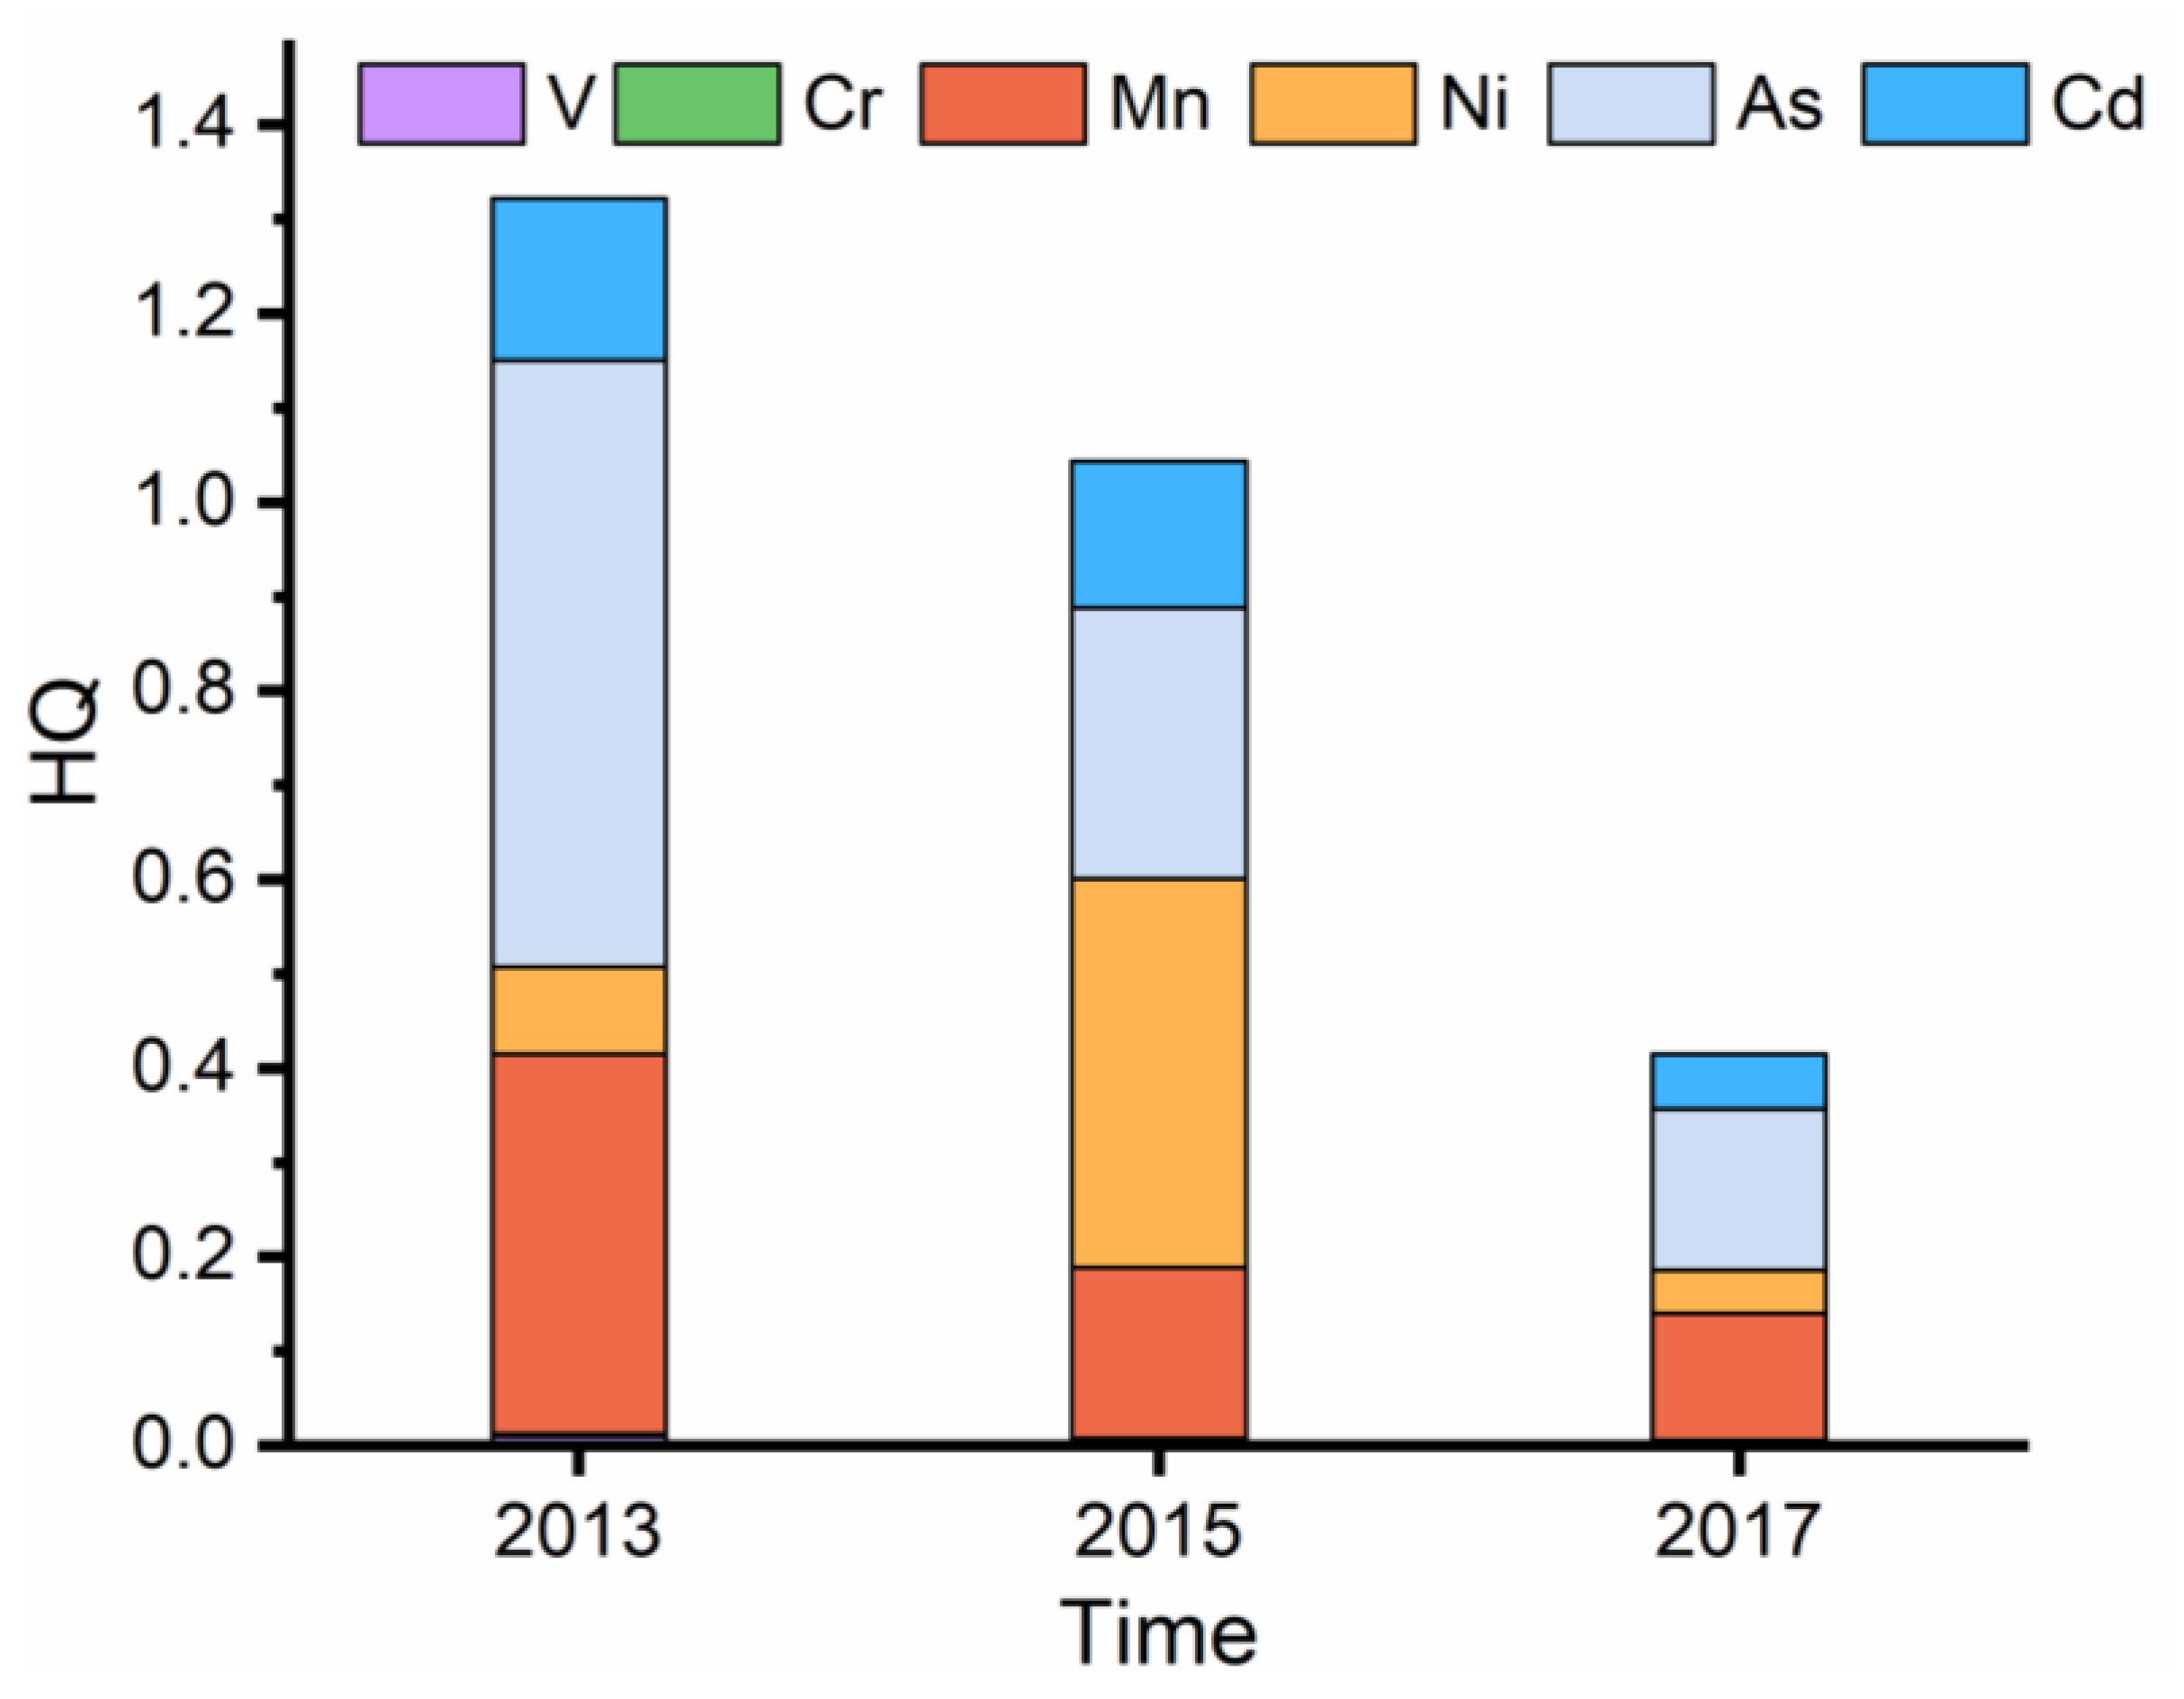
3.4. Health Risk Assessment

Heavy metals in PM2.5 enter the human body mainly through the respiratory route. Amid the estimated elements in this study, V, Cr, Mn, Ni, As, and Cd are non-carcinogenic, while Cr, Ni, As, Cd, and Pb are carcinogenic [30,31,32].

3.4.1. Non-Carcinogenic Risk

The annual average HQ values of the heavy metals (V, Cr, Mn, Ni, As, and Cd) via inhalation exposure are shown in Figure 7. The annual average HI (sum of HQ) is in the order of 2013 (1.32) > 2015 (1.11) > 2017 (0.402). As shown in Figure 7, both of the HI values were over 1.00 in 2013 and 2015, which indicates that there were light non-carcinogenic risks. The HI values in 2017 were under 1; in general, HI showed a downward trend year after year. As and Mn contributed the majority of the HQ (over 40%) for the non-carcinogenic risk among all six kinds of non-carcinogenic heavy metals in all years. The high HQ values of As and Mn in Handan were mainly caused by coal consumption and boiler emissions from state-owned steel smelters. For exposure through the respiratory system, the risk values of non-carcinogenic heavy metals in Handan were observed to be higher than other cities such as Beijing, Tianjin, and Baoding [4,48,55]. The increased contribution of HQ values of Ni in 2015 is related to the increased concentration of Ni in January, April, and July 2015. Considering the diversity of sources of Ni in PM2.5, the reason for its concentration surge still needs further study.

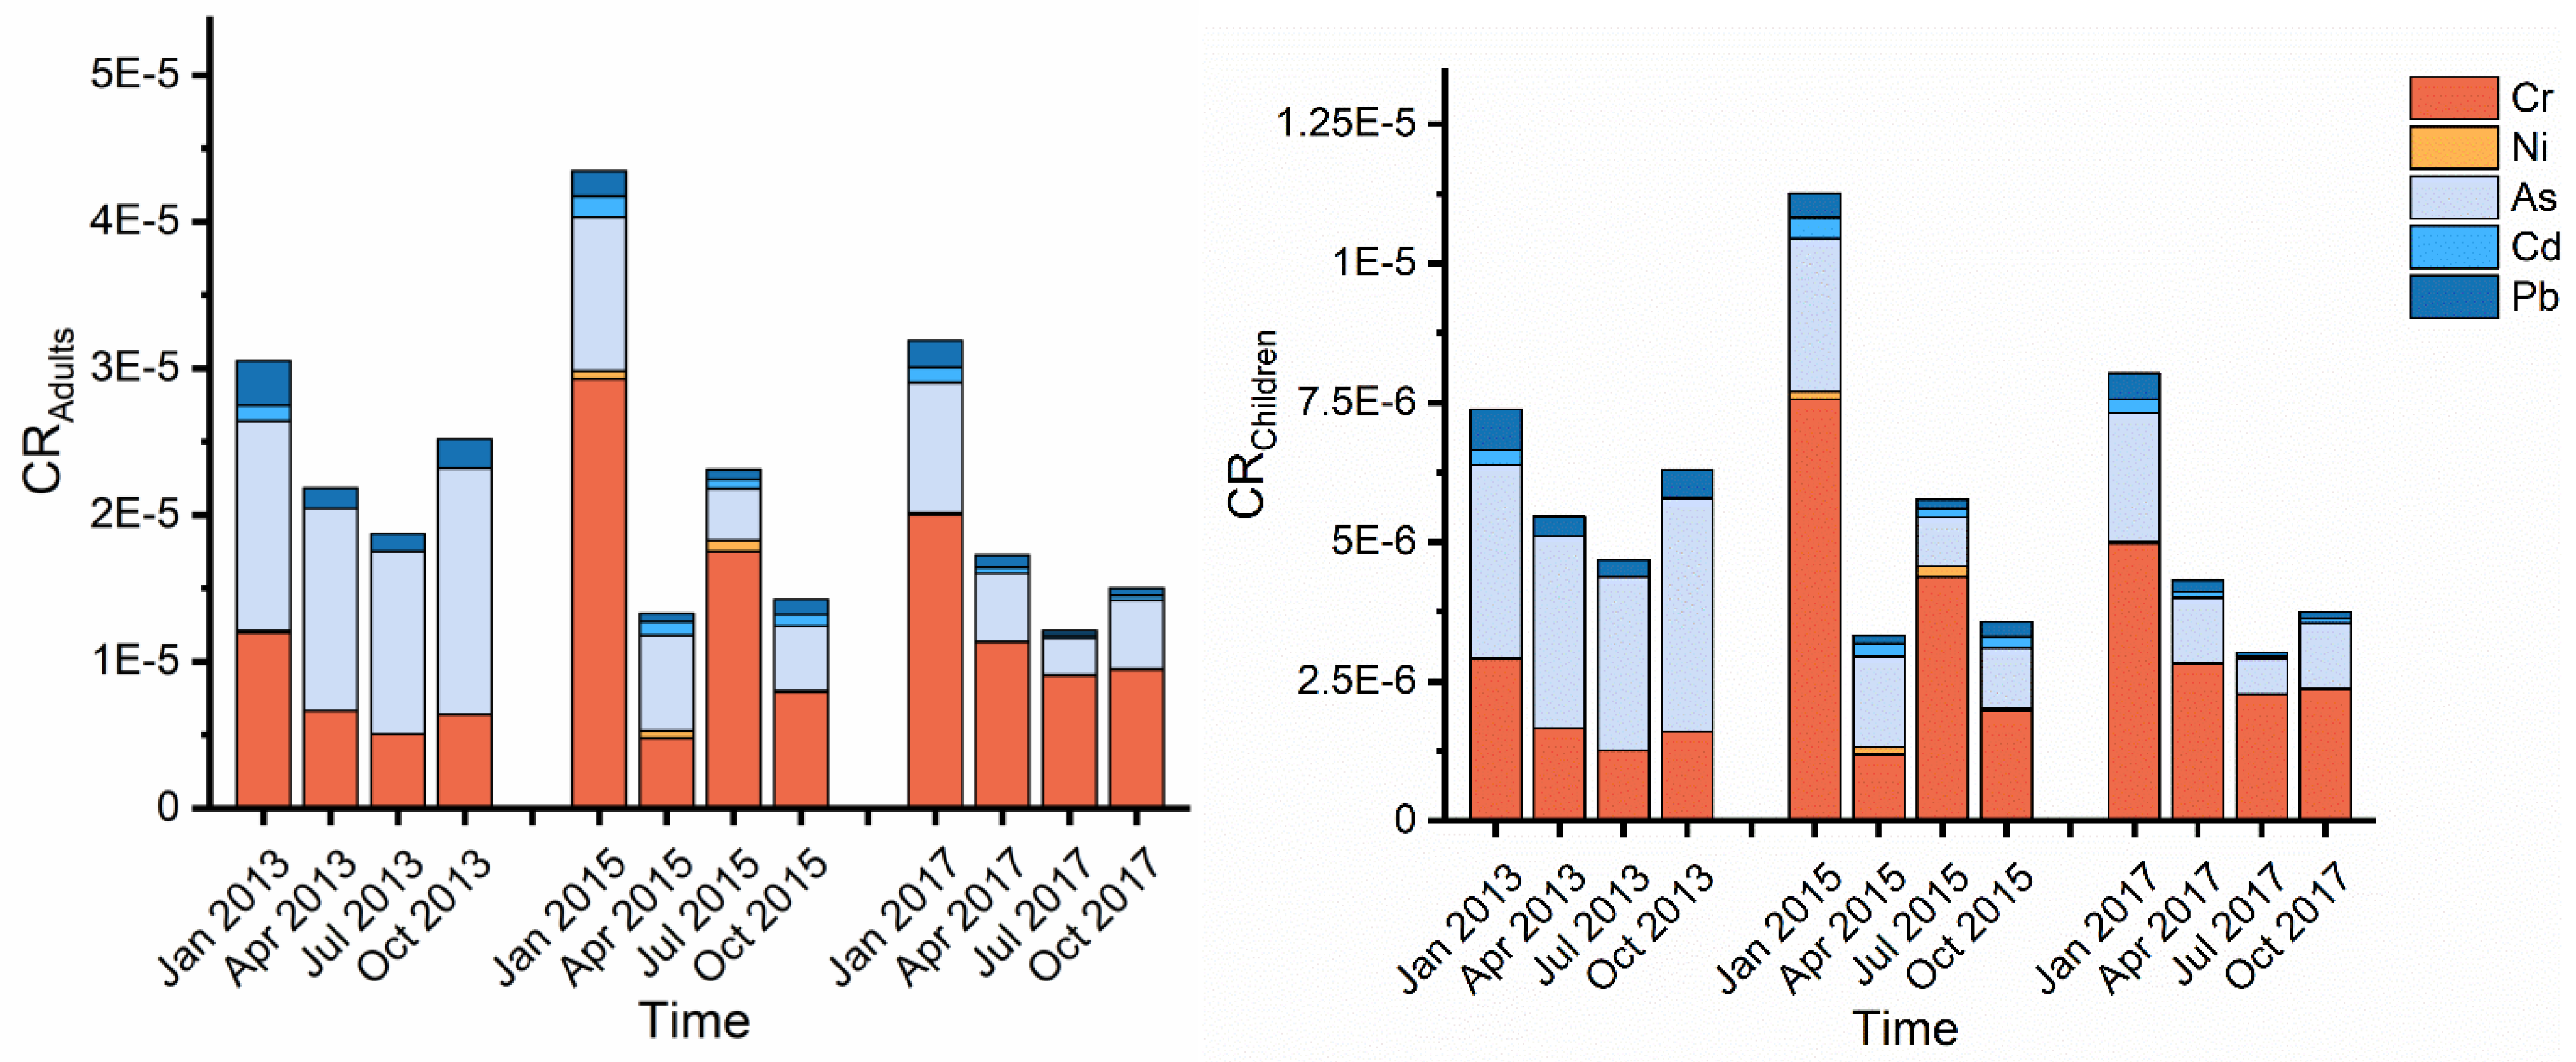
3.4.2. Carcinogenic Risk

The average annual cancer risk of PM2.5 heavy metals during the sampling period was calculated, and the results are shown in Table 3. The carcinogenic risks were higher than 1 × 10⁻⁶ in all years, which indicates that there was a cancer risk for the residents in Handan. The carcinogenic risk value of Ni and Pb mostly ranged from 1 × 10⁹ to 1 × 10⁻⁷. However, the annual carcinogenic risk of Cr and As was over than 10−6 for both adults and children during the sampling period. The carcinogenic risk of Cd for the adults was over 10−6 and for the children was under 10−6, which indicates that adults faced a Cd carcinogenic risk.
The monthly risks values of the carcinogenic exposure of Cr, Ni, As, Cd, and Pb by the inhalation route are shown in Figure 8. The CRT for both adults and children in January was much higher than that in the other months. The heavy metal CRT values were unacceptable, and Cr and As contributed the majority of the cancer risk (>80%), especially in winter. Cr (IV) is harmful to the human body, causes damage to internal organs such as the liver and kidneys, and easily induces premature senescent hepatocytes [56,57]. As exposure can lead to encephalopathy development and higher neurological dysfunction and can cause irreversible damage to the nervous system [58,59]. In general, there was a high carcinogenic risk of heavy metal elements in PM2.5 in Handan. According to the results of the sources apportionment, measures should be taken to control the air pollutant emissions of industrial and coal burning in order to reduce the risk caused by long-term inhalation of heavy metal elements in PM2.5.
In order to determine the risk levels of Cr, Ni, As, Cd, and Pb in PM2.5 in Handan, the carcinogenic risks of heavy metals were compared to those for other Chinese cities in the case of adults (Table 4). It can be seen that the carcinogenic risks of the five heavy metals were higher than those for Beijing, Tianjin, Nanjing, and Changzhi, but lower than those for Wuhan and Baoding [25,31,55,60,61,62].

3.5. Potential Local and Regional Sources

This study found that the majority of the most severe period of air pollution in Handan occurred in January, and a high incidence of carcinogenic risk also occurred during this period. We associated the wind direction and CRT in January to explore the local potential source. The sampling site was in the downwind of the industrial area in winter. The possible impact air mass transport of non-carcinogenic risks in three years is not discussed because of the low risk level.

3.5.1. Potential Local Sources

To further discuss the source of heavy metals in PM2.5 in the HCRP (22 January 2013, 17 January 2015, and 24 January 2017), the distribution of CRT in the wind direction diagram in January were analyzed (Figure 9a). The peak of CRT was mainly occurred in January of the observed year. In 2013, the HCPR was dominated by a south direction with wind speed of ≈2 m/s and a low temperature (<0 °C). There are multiple industrial parks and large building material markets in the south of the sampling site that may have caused a high concentration of heavy metals. The highest health risk occurred on 17 January 2015. The main impactful wind mostly arrived from the southwest and southeast due to heavy transportation southwest of the sampling site and the construction of Handan Industrial Park in the southeast. Handan Industrial Park officially started construction in 2013, while the wind speed peaked at 2.2 m/s on 17 January, and the concentration of heavy metals also peaked in these days as a result of pollutants carried by airflow transport. The high carcinogenic risk in January 2017 was influenced by a northeast wind direction, which might have been influenced by the economic development zone located approximately 11 km away from the sampling site in the northeast direction. There is a modern manufacturing base and a logistics center with industrial production and continual transportation.

3.5.2. Potential Regional Sources

For the HCRP, 72 h air mass backward trajectories were generated to study the regional long-range transport sources (Figure 9b). The backward trajectory was set to start at 16:00 UTC (0:00 LST). The options for the start height were chosen based on initial analysis of the trajectories arriving at the receptor site in Handan at three different heights (500, 1000, and 1500 m), which represent the low, middle, and upper atmosphere, respectively. As shown in Figure 9b, the majority of the long-distance air mass was influenced by northwest cold high voltage from Russia, Mongolia, Inner Mongolia, Xinjiang, Gansu, Shaanxi, and Shanxi, passed over a number of industrial cities to Handan during the HCRP.
Taking into account that high PM2.5 concentrations in January were observed during the sampling period, the 72-h air mass HYSPLIT backward trajectories (Figure 10a) and trajectory clusters (Figure 10b) for January in 2013, 2015, and 2017 were plotted at a height of 500 m. Although there were many air masses arriving in Handan, the main origin was the surrounding provinces and cities. In January 2013, 56.03% of the air masses were mainly from Shandong Province, located in eastern Handan. In January 2015, 41.38% of the air masses were from Henan Province in the south of Handan, while 28.45% of the air masses that arrived in Handan in January 2017 came from Baoding and Shijiazhuang, which were also heavily polluted cities in BTH. It must be pointed out that HYSPLIT can only describe the general directions in which the potential sources may originate but are disadvantaged in guiding the accurate positions of the sources.

4. Discussion

Since 2013, the Hebei provincial government has implemented the five-year Air Pollution Prevention and Control Action (APPCA) plan. This action aims to prevent air pollution, including controlling enterprise and vehicle travel emission and strengthening greening. At the same time, the capacities of steel, cement, coking, and other heavy industries were reduced. From 2013 to 2017, the concentration of PM2.5 declined in Handan, which meant these measures achieved some results. The concentrations of PM2.5 in January 2017 were still beyond the class II limit value of CAAQS, even after APPCA had been adopted for five years. A previous study has indicated that coal-fired sources, secondary sources, and industrial sources are the main sources of PM2.5 in Handan [63]. Compared to other areas of China, this situation is mainly affected by two aspects. The first aspect is regional particulate matter emissions: January was the heating period in Handan, where a large amount of coal burning contributes more PM2.5 than other time. The second aspect was affected by meteorological conditions, especially wind speed and temperature [39,40,41]. Lower wind speeds facilitate the accumulation of pollutants. Temperature inversion is prone to occur in winter with low temperatures, which is not conducive to the spread of pollutants.
Meanwhile, it is also necessary to further strengthen the control of heavy metal emissions. These high concentrations of Cr and As show a critical and worrying scenario that a high health risk might exist for humans, particularly a carcinogenic risk. This was also confirmed by the assessment of health risk. The non-carcinogenic risk was acceptable, but the carcinogenic risk from heavy metals exceeded the threshold limit, with Cr and As being the major contributors to this carcinogenic risk.
According to the source apportionment results by Unmix, Cr, Cd, As, and Pb are mainly from the industrial emission and coal burning. Therefore, in order to prevent Cr, Cd, Pb, and As pollution, industrial activities and coal combustion need to be controlled. Meanwhile, Zn pollution comes from vehicular emissions; therefore, actions can be adopted that advocate public transport and puncher new energy vehicles to alleviate Zn pollution.
At the same time, we also considered possible local and regional sources of heavy metals in PM2.5. In the wind direction diagram, the spatial distribution characteristics of CRT are related to types of surrounding transportation and industry. The results of the backward trajectories and trajectory cluster showed that Shandong, Henan, and the surrounding cities of Handan have an impact on the PM2.5 levels in Handan. These areas are the main industrial bases in China, and a large number of industrial enterprises are distributed in them, such as coal-fired power plants, steel, and coke enterprises. The combustion of scattered coal in rural areas is also an important source of contribution. Due to the influence of topography, the polluted air mass from other directions hardly crosses the Taihang Mountains, located in western Handan, which greatly promotes the accumulation of pollutants in this area.
In addition, this study presents certain limitations when applying this method. Human health is threatened by heavy metals in PM2.5, mainly through inhalation [48]. It is important to emphasize that just because ingestion or dermal routes of exposure were not calculated the influence of health risk by this analysis, beyond this, the outdoor and indoor concentrations of PM2.5 vary substantially, and individuals spend most of their time indoors. Shao et al. (2019) studied the indoor and outdoor PM2.5 concentrations in Nanjing, and the indoor PM2.5 concentrations were observed to be significantly lower than the outdoors concentrations, particularly when the windows were closed [38]. The exposure time (ET) in the outdoor time in this study was 8 h, but 24 h was selected in another study, so the calculated and actual values could differ [41]. Despite the study having some limitations, our assessment still offers a valuable evaluation of the health risk for heavy metals, which could inform the development of an air pollution control program tailored to local needs. In the future, the city administration and stakeholders should adopt more aggressive targets and more powerful measures to mitigate the risk of heavy metal contamination and protect resident health.

5. Conclusions

During the sampling period, the average level of the mass concentration PM2.5 in Handan was higher than the secondary average annual concentration limit (35 μg/m3) specified in the CAAQS (GB3095-2012). The characteristics analysis of PM2.5 concentration demonstrated temporal variability, and the concentrations of PM2.5 in January were distinctly higher than that of other months. Cr was the main pollutant element, and the concentrations of Cr (Ⅵ) were 32.41–85.43 times that of the secondary average annual concentration limit. The results of the source apportionment by the Unmix model showed that the main sources of metal elements in PM2.5 included soil dust sources (10.67%), vehicular emissions (15.35%), coal burning (26.04%), and industrial activities (47.94%). By health risk assessment, non-carcinogenic risks were shown to decline each year. The non-carcinogenic risk was within the safe limit in 2017. The carcinogenic risk of heavy metals in Handan was high, where Cr and As were mainly responsible for CRT. In the case of carcinogenic risk, CRT was higher for adults than children. Heavy industry enterprises and the economic development zone located in Handan were shown to be the important local sources according to the wind direction diagram, while the regional sources were also affected by the surrounding province and cities according to the backward trajectory analysis.
We suggest that joint prevention and control measures should be established at the national level. Local managers should accelerate the relocation of Handan heavy pollution enterprises and actively upgrade and transform the pollution control facilities of industrial enterprises, as well as scientifically implement peak production during the heating season. Meanwhile, the requirements for the special emission limits of air pollutants should be strictly implemented and transformation of the urban economic system should be accelerated.

Supplementary Materials

The following are available online at https://www.mdpi.com/article/10.3390/atmos12101232/s1, Table S1: Parameters of population exposure evaluation model, Table S2: Response parameters of elements entering the human body through the respiratory system, Table S3: Monthly average concentration of 10 metal elements (ng/m3), Figure S1: (a) Mass concentration of Cr, Ni, As, Cd, Pb in Handan during sampling period and limits of CAAQS and AQG. (b) Mass concentration of Zn, Ti, Mn, Cu, V in PM2.5 during sampling period.

Author Contributions

Conceptualization, H.Z.; methodology, A.C. and L.W.; formal analysis, A.C. and X.W.; writing—original draft preparation, A.C.; writing—review and editing, A.C. and H.Z.; supervision, H.Z.; project administration, H.Z. and Q.W.; funding acquisition, Q.W. All authors have read and agreed to the published version of the manuscript.

Funding

This research was funded by National Natural Science Foundation of China, grant number 42077393, 41703088 and the Key Projects of Research and Development of Hebei Province, grant number 19273707D.

Institutional Review Board Statement

Not applicable.

Informed Consent Statement

Not applicable.

Data Availability Statement

The data presented in this study are available on request from the corresponding author. The data are not publicly available due to participants not having consented to the data being shared.

Acknowledgments

The authors wish to express thanks to the editors and anonymous reviewers for their positive comments and suggestions to improve the quality of this manuscript.

Conflicts of Interest

The authors declare no conflict of interest.

References

  1. Li, J.; Sun, J.L.; Zhou, M.Y.; Cheng, Z.G.; Li, Q.C.; Cao, X.Y.; Zhang, J.J. Observational analyses of dramatic developments of a severe air pollution event in the Beijing area. Atmos. Chem. Phys. 2018, 18, 3919–3935. [Google Scholar] [CrossRef] [Green Version]
  2. Wang, L.T.; Wei, Z.; Yang, J.; Zhang, Y.; Zhang, F.F.; Su, J.; Meng, C.C.; Zhang, Q. The 2013 severe haze over the southern Hebei, China: Model evaluation, source apportionment, and policy implications. Atmos. Chem. Phys. 2014, 14, 3151–3173. [Google Scholar] [CrossRef] [Green Version]
  3. Song, C.B.; Wu, L.; Xie, Y.C.; He, J.J.; Chen, X.; Wang, T.; Lin, Y.C.; Jin, T.S.; Wang, A.X.; Liu, Y.; et al. Air pollution in China: Status and spatiotemporal variations. Environ. Pollut. 2017, 227, 334–347. [Google Scholar] [CrossRef] [PubMed]
  4. Gao, Y.; Guo, X.Y.; Li, C.; Ding, H.J.; Tang, L.; Ji, H.B. Characteristics of PM2.5 in Miyun, the northeastern suburb of Beijing: Chemical composition and evaluation of health risk. Environ. Sci. Pollut. Res. 2015, 22, 16688–16699. [Google Scholar] [CrossRef]
  5. Zheng, G.J.; Duan, F.K.; Su, H.; Ma, Y.L.; Cheng, Y.; Zheng, B.; Zhang, Q.; Huang, T.; Kimoto, T.; Chang, D.; et al. Exploring the severe winter haze in Beijing: The impact of synoptic weather, regional transport and heterogeneous reactions. Atmos. Chem. Phys. 2015, 15, 2969–2983. [Google Scholar] [CrossRef] [Green Version]
  6. IARC. IARC Monographs. Non-Ionizing Radiation, Part 2: Radiofrequency Electromagnetic Fields; International Agency for Research on Cancer: Lyon, France, 2013; Volume 102.
  7. Zhang, H.; Mao, Z.; Huang, K.; Wang, X.; Cheng, L.; Zeng, L.; Zhou, Y.K.; Jing, T. Multiple exposure pathways and health risk assessment of heavy metal(loid)s for children living in fourth-tier cities in Hubei Province. Environ. Int. 2019, 129, 517–524. [Google Scholar] [CrossRef]
  8. Lin, Y.C.; Zhang, Y.L.; Song, W.H.; Yang, X.Y.; Fan, M.Y. Specific sources of health risks caused by size -resolved PM -bound metals in a typical coal-burning city of northern China during the winter haze event. Sci. Total Environ. 2020, 734, 138651. [Google Scholar] [CrossRef]
  9. Zhang, A.H.; Feng, H.; Yang, G.H.; Pan, X.L.; Jiang, X.Y.; Huang, X.X.; Dong, X.X.; Yang, D.P.; Xie, Y.X.; Peng, L.; et al. Unventilated indoor coalfired stoves in Guizhou Province, China: Cellular and genetic damage in villagers exposed to arsenic in food and air. Environ. Health Perspect. 2007, 115, 653–658. [Google Scholar] [CrossRef] [Green Version]
  10. Deng, J.J.; Zhang, Y.R.; Qiu, Y.Q.; Zhang, H.L.; Du, W.J.; Xu, L.L.; Hong, Y.-W.; Chen, Y.T.; Chen, J.S. Source apportionment of PM 2.5 at the Lin’an regional background site in China with three receptor models. Atmos. Res. 2018, 202, 23–32. [Google Scholar] [CrossRef]
  11. Belis, C.A.; Karagulian, F.; Larsen, B.R.; Hopke, P.K. Critical review and meta-analysis of ambient particulate matter source apportionment using receptor models in Europe. Atmos. Environ. 2013, 69, 94–108. [Google Scholar] [CrossRef]
  12. Liao, H.T.; Lee, C.L.; Tsai, W.C.; Yu, J.Z.; Tsai, S.W.; Chou, C.C.K.; Wu, C.F. Source apportionment of urban PM2.5 using positive matrix factorization with vertically distributed measurements of trace elements and nonpolar organic compounds. Atmos. Pollut. Res. 2021, 12, 200–207. [Google Scholar] [CrossRef]
  13. Ragosta, M.; Caggiano, R.; Macchiato, M.; Sabia, S.; Trippetta, S. Trace elements in daily collected aerosol: Level characterization and source identification inafour-yearstudy. Atmos. Res. 2008, 89, 206–217. [Google Scholar] [CrossRef]
  14. Pancras, J.P.; Landis, M.S.; Norris, G.A.; Vedantham, R.; Dvonch, J.T. Source apportionment of ambient fine particulate matter in Dearborn, Michigan, using hourly resolved PM chemical composition data. Sci. Total Environ. 2013, 448, 2–13. [Google Scholar] [CrossRef]
  15. Kelley, D.; Nater, E. Source apportionment of lake bed sediments to watersheds in an Upper Mississippi basin using a chemical mass balance method. Catena 2000, 41, 277–292. [Google Scholar] [CrossRef]
  16. Kleinman, M.T.; Pasternack, B.S.; Eisenbud, M.; Kneip, T.J. Identifying and estimating the relative importance of sources of airborne particulates. Environ. Sci. Technol. 1980, 14, 62–65. [Google Scholar] [CrossRef]
  17. Song, Y.; Dai, W.; Shao, M.; Liu, Y.; Lu, S.; Kuster, W.; Goldan, P. Comparison of receptor models for source apportionment of volatile organic compounds in Beijing, China. Environ. Pollut. 2007, 156, 174–183. [Google Scholar] [CrossRef] [PubMed]
  18. Henry, R.C. History and fundamentals of multivariate air quality receptor models. Chemom. Intell. Lab. Syst. 1997, 37, 37–42. [Google Scholar] [CrossRef]
  19. Jain, S.; Sharma, S.K.; Choudhary, N.; Masiwal, R.; Saxena, M.; Sharma, A.; Mandal, T.K.; Gupta, A.; Gupta, N.C.; Sharma, C. Chemical characteristics and source apportionment of PM2.5 using PCA/APCS, UNMIX, and PMF at an urban site of Delhi, India. Environ. Sci. Pollut. Res. 2017, 24, 14637–14656. [Google Scholar] [CrossRef]
  20. Murari, V.; Singh, N.; Ranjan, R.; Singh, R.S.; Banerjee, T. Source apportionment and health risk assessment of airborne particulates over central Indo-Gangetic Plain. Chemosphere 2020, 257, 127145. [Google Scholar] [CrossRef]
  21. Xu, X.M.; Zhang, W.; Zhu, C.; Li, J.R.; Wang, J.; Li, P.C.; Zhao, P.Y. Health risk and external costs assessment of PM2.5 in Beijing during the “Five-year Clean Air Action Plan”. Atmos. Pollut. Res. 2021, 12. [Google Scholar] [CrossRef]
  22. Ma, Q.X.; Wu, Y.F.; Zhang, D.Z.; Wang, X.J.; Xia, Y.J.; Liu, X.Y.; Tian, P.; Han, Z.W.; Xia, X.G.; Wang, Y.; et al. Roles of regional transport and heterogeneous reactions in the PM2.5 increase during winter haze episodes in Beijing. Sci. Total Environ. 2017, 599–600, 246–253. [Google Scholar] [CrossRef] [PubMed]
  23. Zhang, W.H.; Hai, S.F.; Zhao, Y.H.; Sheng, L.F.; Zhou, Y.; Wang, W.C.; Li, W.S. Numerical modeling of regional transport of PM2.5 during a severe pollution event in the Beijing–Tianjin–Hebei region in November 2015. Atmos. Environ. 2021, 254, 118393. [Google Scholar] [CrossRef]
  24. Grange, S.K.; Lewis, A.C.; Carslaw, D.C. Source apportionment advances using polar plots of bivariate correlation and regression statistics. Atmos. Environ. 2016, 145, 128–134. [Google Scholar] [CrossRef]
  25. Chen, P.; Bi, X.; Zhang, J.; Wu, J.; Feng, Y. Assessment of heavy metal pollution characteristics and human health risk of exposure to ambient PM2.5 in Tianjin, China. Particuology 2014, 20, 104–109. [Google Scholar] [CrossRef]
  26. Zhang, T.; Shen, Z.X.; Su, H.; Liu, S.X.; Zhou, J.M.; Zhao, Z.Z.; Wang, Q.Y.; Prévôt, A.S.H.; Cao, J.J. Effects of Aerosol Water Content on the formation of secondary inorganic aerosol during a Winter Heavy PM2.5 Pollution Episode in Xi’an, China. Atmos. Environ. 2021, 252. [Google Scholar] [CrossRef]
  27. Ma, W.; Tai, L.; Qiao, Z.; Zhong, L.; Wang, Z.; Fu, K.; Chen, G. Contamination source apportionment and health risk assessment of heavy metals in soil around municipal solid waste incinerator: A case study in North China. Sci. Total Environ. 2018, 631–632, 348–357. [Google Scholar] [CrossRef]
  28. Henry, R.C. Multivariate receptor modeling by N-dimensional edge detection. Chemom. Intell. Lab. Syst. 2003, 65, 179–189. [Google Scholar] [CrossRef]
  29. Norris, G.; Vedantham, R.; Duvall, R.; Henry, R.C. EPA Unmix 6.0 Fundamentals and User Guide, EPA/600/R07/089. June 2007. Available online: http://www.epa.gov/heasd/products/unmix/unmix.html (accessed on 2 June 2021).
  30. Cai, K.; Li, C.; Na, S. Spatial Distribution, Pollution Source, and Health Risk Assessment of Heavy Metals in Atmospheric Depositions: A Case Study from the Sustainable City of Shijiazhuang, China. Atmosphere 2019, 10, 222. [Google Scholar] [CrossRef] [Green Version]
  31. Wang, W.Q.; Zhang, W.L.; Dong, S.Y.; Yonemachi, S.; Lu, S.L.; Wang, Q.Y. Characterization, Pollution Sources, and Health Risk of Ionic and Elemental Constituents in PM2.5 of Wuhan, Central China. Atmosphere 2020, 11, 760. [Google Scholar] [CrossRef]
  32. USEPA. Risk Assessment Guidance for Superfund (RAGS), Volume I: Human Health Evaluation Manual (Part F, Supplemental Guidance for Inhalation Risk Assessment) EPA-540-R-070-002, OSWER 9285.7-82. January 2009. Available online: http://www.epa.gov/swerrims/riskassessment/ragsf/index.htm (accessed on 2 June 2021).
  33. PRCMEE. Technical Guidelines for Risk Assessment of Soil Contamination of Land for Construction (HJ 25.3-2019). 2019. Available online: https://www.mee.gov.cn/ywgz/fgbz/bz/bzwb/jcffbz/201912/t20191224_749893.shtml (accessed on 5 June 2021).
  34. Zhao, S.; Li, J.; Sun, C. Decadal variability in the occurrence of wintertime haze in central eastern China tied to the Pacific Decadal Oscillation. Sci. Rep. 2016, 6, 27424. [Google Scholar] [CrossRef] [PubMed]
  35. PRCMEE. Ambient Air Quality Standards (GB 3095-2012). 2012. Available online: https://www.mee.gov.cn/ywgz/fgbz/bz/bzwb/dqhjbh/dqhjzlbz/201203/t20120302_224165.shtml (accessed on 1 July 2021).
  36. Krzyzanowski, M. WHO air quality guidelines for Europe. J. Toxicol. Environ. Health Part A 2008, 71, 47–50. [Google Scholar] [CrossRef] [PubMed]
  37. USEPA. National Ambient Air Quality Standards for Particulate Matter. 2013. Available online: https://www.epa.gov/pm-pollution/national-ambient-air-quality-standards-naaqs-pm (accessed on 2 July 2021).
  38. Shao, Z.J.; Yin, X.J.; Bi, J.; Ma, Z.W.; Wang, J.N. Spatiotemporal Variations of Indoor PM2.5 Concentrations in Nanjing, China. Int. J. Environ. Res. Public Health 2019, 16, 144. [Google Scholar] [CrossRef] [PubMed] [Green Version]
  39. Li, F.; Yan, J.J.; Wei, Y.C.; Zeng, J.J.; Wang, X.Y.; Chen, X.Y.; Zhang, C.R.; Li, W.D.; Chen, M.; Idani, E.; et al. Characteristics, sources, and health risks of atmospheric PM10-bound heavy metals in a populated Middle Eastern city. Toxin Rev. 2020, 39, 266–274. [Google Scholar]
  40. Liu, Y.; Hu, J.; Wang, X.R.; Jia, J.; Li, J.; Wang, L.; Hao, L.; Gao, P. Distribution, bioaccessibility, and health risk assessment of heavy metals in PM2.5 and PM10 during winter heating periods in five types of cities in Northeast China. Ecotoxicol. Environ. Saf. 2021, 214, 112071. [Google Scholar] [CrossRef] [PubMed]
  41. Shen, M.X.; Xu, H.M.; Liu, S.X.; Zhang, Y.; Zhang, N.N.; Zhou, J.M.; Chow, J.C.; Watson, J.G.; Cao, J.J. Spatial distribution of PM2.5-bound elements in eighteen cities over China: Policy implication and health risk assessment. Environ. Geochem. Health 2021. [Google Scholar] [CrossRef]
  42. Liu, X.; Wu, X.; Chen, L.; Zhou, R. Effects of Internal Partitions on Flow Field and Air Contaminant Distribution under Different Ventilation Modes. Int. J. Environ. Res. Public Health 2018, 15, 2603. [Google Scholar] [CrossRef] [Green Version]
  43. Izhar, S.; Goel, A.; Chakraborty, A.; Gupta, T. Annual trends in occurrence of submicron particles in ambient air and health risk posed by particle bound metals. Chemosphere 2016, 146, 582–590. [Google Scholar] [CrossRef]
  44. Yatkin, S.; Bayram, A. Elemental composition and sources of particulate matter in the ambient air of a Metropolitan City. Atmos. Res. 2007, 85, 126–139. [Google Scholar] [CrossRef]
  45. Bhuiyan, M.A.; Parvez, L.; Islam, M.A.; Dampare, S.B.; Suzuki, S. Heavy metal pollution of coal mine-affected agricultural soils in the northern part of Bangladesh. J. Hazard. Mater. 2010, 173, 384–392. [Google Scholar] [CrossRef]
  46. Chakraborty, A.; Gupta, T. Chemical characterization and source apportionment of submicron (PM1) aerosol in Kanpur region, India. Aerosol Air Qual. Res. 2010, 10, 433–445. [Google Scholar] [CrossRef]
  47. Atiemo, M.S.; Ofosu, G.F.; Kuranchie-Mensah, H.; Tutu, A.O.; Linda Palm, N.D.M.; Blankson, S.A. Contamination assessment of heavy metals in road dust from selected roads in Accra, Ghana. Res. J. Environ. Earth Sci. 2011, 3, 473–480. [Google Scholar]
  48. Chen, R.; Jia, B.; Tian, Y.Z.; Feng, Y.C. Source-specific health risk assessment of PM2.5-bound heavy metals based on high time-resolved measurement in a Chinese megacity: Insights into seasonal and diurnal variations. Ecotoxicol. Environ. Saf. 2021, 216, 112167. [Google Scholar] [CrossRef]
  49. Tian, H.Z.; Cheng, K.; Wang, Y.; Zhao, D.; Lu, L.; Jia, W.X.; Hao, J.M. Temporal and spatial variation characteristics of atmospheric emissions of Cd, Cr, and Pb from coal in China. Atmos. Environ. 2012, 50, 157–163. [Google Scholar] [CrossRef]
  50. Ge, S.; Xu, X.; Chow, J.C.; Watson, J.; Sheng, Q.; Liu, W.L.; Bai, Z.P.; Zhu, T.; Zhang, J.F. Emissions of air pollutants from household stoves: Honeycomb coal versus coal cake. Environ. Sci. Technol. 2004, 38, 4612–4618. [Google Scholar] [CrossRef]
  51. Chow, J.; Watson, J. Review of PM2.5 and PM10 Apportionment for Fossil Fuel Combustion and Other Sources by the Chemical Mass Balance Receptor Mode. Energy Fuels 2002, 16, 222–260. [Google Scholar] [CrossRef]
  52. Xu, S.; Tao, S. Coregionalization Analysis of Heavy Metals in the Surface Soil of Inner Mongolia. Sci. Total Environ. 2004, 320, 73–87. [Google Scholar] [CrossRef]
  53. Yan, G.P.; Zhang, P.Z.; Yang, J.; Zhang, J.W.; Zhu, G.F.; Cao, Z.G.; Fan, J.; Liu, Z.R.; Wang, Y.S. Chemical characteristics and source apportionment of PM2.5 in a petrochemical city: Implications for primary and secondary carbonaceous component. J. Environ. Sci. 2021, 103, 322–335. [Google Scholar] [CrossRef] [PubMed]
  54. Cheng, M.T.; Tang, G.Q.; Lv, B.; Li, X.R.; Wu, X.R.; Wang, Y.M.; Wang, Y.S. Source apportionment of PM2.5 and visibility in Jinan, China. J. Environ. Sci. 2021, 102, 207–215. [Google Scholar] [CrossRef] [PubMed]
  55. Liang, B.L.; Li, X.L.; Maa, K.; Liang, S.X. Pollution characteristics of metal pollutants in PM2.5 and comparison of risk on human health in heating and non-heating seasons in Baoding, China. Ecotoxicol. Environ. Saf. 2019, 170, 166–171. [Google Scholar] [CrossRef]
  56. Lou, J.L.; Yu, S.K.; Feng, L.F.; Guo, X.N.; Wang, M.; Branco, A.T.; Li, T.; Lemos, B. Environmentally induced ribosomal DNA (rDNA) instability in human cells and populations exposed to hexavalent chromium [Cr (VI)]. Environ. Int. 2021, 153, 106525. [Google Scholar] [CrossRef] [PubMed]
  57. Ma, Y.; Liang, Y.H.; Liang, N.J.; Zhang, Y.J.; Xiao, F. Identification and functional analysis of senescence-associated secretory phenotype of premature senescent hepatocytes induced by hexavalent chromium. Ecotoxicol. Environ. Saf. 2021, 211, 111908. [Google Scholar] [CrossRef]
  58. Liu, X.D.; Chen, Y.; Wang, H.H.; Wei, Y.T.; Yuan, Y.; Zhou, Q.Q.; Fang, F.; Shi, S.N.; Jiang, X.J.; Dong, Y.Q.; et al. Microglia-derived IL-1β promoted neuronal apoptosis through ER stress-mediated signaling pathway PERK/eIF2α/ATF4/CHOP upon arsenic exposure. J. Hazard. Mater. 2021, 417, 125997. [Google Scholar] [CrossRef]
  59. Bozack, A.K.; Boileau, P.; Wei, L.Q.; Hubbard, A.E.; Sillé, F.C.M.; Ferreccio, C.; Acevedo, J.; Hou, L.F.; Ilievski, V.; Steinmaus, C.M.; et al. Exposure to arsenic at different life-stages and DNA methylation meta-analysis in buccal cells and leukocytes. Environ. Health 2021, 20, 79. [Google Scholar] [CrossRef]
  60. Gao, Y.; Guo, X.; Ji, H.; Li, C.; Ding, H.; Briki, M.; Tang, L.; Zhang, Y. Potential threat of heavy metals and PAHs in PM2.5 in different urban functional areas of Beijing. Atmos. Res. 2016, 178–179, 6–16. [Google Scholar] [CrossRef]
  61. Li, H.; Wu, H.; Wang, Q.; Yang, M.; Li, F.; Sun, Y.; Qian, X.; Wang, J.H.; Wang, C. Chemical partitioning of fine particle-bound metals on haze–fog and non-haze–fog days in Nanjing, China and its contribution to human health risks. Atmos. Res. 2017, 183, 142–150. [Google Scholar] [CrossRef]
  62. Duan, X.; Yan, Y.; Li, R.; Deng, M.; Hu, D.; Peng, L. Seasonal variations, source apportionment, and health risk assessment of trace metals in PM2.5 in the typical industrial city of changzhi, China. Atmos. Pollut. Res. 2020, 12, 365–374. [Google Scholar] [CrossRef]
  63. Wei, Z.; Wang, L.T.; Chen, M.Z.; Zheng, Y. The 2013 severe haze over the Southern Hebei, China: PM2.5 composition and source apportionment. Atmos. Pollut. Res. 2014, 5, 759–768. [Google Scholar] [CrossRef] [Green Version]
Figure 1. Map of sampling site in Handan city.
Atmosphere 12 01232 g001
Figure 2. Monthly average mass concentration of PM2.5.
Atmosphere 12 01232 g002
Figure 3. Mass concentration of PM2.5 and proportions of the 10 measured elements during the sampling period (npm2.5 = 355, nheavy metals = 344).
Atmosphere 12 01232 g003
Figure 4. Source composition resolved by Unmix.
Atmosphere 12 01232 g004
Figure 5. The proportion of different pollution sources.
Atmosphere 12 01232 g005
Figure 6. Time series plot of the source contributions. (n = 253).
Atmosphere 12 01232 g006
Figure 7. The annual HQ associated with the non-carcinogenic heavy metal components of PM2.5 (nV = 344, nCr = 344, nMn = 344, nNi = 264, nAs = 344, nCd = 264).
Atmosphere 12 01232 g007
Figure 8. Monthly risk value of carcinogenic exposure by inhalation route (nCr = 344, nNi = 264, nAs = 344, nCd = 264 and nPb = 344).
Atmosphere 12 01232 g008
Figure 9. (a) Distribution of CRT in wind direction diagram in January; (b) 72 h back trajectories on 22 January 2013, 17 January 2015 and 24 January 2017 of Handan.
Atmosphere 12 01232 g009
Figure 10. (a) The 72-h air mass HYSPLIT back trajectories; (b) trajectory cluster for January 2013, January 2015, and January 2017 at the sampling site.
Atmosphere 12 01232 g010
Table 1. Limit values for PM2.5 in the Chinese, USEPA, and WHO standards.
Country/OrganizationClass24-h Limit (μg/m3)Annual Limit (μg/m3)Reference
Chinese (CAAQS)I3515[35]
II7535
USEPA (NAAQS)I3512[36]
II15
WHO (AQG) 2510[37]
Table 2. Annual average concentration of the 10 metal elements (ng/m3).
YearTiVCrMnNiCuZnAsCdPb
2013Average49.353.36.4464.843.721.72316.7831.145.67 a224.17
C·V1.341.410.730.631.070.860.580.670.570.68
2015Average34.622.212.6428.2918.0813.5187.7613.474.85114.99
C·V1.020.661.140.670.910.660.751.11.30.82
2017Average12.622.4711.1131.552.1123.17286.8711.942.74104.26
C·V0.910.810.570.731.120.900.810.951.200.96
Limit valve--0.025 b-25 c--6 a5 a500 a
a The concentration of Cd in 2013 was the monthly concentration in January; b reference from CAAQS; c reference from WHO.
Table 3. The annual carcinogenic risk of the heavy metals in PM2.5.
GroupsYearCrNiAsCdPbCRT
Adults20137.48 × 10−61.11 × 10−71.43 × 10−51.08 × 10−61.91 × 10−62.49 × 10⁻⁵
20151.48 × 10−54.73 × 10−76.20 × 10−61.39 × 10−69.99 × 10−72.39 × 10⁻⁵
20171.24 × 10−55.16 × 10−85.17 × 10−61.04 × 10−68.44 × 10−71.95 × 10⁻⁵
Children20131.86 × 10−66.77 × 10−93.56 × 10−66.59 × 10−84.74 × 10−75.96 × 10⁻⁶
20153.80 × 10−61.19 × 10−71.59 × 10−62.39 × 10−72.53 × 10−76.00 × 10⁻⁶
20173.11 × 10−61.29 × 10−81.32 × 10−61.26 × 10−72.13 × 10−74.78 × 10⁻⁶
n344264344264344-
Table 4. Carcinogenic risk of heavy metals in PM2. 5 in different cities.
LocationYearCarcinogenic RiskReference
CrNiAsCdPb
Handan20171.25 × 10−55.18 × 10−85.20 × 10−65.06 × 10−78.51 × 10−7This Study
Tianjin20121.21 × 10−87.72 × 10−91.53 × 10−81.26 × 10⁻⁸-[25]
Wuhan20134.05 × 10−52.12 × 10−62.93 × 10−63.35 × 10−75.09 × 10−7[31]
Baoding20152.65 × 10−47.03 × 10−89.40 × 10−77.03 × 10⁻⁸-[55]
Beijing20132.72 × 10−53.04 × 10⁻⁸-1.10 × 10⁻⁵-[60]
Nanjing20134.53 × 10−62.91 × 10−84.72 × 10−71.11 × 10−71.07 × 10−7[61]
Changzhi20188.30 × 10−65.00 × 10−81.66 × 10−61.00 × 10⁻⁷-[62]
Publisher’s Note: MDPI stays neutral with regard to jurisdictional claims in published maps and institutional affiliations.

