Article

Observation of Aircraft Wake Vortex Evolution under Crosswind Conditions by Pulsed Coherent Doppler Lidar

1
College of Information Science and Engineering, Ocean Remote Sensing Institute, Ocean University of China, Qingdao 266100, China
2
Laboratory for Regional Oceanography and Numerical Modeling, Pilot National Laboratory for Marine Science and Technology (Qingdao), Qingdao 266200, China
3
Institute for Advanced Ocean Study, Ocean University of China, Qingdao 266100, China
*
Author to whom correspondence should be addressed.
Atmosphere 2021, 12(1), 49; https://doi.org/10.3390/atmos12010049
Submission received: 15 November 2020 / Revised: 23 December 2020 / Accepted: 28 December 2020 / Published: 31 December 2020
(This article belongs to the Special Issue Weather and Aviation Safety)

Abstract

:
The observation and identification of wake vortex are considered important factors to reduce aviation accidents and increase airport capacity. In addition to aircraft parameters, the evolution process of the wake vortex is strongly related to atmospheric conditions, including crosswind, headwind, atmospheric turbulence, and temperature stratification. Crosswind generally affects the wake vortex trajectories by transporting them to the downwind direction. Additionally, the circulation attenuation of wake vortex is also influenced by crosswind shear or turbulence related to crosswind. This paper implemented the range height indicator (RHI) scanning mode of pulsed coherent Doppler lidar (PCDL) to study the influence of crosswind on wake vortex evolution. The crosswind was obtained from the non-wake vortex regions of the RHI sectors. The method, based on the measurements of radial velocity and spectrum with the broadening feature, was performed to locate wake vortex cores. The wake vortex trajectories with various crosswind strengths were comprehensively analyzed.

1. Introduction

Aircraft wake vortices are rapid contra-rotating air masses created by the lift force of the wings. These vortices always come in pairs and may cause serious hazards to closely following aircraft, especially during take-off and landing phases [1,2]. If the following aircraft flies into the wake vortex areas, there will be adverse influences on the subsequent flight such as increased structural dynamic loads, loss of the stable flight condition, and induced rolling moment [3]. To avoid wake vortex encounters, the following aircraft must keep enough safety separation according to the empirical motivated separation standards [4,5]; these usually overestimate the hazardous areas and thus reduce the airport capacity [6,7,8]. Therefore, the observation and identification of wake vortex are important to improve airport operational efficiency and ensure aviation safety.
Wake vortex evolution characteristics are closely associated with atmospheric parameters, including crosswind, headwind, atmospheric turbulence, and temperature stratification. To explore wake vortex characteristics such as core position, circulation, dissipation rate, and lifespan under the above-mentioned atmospheric conditions, previous studies have mainly adopted three techniques: wind field measurements, numerical simulations, and wind-tunnel tests [9,10,11,12,13]. Wind field observation, whose biggest advantage is obtaining actual meteorological parameters, has been widely applied in wake vortex studies. As the only instrument for wake vortex detection in clear air [2], coherent Doppler lidar (CDL) has successfully estimated wake vortex parameters by using the velocity envelope (VE) method under the condition of high signal-to-noise ratio (SNR) [14] and the radial velocity (RV) method with low SNR [15]. A hybrid algorithm that combines a non-parametric method and an algorithm using estimators was presented and verified. The results have shown that the hybrid algorithm was more accurate than traditional lidar processing methods and faster than maximum likelihood estimation [16].
The full evolution process of wake vortex can be subdivided into different stages, including the near field, the extended near field, the midfield, the far field, and the decay region [17]. The wake vortex characteristics of various stages are largely influenced by atmospheric factors. The wake vortex decay process may be greatly affected by the length scales of atmospheric turbulence through the dissipation rate [18]. Lidar measurements of 8056 landings in several international airports were analyzed, and results suggested that the number of encounters increased from 1.5% to 3.7% because of the influence of vortex rebound at the initial altitudes below 50 m [19]. In addition to atmospheric turbulence, crosswind shear also results in significant changes to the generation, development, and decay process of the aircraft wake vortex. Contra-rotating vortices usually have equal intensity and disappear together in the absence of crosswind shear. However, when the crosswind shear occurs, unequal decay appears and the vortex trajectory will be changed [20]. The results of the large eddy simulation (LES) model have confirmed that the vortex decay rate also depends on the vertical gradient of crosswind shear [21]. Considering that the wake vortex can be transported out of the corridor due to crosswind, a minimum crosswind velocity threshold was estimated to reduce the separation between two adjacent aircraft [22,23,24]. The numerical simulation illustrated that the rebound of the downwind vortex is earlier and stronger with the faster circulation decay than the upwind vortex [25]. The LES also has been carried out to explore the behaviors of wake vortex at various crosswind strengths in detail, and the simulation results corroborate that a crosswind of 0.5 ω0 may present potential hazards to the following landing aircraft because of the windward stall produced by the crosswind [26]. The influence of crosswind on wake vortex is weak based on observational results, although a light crosswind is enough to cause the rebound effect [27]. Furthermore, the circulation attenuation of the upwind wake vortex was observed by CDL to be more dependent on atmospheric turbulence than the downwind wake vortex [2].
This paper is organized as follows. Section 2 introduces the wake vortex observation experiments and the methods of crosswind retrieval and wake vortex identification. Section 3 analyzes and discusses the influence of crosswind on wake vortex trajectories. The conclusions of this paper are summarized in Section 4.

2. Experiments and Methodology

2.1. Experiments

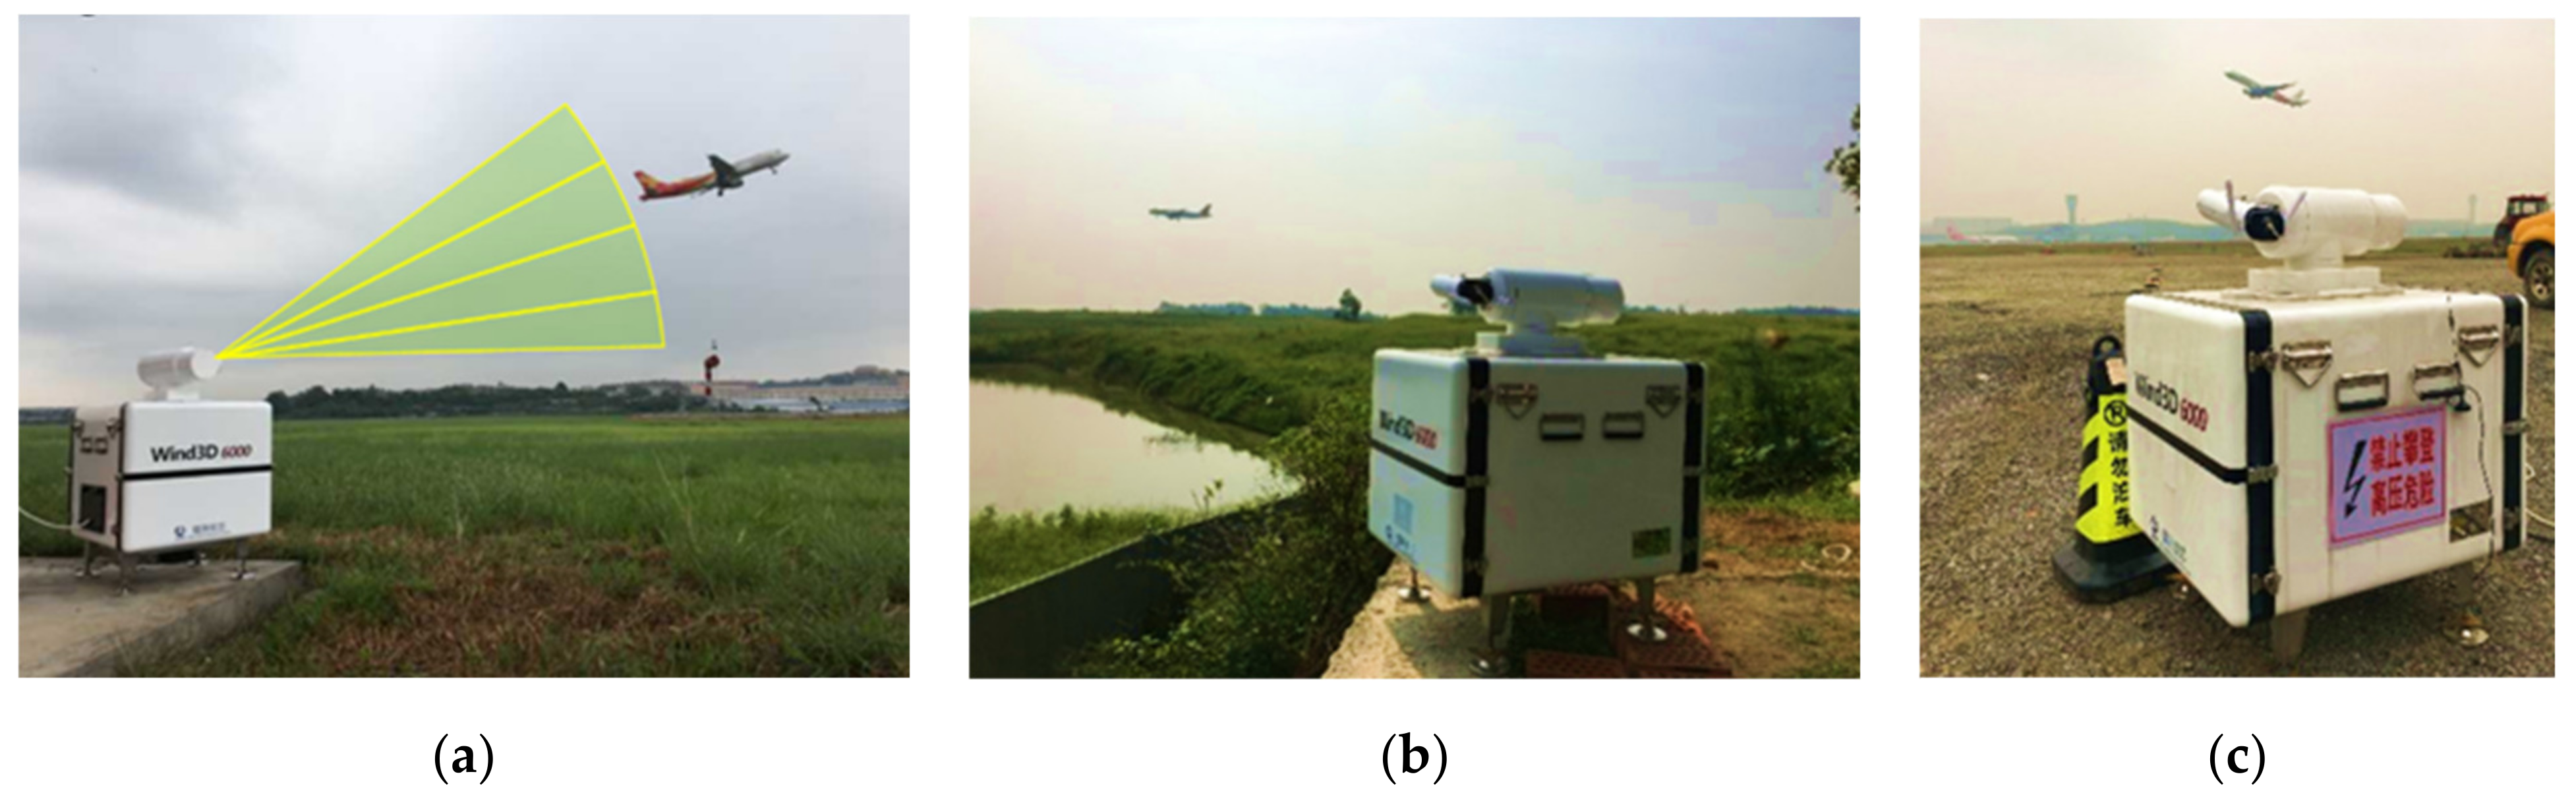
2.1.1. Wake Vortex Observation Experiments

Wake vortex observation experiments (WVOEs) were carried out from 6 August 2018 to 22 October 2018 in Sichuan Province, China, to identify aircraft wake vortex during take-off and landing phases to explore the influence of atmospheric elements on wake vortex evolution processes. In order to establish different observation locations and fulfill research objectives, the WVOE was divided into three main sub-experiments: the aircraft wake vortex observation for the take-off phase at Mianyang Nanjiao Airport (MNA), the landing phase at the Chengdu Shuangliu International Airport (CSIA), and the take-off phase at CSIA. These are shown in Figure 1. Table 1 lists the detailed experimental information about WVOEs.

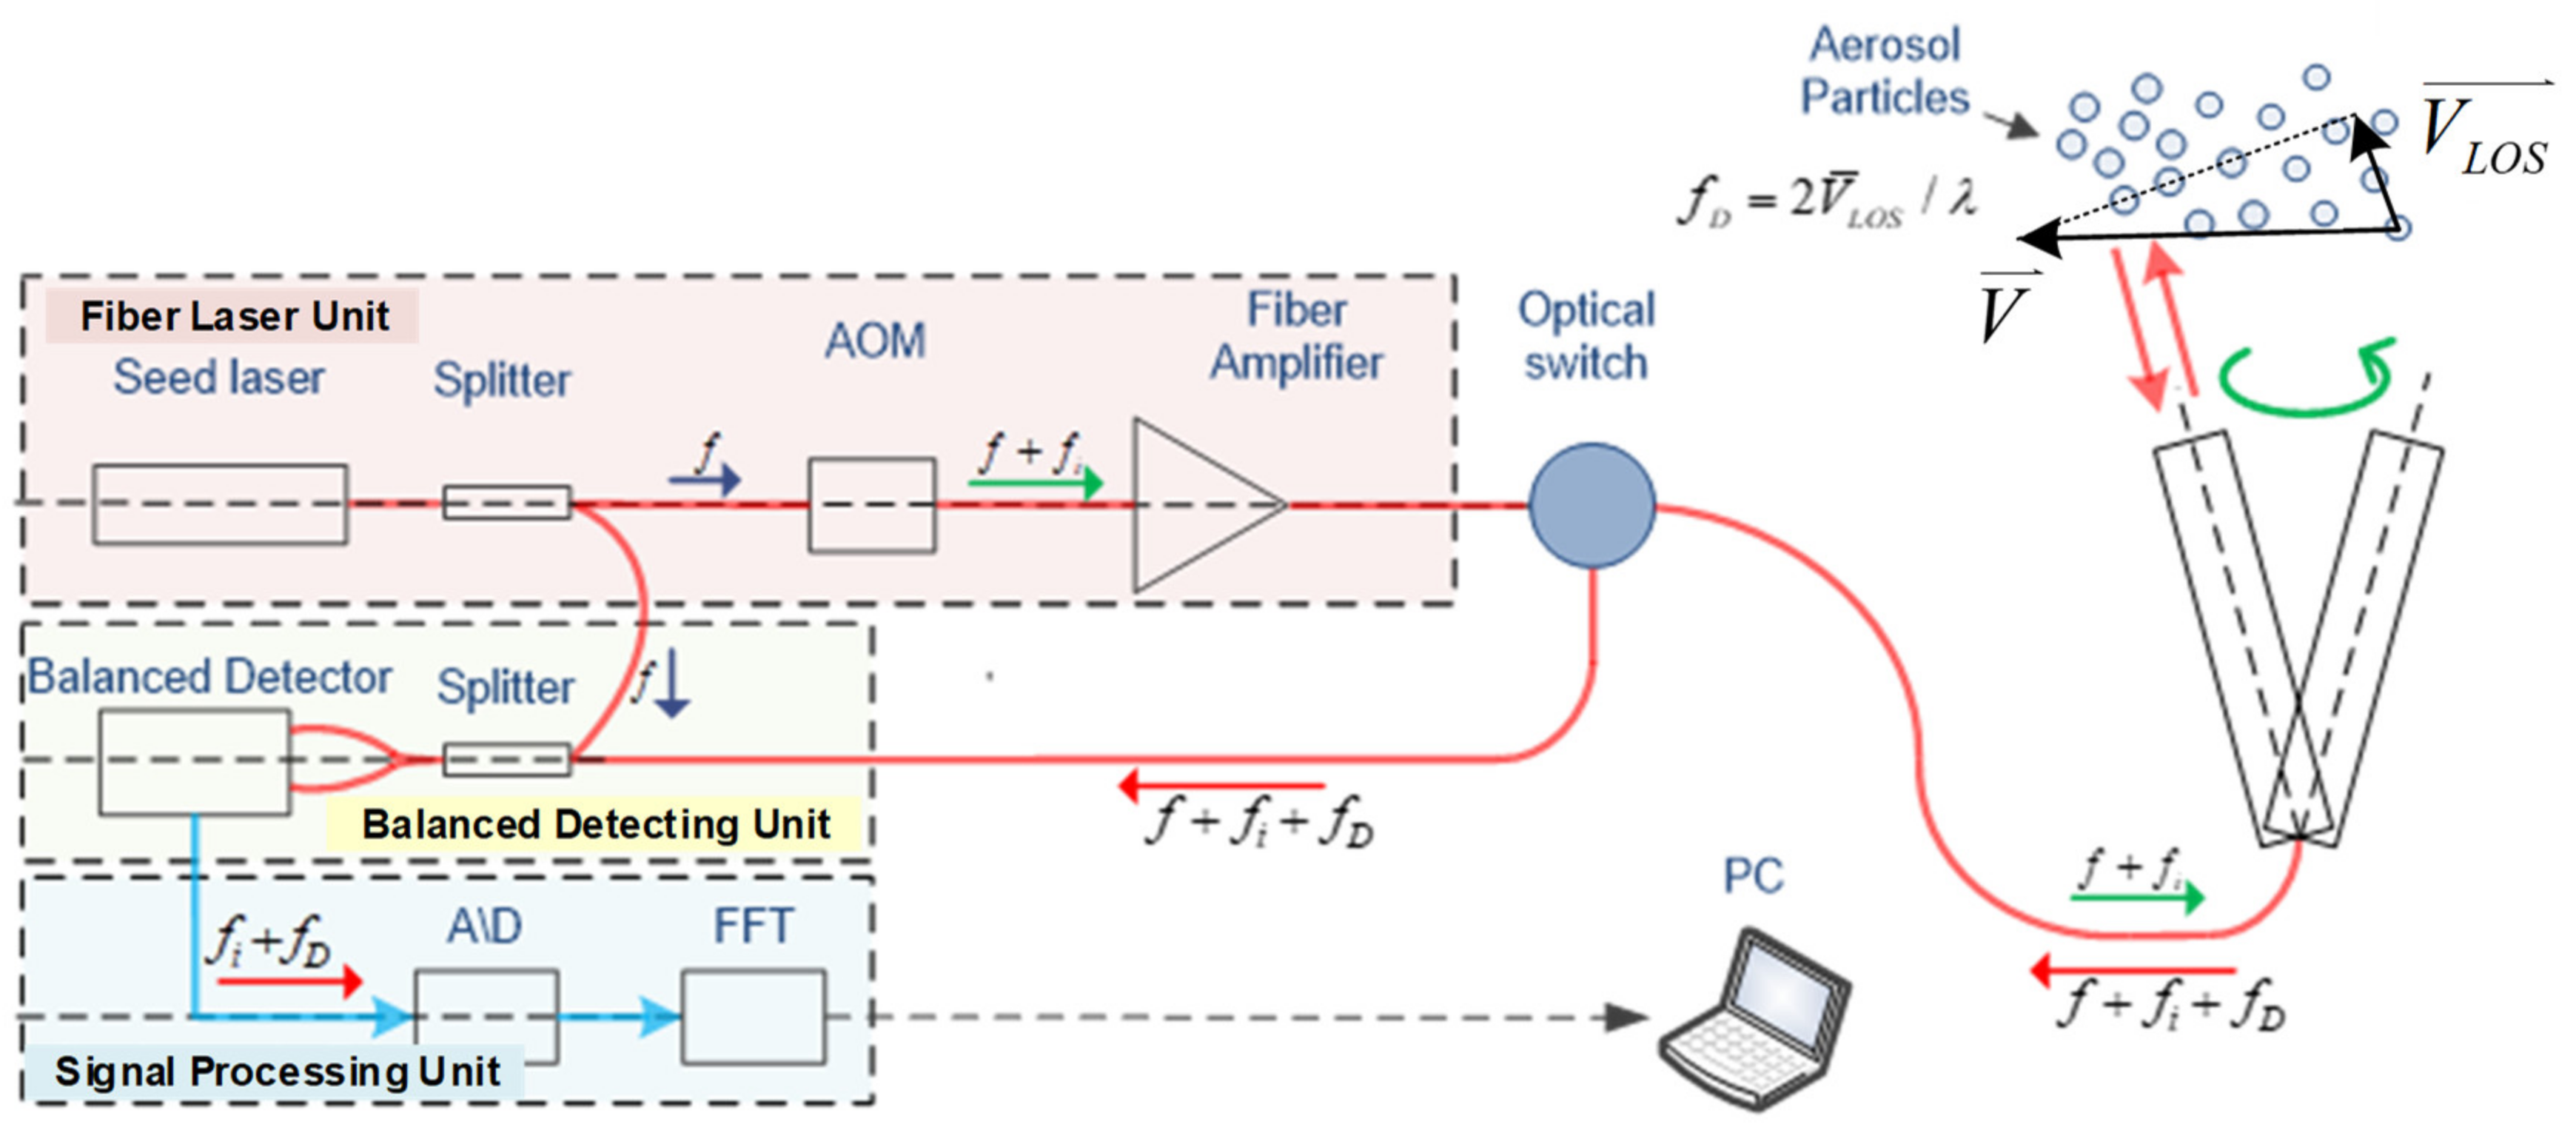
2.1.2. Pulse Coherent Doppler Lidar System (PCDL)

The WVOE adopted the PCDL system Wind3D 6000, manufactured by Leice Transient Technology Co. Ltd., to detect the small scales and quick evolution processes of aircraft wake vortex. The literatures [2,28,29] comprehensively describe the principle and optical components of the Leice-Lidar PCDL series. Wind3D 6000 consists mainly of three system units: (1) the fiber laser unit, (2) the balanced detecting unit, and (3) the signal processing unit; these are shown in Figure 2. Wind3D 6000 scanning wind lidar makes use of all-fiber laser and heterodyne detection technology. The seed laser’s wavelength is 1.55 μm, with a linewidth of 1.6 kHz. The laser technology of the master oscillator power amplifier (MOPA) obtained an eye-safety pulsed laser with high beam quality (M2 = 1.2). Depending on the acoustic optic modulator (AOM) and MOPA, the pulsed laser energy is approximately 150 μJ and the pulse repetition frequency (PRF) is 10 kHz. The pulse width related to the gating pulse width of the AOM can be adjustable from 100 ns to 400 ns, corresponding to the spatial resolution of 15 m to 60 m. During the WVOE, we operated the Wind3D 6000 with a pulse width of 100 ns and the sampling time of 1 GHz, which meant that the longitudinal size of the effective probing volume was approximately 27 m. The Doppler shift of the backscattered signal was estimated to obtain the radial velocity with a measurement accuracy of 0.1 m/s along the laser beam pointing direction. The technical specifications of Wind3D 6000 scanning wind lidar are given in Table 2.

2.1.3. Scanning Strategy Design
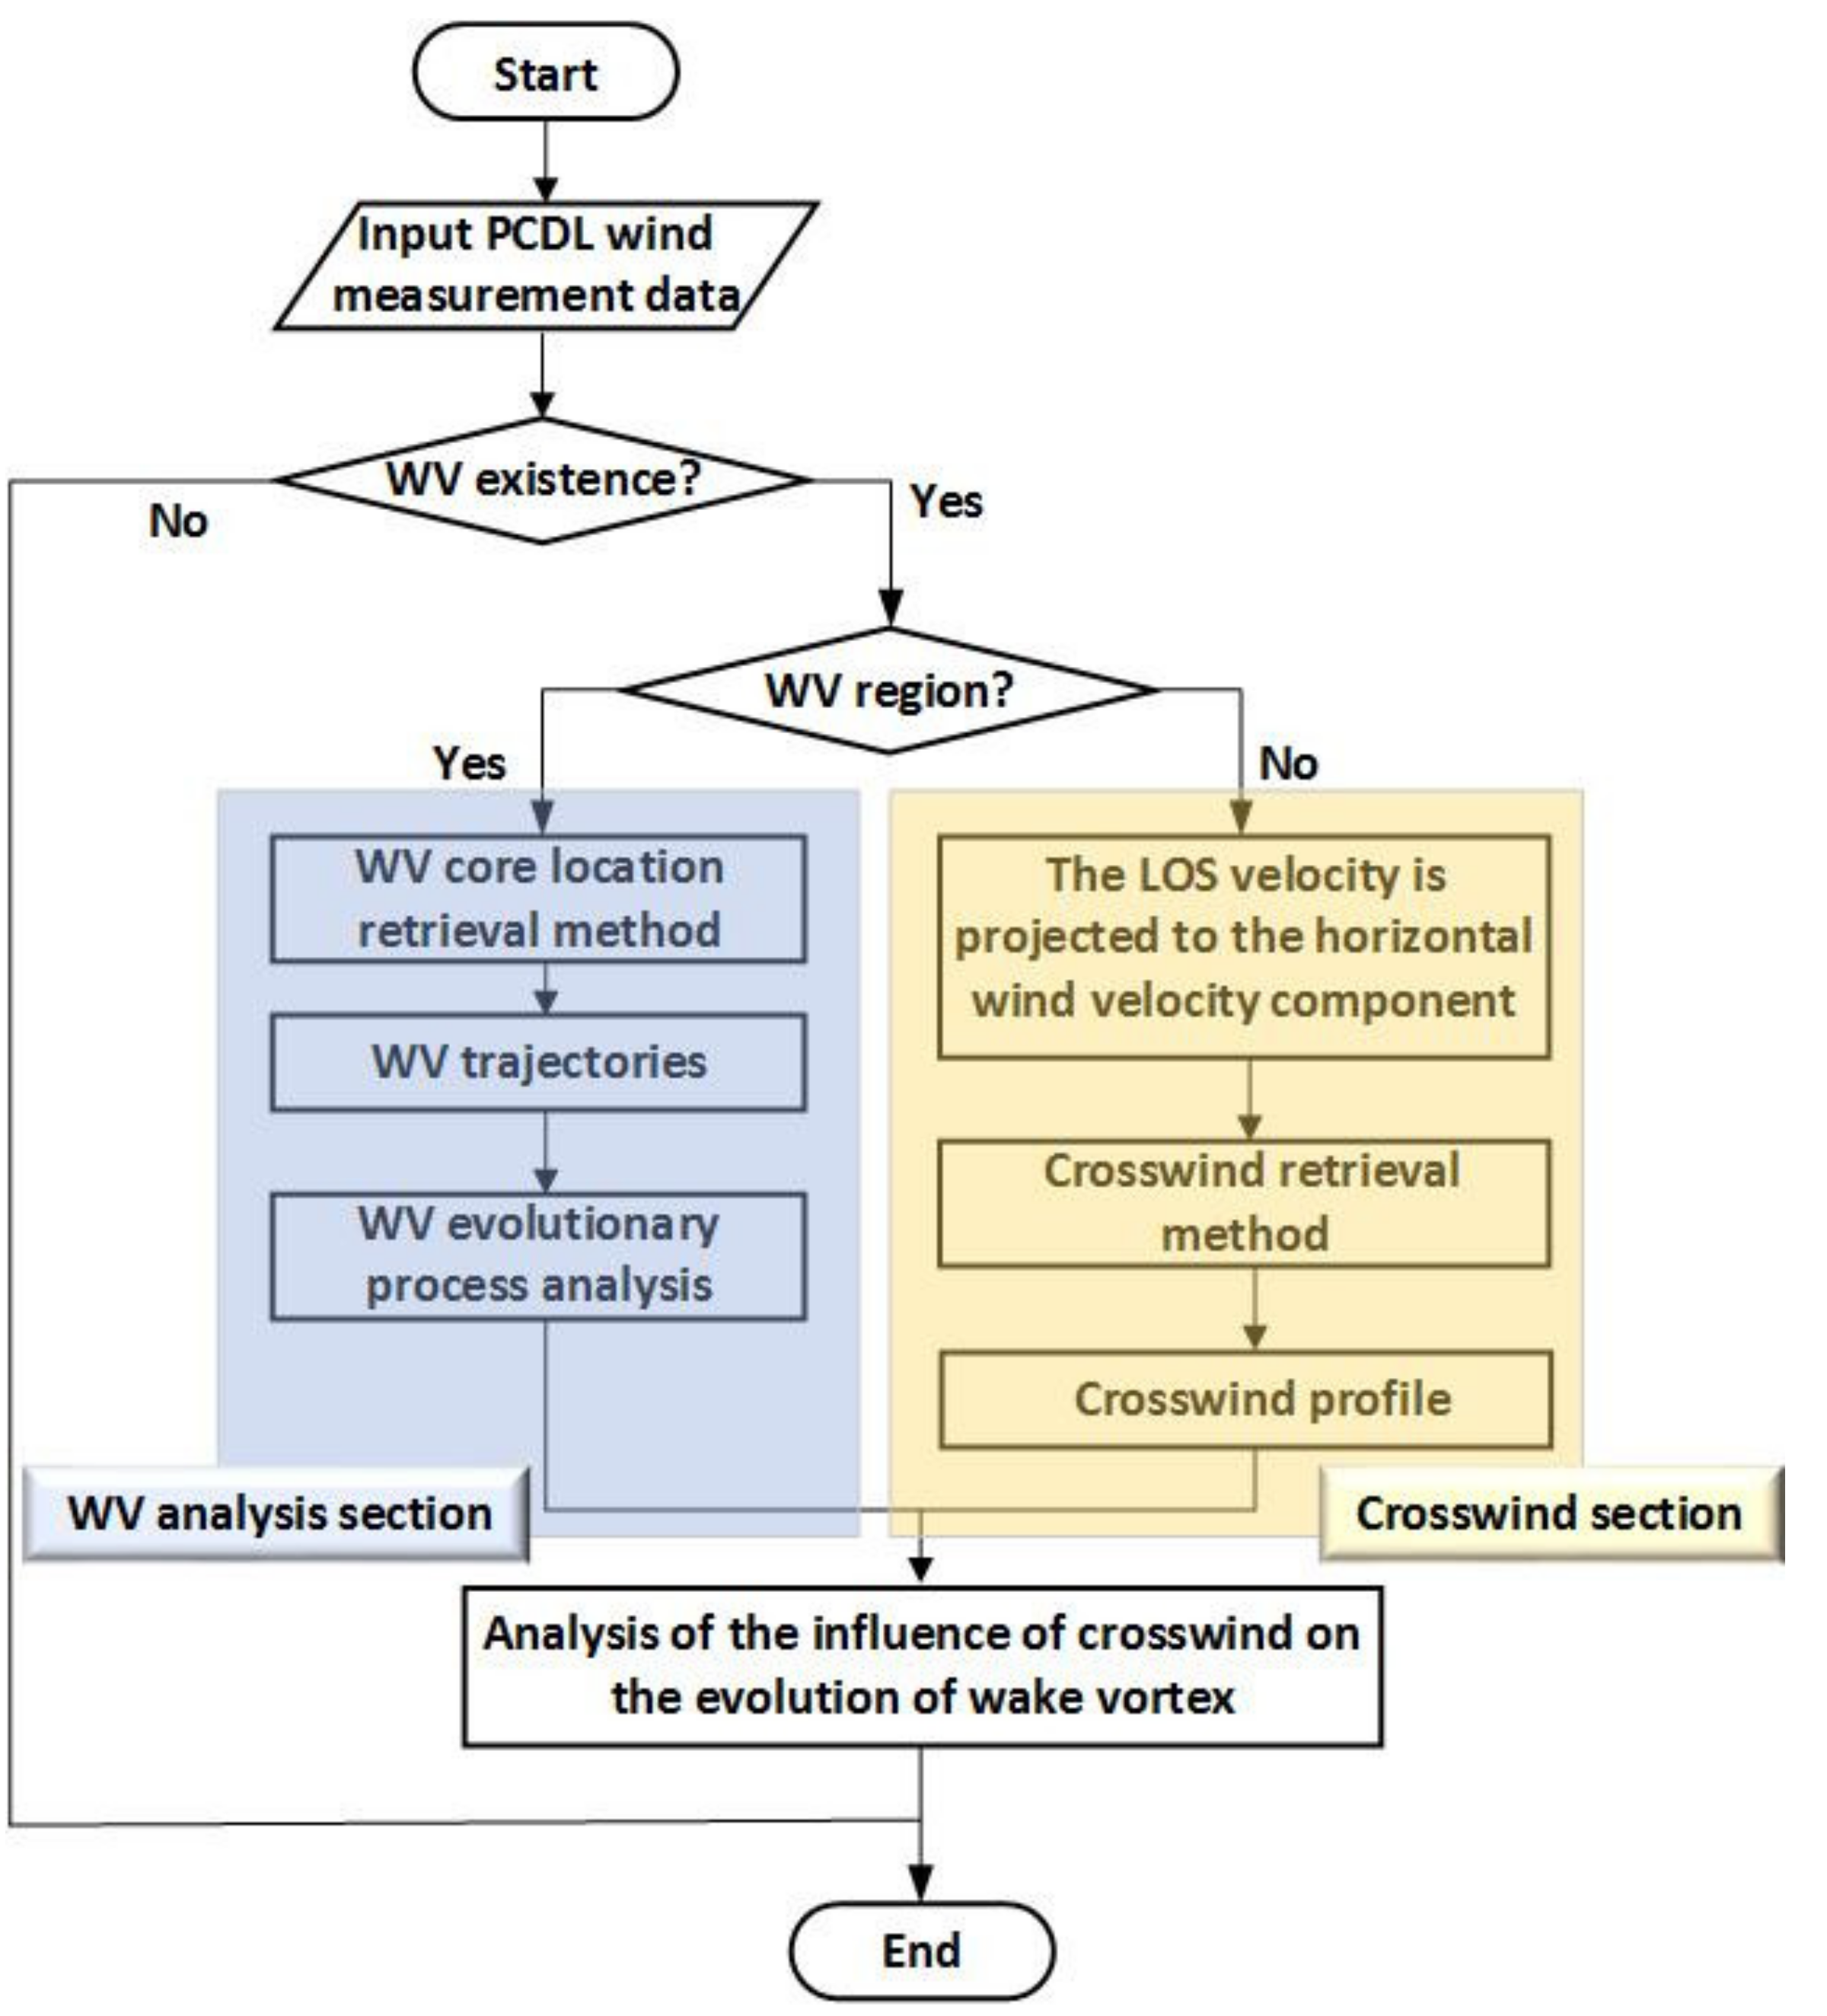
The PCDL conducted the range height indicator (RHI) to detect the aircraft wake vortex and obtain the crosswind field during the WVOE. The RHI scanning mode was designed to describe the fine structure of small scale wake vortex with the elevation angle resolution Δ φ   between 0.1° and 0.4°, corresponding to the transverse resolution at range R of probing volume R Δ φ (the unit of Δ φ is radian in this formula). For instance, if range R is 150 m, the transverse resolution will be approximately 0.3 m~1.0 m. The duration of one RHI scan takes 10 s to 20 s, with a lidar beam scanning speed of 1°/s~2°/s. Considering the lidar experimental location, the scanning velocity, and the transverse resolution, the elevation angles of RHI scanning mode were set to 0°~25° for the take-off phase at MNA, 0°~10° for the landing phase at CSIA, and 5°~25°for the take-off phase at CSIA, as shown in Table 3. The PCDL scanned alternately up and down using the RHI scanning mode on the plane perpendicular to the runway. Table 3 shows the detailed information of the experimental configuration.

2.2. Methodology

Figure 3 shows the flowchart analyzing the influence of crosswind on the wake vortex evolution; it details the wake vortex analysis section and crosswind section, based on the PCDL RHI measurement.

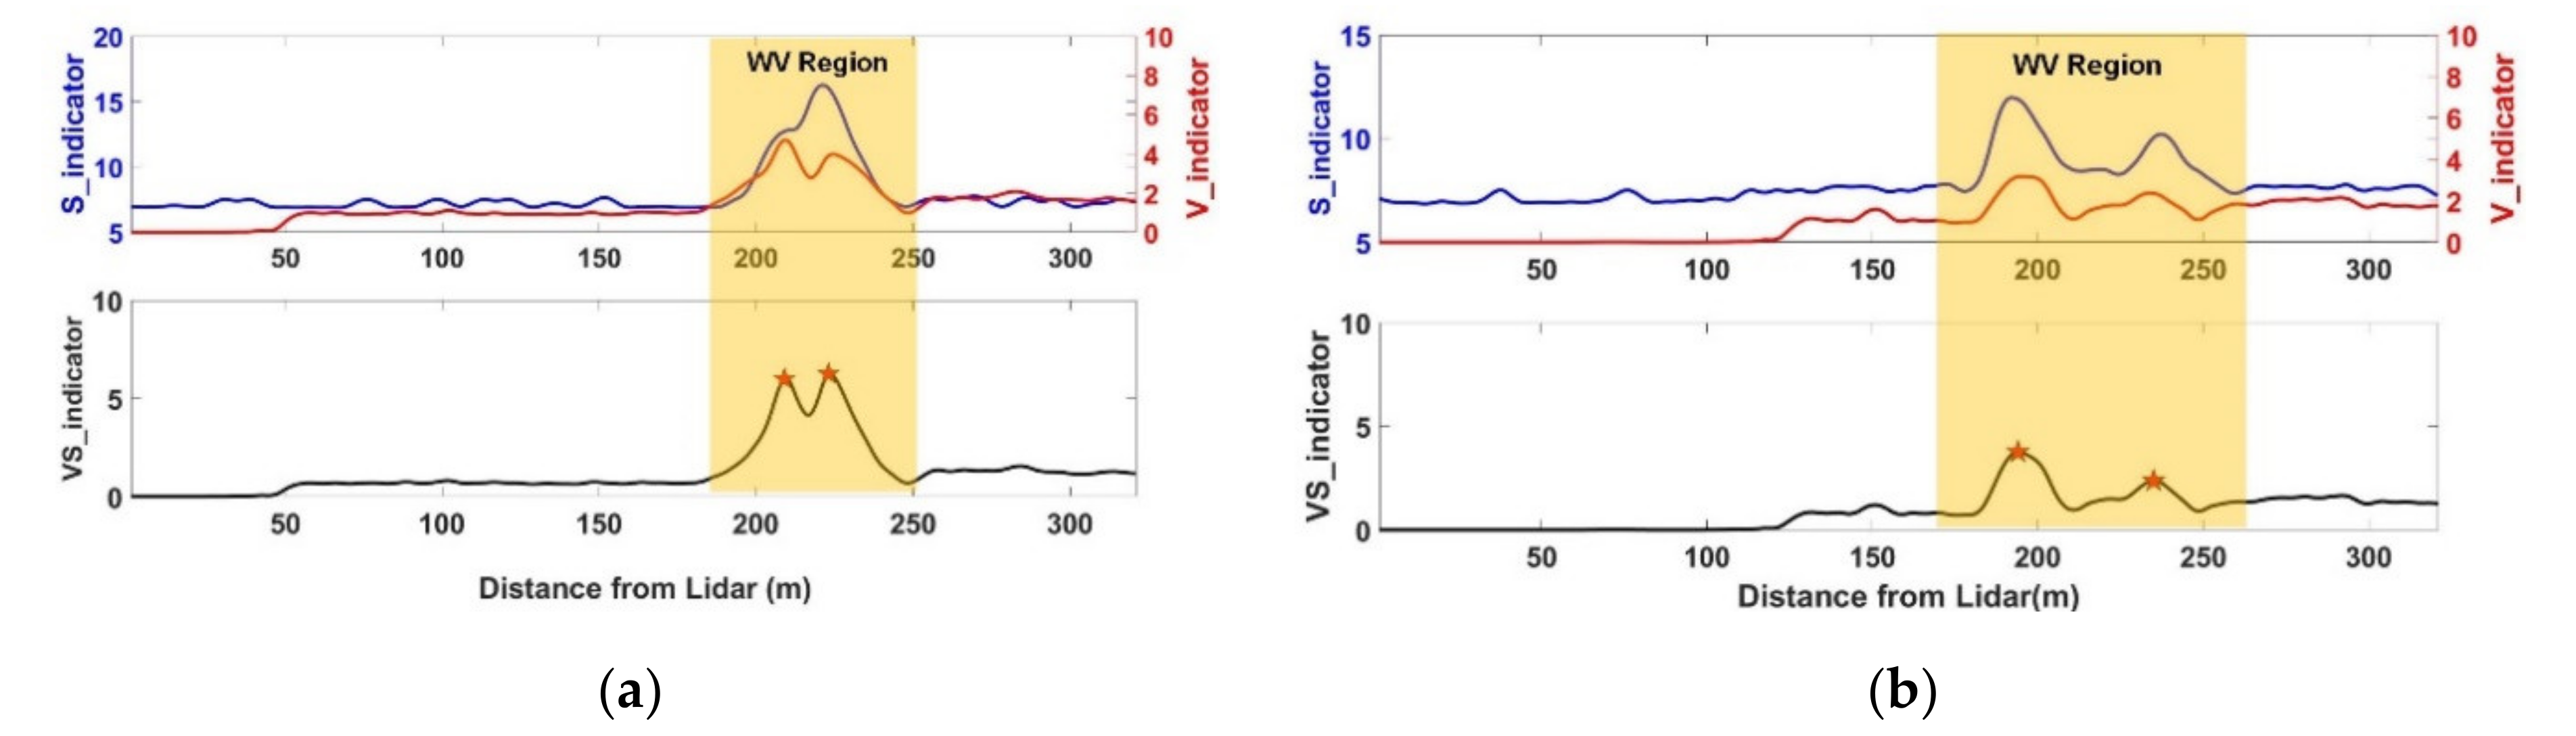
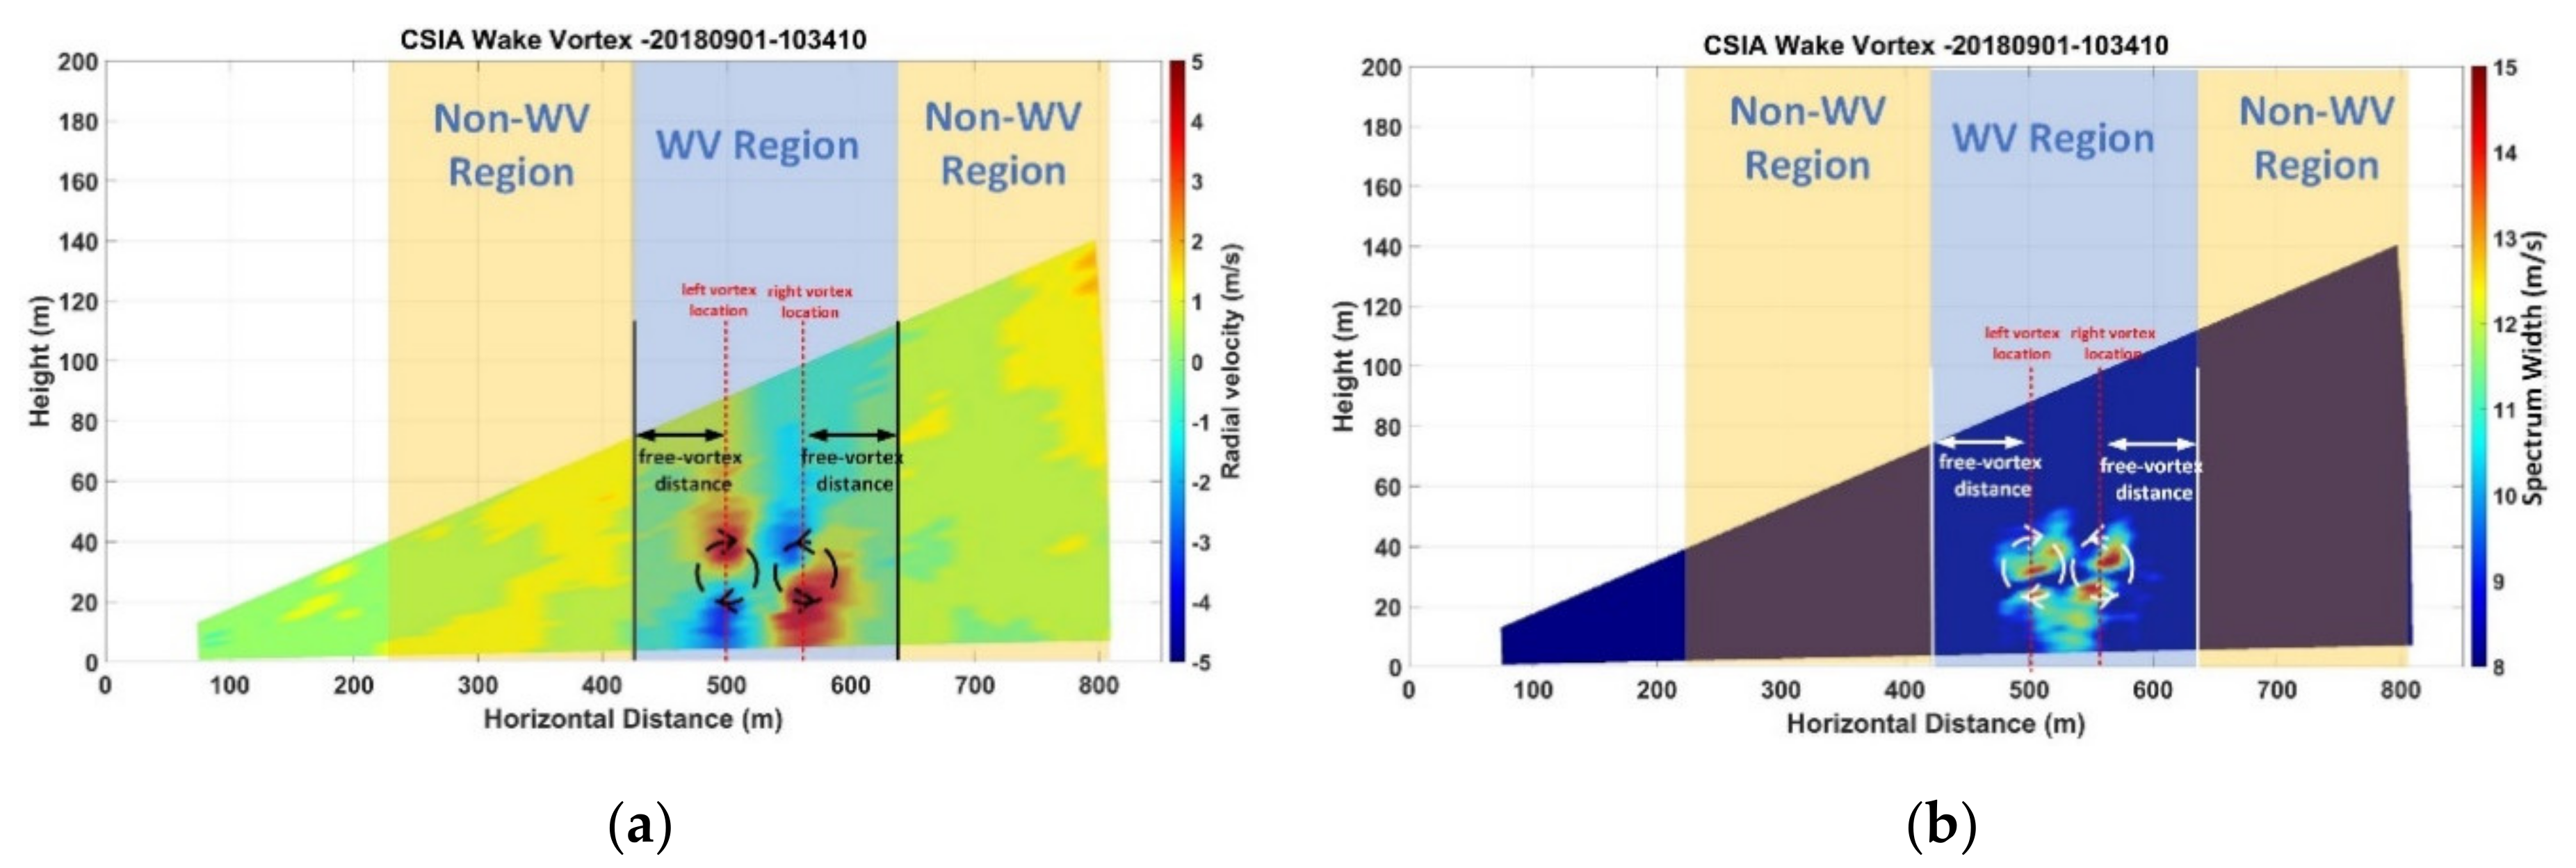
2.2.1. Wake Vortex Core Position Identification Method

The location and circulation of aircraft wake vortex are the two most important characteristic elements for evaluating the hazard of the wake vortex. It is not harmful to the following aircraft when the vortex position is outside the flight corridor or the velocity circulation intensity is weak. Previous studies have generally adopted two analytical ways to optimize the identification method of vortex cores. The first is a comprehensive method that takes into account the Fast Fourier Transform (FFT) spectrum and radial velocity of the PCDL RHI measurement [2]; this is the method used in this paper. The second method combines the observed radial velocity of PCDL and the simulated Doppler velocity distribution of RHI scans [30,31].
The wake vortex makes the radial velocity distribution of PCDL RHI scans different to the ambient wind field with the crossover structure of positive and negative values; thus, it is possible to separate the wake vortex from the environment wind field, as shown in Figure 4a. Apart from the anomaly of radial velocities, wake vortex tangential velocities also cause the spectrum to broaden. In a single sampling volume, the FFT spectrum data in the wake vortex region usually have three Doppler velocities––the main spectral velocity, the minimum velocity, and the maximum velocity [14,32]––when a certain threshold is given. The minimum or maximum velocity related to vortex tangential velocity can be used as an indicator for the presence or absence of the wake vortex in PCDL RHI scans. The Doppler shift difference between the minimum and maximum velocities is called the spectrum width in this paper. Figure 4b shows the spectrum width distribution in RHI scans when an A333 aircraft landed at CSIA at 13:29 on 26 August 2018. The wake vortex induced significant spectral broadening at 500 m away from PCDL, as shown in Figure 4b.
Both radial velocity (RV) and spectrum width (SW) can be utilized not only as indicators of wake vortex existence but also to get the positions of vortex cores. The traditional RV method was frequently used to locate the wake vortex core positions in [2,15,31] with Equation (1), where V m i n R k , θ and V m a x R k , θ   are the minimum and maximum radial velocity, respectively, at each range R k with different elevation angles of PCDL θ i , as shown in Equation (2). In addition, R k = R 0 + k Δ R   is the distance away from the PCDL, R 0 is the minimum measurement range, and k = 0 , 1 , 2 , , K 1 .
V k = V m i n R k , θ + V m a x R k , θ ,
V m i n R k , θ = min V R k , θ i ,     θ i θ m i n , θ m a x , V m a x R k , θ = max V R k , θ i ,   θ i θ m i n , θ m a x ,
When the high wake vortex circulation is accompanied by the weak ambient wind field, as shown in Figure 5a, Case 1, the anomaly radial velocity will be different from the background wind field. At this moment, V i n d i c a t o r in Equation (3) should have two pronounced peaks corresponding to the left and right wake vortex cores [2,31]. However, as the wake vortex dissipates, it is difficult to distinguish the wake vortex from the ambient wind field, as shown in Figure 5b, Case 2, by using V i n d i c a t o r . Fortunately, Figure 5e, Case 2, clearly describes the spectrum width distribution at the same time, so the SW method [33] is also proposed as Equation (4). Consistent with the RV method, S i n d i c a t o r in Equation (5) also has a bimodal structure during the vortex initial generation phase (Figure 5d, Case 1) and the dissipation phase (Figure 5e, Case 2). Figure 5f, Case 3, implies the limitation of the SW method, which has only the single peak in the vortex initial generation phase due to the fusion spectrum width of the left and right vortex cores because of the narrower wingspan of ARJ21. Although the SW method is invalid in Case 3, the radial velocity distribution still has double peaks to identify the core locations as shown in Figure 5c, Case 3. ARJ21 in Case 3 has weaker vortex intensities and a smaller initial distance between the left and right cores as compared to B788 in Case 1 and Case 2.
V i n d i c a t o r = V 0 , V 1 , V 2 , , V k , , V K 1 ,
S k = max S R k , θ i ,   θ i θ m i n , θ m a x ,
S i n d i c a t o r = S 0 , S 1 , S 2 , , S k , , S K 1 ,
Considering the various situations in Case 1, Case 2, and Case 3, V S i n d i c a t o r is introduced into this paper to comprehensively estimate the vortex core positions’ combined RV method and SW method in Equation (6), where f is the weight factor. In this paper, f is set as 0.1. This method has the superiority of higher accuracy in identifying the wake vortex horizontal position in various complex situations, such as the cases in Figure 6a,b. In Figure 6a, the single peak of fusion spectrum width cannot be used to locate the vortex core positions. Additionally, the velocities of double peaks of V i n d i c a t o r in the wake vortex (WV) region (as shown in Figure 6b) are not significantly different from the values in the non-WV region, which may cause incorrect location in some situations, such as stronger ambient wind field. Therefore, only using V i n d i c a t o r or S i n d i c a t o r will have lower location accuracy in some complex situations. Figure 6a,b show the good performance of V S i n d i c a t o r in accurately locating the horizontal positions of wake vortex with the obvious bimodal structure in the above two complex situations.
V S i n d i c a t o r = f * S i n d i c a t o r * V i n d i c a t o r .
The V S i n d i c a t o r is mainly used to determine the horizontal positions of wake vortex cores in various complex situations, considering the less obvious velocity distribution during the dissipation phase and the influence of aircraft wingspans on spectrum width distribution. After determination of wake vortex horizontal positions using   V S i n d i c a t o r , the vertical positions of wake vortex can be estimated by the elevation angles specified in [2,31]. Based on the ideal wake vortex symmetric structure, the vertical positions of wake vortex cores can be estimated using Equation (7) from the elevation angles of minimum and maximum velocities. In Equation (7), θ i n d i c a t o r , θ V m i n and θ V m a x represent the elevation angles of the wake vortex core, minimum velocity, and maximum velocity, respectively.
θ i n d i c a t o r = θ V m i n + θ V m a x 2 .

2.2.2. Retrieval of the Ambient Wind Field

The wake vortex evolution process is easily affected by the atmospheric wind field, especially the crosswind. Crosswind generally affects the wake vortex trajectories by transporting them to the downwind direction. Additionally, the circulation attenuation of wake vortices is influenced by crosswind shear or turbulence related to crosswind. The RHI scanning section with wake vortex is divided into two regions: the wake vortex (WV) region and the non-WV region [30], as shown in Figure 7a (radial velocity) and Figure 7b (spectrum width). Taking the determination of the left boundary between the two regions as an example, the position of the left vortex core is determined in the first step. Then, a free-vortex distance is selected as the left boundary, as shown in Figure 7. It is important to ensure that the free-vortex distance is not affected by the left wake vortex. The same method is used for the right boundary.
The radial velocity V L O S in the non-WV region should be projected to the horizontal wind velocity component V H , as shown in Equation (8), where θ i is the elevation angle of PCDL. The subscripts   k and i represent the indices of different ranges and angles, respectively. Then, the crosswind velocity   V C h [2,34] can be estimated by Equation (9), where   L is the number of V H in a layer of thickness h k i .
V H h k i = V L O S h k i cos θ i ,   θ i θ m i n , θ m a x ,
  V C h = k i = 1 L V H h k i L ,

3. Results and Discussion

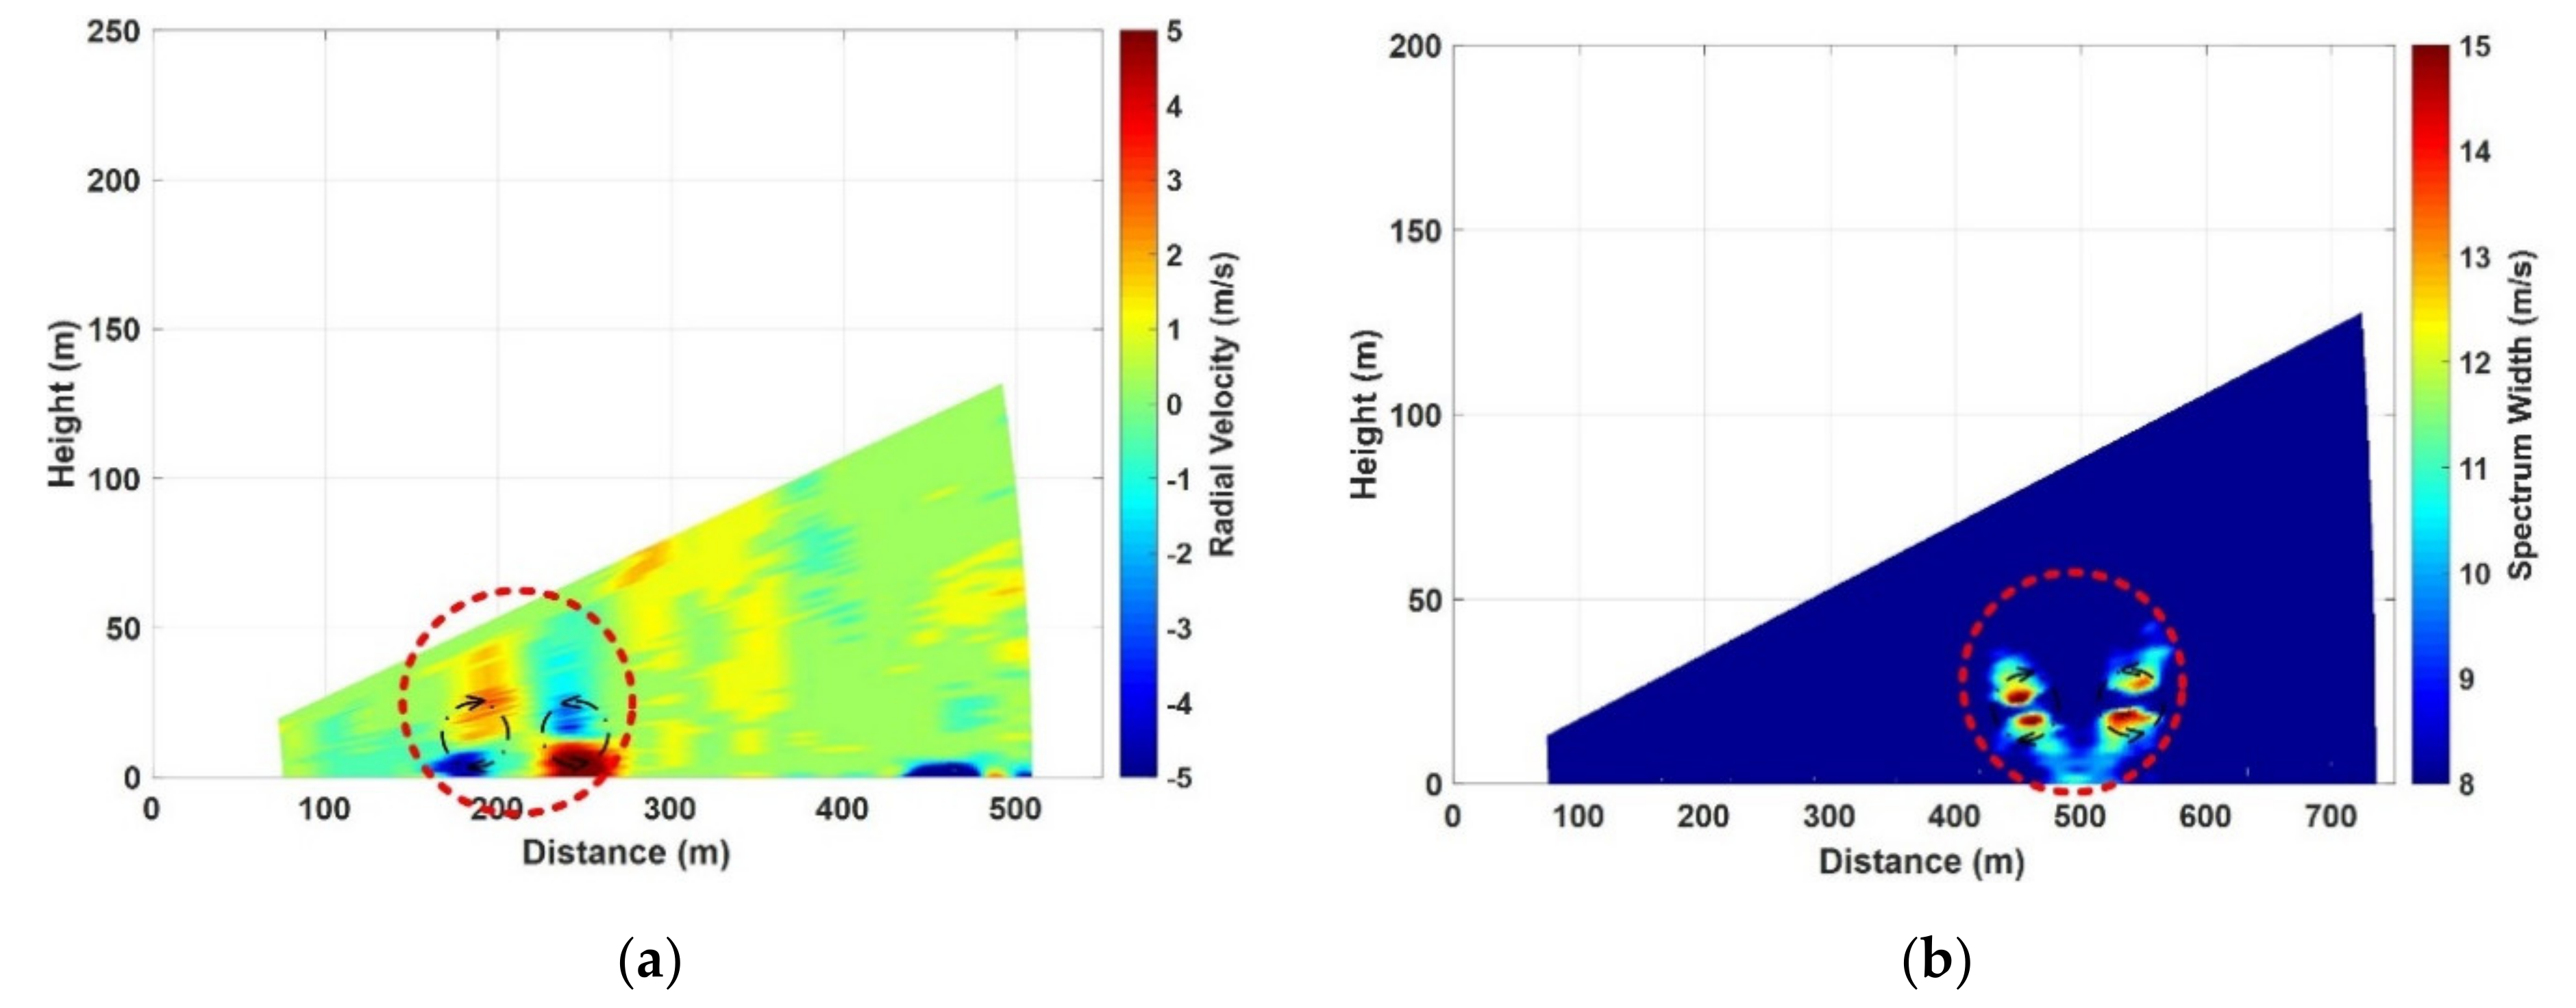
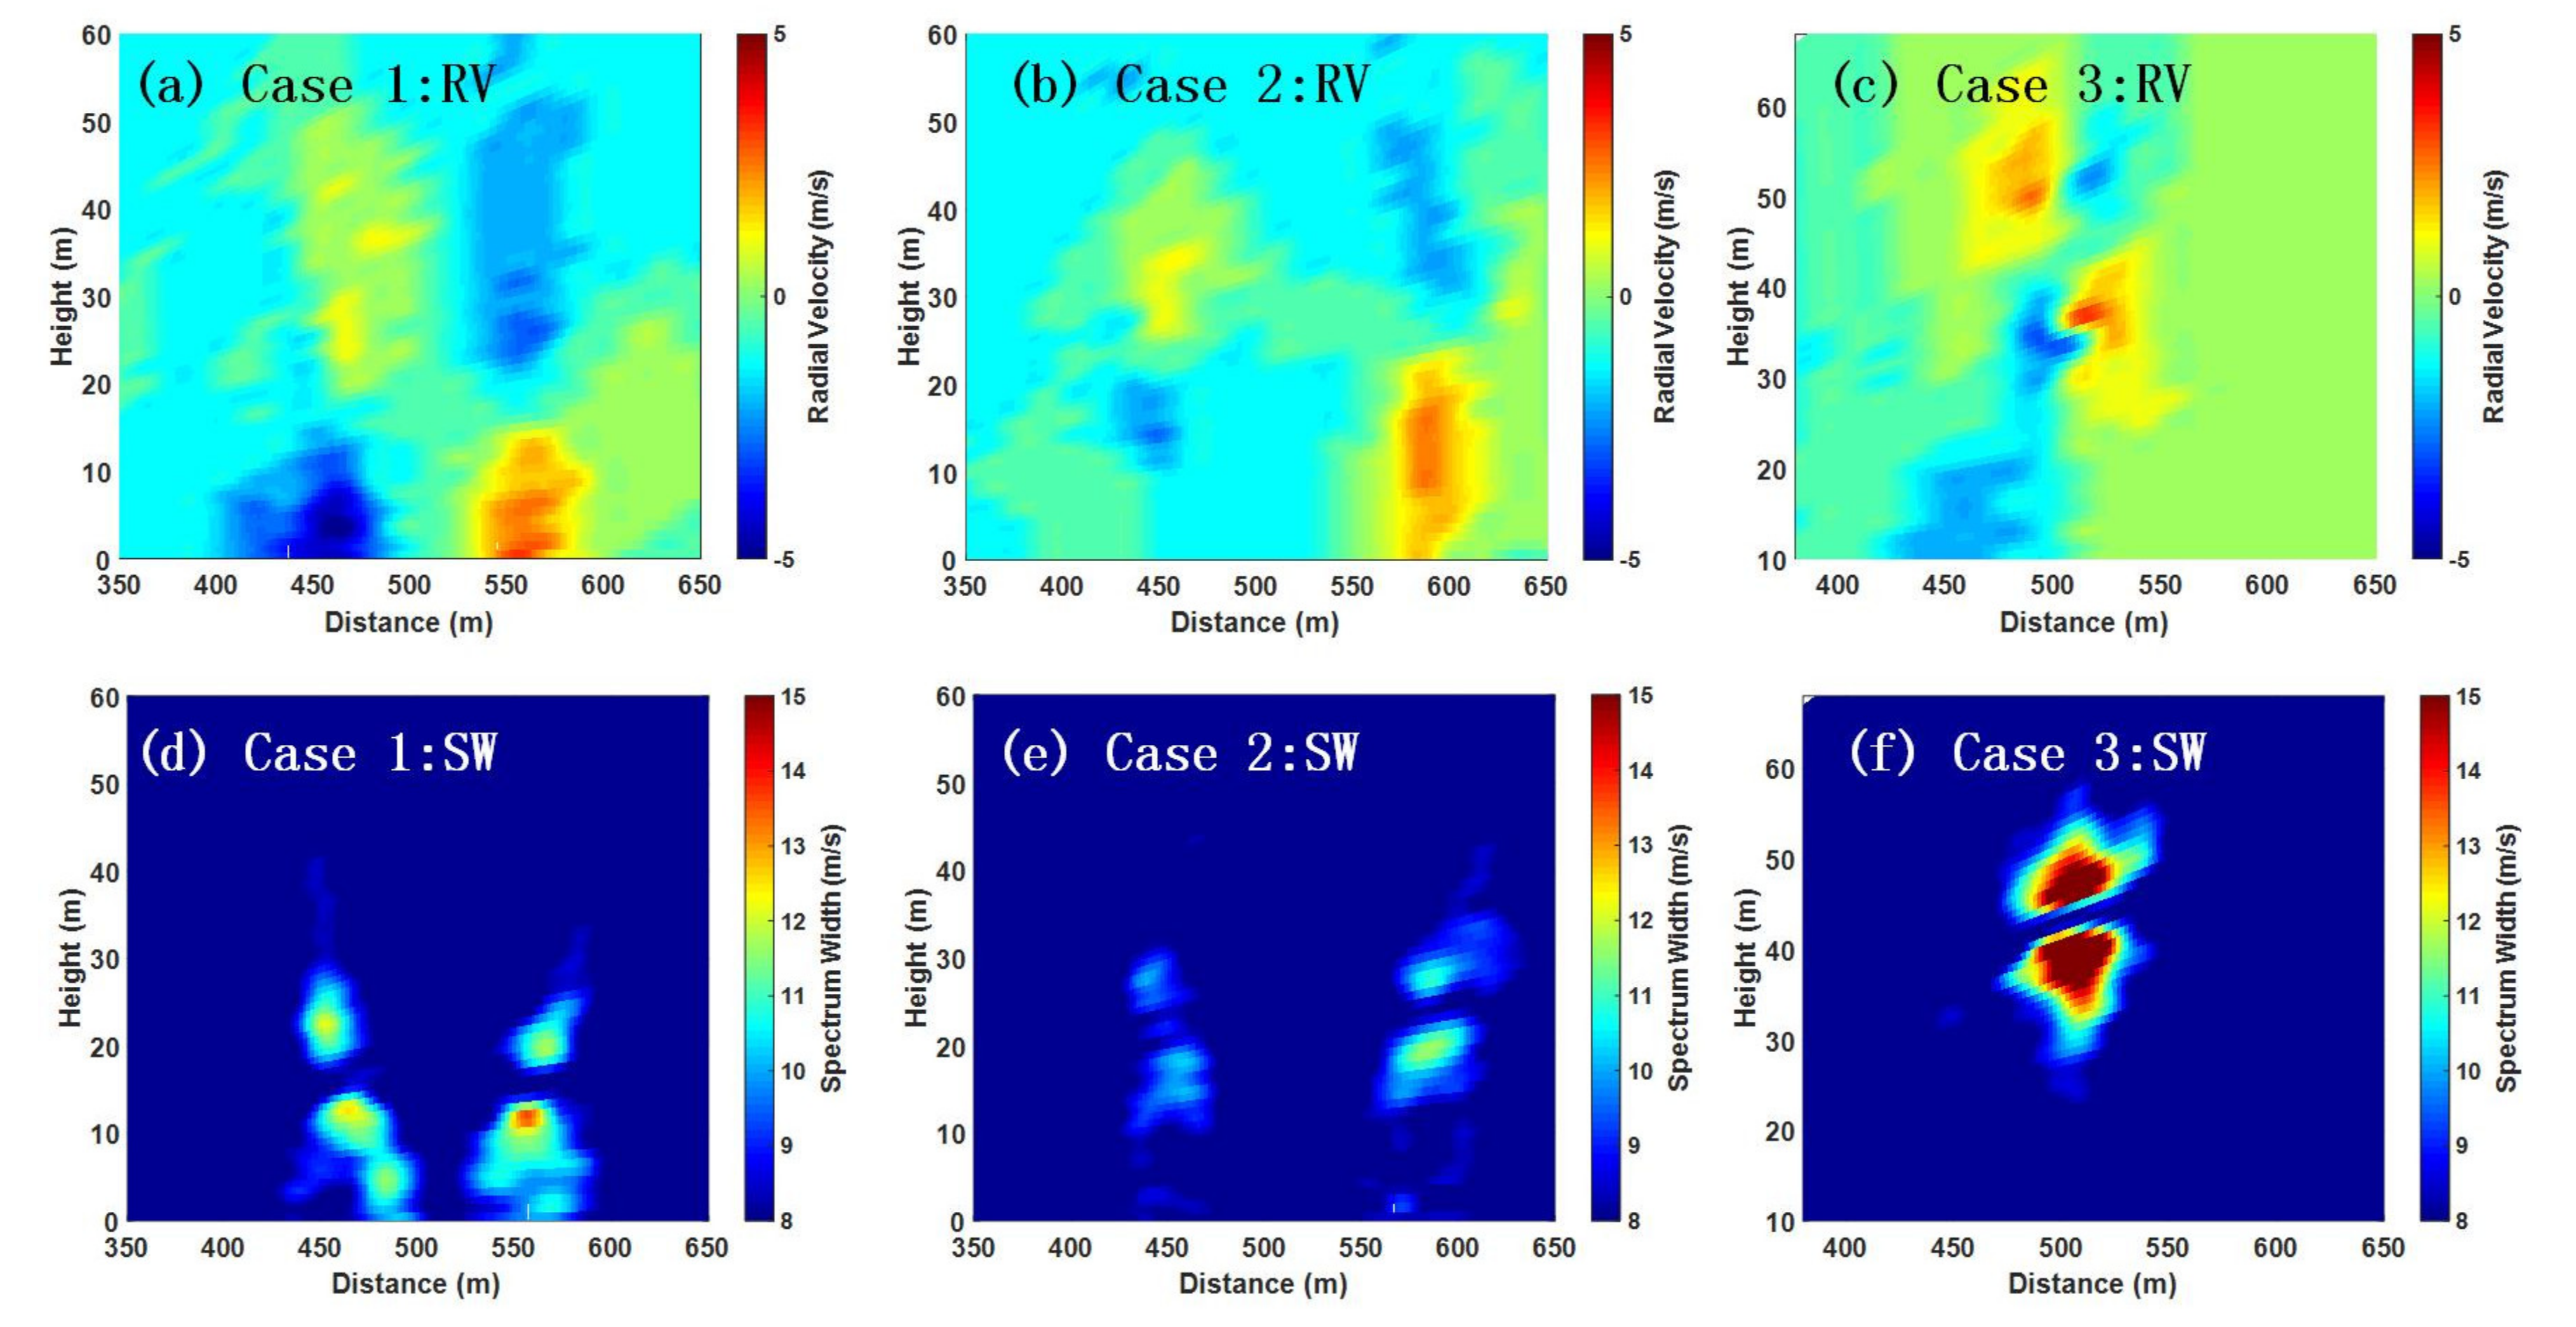
3.1. Characteristics of the Radial Velocity Distribution of Wake Vortex with and without Crosswind

Wake vortex evolution under stronger crosswind was captured by Wind3D 6000 PCDL at 10:32, 1 September 2018, when a B738 aircraft landed at CSIA, as shown in Figure 8, Case 1. During the initial generation stage, the wake vortex appeared approximately 50 m above the ground and 500 m away from the PCDL at T1 in Case 1, with the obvious crossover structure of radial velocity. Two evolutionary characteristics of the wake vortex should be noted in Case 1; they are described as follows.
First, the horizontal positions of the left and right vortex cores both moved away from the PCDL, influenced by the superposition of stronger crosswind and the self-induced lateral propagation velocity. The centerline of the left and right vortex cores drifted from 500 m at T1 to approximately 615 m at T5. Meanwhile, the left vortex (upwind vortex) core moved from 480 m to 510 m during T1~T5, accompanied by the right vortex (downwind vortex) core from 520 m to 700 m with the faster movement speed. As the wake vortex evolved, the distance increased between the left and right vortex cores, as is depicted in Figure 8, Case 1. Second, the wake vortex descended significantly from 50 m at T1 to approximately 30 m at T2. However, the falling process began to change due to the near ground effect from T3 to T5, during which both the left and right vortices rebounded. These observation results are compatible with the corresponding simulations in [26]. The rebound time of the left vortex (upwind vortex) started from T4 later than that of the right vortex (downwind vortex), which is consistent with the conclusion of the numerical simulation [25]. Additionally, the right (downwind) vortex was higher than the left (upwind) vortex after the rebound process, although the two heights were the same in the initial stage. These differences between the downwind and upwind vortices strongly depend on the crosswind strength, as explained in [26].
Figure 8, Case 2, shows the wake vortex trajectory of an A320 without crosswind at 08:11, 7 September 2018, during landing at CSIA. Wake vortex was generated approximately 40 m above the ground and 500 m away from the PCDL in the first RHI scan at t1. Contrary to Case 1, the centerline of the wake vortex was always kept at 500 m from t1 to t5 in Case 2. At the same time, the left and right vortices drifted in opposite directions at almost the same movement speed from 480 m to 450 m and from 520 m to 550 m, respectively, during t1~t5. In Figure 8, Case 2, the left and right vortices were always in a falling state, maintaining the same height, and were accompanied by a slight rebound at t5.
The comparison between Case 1 and Case 2 suggests that the crosswind changes the trajectory of the wake vortex, causing the asymmetrical evolution characteristic of the left and right vortices. Because of the superposition of the self-induced lateral transport of the vortices and the crosswind transport, upwind and downwind vortices drift at different movement speeds in the same direction, and the movement distance of the downwind vortex may be longer. The times and heights of the left and right vortex rebound are also different because of the environmental turbulence and the same or opposite signed wind shear vorticity [26]. Generally, the downwind vortex rebounds earlier and higher, which can be explained by the simulation conclusion that the opposite signed wind shear vorticity and atmospheric turbulence are increasing with wind velocity and accelerate vortex decay [26]. In the typical absence of crosswind, the wake vortices evolve symmetrically, with the same horizontal and vertical movement speed.

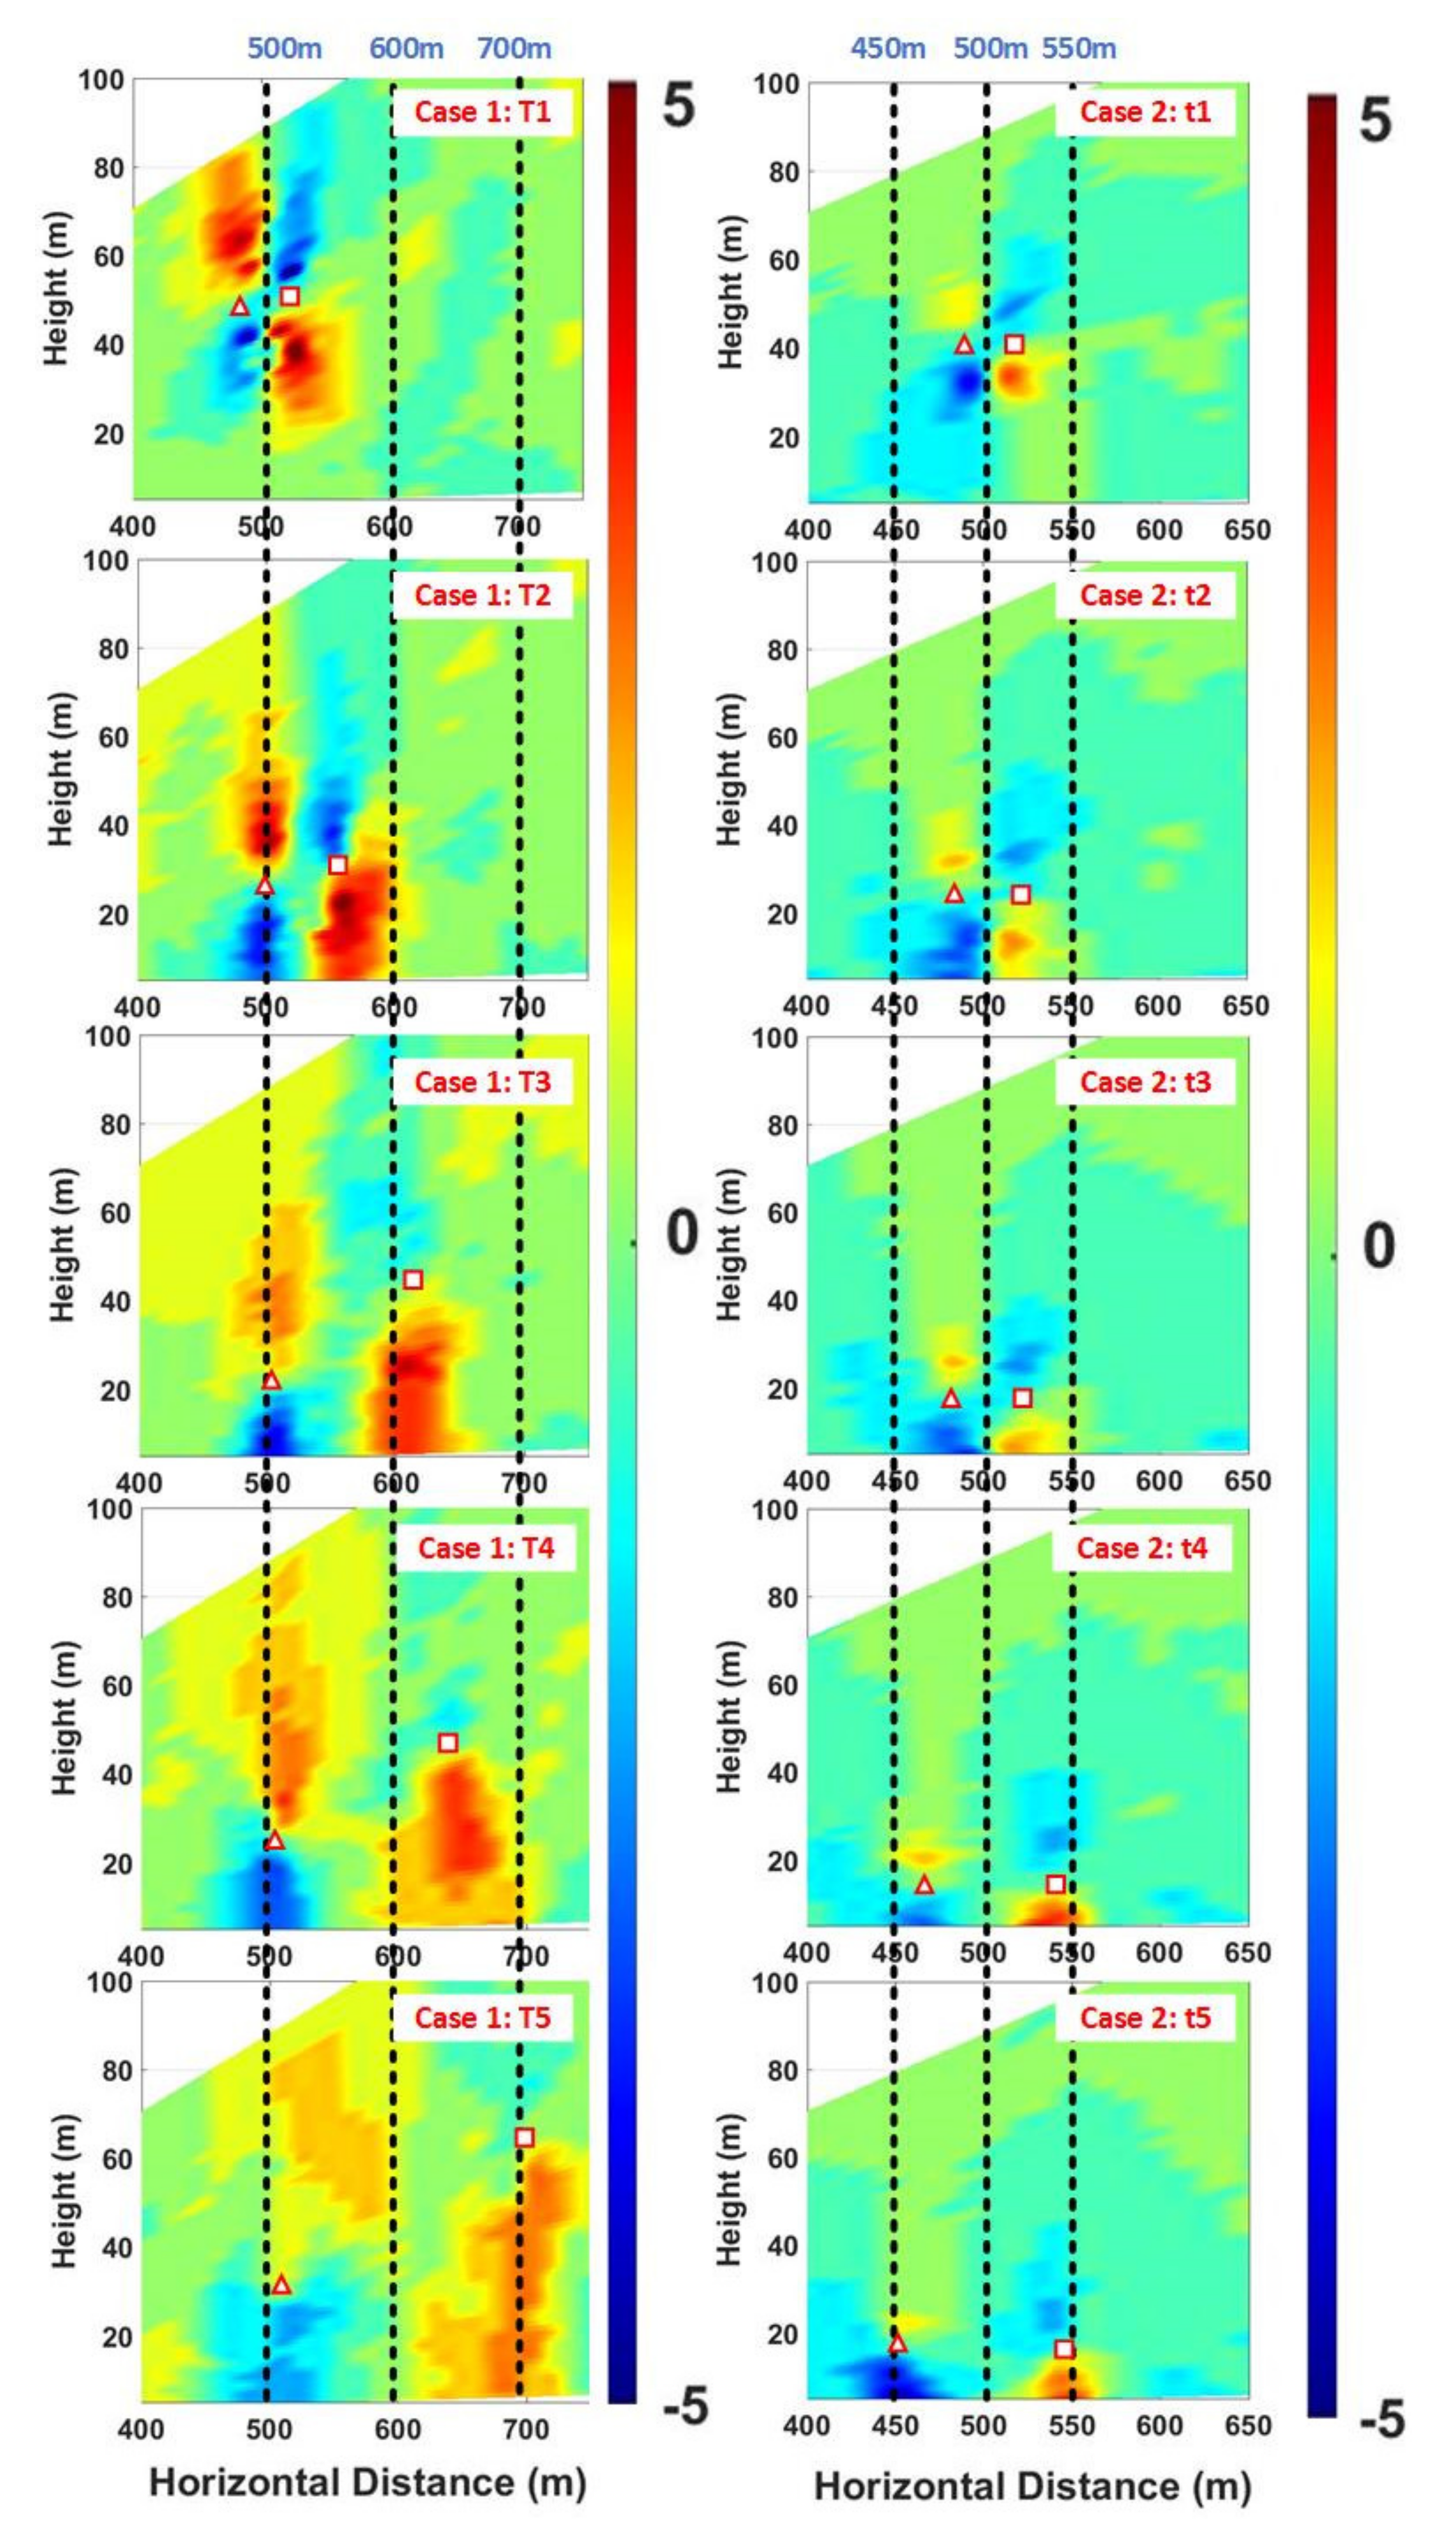
3.2. Analysis of Wake Vortex Trajectories with and without Crosswind

The typical wake vortex trajectories under crosswind (Figure 9a) and no-crosswind (Figure 9b) conditions are shown in Figure 10a,b, respectively. In Figure 9a, the crosswind was significantly stronger than that in Figure 9b, with approximately 2 m/s crosswind velocity above 60 m. The crosswind velocity in Figure 9b fluctuated between −1 m/s and 1 m/s, and its positive and negative signs represent the aerosol moving away from and close to the PCDL in one RHI scan, respectively. In particular, below 40 m, the crosswind velocity was very small without changing the vortex trajectory, as shown in Figure 10b.
In Figure 10a, the left and right wake vortices drifted in the same direction away from the PCDL at different movement speeds, consistent with the results in Figure 8, Case 1. The left vortex finally descended below 20 m; meanwhile, the right vortex no longer descended after descending to a height of 30 m, but continued to drift away from the lidar. In contrast to the situation in Figure 10a, the wake vortex moved almost symmetrically in the opposite direction in Figure 10b with a gentle crosswind (in this paper, a gentle crosswind is equivalent to no crosswind, as the atmosphere wind velocity cannot always be zero).

3.3. Analysis of Wake Vortex Trajectories under Various Crosswind Conditions

Figure 11 shows the different wake vortex trajectories under various crosswind conditions. In Figure 11a, the crosswind velocity was almost stable within 1 m/s during 02:28:53~02:29:49; the wake vortex trajectories at the same time are displayed in Figure 11b. The left and right vortex cores always had the same height in the full evolution processes. Before descending to 20 m, the distance between the left and right vortex cores did not increase with time, which meant that the two cores had the same movement velocities at this crosswind and these atmospheric turbulence conditions. When the wake vortex dropped to 20 m, the right vortex began to accelerate and eventually moved to 650 m away from PCDL.
In Figure 11d, the two vortex cores had been moving away from the PCDL at a high movement speed as compared to Figure 11b owing to a stronger crosswind than that in Figure 11a. In addition, the height of the right vortex had been higher than that of the left. In this case, the vertical and horizontal movement speed was relatively constant compared to the above cases, which made the wake vortex trajectories simpler, somewhat like a linear curve. The trajectories of the left and right vortices produced an obvious rebound, accompanied by the rebound height of the right vortex reaching almost 40 m, as shown in Figure 11f. The horizontal position of the left vortex after moving was approximately 550 m away from the lidar; at the same time, the right vortex moved to 640 m away. During this period, the crosswind velocity fluctuated around 1 m/s when below an altitude of 100 m, as shown in Figure 11e.

4. Conclusions

In this paper, wake vortex observation experiments using scanning lidar were carried out to identify the wake vortex during take-off and landing phases and analyze the influence of crosswind on vortex evolution processes at MNA and CSIA from 6 August 2018 to 22 October 2018. The major efforts and conclusions are summarized as follows.
(1) This paper illustrates the advantages and limitations of the classic radial velocity method and the newer spectrum width method for wake vortex location. Furthermore, an indicator was proposed that integrated RV and SW to locate the left and right wake vortex cores in various situations, considering the background wind field, wake vortex dissipation, and aircraft wingspan.
(2) The radial velocity data of the non-WV region in wake vortex RHI scans were used to estimate the crosswind profiles. Rather than filtering out wake vortex measurement scans––a method used in several previous studies––the method in this study obtained the real-time crosswind profile without being disturbed by the wake vortex at the time of wake vortex existence. This made it possible to more accurately explore the influence of crosswind on the evolution of wake vortex trajectories.
(3) Considering the radial velocity distribution and movement trajectory of the wake vortex, the evolution processes under crosswind and no-crosswind conditions were compared and analyzed. The results indicate that the crosswind changes the trajectory of the wake vortex, causing the asymmetrical evolutionary characteristic of the left and right vortices. Upwind and downwind vortices drifted at different movement speeds in the same direction due to the crosswind shear. Generally, affected by near ground effect, the downwind vortex rebounded earlier and higher.
(4) Wake vortex trajectories of evolution under various crosswind conditions were analyzed in this paper. Affected by crosswinds at different heights in the evolution process, the wake vortex exhibited various trajectories, including the acceleration of the right vortex after a parallel falling, a simple linear curve trajectory, and a high double rebound trajectory.
In the near future, efforts will be needed to improve and evaluate the performance of the wake vortex core position identification method. More observational experiments need to be carried out to enrich the dataset under crosswind conditions for exploring the statistical characteristics of wake vortex evolution with different crosswind strengths.

Author Contributions

All authors made great contributions to the presented work. Methodology, X.L., S.W. and X.Z. (Xiaochun Zhai); algorithm and data processing, X.L. and X.Z. (Xinyu Zhang); experiment design, H.Z. and X.L.; supervision and project administration, S.W.; writing—original draft preparation, X.L. and X.Z. (Xinyu Zhang); writing—review and editing, S.W., B.L. and H.Z. All authors have read and agreed to the published version of the manuscript.

Funding

This work was jointly supported by National Key Research and Development Program of China (2016YFC1400904, 2019YFC1408002) and National Natural Science Foundation of China (No.41375016, No.41471309).

Institutional Review Board Statement

Not applicable.

Informed Consent Statement

Not applicable.

Data Availability Statement

Data sharing not applicable to this article as no datasets were generated or analyzed during the current study. The raw data required to reproduce these findings cannot be shared at this time as the data also forms part of an ongoing study.

Acknowledgments

The authors would like to thank Qichao Wang for his help with the wake vortex field experiments at MNA and CSIA, and also thank Xioaye Wang and Xiaomin Chen for their help with the observations and data processing. We appreciate Xitao Wang, Jiaping Yin, and Rongzhong Li from Leice Transient Technology Ltd. for preparing and operating the lidar.

Conflicts of Interest

The authors declare no conflict of interest.

References

  1. Wu, Y.; Hu, Y.; Xu, S.; Li, J.; Dai, D. Design of airport wake vortex monitoring system based on 1.5-μm pulsed coherent Doppler lidar. Optoelectron. Lett. 2011, 7, 298–303. [Google Scholar] [CrossRef]
  2. Wu, S.; Zhai, X.; Liu, B. Aircraft wake vortex and turbulence measurement under near-ground effect using coherent Doppler lidar. Opt. Express 2019, 27, 1142–1163. [Google Scholar] [CrossRef]
  3. Rossow, V.J. Lift-generated vortex wakes of subsonic transport aircraft. Prog. Aerosp. Sci. 1999, 35, 507–660. [Google Scholar] [CrossRef]
  4. Holzäpfel, F.; Dengler, K.; Gerz, T.; Schwarz, C. Prediction of dynamic pairwise wake vortex separations for approach and landing. In Proceedings of the 3rd AIAA Atmospheric Space Environments Conference, Honolulu, HI, USA, 27–30 June 2011. [Google Scholar] [CrossRef] [Green Version]
  5. Holzäpfel, F.; Kladetzke, J. Assessment of Wake-Vortex Encounter Probabilities for Crosswind Departure Scenarios. J. Aircr. 2011, 48, 812–822. [Google Scholar] [CrossRef] [Green Version]
  6. Frehlich, R.; Sharman, R. Maximum Likelihood Estimates of Vortex Parameters from Simulated Coherent Doppler Lidar Data. J. Atmos. Ocean. Technol. 2005, 22, 117–130. [Google Scholar] [CrossRef]
  7. Holzäpfel, F. Probabilistic Two-Phase Wake Vortex Decay and Transport Model. J. Aircr. 2003, 40, 323–331. [Google Scholar] [CrossRef] [Green Version]
  8. Hallock, J.N.; Greene, G.C.; Burnham, D.C. Wake Vortex Research—A Retrospective Look. Air Traffic Control. Q. 1998, 6, 161–178. [Google Scholar] [CrossRef]
  9. Liu, Z.; Barlow, J.F.; Chan, P.-W.; Fung, J.C.H.; Li, Y.; Ren, C.; Mak, H.W.L.; Ng, E. A Review of Progress and Applications of Pulsed Doppler Wind LiDARs. Remote Sens. 2019, 11, 2522. [Google Scholar] [CrossRef] [Green Version]
  10. Winckelmans, G.; Cocle, R.; Dufresne, L.; Capart, R. Vortex methods and their application to trailing wake vortex simulations. Comptes Rendus Phys. 2005, 6, 467–486. [Google Scholar] [CrossRef]
  11. Holzäpfel, F.; Hofbauer, T.; Darracq, D.; Moet, H.; Garnier, F.; Gago, C.F. Analysis of wake vortex decay mechanisms in the atmosphere. Aerosp. Sci. Technol. 2003, 7, 263–275. [Google Scholar] [CrossRef]
  12. Köpp, F. Doppler lidar investigation of wake vortex transport between closely spaced parallel runways. AIAA J. 1994, 32, 805–810. [Google Scholar] [CrossRef]
  13. Brandon, J.M.; Stuever, R.A.; Buttrill, C.W. Application of Wind Tunnel Free-Flight Technique for Wake Vortex Encounters. In NASA Technical Paper; National Aeronautics and Space Administration Langley Research Center: Hampton, VA, USA, 1997; p. 3672. [Google Scholar]
  14. Köpp, F.; Rahm, S.; Smalikho, I. Characterization of Aircraft Wake Vortices by 2-μm Pulsed Doppler Lidar. J. Atmos. Ocean. Technol. 2004, 21, 194–206. [Google Scholar] [CrossRef]
  15. Smalikho, I.N.; Banakh, V.A.; Holzäpfel, F.; Rahm, S. Method of radial velocities for the estimation of aircraft wake vortex parameters from data measured by coherent Doppler lidar. Opt. Express 2015, 23. [Google Scholar] [CrossRef] [PubMed] [Green Version]
  16. Hallermeyer, A.; Dolfi-Bouteyre, A.; Valla, M.; Brusquet, L.L.; Fleury, G.; Thobois, L.P.; Cariou, J.-P.; Duponcheel, M.; Winckelmans, G. Development and assessment of a Wake Vortex characterization algorithm based on a hybrid LIDAR signal processing. In Proceedings of the 8th AIAA Atmospheric and Space Environments Conference, Washington, DC, USA, 13–17 June 2016. [Google Scholar] [CrossRef] [Green Version]
  17. Breitsamter, C. Wake vortex characteristics of transport aircraft. Prog. Aerosp. Sci. 2011, 47, 89–134. [Google Scholar] [CrossRef]
  18. Holzäpfel, F.; Misaka, T.; Hennemann, I. Wake-Vortex Topology, Circulation, and Turbulent Exchange Processes. In Proceedings of the AIAA Atmospheric and Space Environments Conference, Toronto, ON, Canada, 2–5 August 2010. [Google Scholar] [CrossRef] [Green Version]
  19. Körner, S.; Holzäpfel, F. Assessment of the Wake-Vortex Proximity to Landing Aircraft Exploiting Field Measurements. J. Aircr. 2019, 56, 1250–1258. [Google Scholar] [CrossRef]
  20. Hallock, J.N.; Holzäpfel, F. A review of recent wake vortex research for increasing airport capacity. Prog. Aerosp. Sci. 2018, 98, 27–36. [Google Scholar] [CrossRef]
  21. Proctor, F.H.; Ahmad, N.N.; Switzer, G. Crosswind Shear Gradient Affect on Wake Vortices. In Proceedings of the 3rd AIAA Atmospheric Space Environments Conference, Honolulu, HI, USA, 27–30 June 2011. [Google Scholar] [CrossRef] [Green Version]
  22. Frech, M.; Zinner, T. Concept of Wake Vortex Behavior Classes. J. Aircr. 2004, 41, 564–570. [Google Scholar] [CrossRef]
  23. Dengler, K.; Holzäpfel, F.; Gerz, T.; Wiegele, A.; Visscher, I.D.; Winckelmans, G.; Bricteux, L.; Fischer, H.; Konopka, J. Crosswind thresholds supporting wake-vortex-free corridors for departing aircraft. Meteorol. Appl. 2012, 19, 289–301. [Google Scholar] [CrossRef] [Green Version]
  24. Kauertz, S.; Holzäpfel, F.; Kladetzke, J. Wake Vortex Encounter Risk Assessment for Crosswind Departures. J. Aircr. 2012, 49, 281–291. [Google Scholar] [CrossRef]
  25. Paramasivam, S.; Skote, M.; Dan, Z.; Schluter, J.U. Detailed Study of Effects of Crosswind and Turbulence Intensity on Aircraft Wake-Vortex in Ground Proximity. In Proceedings of the American Institute of Aeronautics and Astronautics, Washington, DC, USA, 13–17 June 2016. [Google Scholar] [CrossRef] [Green Version]
  26. Holzäpfel, F.; Tchipev, N.; Stephan, A. Wind impact on single vortices and counterrotating vortex pairs in ground proximity. FlowTurbul. Combust. 2016, 97, 829–848. [Google Scholar] [CrossRef]
  27. Holzäpfel, F.; Steen, M. Aircraft Wake-Vortex Evolution in Ground Proximity: Analysis and Parameterization. AIAA J. 2007, 45, 218–227. [Google Scholar] [CrossRef] [Green Version]
  28. Wu, S.; Liu, B.; Liu, J.; Zhai, X.; Feng, C.; Wang, G.; Zhang, H.; Yin, J.; Wang, X.; Li, R.; et al. Wind turbine wake visualization and characteristics analysis by Doppler lidar. Opt. Express 2016, 24. [Google Scholar] [CrossRef] [PubMed]
  29. Zhang, H.; Wu, S.; Wang, Q.; Liu, B.; Yin, B.; Zhai, X. Airport low-level wind shear lidar observation at Beijing Capital International Airport. Infrared Phys. Technol. 2019, 96, 113–122. [Google Scholar] [CrossRef] [Green Version]
  30. Gao, H.; Li, J.; Chan, P.W.; Hon, K.K.; Wang, X. Parameter-retrieval of dry-air wake vortices with a scanning Doppler Lidar. Opt. Express 2018, 26, 16377–16392. [Google Scholar] [CrossRef] [PubMed]
  31. Li, J.; Shen, C.; Gao, H.; Chan, P.W.; Hon, K.K.; Wang, X. Path integration (PI) method for the parameter-retrieval of aircraft wake vortex by Lidar. Opt. Express 2020, 28, 4286–4306. [Google Scholar] [CrossRef] [PubMed]
  32. Rahm, S.; Smalikho, I. Aircraft wake vortex measurement with airborne coherent Doppler lidar. J. Aircr. 2008, 45, 1148–1155. [Google Scholar] [CrossRef] [Green Version]
  33. Wu, S.; Zhai, X.; Liu, B.; Liu, J. Characterization of aircraft dynamic wake vortices and atmospheric turbulence by coherent doppler lidar. EPJ Web Conf. 2018, 176, 6001. [Google Scholar] [CrossRef]
  34. Smalikho, I.; Köpp, F.; Rahm, S. Measurement of Atmospheric Turbulence by 2-μm Doppler Lidar. J. Atmos. Ocean. Technol. 2005, 22, 1733–1747. [Google Scholar] [CrossRef]
Figure 1. Wake vortex observation experiments (a) for the take-off phase at Mianyang Nanjiao Airport (MNA), (b) for the landing phase at Chengdu Shuangliu International Airport (CSIA), and (c) for the take-off phase at CSIA.
Atmosphere 12 00049 g001
Figure 2. Schematic diagram of the pulse coherent Doppler lidar (PCDL) system.
Atmosphere 12 00049 g002
Figure 3. Flow chart of the RHI data processing.
Atmosphere 12 00049 g003
Figure 4. Wake vortex in PCDL RHI scans. (a) The radial velocity distribution for the take-off phase at MNA. (b) The spectrum width distribution for the landing phase at CSIA.
Atmosphere 12 00049 g004
Figure 5. Wake vortex identification during different evolution phases. The radial velocity distribution of (a) B788 during vortex initial generation phase; (b) B788 during dissipation phase; (c) ARJ21 during vortex initial generation phase. The spectrum width distribution of (d) B788 during vortex initial generation phase; (e) B788 during dissipation phase; (f) ARJ21 during vortex initial generation phase.
Atmosphere 12 00049 g005
Figure 6. Horizontal position identification of wake vortex cores in different situations: (a) the single peak of fusion spectrum width, and (b) insignificant bimodal structure of V i n d i c a t o r .
Atmosphere 12 00049 g006
Figure 7. Wake vortex region and non-wake vortex region in (a) radial velocity distribution, and (b) spectrum width distribution of PCDL RHI.
Atmosphere 12 00049 g007
Figure 8. Evolution characteristics of the radial velocity distribution of wake vortex with crosswind (Case 1) and without crosswind (Case 2). The triangles and squares in the figure indicate the positions of the left and right vortex cores, respectively.
Atmosphere 12 00049 g008
Figure 9. Crosswind profiles of PCDL RHI measurement. (a) Stronger crosswind: during 18:36:16~18:36:58 on 1 September 2018. (b) Gentle crosswind: during 11:22:41~11:23:51 on 27 August 2018.
Atmosphere 12 00049 g009
Figure 10. Wake vortex trajectories (a) with the stronger crosswind during 18:36:16~18:36:58 on 1 September 2018, and (b) without crosswind (or with gentle crosswind) during 11:22:41~11:23:51 on 27 August 2018.
Atmosphere 12 00049 g010
Figure 11. Wake vortex trajectories under various crosswind conditions. (a) The crosswind profiles and (b) wake vortex trajectories during 02:28:53~02:29:49 on 27 August 2018; (c) the crosswind profiles and (d) wake vortex trajectories during 00:15:28~00:16:24 on 27 August 2018; (e) the crosswind profiles and (f) wake vortex trajectories during 08:37:52~08:39:01 on 1 September 2018.
Atmosphere 12 00049 g011
Table 1. The experimental information for wake vortex observation experiments (WVOEs).
No.AirportExperimental DateTake-Off/Landing
1MNA6–21 August 2018Take-off
2CSIA25 August–20 September 2018Landing
3CSIA21 September–22 October 2018Take-off
Table 2. Technical specifications of Wind3D 6000 scanning wind lidar.
ParameterSpecification
Wavelength1.55 μm
Pulse repetition frequency10 kHz
Pulse width100 ns~400 ns
Pulse energy150 μJ
Measurement range45 m~6000 m
Range resolution15 m~60 m
Velocity measurement uncertainty≤0.1 m/s
Radial velocity measurement range−37.5 m/s~+37.5 m/s 1
Data update rate1 Hz~10 Hz
Sampling rate1 GHz
Power Consumption<300 W
Weight~75 kg
1 The sign of the radial velocity indicates the direction of aerosol movement. ”+” means that the aerosol is moving away from the PCDL; “−” means that the aerosol is moving in the direction close to the PCDL.
Table 3. Experimental parameters of the PCDL range height indicator (RHI) scanning strategy during the WVOE.
ParameterSpecification
Elevation angle resolution0.1°~0.4°
Scanning speed1°/s~2°/s
Longitudinal size of effective probing volume27 m
Scan duration10 s~20 s
Elevation angle range0°~25° (take-off, MNA)
0°~10° (landing, CSIA)
5°~25° (take-off, CSIA)
Publisher’s Note: MDPI stays neutral with regard to jurisdictional claims in published maps and institutional affiliations.

