Article

Spatial Distribution, Pollution Source, and Health Risk Assessment of Heavy Metals in Atmospheric Depositions: A Case Study from the Sustainable City of Shijiazhuang, China

1
Institute of Geological Survey, Hebei GEO University, Shijiazhuang 050031, China
2
School of Business Administration, Wonkwang University, 460 Iksandae-ro, Iksan 54538, Korea
*
Author to whom correspondence should be addressed.
Atmosphere 2019, 10(4), 222; https://doi.org/10.3390/atmos10040222
Submission received: 19 March 2019 / Revised: 20 April 2019 / Accepted: 22 April 2019 / Published: 24 April 2019

Abstract

:
Samples of atmospheric depositions from five types of functional areas in Shijiazhuang, Hebei Province, China, were collected, and the concentrations of six toxic heavy metals (Cd, Cr, Cu, Pb, Ni, and Zn) were measured. Geographic information system, Pb isotope assessment, multivariate statistical analysis (principal component analysis, PCA), the geoaccumulation index (Igeo), potential ecological risk index (PERI), and a health risk assessment model were used to study the degree of pollution, identify sources of pollution, and assess the health risks to children and adults via three pathways (hand–mouth intake, skin contact, and respiration). The results show that the high traffic volume and exhaust gas emissions have led to high concentrations of heavy metals. The Igeo and PERI values of Cd (0.38–2.0 and 108–4531, respectively), indicating the present high pollution level and potential risk, respectively, varied the most. Pb isotope and PCA showed that Pb, Zn, and Cd from atmospheric deposition come from power plants and traffic—Cu is related to traffic, and Ni and Cr come mainly from soil particles (natural source). The health risk assessment showed that heavy metals in atmospheric depositions are at a safe level in the study area.

1. Introduction

Air pollution is a concern of scientists worldwide. In China, in particular, where the economy is developing rapidly because of the continuous progress of urbanization and industrialization, ecological damage has led to many kinds of air pollution in some areas. The increase in harmful substances in the air has led to an increase in harmful substances in crops via atmospheric deposition. Air pollution has seriously affected the quality of human living environments and has restricted sustainable development [1,2,3,4,5].
The main human activities and industries causing atmospheric pollution include metal smelting, the chemical and pharmaceutical industries, the production and use of chemicals, and the accumulation and disposal of industrial waste [6,7,8,9,10]. Sources of pollution, such as industrial enterprises and the air around them, are mainly reflected in the emission of air pollutants, sedimentation of particles on the ground, and unreasonable accumulation of industrial solid waste [1,11,12,13,14]. In general, industrial “three-waste” emissions are the direct cause of regional air pollution. Many particles from pollutant discharge eventually enter the atmosphere, directly or indirectly. Heavy metals can enter the body by ingestion, inhalation, or absorption through the skin, directly harming human health, especially that of children, and indirectly affecting people by polluting the atmosphere, water, and food. Heavy metals influence the quality of the urban environment and harm human health [2,15,16,17]. Therefore, atmospheric heavy metal pollution, health hazards, and their sources are an important aspect of the quality and safety of the urban air environment and have been receiving increased attention [18,19,20].
In the past 30 years, the rapid economic development of Shijiazhuang has relied on pharmaceuticals, textiles, and steel. The atmospheric environment has continuously deteriorated because of sparse management, climate and topography, and power generation mainly from coal-fired plants. The atmospheric environment in urban Shijiazhuang has become a global hotspot. There are 15 large and small power plants in the area with an annual fly ash discharge capacity of 1.86 mio t and a total stock of ~11 mio t. The accumulation of a large amount of fly ash will pollute the urban atmospheric environment, groundwater, and soil. Atmospheric deposition has always been the dominant pollutant in terms of urban air quality. The general increase in atmospheric deposition and a reduction in rainfall combined with a high quantity of sewage is causing serious damage to the environment [21,22,23].
At present, geographic information system (GIS) tools, multivariate statistical methods, and isotope ratio methods are widely used to evaluate urban heavy metal sources, that is, to estimate and quantify the spatial distribution of these metals [17,24]. Potential pollution sources, including point or nonpoint sources, can be identified by determining the distribution and transportation route of heavy metals based on a GIS map. Multivariate statistical analysis is used to facilitate the distinction between natural and anthropogenic sources. Two methods are widely used: isotope ratio methods and principal component analysis (PCA) [25]. Isotope ratio analysis is used to accurately determine the source of pollution and PCA is used to identify the main components and characteristics of source combinations. In addition, the United States Environmental Protection Agency (USEPA) created noncarcinogenic evaluation methods that include the risk factor and risk index as indicators [26,27]. They are also used to evaluate health risk to both adults and children. Shijiazhuang City was selected as the research area for this study. To investigate and obtain valuable data on the sources of air pollution, the objectives of this study are to (i) survey the spatial distribution of pollutants using a GIS map, (ii) determine their sources and combination characteristics using Pb isotope ratio and PCA, (iii) assess pollution level and ecological risk using the geoaccumulation index (Igeo) and the potential ecological risk index (PERI), and (iv) evaluate the health risk to adults and children using the noncarcinogenic evaluation method.

2. Materials and Methods
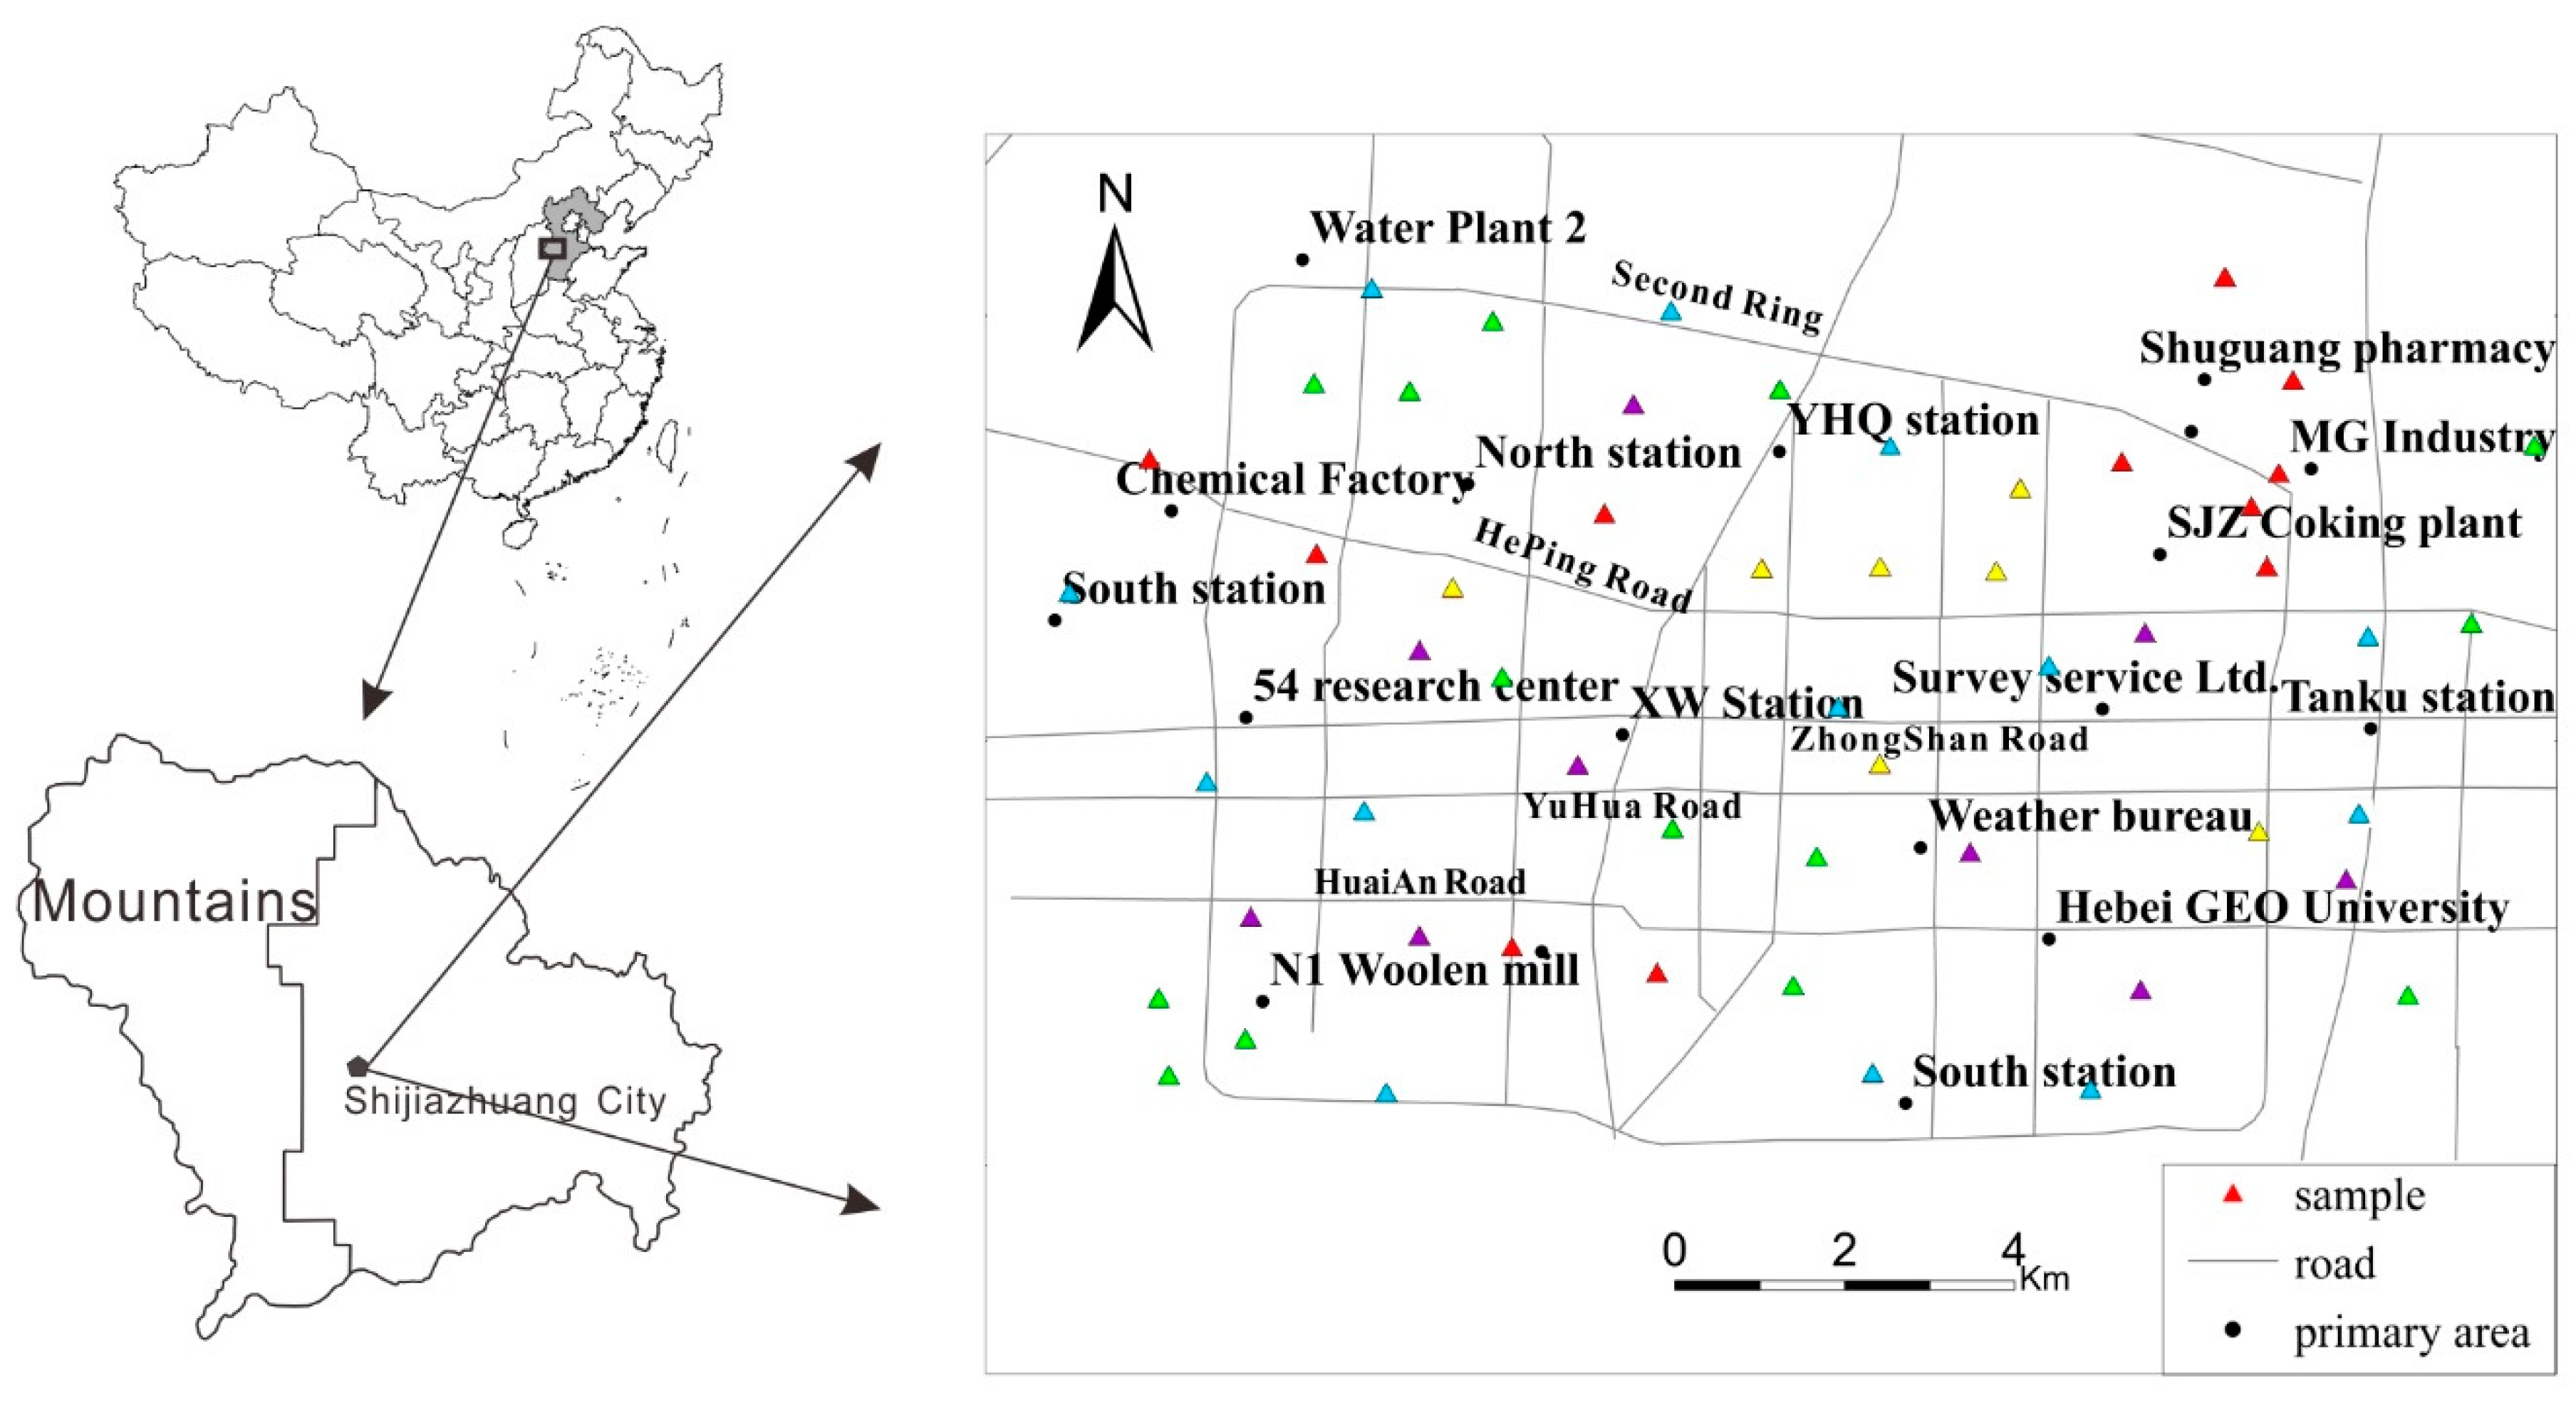
2.1. Study Area

Shijiazhuang City is located in the south-central part of Hebei Province, between 113°30′ and 115°20′ E and 37°27′ and 38°47′ N. It borders Hengshui to the east, Xingtai to the south, Shanxi to the west, and Baoding to the north. The Taihang Mountains are to the west and the study area is in a plain. The urban area, including the main urban center (Chang An, Qiao Xi, Xin Hua, and Yu Hua Districts), is governed by District 8 (Changan, Qiao Xi, Xinhua, Yuhua, Gaocheng, Luquan, Luancheng, and Jingxing Mining Area). The research area is mainly located within the Second Ring, including 4 roads in the north–south direction: Heping, Zhongshan, Yuhua, and Huan An Roads. The study area covers approximately 360 km2 and has a population of approximately 1.8 million people. The climate is arid; annual mean temperature is 13–15 °C and precipitation ranges from 401 to 752 mm. The prevailing wind comes from the north and southeast.

2.2. Sample Collection and Analysis

A total of 54 representative samples were collected from different functional regions in the study area. Impervious ground atmospheric deposition was collected in 2016 and the samples were collected using the wet method. A plastic bucket with a diameter of 29.5 cm and a height of 28.5 cm was filled with distilled water and carried to the sampling point. It was fixed on an open roof platform ~5–10 m from the ground, numbered, positioned, and recorded. One year later, the bucket was retrieved. The water had evaporated naturally and the dry settlement samples in the bucket were collected. The samples were sealed in plastic bags and brought back to the laboratory, where they were naturally air-dried and passed through a 100-mesh sieve. They were then sealed and stored for testing.
Power plants, building sites, and traffic based on vehicles were chosen as pollution sources. The power plant samples were collected from the ChangAn and YuHua power plants. The building samples were collected at 100 m around a construction site, and the traffic samples were collected by fixing a sampler to the filter on the exhaust pipe of a vehicle. The traffic samples were divided into gasoline and diesel components and the sampling objects were diesel- or gasoline-based vehicles. The oil sludge ash was taken from the exhaust pipe with a clean toothbrush and the sampling sites were major parking lots. After the sample was uniformly mixed, it was passed through a 63-μm nylon sieve and a certain quantity (500 g) was taken for analysis. Five samples of each type of pollution source were collected and mixed as one sample. In addition, sand samples were collected from the soil surface layer (0–20 cm) outside the Second Ring.
All samples were processed at the Hebei Research Center for Geoanalysis. Microwave digestion of the samples was performed using HNO3–HF–HClO4. The water sample was filtered through a 0.45-μm filter. All reagents were excellent grade, and the analysis water had high purity (Milli-Q). Cd, Cr, Cu, Zn, Ni, and Pb were measured using an inductively coupled plasma mass spectrometer (ICP-MS; 7500a, Agilent Technologies, Santa Clara, CA, USA). For the specific analysis method, the China Geological Survey’s eco-geochemical survey standards and specifications (DD2005-3) were referenced [28]. The detection limits of the method are 0.02 μg/g Cd, 3 μg/g Cr, 1 μg/g Cu, 2 μg/g Pb, 2 μg/g Ni, and 3 μg/g Zn. A national standard substance (soil composition analysis standard substance, GBW07428) was added for quality control. The standard substance was measured 12 times by using the same analysis method. The mean logarithmic deviation ( Δ l g C ¯ ) between the mean and standard values measured for each element of the reference substance was calculated. The relative standard deviation (RSD) for the 12 determinations was calculated at the same time. RSD was within 8% for all calculations. The recovery rate was between 90% and 110%. The measurement results met the quality control requirements.
The Pb isotope ratio was determined directly using ICP-MS. The National Institute of Standards and Technology (NIST) standard NIST SRM-981 was used to control the quality of the entire analysis process. NBS 981 standard solution corrected the mass discrimination effect and instrument parameter drift and was used once for every 4 samples. The measured values of the Pb isotope ratios 207Pb/206Pb, 207Pb/204Pb, and 208Pb/206Pb were all within a small range around given values (0.91462 ± 0.000038, 15.52212 ± 0.000063, and 2.1683 ± 0.0007, respectively) with an error rate < 0.0862% relative to the standard deviation value of <0.0751%. This met the accuracy of isotope ratio measurements. For the specific methods and steps used in the Pb isotope ratio analysis test, see Hu et al. [29].

2.3. Data Analysis

Statistics of the parameters relevant to heavy metals were listed and box graphs of different functional areas were drawn using Excel 2016. The spatial distribution of heavy metals was plotted in ArcGIS 10.5 (Esri, Redlands, CA, USA) using a kriging method. SPSS 24.0 (IBM, Armonk, NY, USA) was used to extract the 3 main components and their contribution rates via PCA (maximum rotation method).

2.4. Evaluation of Heavy Metal Pollution

2.4.1. Geoaccumulation Index

The geoaccumulation index (Igeo), often referred to as the Muller index [30], reflects natural changes in the distribution of heavy metals. It can also be used to determine the influence of human activities on the environment and is an important parameter with which to distinguish the influence of such activities. It can be calculated with the following equation.
I geo = log 2 [ C n 1.5 × B n ]
where C n is the concentration of element n in the sample, B n is the background concentration value of the element in the environment, and 1.5 is a correction index usually used to characterize sedimentary characteristics, geology, and other influences.
The Igeo has 7 classification levels: unpolluted (Igeo ≤ 0), unpolluted–to-moderately polluted (0 < Igeo ≤ 1), moderately polluted (1 < Igeo ≤ 2), moderately-to-strongly polluted (2 < Igeo ≤ 3), strongly polluted (3 < Igeo ≤ 4), strongly-to-extremely polluted (4 < Igeo ≤ 5), and extremely polluted (Igeo > 5).

2.4.2. Potential Ecological Risk Index (PERI)

In 1980, Hakanson [31] established a method to assess heavy metal pollution and ecological hazards using sedimentological principles; this became the potential ecological risk index (PERI). The PERI reflects the bioavailability, relative contribution, geographical spatial differences, and potential impact of heavy metals in soil. The RI can be calculated as follows
C f i = C d i C r i
E r i = T r i × C f i
R I = T r i × C d i C r i
where C f i is the pollution factor for a single metal, C r i is the background soil reference value, C d i is the concentration measured in the sample, T r i is the metal biological toxicity response factor, E r i is the potential risk factor of a single metal, and RI is the potential ecological risk index.
Hakanson discussed this issue from the perspective of the elemental abundance principle and elemental dilution. This means that the potential toxicity of a heavy metal is inversely proportional to its abundance or proportional to its sparsity. The potential biological toxicity of a certain heavy metal is also related to the release rate of elements (the ratio of water content to sediment content). An easily released element has high potential toxicity. The order of toxicity of heavy metals proposed by Hakanson is Cd > Pb = Cu > Ni = Cr > Zn. The toxicity response coefficients are Cd = 30, Pb = Cu = 5, Ni = Cr = 2, and Zn = 1 [31]. The RI can be used to quantitatively evaluate the risk level of a single element and the overall risk level of multiple elements.
The following terminology is used to describe the risk levels. Er < 40, low potential ecological risk; 40 ≤ Er < 80, moderate potential ecological risk; 80 ≤ Er < 160, considerable potential ecological risk; 160 ≤ Er < 320, high potential ecological risk; Er ≥ 320, very high ecological risk; RI < 150, low ecological risk; 150 ≤ RI < 300, moderate ecological risk; 300 ≤ RI < 600, considerable ecological risk; and RI ≥ 600, very high ecological risk.

2.5. Health Risk Assessment

2.5.1. Exposure Model

Atmospheric deposition enters the human body in 3 main ways: direct intake via the hand–mouth route, skin contact, and inhalation. The 6 heavy metals studied here all present chronic noncarcinogenic health risks, although Ni, Cr, and Cd also present carcinogenic risks [27,32,33,34]. Because the USEPA only provides reference values for respiratory pathway exposure, only the carcinogenic risks of Ni, Cr, and Cd via respiratory exposure are considered in this study. The correlation values refer to the USEPA soil health risk assessment model and related studies [35,36,37,38]. The health risk assessment equations are as follows.
Long-term daily exposure from hand–mouth intake:
A D D i n g = C × I n g R × C F × E F × E D B W × A T
Long-term daily exposure from inhalation:
A D D i n h = C × I n h R × E F × E D P E F × B W × A T
Long-term daily exposure from skin contact:
A D D d e r m = C × S A × C F × S L × A B S × E D × E F B W × A T
Average daily exposure from inhalation of carcinogenic heavy metals (Ni, Cr, and Cd):
L A D D i n h = C × E F P E F × A T × ( I n h R c h i l d × E D c h i l d B W c h i l d + I n h R a d u l t × E D a d u l t B W a d u l t )
Equations (5)–(7) can be used to calculate chronic noncarcinogenic exposure (unit: mg/(kg·d)). Equation (8) can be used to calculate carcinogenic exposure based on respiratory pathways (unit: mg/(kg·d)). Supplementary Table S1 shows the values of the evaluation parameters.

2.5.2. Health Risk Characterization

The 6 heavy metals researched in this study all present chronic noncarcinogenic risks and Ni, Cr, and Cd also present carcinogenic risks, as follows
HQ = E R f D
HI = H Q i
Risk = D i n h × S F
( R i s k ) T = ( R i s k ) i
where HQ is the risk quotient, that is, the noncarcinogenic risk index of individual pollutants based on exposure pathways; E is the exposure dose of noncarcinogens; RfD is the reference dose (mg/(kg·d)), which is the maximum amount of a pollutant that will not cause adverse reactions in the human body in terms of time and body weight; and HI is the noncarcinogenic risk index. When the HI value is less than 1, the risk is considered to be minor or negligible; when it is greater than 1, risk should be considered. The parameter Risk is carcinogenic risk and indicates the probability of cancer in the human population; D i n h is the average daily ingestion dose per unit of time and body weight of a human exposed to carcinogens, that is, the daily dose via respiratory pathways; SF is the carcinogenic slope factor (mg/(kg·d))−1; and (Risk)T is the total carcinogenic risk, which is the sum of multiple carcinogenic risk values. If the carcinogenic risk value is between 1 × 10⁻⁶ and 1 × 10⁻⁴, there is a carcinogenic risk. If the value is lower, there is no carcinogenic risk [26,39,40].

3. Results and Discussion

3.1. Concentration of Heavy Metal

Statistics for the atmospheric deposition of heavy metals (Table 1) show that the average values of the six heavy metals are greater than the background values in Hebei and Chinese soil. The average values of Cd, Zn, and Pb are 18, six, and five times higher than the background values of Hebei soil, respectively, indicating strong human interference. In particular, the coefficient of variation of Cd is greater than 1 and the intensity of variation is the greatest. The coefficients of variation of the other five elements are Cr 71.16%, Cu 57.94%, Pb 45.62%, Ni 32.85%, and Zn 65.23%. Ni has the smallest variation and originates from natural sources. The order from high to low variation is: Cd > Cr > Zn > Cu > Pb > Ni.

3.2. Distribution of Heavy Metals

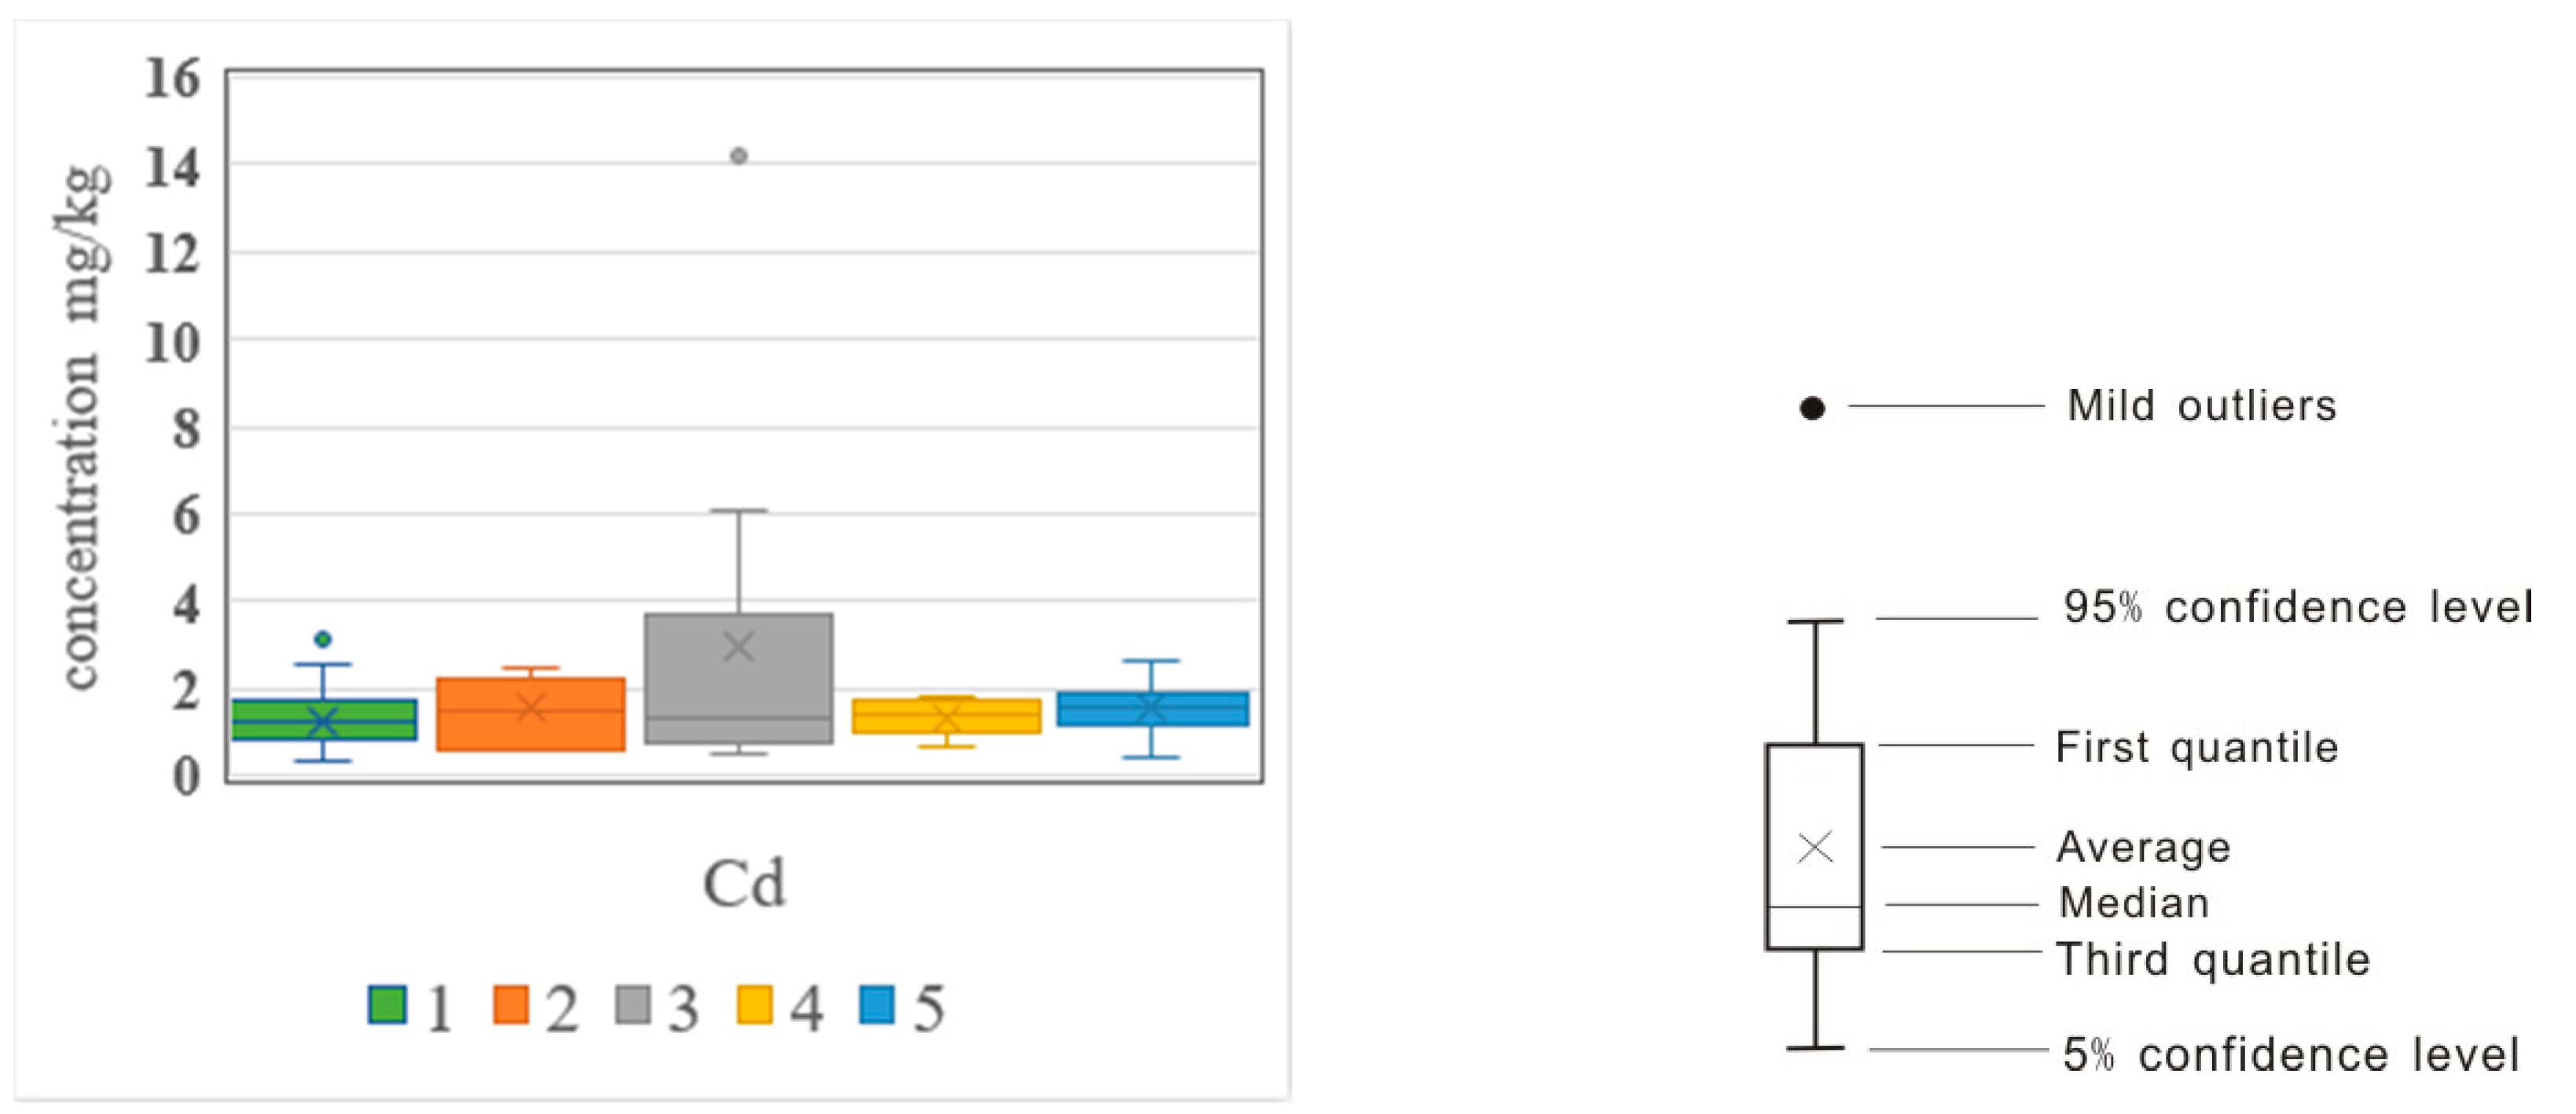
3.2.1. Concentration of Heavy Metals in Different Functional Areas

Based on the location, the sampling points were classified into functional areas. The urban areas were divided into five main functional areas: residential, commercial, industrial, office, and traffic, with 14 (green), seven (yellow), 11 (red), nine (purple), and 13 (blue) samples in each area (Figure 1). Figure 2 shows the heavy metal concentration in each functional area. Based on a comparison of all areas, the average concentration of the heavy metal Cd in the functional areas has the following order; industrial > traffic > business > office > residential. The order of the average Cr content is commercial > residential > industrial > office > traffic. The order of the average Cu content is industrial > traffic > office > residential > commercial. The order of the average Pb content is traffic > industrial > commercial > office > residential. The order of the average Ni content is industrial > traffic > commercial > office > residential. The order of the average Zn content is traffic > commercial > industrial > office > residential. The overall trend shows that the heavy metal contents in industrial, commercial, and traffic areas are higher than those in the office and residential areas.

3.2.2. Spatial Distribution of Heavy Metals

ArcGIS 10.5 was used to spatially interpolate the heavy metal content to generate the spatial distributions of the six heavy metals (Figure 3). Their distributions are as follows.
Cd has high concentrations in the eastern corner of the Second Ring, mainly around the Shuguang Pharmaceutical Factory, chemical fertilizer plant, and coking plant. The smoke emitted by the three plants affects the eastern part of the Second Ring Road. As shown in Section 3.2.1, the coefficient of variation of Cd is greater than 1 and the Cd concentration is 18 times higher than the background value. The accumulation could have serious consequences and should be monitored by local environmental authorities. The accumulation of Cd is due mainly to the dust emitted by these three factories.
The concentration of Zn is high in three areas: near the chemical fertilizer plant and coking plant, near the West King Bus Terminal, and near the northwestern corner of the Third Ring Road. The average value of Zn is six times higher than the Hebei background value (the second highest value after Cd). High-value areas are distributed over a wide area and cannot be ignored. Moreover, Zn and Cd are found in the vicinity of chemical fertilizer and coking plants due to dust emissions that are influenced mainly by industry.
Most areas with high concentrations of Pb are near the intersection of Yuhua Road and Youyi South Street, near the thermal power plant and Nanjiao Terminal, and near the high-speed entrance to Yuhua District. In general, the concentration decreases from the interior to the exterior of the Second Ring. The reasons for these high concentrations are as follows; (1) there is heavy traffic on the Yuhua Road and near the Nanjiao Terminal; these areas are extremely congested, which allows for easy accumulation of automobile exhaust dust, and (2) the continuous emission of flue gas from thermal power plants also has a certain impact on Pb accumulation; therefore, Pb originates mainly from traffic and industrial dust.
High concentrations of Cu are observed mainly between the old railway station, thermal power plant, and South Nanjiao Terminal. The Cu concentration in the steel industry area is also relatively high. Cu is related to automobile tire friction and flue gas emissions from thermal power plants.
The distribution of Cr in the Second Ring is relatively uniform. High concentrations are observed in the southeastern part of the urban area, near the industrial area (with a relatively large range), and close to the East Third Ring Road, South Third Ring Road, and Shi’An Expressway. The Ni concentration is high near the intersection of Jianhua North Street and Heping Road. The external concentration gradually decreases from the interior to the exterior of the Second Ring. The average Ni concentration is close to the background value in Hebei Province and is attributed mainly to natural sources.
There are three contributors to the high concentrations in urban areas: (1) the high volume of traffic outside the Second Ring, because vehicle exhaust emissions lead to high concentrations of heavy metals; (2) the heavy flow of traffic (near Yuhua Road, Jianhua Street, and passenger terminals) causes traffic congestion, increases exhaust emissions, and leads to an increase in heavy metal content [43]; and (3) exhaust gas emitted from pharmaceutical and industrial districts in the urban area can absorb a large amount of particulate matter; the heavy metal concentration is high in these areas.
In addition, there are some heavily polluted hotspots where concentrations of five heavy metals are high, mainly in the southern and northeastern parts of the study area. These hotspots are related to the prevailing wind directions (north and southeast).

3.3. Source Appointment

3.3.1. Pb Isotope Ratio Analysis

To accurately trace and discriminate the sources of atmospheric deposition, samples from pollution sources, such as power plants, building sites, and traffic based on vehicles, were collected and tested for Pb isotopes. The results of the analysis are shown in Supplementary Table S2.
The Pb isotope ratios of different pollution sources indicate that radioactive Pb content is the highest in sand and the lowest in traffic. The Pb isotope ratios of atmospheric depositions in Shijiazhuang are similar to those in traffic and power plants, and compared to the ratios in sand and building sites, there is a large difference. The plot of Pb isotopes also shows that most of the atmospheric depositions accumulate near traffic and power plants (Figure 4), further indicating that they are the main sources of atmospheric deposition in Shijiazhuang.

3.3.2. Principal Component Analysis (PCA)

PCA was used to identify the feature combination of pollution sources and gain insight into the isotope ratio results. Based on the PCA (maximum variance method), three components were extracted. The cumulative contribution rate of the three components is 73.9% (Table 2 and Figure 5). The first component (PC1) includes Pb, Zn, and Cd and has a large positive load with a contribution rate of 33%. Because the characteristic combination of Pb, Zn, and Cd elements is affected by power plants (coal-fired) and traffic [21,25,43,44], PC1 was named “coal-fired traffic mixed type”. The second component (PC2) includes Cr and Ni and has a contribution rate of 21%. The Ni and Cr are mainly affected by natural sources. Because the average Ni content is close to the soil background value, we concluded that PC2 is controlled mainly by soil particles. The third component, PC3, shows a 19% contribution rate for Cu related to traffic [1,45,46,47]. Therefore, PC3 was named “traffic group.”

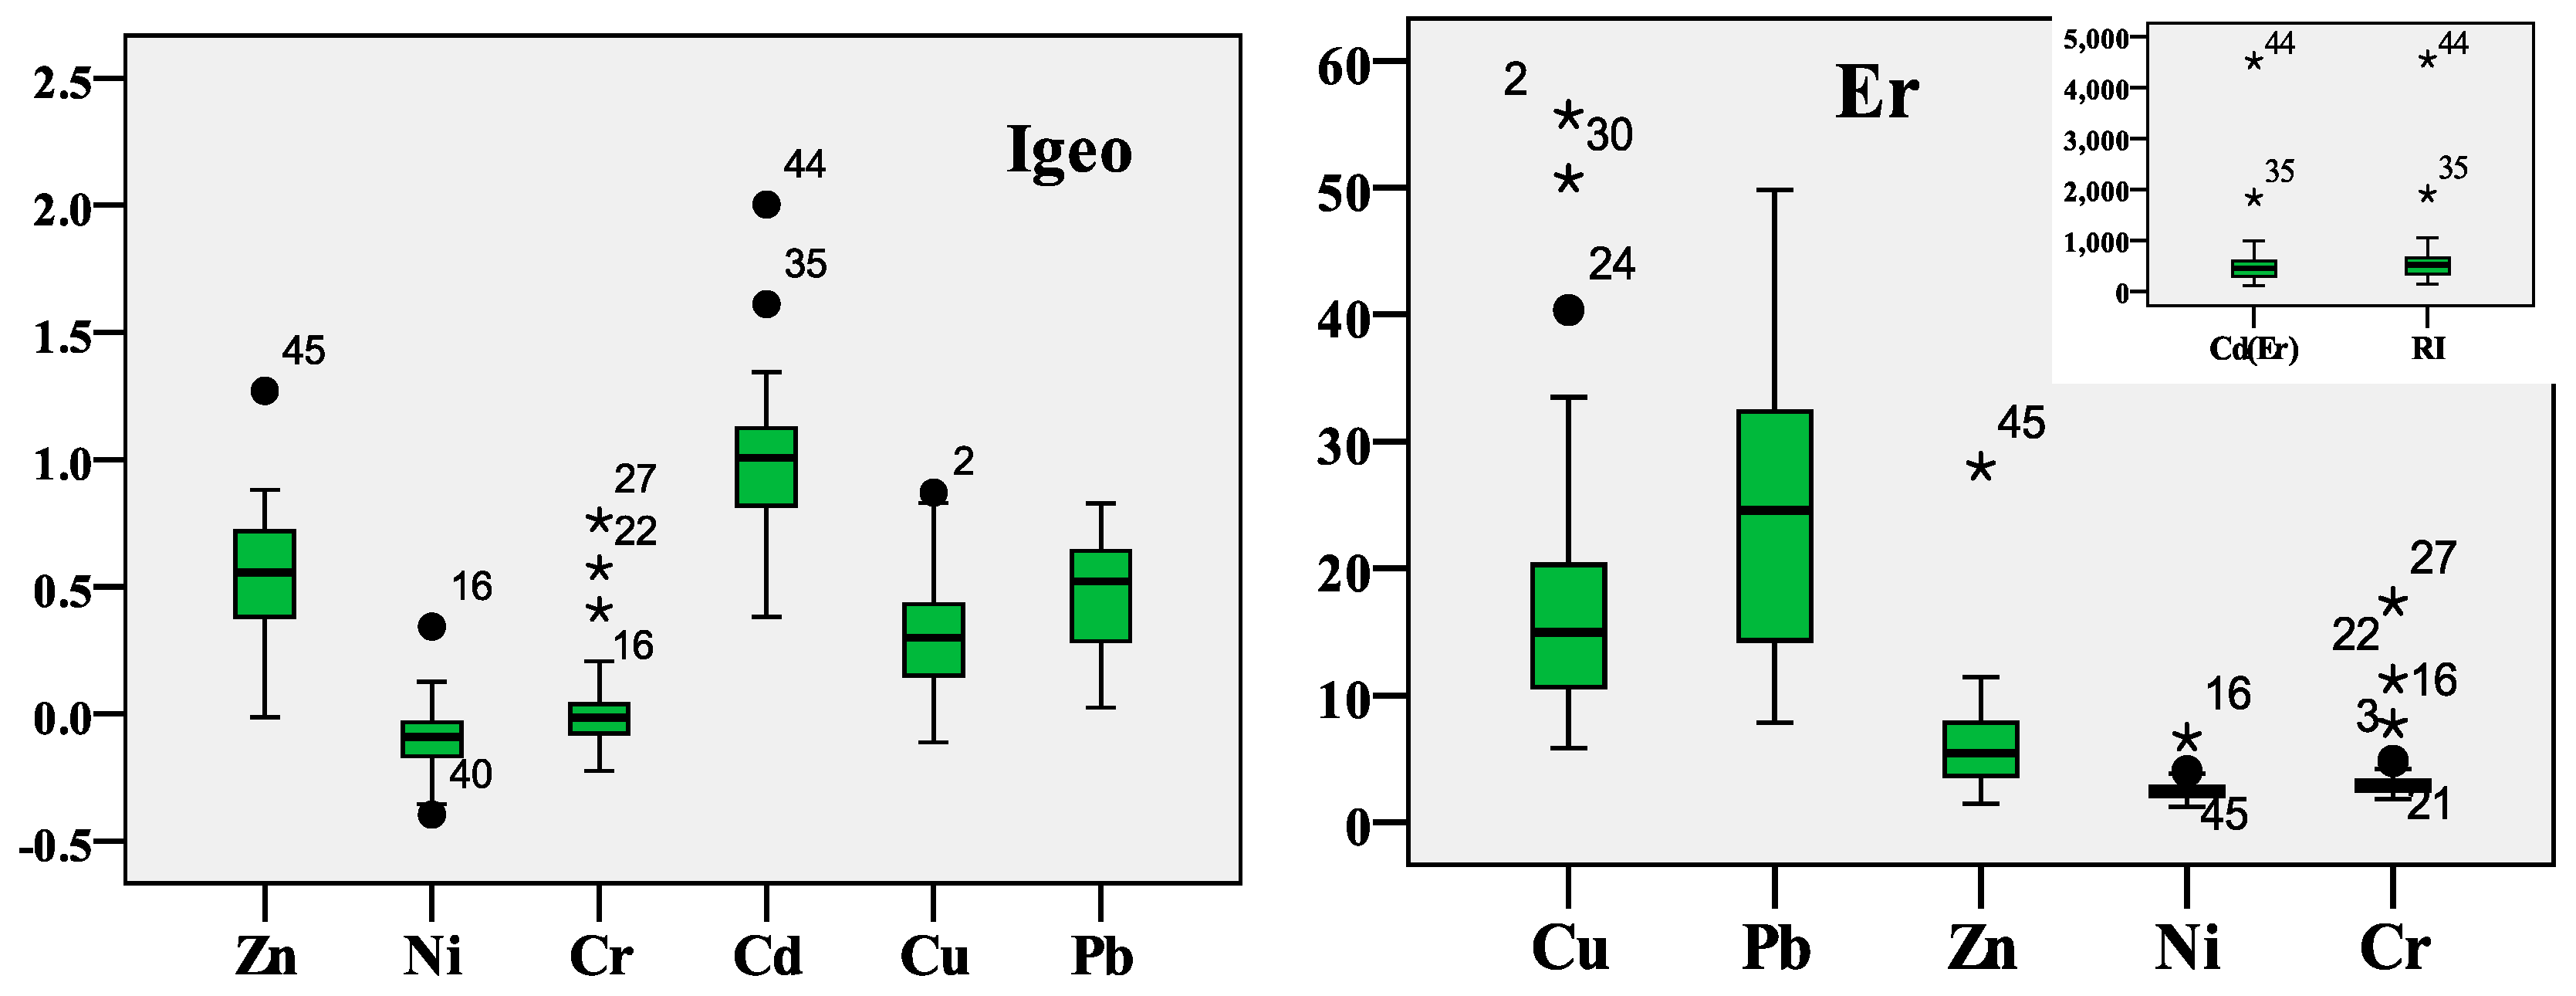
3.4. Pollution Degree Evaluation

Based on the local soil background value [41] and the samples for heavy metal enrichment, the relative enrichment coefficient can be calculated by dividing the atmospheric deposition by the soil background. The enrichment factor reflects the urban pollution type to a certain extent. The relative enrichment coefficient indicates that the heavy metal concentrations of atmospheric deposition are higher than the corresponding values for soil. The Zn, Cd, Pb, and Cu concentrations of atmospheric deposition are more than four times higher than the soil background level. This shows that the atmospheric deposition characteristics in Shijiazhuang are controlled mainly by human activity. The order of the enrichment factor from large to small is Zn 5.4 > Cd 5.2 > Pb 4.6 > Cu 2.5 > Cr 1.5 > Ni 1.2. The relative enrichment coefficient of Ni and Cr is small and close to the soil background value; the concentration of these elements is controlled by other factors (mainly natural sources).
The Igeo values of heavy metals in the study area are shown in Figure 6. The average Ni and Cr contents are below zero (no pollution); the average Zn, Cu, and Pb concentrations are in the range of 0 to 1, reaching level 2 (slight–moderate pollution); and the average Cd content is between 1 and 2, reaching level 3 (moderate pollution). The average Igeo value of the heavy metals is in the order of Cd > Zn > Pb > Cu > Cr > Ni.
The Er and RI results for the study area (Figure 6) show that the average ecological risk index from Zn, Pb, Cu, Cr, and Ni is less than 40, indicating that the potential ecological risk is low. There are also three samples with Cu and six samples with Pb between 40 and 80, presenting low potential risk. The lowest value of Cd is 108, the highest value is 4531, and the average value is 562, indicating very high potential ecological risk. The order of Er is Cd > Pb > Cu > Zn > Cr > Ni. The average RI is 616, indicating a very high level of ecological risk.

3.5. Health Risk Assessment

3.5.1. Exposure Calculation

The atmospheric deposition exposure for both children and adults was calculated, as shown in Table 3. The order of noncarcinogenic exposure is Zn > Cr > Pb > Ni > Cu > Cd for children and Zn > Cr > Pb > Cu > Ni > Cd for adults. The exposure in children is significantly larger than that seen in adults. The differences in the exposure of the six heavy metals based on the three pathways are in the order of hand–mouth intake > skin contact > respiratory inhalation. This is consistent with results obtained for Lanzhou, Anshan, and Shanghai [4,38,48]. The carcinogenic risk exposure values of the heavy metals Cd, Cr, and Ni are 1.18 × 10⁻¹⁰, 7.10 × 10⁻⁹, and 2.15 × 10⁻⁹, respectively, indicating low carcinogenic risk. The values for Shanghai are 5.39 × 10⁻¹¹, 3.67 × 10⁻⁹, and 1.22 × 10⁻⁸, respectively, and those for Cd and Cr in Lanzhou are 8.44 × 10⁻¹¹ and 8.63 × 10⁻⁹, respectively. The exposure to Cd in the study area was higher than that in Shanghai and Lanzhou. The exposure to Cr was higher in the study area than in Shanghai but lower than in Lanzhou, and the Ni exposure in the study area was lower than in Shanghai.

3.5.2. Health Risk

The reference doses (RfDs) and carcinogenic slope factors (Sfs) are shown in Table 4. The noncarcinogenic and carcinogenic risks of the six heavy metals were calculated using a model recommended by the USEPA. The calculation results are shown in Table 4. The total noncarcinogenic risk is Cr > Pb > Cd > Ni > Zn > Cu for children and Cr > Pb > Cu > Zn > Cd > Ni for adults. Children have a higher overall noncarcinogenic risk than adults. Hand–mouth intake is the dominant pathway for both children and adults compared to skin and respiratory uptake. The risk of total hand–mouth intake for children is 96.32%. None of the total risks exceed the health risk threshold (1.00). The remaining two pathways (skin and respiratory uptake) account for a risk of 3.53% and 0.15%, respectively. The risk for the three adult pathways is 86.96% (hand–mouth intake), 12.33% (skin), and 0.70% (respiration). For the total noncarcinogenic risk, adults (0.072) are at lower risk compared to children (0.597). The total noncarcinogenic risk for children is mainly due to Pb and Cr uptake via the hand–mouth pathway. Therefore, children should wash their hands and bathe frequently to avoid harmful heavy metals.
The carcinogenic risks of Cd, Cr, and Ni are 7.44 × 10⁻¹⁰, 2.98 × 10⁻⁷, and 1.81 × 10⁻⁹, respectively. These values do not exceed the carcinogenic risk threshold (1× 10⁻⁶ to 1 × 10⁻⁴), indicating that the heavy metals in atmospheric depositions have low carcinogenic risk and are in a safe range in the main city area.

4. Conclusions

In this study, samples of atmospheric deposition were collected from the five functional areas of Shijiazhuang City and comprehensively assessed for heavy metal spatial distribution, pollution sources from power plants, building sites, and traffic based on vehicles, pollution level, and health risks for representative studied areas. The distribution shows that the concentrations of heavy metal content in the industrial, commercial, and traffic areas are higher than in the office and residential areas. The average Cd, Zn, and Pb concentrations in the study areas are 18, six, and five times higher, respectively, than the background value for Hebei soil. The pollution level and potential ecological risk index are also high, indicating anthropogenic input. According to the results of Pb isotope ratio and PCA, Zn, Cd, and Pb contributions are from power plants (coal-fired) and traffic. The health risk assessment shows that overall noncarcinogenic risk and carcinogenic risk (in children and adults) are below the health risk threshold. The results indicate that the risk of heavy metal–related cancer in the study area is at a safe level. However, the high pollution level suggests that faster progress should be made in coal–gas conversion projects in urban areas, and that sources of coal dust should be cut off in order to protect the ecological environment in Shijiazhuang. Moreover, the main polluting companies are the coking plant, chemical fertilizer plant, and pharmaceutical factory. Enterprises that do not follow pollution standards should implement measures such as limiting production and re-equipping in order to further control the sources of heavy metal pollution.

Supplementary Materials

The following are available online at https://www.mdpi.com/2073-4433/10/4/222/s1, Table S1: Significance and value of health risk assessment parameters, Table S2: Analysis results for the Pb isotopes and pollution sources.

Author Contributions

Conceptualization: K.C. and S.N.; Formal Analysis: K.C. and C.L.; Writing—Original Draft Preparation: K.C.; Writing—Review and Editing: C.L.

Funding

This research received no external funding.

Acknowledgments

This paper was supported by Wonkwang University in 2019.

Conflicts of Interest

The authors declare no conflicts of interest.

References

  1. Lu, X.W.; Pan, H.Y.; Wang, Y.W. Pollution evaluation and source analysis of heavy metal in roadway dust from a resource-typed industrial city in Northwest China. Atmos. Pollut. Res. 2017, 8, 587–595. [Google Scholar] [CrossRef]
  2. Kang, S.C.; Zhang, Y.L.; Zhang, Y.J.; Grigholm, B.; Kaspari, S.; Qin, D.H.; Ren, J.W.; Mayewski, P. Variability of atmospheric dust loading over the central Tibetan Plateau based on ice core glaciochemistry. Atmos. Environ. 2010, 44, 2980–2989. [Google Scholar] [CrossRef]
  3. Yan, X.; Shi, W.Z.; Zhao, W.J.; Luo, N.N. Mapping dust distribution in urban areas using remote sensing and ground spectral data. Sci. Total Environ. 2015, 506–507, 604–612. [Google Scholar] [CrossRef]
  4. Shahab, A.D.; Majid, A.; Mahin, K. Multivariate statistical analysis of heavy metals contamination in atmospheric dust of Kermanshah province, western Iran, during the spring and summer 2013. J. Geochem. Explor. 2017, 180, 61–70. [Google Scholar]
  5. He, B.J.; Zhao, D.X.; Zhu, J.; Darko, A.; Gou, Z.H. Promoting and implementing urban sustainability in China: An integration of sustainable initiatives at different urban scales. Habitat Int. 2018, 82, 83–93. [Google Scholar] [CrossRef]
  6. Ferrat, M.; Weiss, D.J.; Dong, S.F.; Large, D.J.; Spiro, B.; Sun, Y.B.; Gallaghe, K. Lead atmospheric deposition rates and isotopic trends in Asian dust during the last 9.5 kyr recorded in an ombrotrophic peat bog on the eastern Qinghai–Tibetan Plateau. Geochim. Cosmochim. Acta 2012, 82, 4–22. [Google Scholar] [CrossRef]
  7. Liu, L.Y.; Shi, P.J.; Gao, S.Y.; Zou, X.Y.; Erdon, H.; Yan, P.; Li, X.Y.; Ta, W.Q.; Wang, J.H.; Zhang, C.L. Dust in China’s western loess plateau as influenced by dust storm and haze events. Atmos. Environ. 2004, 38, 1699–1703. [Google Scholar] [CrossRef]
  8. Liu, X.M.; Song, Q.J.; Tang, Y.; Li, W.L.; Xu, J.M.; Wu, J.J.; Wang, F.; Brookes, P.C. Human health risk assessment of heavy metals in soil -vegetable system: A multi-medium analysis. Sci. Total Environ. 2013, 463, 530–540. [Google Scholar] [CrossRef]
  9. Peng, X.; Shi, G.L.; Liu, G.R.; Xu, J.; Tian, Y.Z.; Zhang, Y.F.; Feng, Y.C.; Russell, A.G. Source apportionment and heavy metal health risk (HMHR) quantification from sources in a southern city in China, using an ME2-HMHR model. Environ. Pollut. 2017, 221, 335–342. [Google Scholar] [CrossRef]
  10. Smart, C.O.; Anthony, C.K.; Theophilus, C.D. Heavy metals and health risk assessment of arable soils and food crops around Pb/Zn mining localities in Enyigba, southeastern Nigeria. J. Afr. Earth Sci. 2016, 116, 182–189. [Google Scholar]
  11. Bao, K.S.; Xing, W.; Yu, X.F.; Zhao, H.M.; McLaughlin, N.; Lu, X.G.; Wang, G.P. Recent atmospheric dust deposition in an ombrotrophic peat bog in Great Hinggan Mountain, Northeast China. Sci. Total Environ. 2012, 431, 33–45. [Google Scholar] [CrossRef] [PubMed]
  12. Díaz-Hernández, J.L.; Martín-Ramos, J.D.; López-Galindo, A. Quantitative analysis of mineral phases in atmospheric dust deposited in the south-eastern Iberian Peninsula. Atmos. Environ. 2011, 45, 3015–3024. [Google Scholar] [CrossRef]
  13. Liu, G.N.; Yua, Y.J.; Hou, J.; Xue, W.; Liu, X.H.; Liu, Y.Z.; Wang, W.H.; Alsaedi, A.; Hayat, T.; Liu, Z.T. An ecological risk assessment of heavy metal pollution of the agricultural ecosystem near a lead-acid battery factory. Ecol. Indic. 2014, 47, 210–218. [Google Scholar] [CrossRef]
  14. He, B.J.; Zhao, Z.Q.; Shen, L.D.; Wang, H.B.; Li, L.G. An approach to examining performances of cool/hot sources in mitigating/enhancing land surface temperature under different temperature backgrounds based on Landsat 8 image. Sustain. Cities Soc. 2019, 44, 416–427. [Google Scholar] [CrossRef]
  15. Hao, S.F.; Chen, S.L.; Zhu, B.W. Review on progress of heavy metal elements in atmospheric deposition in urban environment. J. Geol. 2012, 36, 418–422. [Google Scholar]
  16. Ganora, E.; Foner, H.A.; Gravenhorst, G. The amount and nature of the dust on Lake Kinneret (the Sea of Galilee), Israel: Flux and fractionation. Atmos. Environ. 2003, 37, 4301–4315. [Google Scholar] [CrossRef]
  17. Guo, G.H.; Wu, F.C.; Xie, F.Z.; Zhang, R.Q. Spatial distribution and pollution assessment of heavy metals in urban soils from southwest China. J. Environ. Sci. 2012, 24, 410–418. [Google Scholar] [CrossRef] [Green Version]
  18. Banerjee, A. Heavy metal levels and soils phase speciation in street dusts of Delhi, India. Environ. Pollut. 2003, 123, 95–105. [Google Scholar] [CrossRef]
  19. Dixon, S.L.; Gaitens, J.M.; Jacobs, D.E. US Children’s exposure to residential dust Lead, 1999–2004: II. The contribution of Lead-contaminated dust to children’s blood Lead levels. Environ. Health Perspect. 2008, 117, 468–474. [Google Scholar] [CrossRef]
  20. Pang, X.G.; Wang, X.M.; Dai, J.R.; Guo, R.P.; Yu, C.; Cui, Y.J.; Dong, J. Geochemical characteristics and pollution sources identification of the atmospheric dust-fall in Jinan city. Geol. China 2014, 41, 285–293. [Google Scholar]
  21. Miguele, D.; Llamas, J.F.; Chcoan, E. Origin and patterns of distribution of trace elements in street dust: Unleaded petrol and urban lead. Atmos. Environ. 1997, 31, 2733–2740. [Google Scholar] [CrossRef]
  22. Eisa, S.; Neda, R.; Mahshad, K.G. A comparative study of metals in roadside soils and urban parks from Hamedan metropolis, Iran. Environ. Nanotechnol. Monit. Manag. 2016, 6, 169–175. [Google Scholar]
  23. Tepanosyan, G.; Sahakyan, L.; Belyaeva, O.; Maghakyan, N.; Saghatelyan, A. Human health risk assessment and riskiest heavy metal origin identification in urban soils of Yerevan, Armenia. Chemosphere 2017, 184, 1230–1240. [Google Scholar] [CrossRef]
  24. Huang, Y.; Li, T.Q.; Wu, C.X.; He, Z.L.; Jan, J.P.; Deng, M.H.; Yang, X. An integrated approach to assess heavy metal source apportionment in peri-urban agricultural soils. J. Hazard. Mater. 2015, 299, 540–549. [Google Scholar] [CrossRef] [PubMed]
  25. Huang, Y.; Chen, Q.Q.; Deng, M.H.; Japenga, J.; Li, T.Q.; Bi, C.J.; Zhou, Y.; Chen, Z.L.; Jia, J.P.; Bao, X.Y. Heavy metals and lead isotopes in soils, road dust and leafy vegetables and health risks via vegetable consumption in the industrial areas of Shanghai, China. Sci. Total Environ. 2018, 619–620, 1349–1357. [Google Scholar]
  26. USEPA. Risk Assessment Guidance for Superfund vol. I: Human Health Evaluation Manual; US Environmental Protection Agency: Washington, DC, USA, 1989.
  27. USEPA. Supplemental Guidance for Developing Soil Screening Levels for Superfund Sites; US Environmental Protection Agency: Washington, DC, USA, 2002.
  28. Technical Standard of Geological Survey of China Geological Survey Technical Requirements for Eco-Geochemical Evaluation of Sample Analysis (DD2005-03); Standard Press of China: Beijing, China, 2005.
  29. Hu, G.R.; Yu, R.L.; Zheng, Z.M. Application of stable lead isotopes in tracing heavy-metal pollution sources in the sediments. Acta Sci. Circumstantiae 2013, 33, 1326–1331. [Google Scholar]
  30. Müller, G. Index of geoaccumulation in sedimentsof the Rhine River. Geojournal 1969, 2, 108. [Google Scholar]
  31. Hakanson, L. An ecological risk index for aquatic pollution control. A sedimentological approach. Water Res. 1980, 14, 975–1001. [Google Scholar] [CrossRef]
  32. Ferreria-Baptista, L.; DeMigule, E. Geochemistry and risk assessment of street dust in Luanda, Angola: Atropical urban environment. Atmos. Environ. 2005, 39, 4501–4512. [Google Scholar] [CrossRef]
  33. Li, Z.Y.; Ma, Z.W.; Kuijp, T.J.; Yuan, Z.W.; Huang, L. A review of soil heavy metal pollution from mines in China: Pollution and health risk assessment. Sci. Total Environ. 2014, 468, 843–853. [Google Scholar] [CrossRef] [PubMed]
  34. Wang, C.H.; Zhou, S.L.; Song, J.; Wu, S.H. Human health risks of polycyclic aromatic hydrocarbons in the urban soils of Nanjing, China. Sci. Total Environ. 2018, 612, 750–757. [Google Scholar] [CrossRef] [PubMed]
  35. Chang, J.; Liu, M.; Li, X.H. Primary research on health risk assessment of heavy metals in road dust of Shanghai. China Environ. Sci. 2009, 29, 548–554. (In Chinese) [Google Scholar]
  36. Li, H.X.; Ji, H.B. Chemical speciation, vertical profile and human health risk assessment of heavy metals in soils from coal-mine brownfield, Beijing, China. J. Geochem. Explor. 2017, 183, 22–32. [Google Scholar] [CrossRef]
  37. Men, C.; Liu, R.M.; Xu, F.; Wang, Q.R.; Guo, L.J.; Shen, Z.Y. Pollution characteristics, risk assessment, and source apportionment of heavy metals in road dust in Beijing, China. Sci. Total Environ. 2018, 612, 138–147. [Google Scholar] [CrossRef]
  38. Xiao, Q.; Zong, Y.T.; Lu, S.G. Assessment of heavy metal pollution and human health risk in urban soils of steel industrial city (Anshan), Liaoning, Northeast China. Ecotoxicol. Environ. Saf. 2015, 120, 377–385. [Google Scholar]
  39. Yang, X.; He, Z.L. Heavy metal pollution and health risk assessment of agricultural soils in a typical peri-urban area in southeast China. J. Environ. Manag. 2018, 207, 159–168. [Google Scholar]
  40. Mehr, M.R.; Keshavarzi, B.; Moore, F.; Sharifi, R.; Lahijanzadeh, A.; Kermani, M. Distribution, source identification and health risk assessment of soil heavy metals in urban areas of Isfahan province, Iran. J. Afr. Earth Sci. 2017, 132, 16–26. [Google Scholar] [CrossRef]
  41. Wang, F.X.; Hu, Y.Q.; Li, S.Z. Hebei Province, soil content of heavy metals and their background values. Agric. Environ. Prot. 1987, 6, 21–23. (In Chinese) [Google Scholar]
  42. Wei, F.S.; Ya, G.Z.; Jiang, D.Z.; Liu, Z.H.; Sun, B.M. Basic statistics of soil element background and its eigenvalues in China. Environ. Monit. China 1991, 7, 1–5. (In Chinese) [Google Scholar]
  43. Chen, Z.R.; Fu, D.F. The Analysis of Excess Emission at the Signalized Intersections. J. Highw. Transp. Res. Dev. 1993, 10, 67–71. (In Chinese) [Google Scholar]
  44. Pan, H.Y.; Lu, X.W.; Lei, K. A comprehensive analysis of heavy metals in urban road dust of Xi’an, China: Contamination, source apportionment and spatial distribution. Sci. Total Environ. 2017, 609, 1361–1369. [Google Scholar] [CrossRef]
  45. Hong, N.; Zhu, P.F.; Liu, A. Modelling heavy metals build-up on urban road surfaces for effective stormwater reuse strategy implementation. Environ. Pollut. 2017, 231, 821–828. [Google Scholar] [CrossRef] [PubMed]
  46. Kojima, K.; Murakami, M.; Yoshimizu, C.; Tayasu, I.; Nagata, T.; Furumai, H. Evaluation of surface runoff and road dust as sources of nitrogen using nitrate isotopic composition. Chemosphere 2011, 84, 1716–1722. [Google Scholar] [CrossRef] [PubMed] [Green Version]
  47. Wu, L.M. Environmental Statistics; China Environmental Science Press: Beijing, China, 1991; 426p. (In Chinese) [Google Scholar]
  48. Zheng, N.; Liu, J.; Wang, Q.; Liang, Z. Health risk assessment of heavy metal exposure to street dust in the zinc smelting district, northeast of China. Sci. Total Environ. 2010, 408, 726–733. [Google Scholar] [CrossRef] [PubMed]
Figure 1. Map of sampling points in Shijiazhuang City. Green, yellow, red, purple, and blue triangles represent residential, commercial, industrial, office, and traffic areas, respectively.
Atmosphere 10 00222 g001
Figure 2. Box plots for functional areas (1, residential area; 2, commercial area; 3, industrial area; 4, office area; 5, traffic area).
Atmosphere 10 00222 g002aAtmosphere 10 00222 g002b
Figure 3. Spatial distribution of heavy metals (Cd, Cr, Cu, Ni, Pb, and Zn).
Atmosphere 10 00222 g003
Figure 4. Pb isotope plots for samples and pollution sources (samples in red circles have similar sources).
Atmosphere 10 00222 g004
Figure 5. Component plot in rotated space. (Cd, Zn, Pb, and Cu in the red circles represent anthropogenic sources, and Cr and Ni in the green circle represent the natural source.)
Atmosphere 10 00222 g005
Figure 6. Box charts for accumulation index and potential hazard index.
Atmosphere 10 00222 g006
Table 1. Statistical values of heavy metal concentrations in urban atmospheric deposition (mg/kg).
ElementMaximumMinimumAverageStandard DeviationVariable Coefficient95% UCL 1Background Value of Hebei Soil [41]Background Value of Chinese Soil [42]
Cd0.3414.21.761.96110.9%2.300.0940.097
Cr61.2592115.8582.4371.16%138.3568.361
Cu25.324374.6643.2657.94%86.4721.822.6
Pb34.2217107.9349.2445.62%121.3621.526
Ni18.610238.5212.6532.85%41.9730.826.9
Zn1142194475.61310.2365.23%560.2978.472.4
1 95% confidence limit of heavy metal concentration.
Table 2. Total principal component analysis (PCA) variance for heavy metals.
ElementRotated Component MatrixCommunalities
123
Cd0.433−0.027−0.7020.681
Cr−0.0970.925−0.1020.876
Cu0.328−0.0210.7560.680
Pb0.858−0.0260.0910.745
Ni0.5180.6570.2420.760
Zn0.8240.101−0.0660.694
Eigenvalue1.9881.3011.146
% of variance33.13421.67619.102
Cumulative %33.13454.81073.912
Extraction method: principal component analysis. Rotation method: varimax with Kaiser normalization.
Table 3. Exposure doses of heavy metals in atmospheric deposition (mg/(kg·d)).
Exposure DoseCdCrNiCuPbZn
ChildrenADDing1.51 × 10−59.1 × 10−42.76 × 10−41.19 × 10−47.9 × 10−43.68 × 10⁻³
ADDinh4.24 × 10−102.55 × 10−87.74 × 10−91.59 × 10−82.24 × 10−81.03 × 10⁻⁷
ADDderm1.73 × 10−81.05 × 10−63.17 × 10−76.54 × 10−79.18 × 10−74.24 × 10⁻⁶
AdultsADDing1.62 × 10−69.75 × 10−52.96 × 10−56.09 × 10−58.55 × 10−53.95 × 10⁻⁴
ADDinh2.38 × 10−101.43 × 10−84.35 × 10−98.96 × 10−91.26 × 10−85.80 × 10⁻⁸
ADDderm2.43 × 10−92.43 × 10−94.43 × 10−89.13 × 10−81.28 × 10−75.91 × 10⁻⁷
Average cancer risk exposure dose for children and adultsLADDinh1.18 × 10−107.10 × 10−92.15 × 10−9
Table 4. Noncarcinogenic risk index and carcinogenic risk of heavy metals (children and adults) in atmospheric deposition.
Reference Dose (RfD)CdCrNiCuPbZn
RfDing (mg/(kg·d))0.1 × 10−20.3 × 10−20.020.043.5 × 10−30.3
RfDinh (mg/(kg·d))0.1 × 10−22.86 × 10−52.06 × 10−24.02 × 10−23.52 × 10−30.3
RfDderm (mg/(kg·d))0.1 × 10−40.6 × 10−45.4 × 10−30.0125.25 × 10−40.06
Sfinh (mg/(kg·d)−1)6.3420.84
Children
CdCrNiCuPbZn
HQing0.0150.3030.0140.0030.230.012
HQinh4.24 × 10−78.92 × 10−43.76 × 10−73.97 × 10−76.36 × 10−63.44 × 10⁻⁷
HQderm1.74 × 10−30.0175.88 × 10−55.45 × 10−51.748 × 10−37.06 × 10⁻⁵
HIchild0.0170.3220.0140.0030.230.012
Adults
CdCrNiCuPbZn
HQing1.62 × 10−30.0321.48 × 10−31.52 × 10−20.0241.32 × 10−3
HQinh2.38 × 10−70.50 × 10−32.11 × 10−72.23 × 10−73.57 × 10−61.93 × 10⁻⁷
HQderm2.43 × 10−44.05 × 10−58.20 × 10−67.60 × 10−62.44 × 10−30.84 × 10⁻²
HIadult1.86 × 10−30.0331.49 × 10−31.53 × 10−20.0250.97 × 10−2
Total cancer risk for children and adults
Risk7.44 × 10−102.98 × 10−71.81 × 10−9

