Article

STAT3 Drives GFAP Accumulation and Astrocyte Pathology in a Mouse Model of Alexander Disease

1
Waisman Center, University of Wisconsin-Madison, Madison, WI 53705, USA
2
Wyss Institute, Harvard University, Boston, MA 02115, USA
3
Department of Pathology, Brigham and Women’s Hospital, Harvard Medical School, Boston, MA 02115, USA
4
Department of Comparative Biosciences, School of Veterinary Medicine, University of Wisconsin-Madison, Madison, WI 53705, USA
*
Author to whom correspondence should be addressed.
Cells 2023, 12(7), 978; https://doi.org/10.3390/cells12070978
Submission received: 30 December 2022 / Revised: 18 March 2023 / Accepted: 20 March 2023 / Published: 23 March 2023
(This article belongs to the Special Issue Astrocytes in CNS Disorders)

Abstract

:
Alexander disease (AxD) is caused by mutations in the gene for glial fibrillary acidic protein (GFAP), an intermediate filament expressed by astrocytes in the central nervous system. AxD-associated mutations cause GFAP aggregation and astrogliosis, and GFAP is elevated with the astrocyte stress response, exacerbating mutant protein toxicity. Studies in mouse models suggest disease severity is tied to Gfap expression levels, and signal transducer and activator of transcription (STAT)-3 regulates Gfap during astrocyte development and in response to injury and is activated in astrocytes in rodent models of AxD. In this report, we show that STAT3 is also activated in the human disease. To determine whether STAT3 contributes to GFAP elevation, we used a combination of genetic approaches to knockout or reduce STAT3 activation in AxD mouse models. Conditional knockout of Stat3 in cells expressing Gfap reduced Gfap transactivation and prevented protein accumulation. Astrocyte-specific Stat3 knockout in adult mice with existing pathology reversed GFAP accumulation and aggregation. Preventing STAT3 activation reduced markers of reactive astrocytes, stress-related transcripts, and microglial activation, regardless of disease stage or genetic knockout approach. These results suggest that pharmacological inhibition of STAT3 could potentially reduce GFAP toxicity and provide a therapeutic benefit in patients with AxD.

1. Introduction

Alexander disease (AxD) is a progressive and generally fatal disorder of the central nervous system (CNS), with a range of clinical phenotypes including cognitive and motor impairment and white matter deficits that are distributed throughout the neuroaxis [1]. AxD has been subclassified into two groups, with type I demonstrating frontal predominance and early onset, and type II presenting with lesions concentrated in the hindbrain and cervical spinal cord, less pronounced leukodystrophy and cognitive deficits, and onset at any age [2]. The hallmark pathological feature in both groups is the presence of Rosenthal fibers, cytoplasmic protein aggregates of astrocytes, particularly in perivascular, subpial, and subependymal locations.
Nearly all cases of AxD result from heterozygous missense mutations in the astrocyte intermediate filament, GFAP [3,4]. To better understand how mutations in GFAP cause disease, we generated mouse models with knock-in mutations causing single amino acid changes orthologous to common human mutations at the endogenous Gfap locus [5]. These models replicate many of the pathological characteristics found in the human disease. AxD mice spontaneously increase expression of Gfap above normal levels, form the characteristic Rosenthal fibers within the cytoplasm of astrocytes, induce stress responses including Nrf2/ARE and small heat shock protein pathways, and activate microglia [6].
A major factor in the pathology induced by mutant GFAP in AxD is accumulation of GFAP protein to toxic levels. Even overexpression of wild-type GFAP causes protein aggregation, and at high enough levels, is lethal [7]. The cascade of stress response signaling pathways associated with protein misfolding leads to reactive gliosis with increased GFAP expression, which is in part due to transactivation of the Gfap promoter [8]. The transcription factor STAT3 regulates astrocyte development and astrogliosis and directly controls transcription of Gfap [9,10,11,12,13]. STAT3 binds to the Gfap promoter and is necessary to induce expression [13,14], and STAT3 activation has been shown to drive reactive gliosis in several models of acute injury [11,12,15] and neurodegeneration [16,17].
Although the disease process in AxD is initiated by expression of mutant protein, the resulting astrogliosis and transactivation of the Gfap promoter further promote protein accumulation and toxicity [8]. We have shown that STAT3 is phosphorylated in both mouse and rat models of AxD [18,19] and hypothesize that activation of STAT3 contributes to a positive feedback loop that drives increased GFAP expression, protein accumulation, and ultimately astrocyte dysfunction. Here, we used a combination of genetic approaches to manipulate STAT3 activation and clarify its involvement in chronic gliosis and to test whether blocking phosphorylation reduces astrocyte pathology in mouse models of the disease. Therapeutic approaches to target activation of the JAK/STAT pathway have been approved to treat inflammatory disorders, hematopoietic malignancies, and solid tumors [20,21], and inhibitors that cross the blood-brain barrier could potentially be repurposed to benefit patients with AxD.

2. Materials and Methods

2.1. Mice

All animal studies were approved by the College of Letters and Sciences and Vice Chancellor Office for Research and Graduate Education Animal Care and Use Committee within the University of Wisconsin-Madison. Gfap+/R236H mice (Gfaptm2Mes) were maintained as heterozygotes congenic in either FVB/N-Tac or C57BL/6J genetic backgrounds [5]. Stat3fl/fl mice (Stat3tm2Aki) [22], engineered with loxP sites flanking the exon coding for the Tyr-705 phosphorylation site, were congenic in C57BL/6J and maintained as homozygotes. Tg(Gfap-cre)73.12Mvs (C57BL/6J, JAX stock #012886) [23] and Tg(Aldh1l1-cre/ERT2)1Khakh (C57BL/6NJ, JAX stock #031008) [24] lines were maintained as hemizygotes. Ai14 Cre reporter mice (Gt(ROSA)26Sortm14(CAG-tdTomato)Hze/J, C57BL/6J, JAX stock #007914) [25] were maintained as heterozygotes. Heterozygous constitutive Stat3+/− knockout mice were generated by crossing a nestin-promotor-driven Cre line (Tg(Nes-cre)1Kln, C57BL/6J, JAX stock #003771) [26] with Stat3fl/fl mice for germline excision of the floxed allele. Cre excision removes the exon containing the Tyr-705 phosphorylation site while leaving the remaining coding sequence in frame and the translated protein intact. The genes for STAT3 and GFAP are located within a 2 megabase interval on mouse chromosome 11 and required homologous recombination between the two genes to combine the floxed Stat3 allele with the R236H Gfap mutation. These mice were maintained by crossing Gfap+/R236H; Stat3fl/fl mice with Stat3fl/fl mice. Genotyping was performed by Transnetyx using real time PCR to analyze tail biopsy DNA.

2.2. Human Brain Tissue

Frozen frontal cortex from a 1-year-old AxD patient was obtained from the NICHD Brain and Tissue Bank for Developmental Disorders at the University of Maryland, Baltimore, MD, USA. Tissue was thawed and fixed in 4% paraformaldehyde overnight before paraffin embedding for immunolabeling.

2.3. Tamoxifen Induction

For inducible Cre activation in mice expressing the Aldh1l1-CreERT2 transgene, all mice were given intraperitoneal injections of 80 mg/kg tamoxifen (Sigma T5648, dissolved in corn oil at 20 mg/mL) daily for 5 days starting at approximately P56. Personnel administering the injections were blinded to genotypes. Tissues were collected for molecular and histological analysis at 3 months of age (~P90) as described below.

2.4. Tissue Collection

For molecular analysis of crosses including Gfap+/R236H; Stat3+/− or Gfap+/R236H; Stat3−/fl; Gfap-CreTg73.12 mice, animals were euthanized by CO2 asphyxiation, and tissues were collected on ice and frozen immediately with dry ice and stored at −80 °C until processed. For experiments performed with crosses to generate Gfap+/R236H; Stat3fl/fl; Gfap-CreTg73.12 mice, animals were first anesthetized with isoflurane and transcardially perfused with phosphate buffered saline (PBS, pH 7.4). Brains were collected and bisected at the midline: half was placed in 4% paraformaldehyde for histological analysis, and half was microdissected and frozen for molecular analysis.
For experiments performed with mice from the Gfap+/R236H; Stat3fl/fl; Aldh1l1-CreERT2; Ai14 cross, animals that were positive for Ai14 were anesthetized with isoflurane and transcardially perfused with phosphate buffer, followed by 4% paraformaldehyde for histological analysis. Animals that were Ai14 negative were euthanized by CO2 asphyxiation, and tissues were collected on ice and frozen immediately with dry ice and stored at −80 °C until processed.

2.5. RNA Extraction and Quantitative PCR

Tissues were homogenized in Trizol reagent (Thermo Fisher Scientific, Invitrogen, Waltham, MA, USA) for RNA analysis per the manufacturer’s protocol. For quantitative PCR, 1 µg RNA was transcribed as cDNA using 1 µm random hexamers, 2 µm poly-(dT)15 primers and 500 nm (each) dNTP in a 20 µL reaction with Superscript III (Thermo Fisher Scientific, Invitrogen protocol). Reverse transcriptase reactions were diluted and incorporated into quantitative PCR at a ratio of 16 nl cDNA per µL reaction using SYBR Green Master Mix with 150 nM primers (Table 1) on an ABI ViiA7 Real-Time PCR System (Thermo Fisher Scientific, Applied Biosystems Inc.). Standards generated from purified amplicons were used to determine relative concentrations, and values were normalized to Rn18s.

2.6. Protein Extraction and Western Analysis

Total protein lysates were prepared from frozen brain regions by homogenizing with a bead mill mixer (GenoGrinder, SPEX SamplePrep) with 50 mg tissue per ml 2% SDS, 50 mM, Tris-HCl (pH 7.4), 5 mM EDTA, 1 mM Pefabloc SC (Sigma-Aldrich, St. Louis, MO, USA) and Complete Protease Inhibitor Cocktail (Sigma-Aldrich, Roche). Samples were boiled for 20 min, and protein concentration was determined by bicinchoninic acid assay using the BCA Protein Assay kit (Thermo Fisher Scientific) with bovine serum albumin (BSA) as a standard. For western analysis, samples were diluted with lysis buffer to equivalent concentrations and 20–30 µg electrophoresed (125V at room temperature until bromophenol blue reached the bottom of the gel) on 26-well 10% Criterion Tris-HCl or TGX gels (BioRad, Hercules, CA, USA) before transferring to an Immobilon-FL membrane using the BioRad Criterion system. For most experiments, immunoblots were stained with REVERT Total Protein Stain (LI-COR Biosciences, Lincoln, NE, USA) and imaged with a LI-COR Odyssey for subsequent normalization (GAPDH was used for normalization otherwise). Membranes were blocked in SEA Blocking Buffer (Thermo Fisher Scientific, Pierce) before incubating with primary antibodies overnight at 4 °C. Immunoblots were washed before adding secondary antibodies and incubating for 2 h at room temperature, washing again, and imaging with a LI-COR Odyssey. Tris buffered saline (TBS, pH 7.5) with 0.05% Tween 20 was used for all antibody dilutions and washes. A final wash in PBS was performed before imaging. Antibodies are listed in Table 2.

2.7. GFAP ELISA

GFAP was quantified from total protein extracted with 2% SDS (described above) by a sandwich enzyme linked immunosorbent assay (ELISA) as described previously [8]. Briefly, microtiter plates (Nunc MaxiSorp, Thermo Fisher Scientific, Waltham, MA, USA) were coated with a cocktail of monoclonal GFAP antibodies diluted in PBS (SMI-26, see Table 2 for antibodies) and blocked with BLOTTO (5% milk in PBS) before adding protein samples and standards diluted in PBS with 1% BSA and 0.05% Tween 20 (Tw20). Plates were incubated at room temperature for 2 h and washed with PBS/0.05% Tw20 before adding rabbit anti-GFAP detection antibody (Dako Z0334) diluted in BLOTTO and incubated overnight at 4 °C. Plates were washed with PBS/0.05% Tw20 followed by incubation with secondary HRP conjugated goat anti-rabbit IgG diluted in BLOTTO at room temperature for 2 h. Plates were washed with PBS/0.05%Tw20 followed by PBS before adding SuperSignal ELISA Femto Substrate (Thermo Fisher Scientific, Pierce, Waltham, MA, USA) and analyzing with a GloRunner luminometer (Turner Biosystems).

2.8. Histological Analysis

Mouse brains were collected as described above, fixed in 4% paraformaldehyde overnight before cryoprotecting in graded concentrations of sucrose (10–30%), and sectioning on a sliding microtome at 40 µm. Sections were stored at −20 °C in 25% glycerol/25% ethylene glycol/0.1 M phosphate buffer (pH 7.4) as cryoprotectant. For labeling, tissue sections were rinsed with PBS, blocked and permeabilized with 5% normal goat or donkey serum, 0.5% Triton-X-100 (TX100) in PBS, and incubated in primary antibody (Table 2) diluted in 1% BSA, 0.3% TX100 in PBS for approximately 72 h at 4 °C. Sections were washed in PBS with 0.05% TX100 before incubating in secondary antibody (Table 2) diluted in 1% BSA, 0.3% TX100 in PBS overnight at 4 °C. Finally, sections were washed in PBS/0.05% TX100 and mounted with ProLong Gold mounting media with DAPI (Thermo Fisher Scientific, Invitrogen). For phophoY705-STAT3 immunofluorescence, sections were further permeabilized with 100% methanol for 10 min at −20 °C prior to adding block. Fluorescence images were collected with a Nikon A1R-HD confocal microscope system with equivalent settings for comparisons between genotypes.

2.9. Image Analysis

All fluorescent images were collected with identical settings at 1024 × 1024 pixel resolution for comparisons and quantification, and analysis performed on grayscale images from individual fluorescent channels. For signal intensity, the entire field of view was selected, and the mean pixel intensity measured with ImageJ/Fiji (NIH). Values are expressed as arbitrary units (a.u.) of fluorescence normalized to the control group. To quantify p62 as a representation of protein aggregation and Rosenthal fibers, gray-scale images were converted to RGB, and p62 positive puncta highlighted using the color threshold adjustment in Fiji (default thresholding method, dark background on) by setting the upper limit for brightness to separate high intensity signals from background in the histogram. The highlighted puncta were selected, and the measured area converted to a percentage of the total image area for comparisons.

3. Results

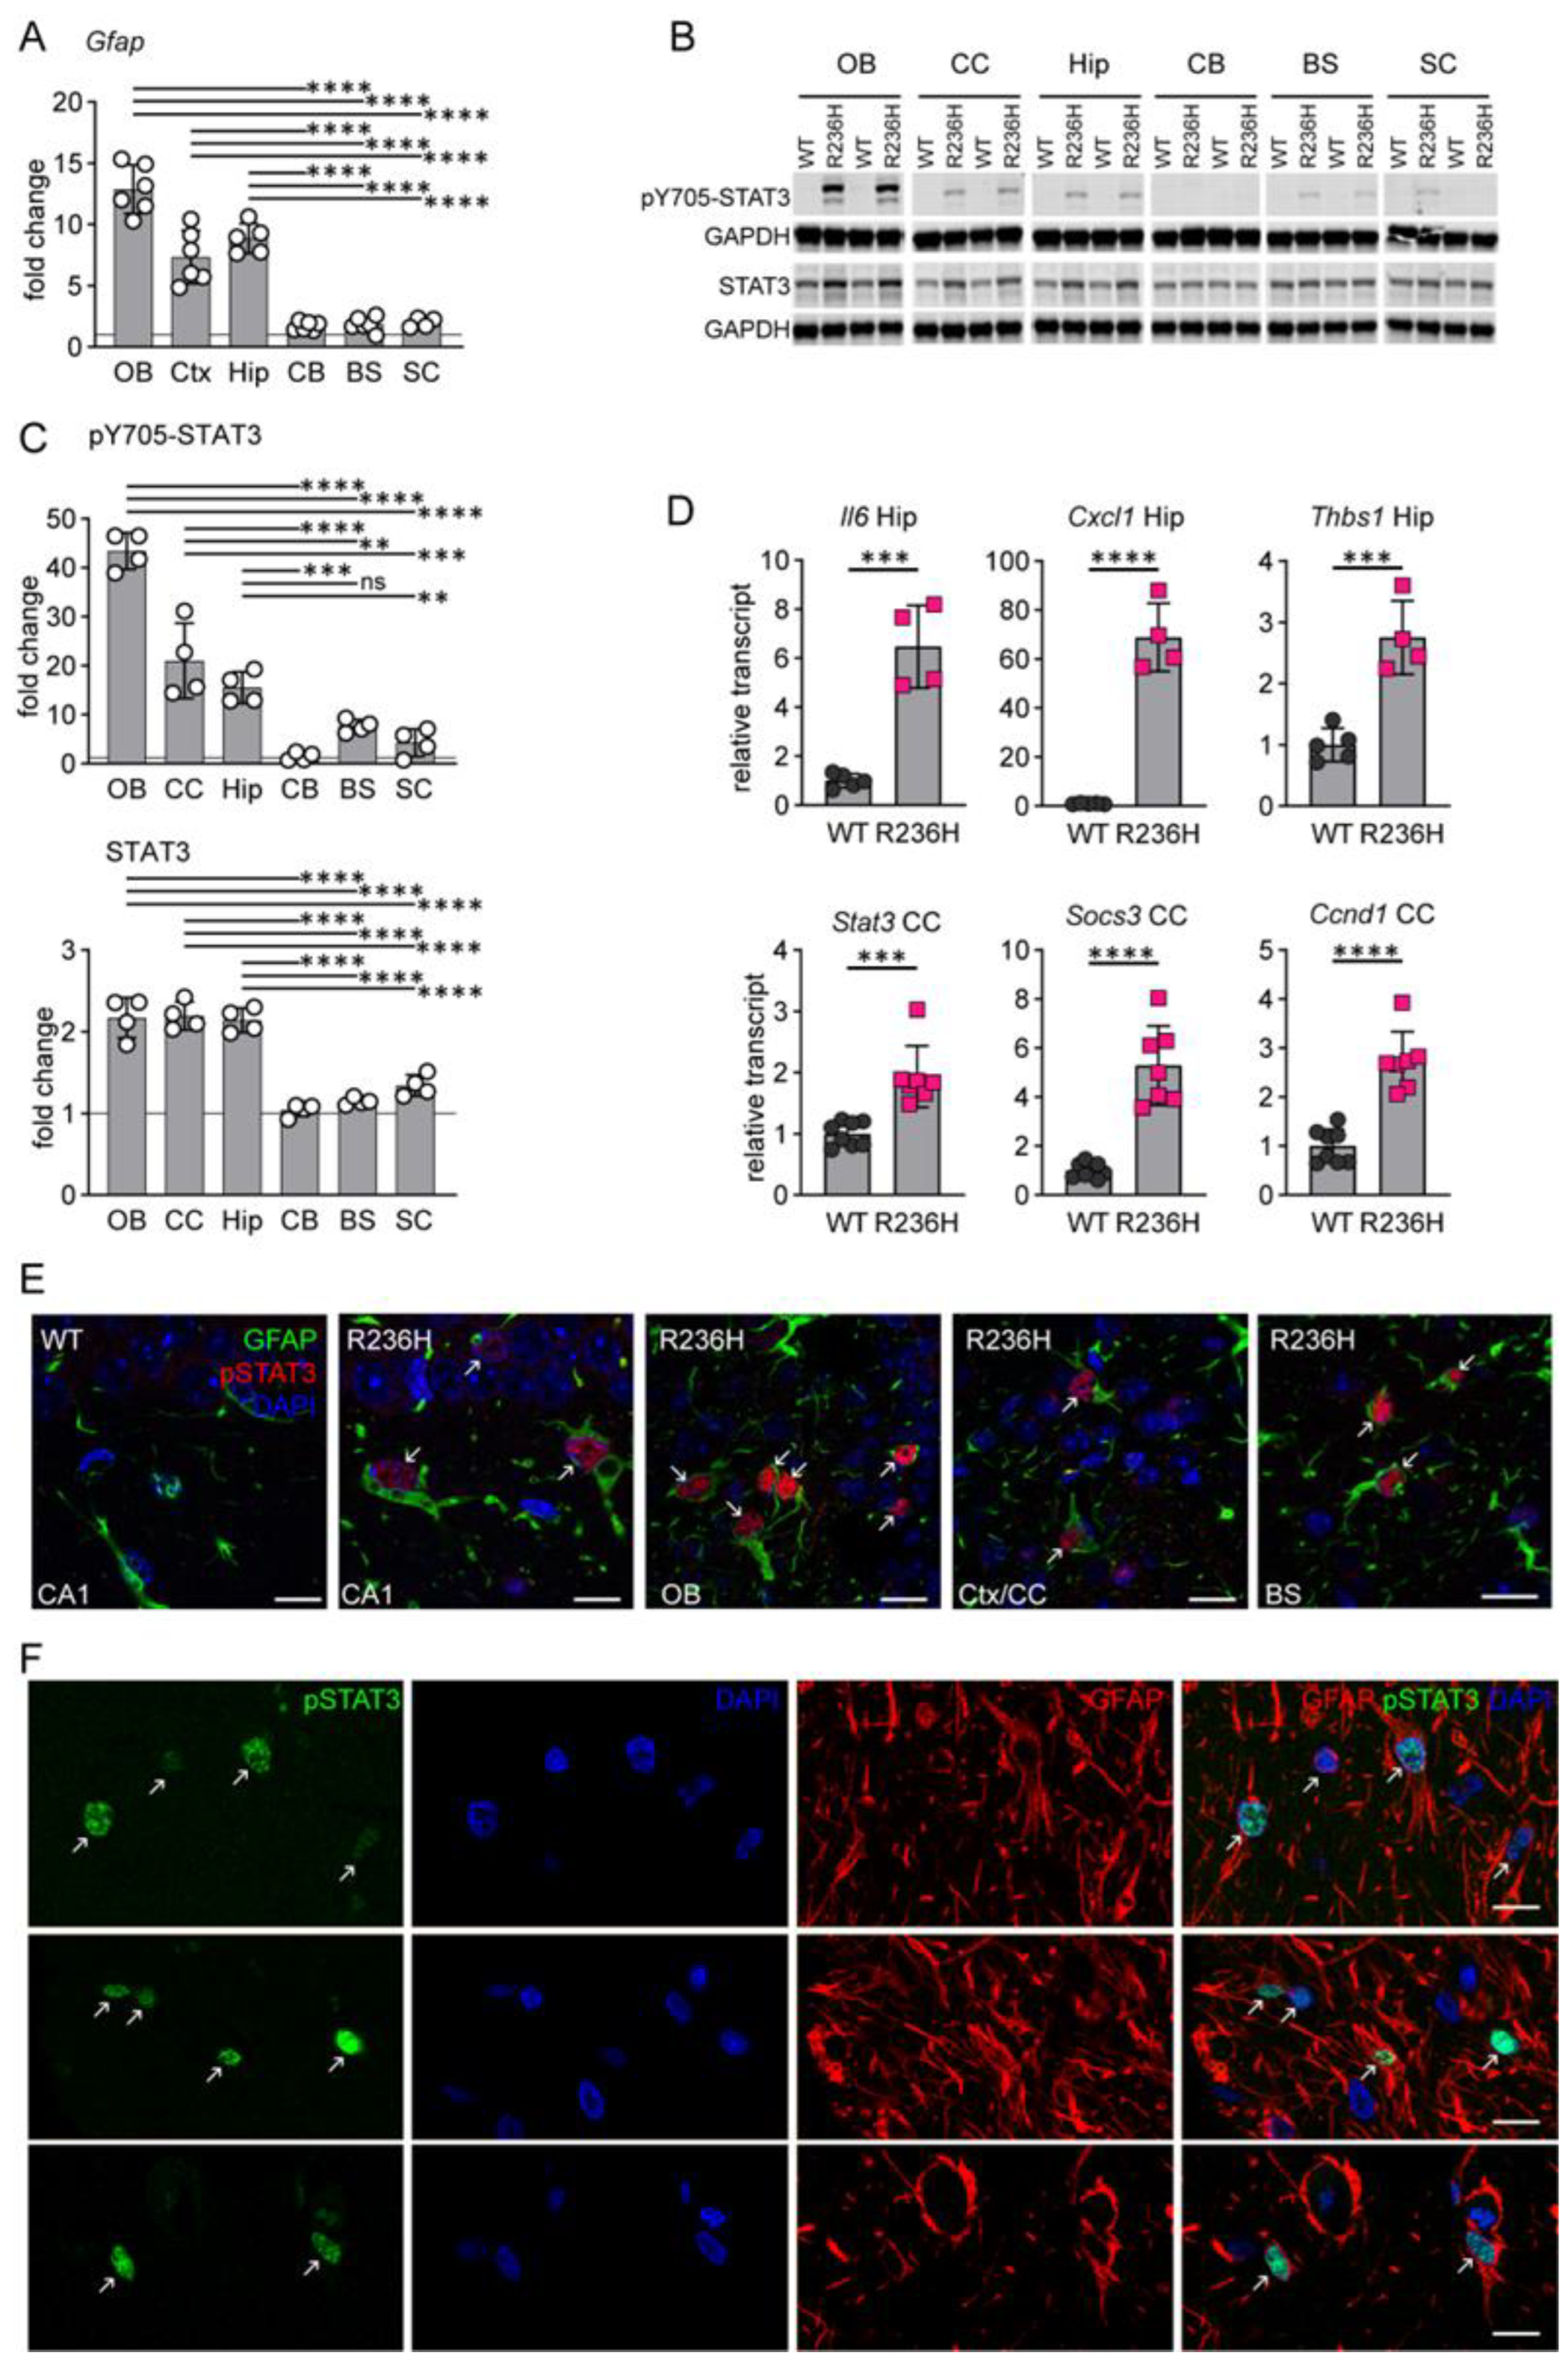
3.1. STAT3 Activation in AxD

Gfap+/R236H mouse models of AxD demonstrate GFAP accumulation and a marked astrocyte stress response. In addition to perivascular, periventricular, and subpial astrocytes, protein aggregation and increased GFAP expression occur predominantly in forebrain regions including hippocampus, corpus callosum and olfactory bulb [5,8]. As a marker of astrogliosis, changes in the Gfap transcript show a similar pattern with greater elevation in forebrain compared to hindbrain regions and spinal cord, as previously reported [8] (Figure 1A). STAT3 is known to transactivate Gfap expression in reactive gliosis [12,15], and transcriptome analysis of a mouse model of AxD overexpressing human GFAP also suggests JAK/STAT pathway activation [27]. To determine whether STAT3 activation correlates with GFAP elevation in mouse models of AxD, we performed western analysis of STAT3 and phosphorylated STAT3 (Tyr705) in different regions of the CNS and found that STAT3 expression and activation were more pronounced in forebrain regions compared to hindbrain regions and spinal cord, similarly to Gfap transcript (Figure 1B,C). Although STAT3 protein was elevated approximately 2-fold, expression levels did not account for the 15- to 40-fold increase in phospho-STAT3. Further analysis showed other genes regulated by STAT3, including Il6, Socs3, Cxcl1, Thbs1, Ccnd1, as well as Stat3, were also elevated in Gfap+/R236H mice (Figure 1D). Immunofluorescence labeling demonstrated nuclear localization of activated pSTAT3 specifically in Gfap+/R236H mouse astrocytes in both forebrain and hindbrain regions (Figure 1E). Importantly, activation of STAT3 was also apparent in brain tissue from a patient with AxD, with nuclear localization of pSTAT3 in astrocytes (Figure 1F). These results suggest that STAT3 contributes to astrocyte reactivity in AxD, but whether the transcription factor is necessary for GFAP accumulation is not clear.

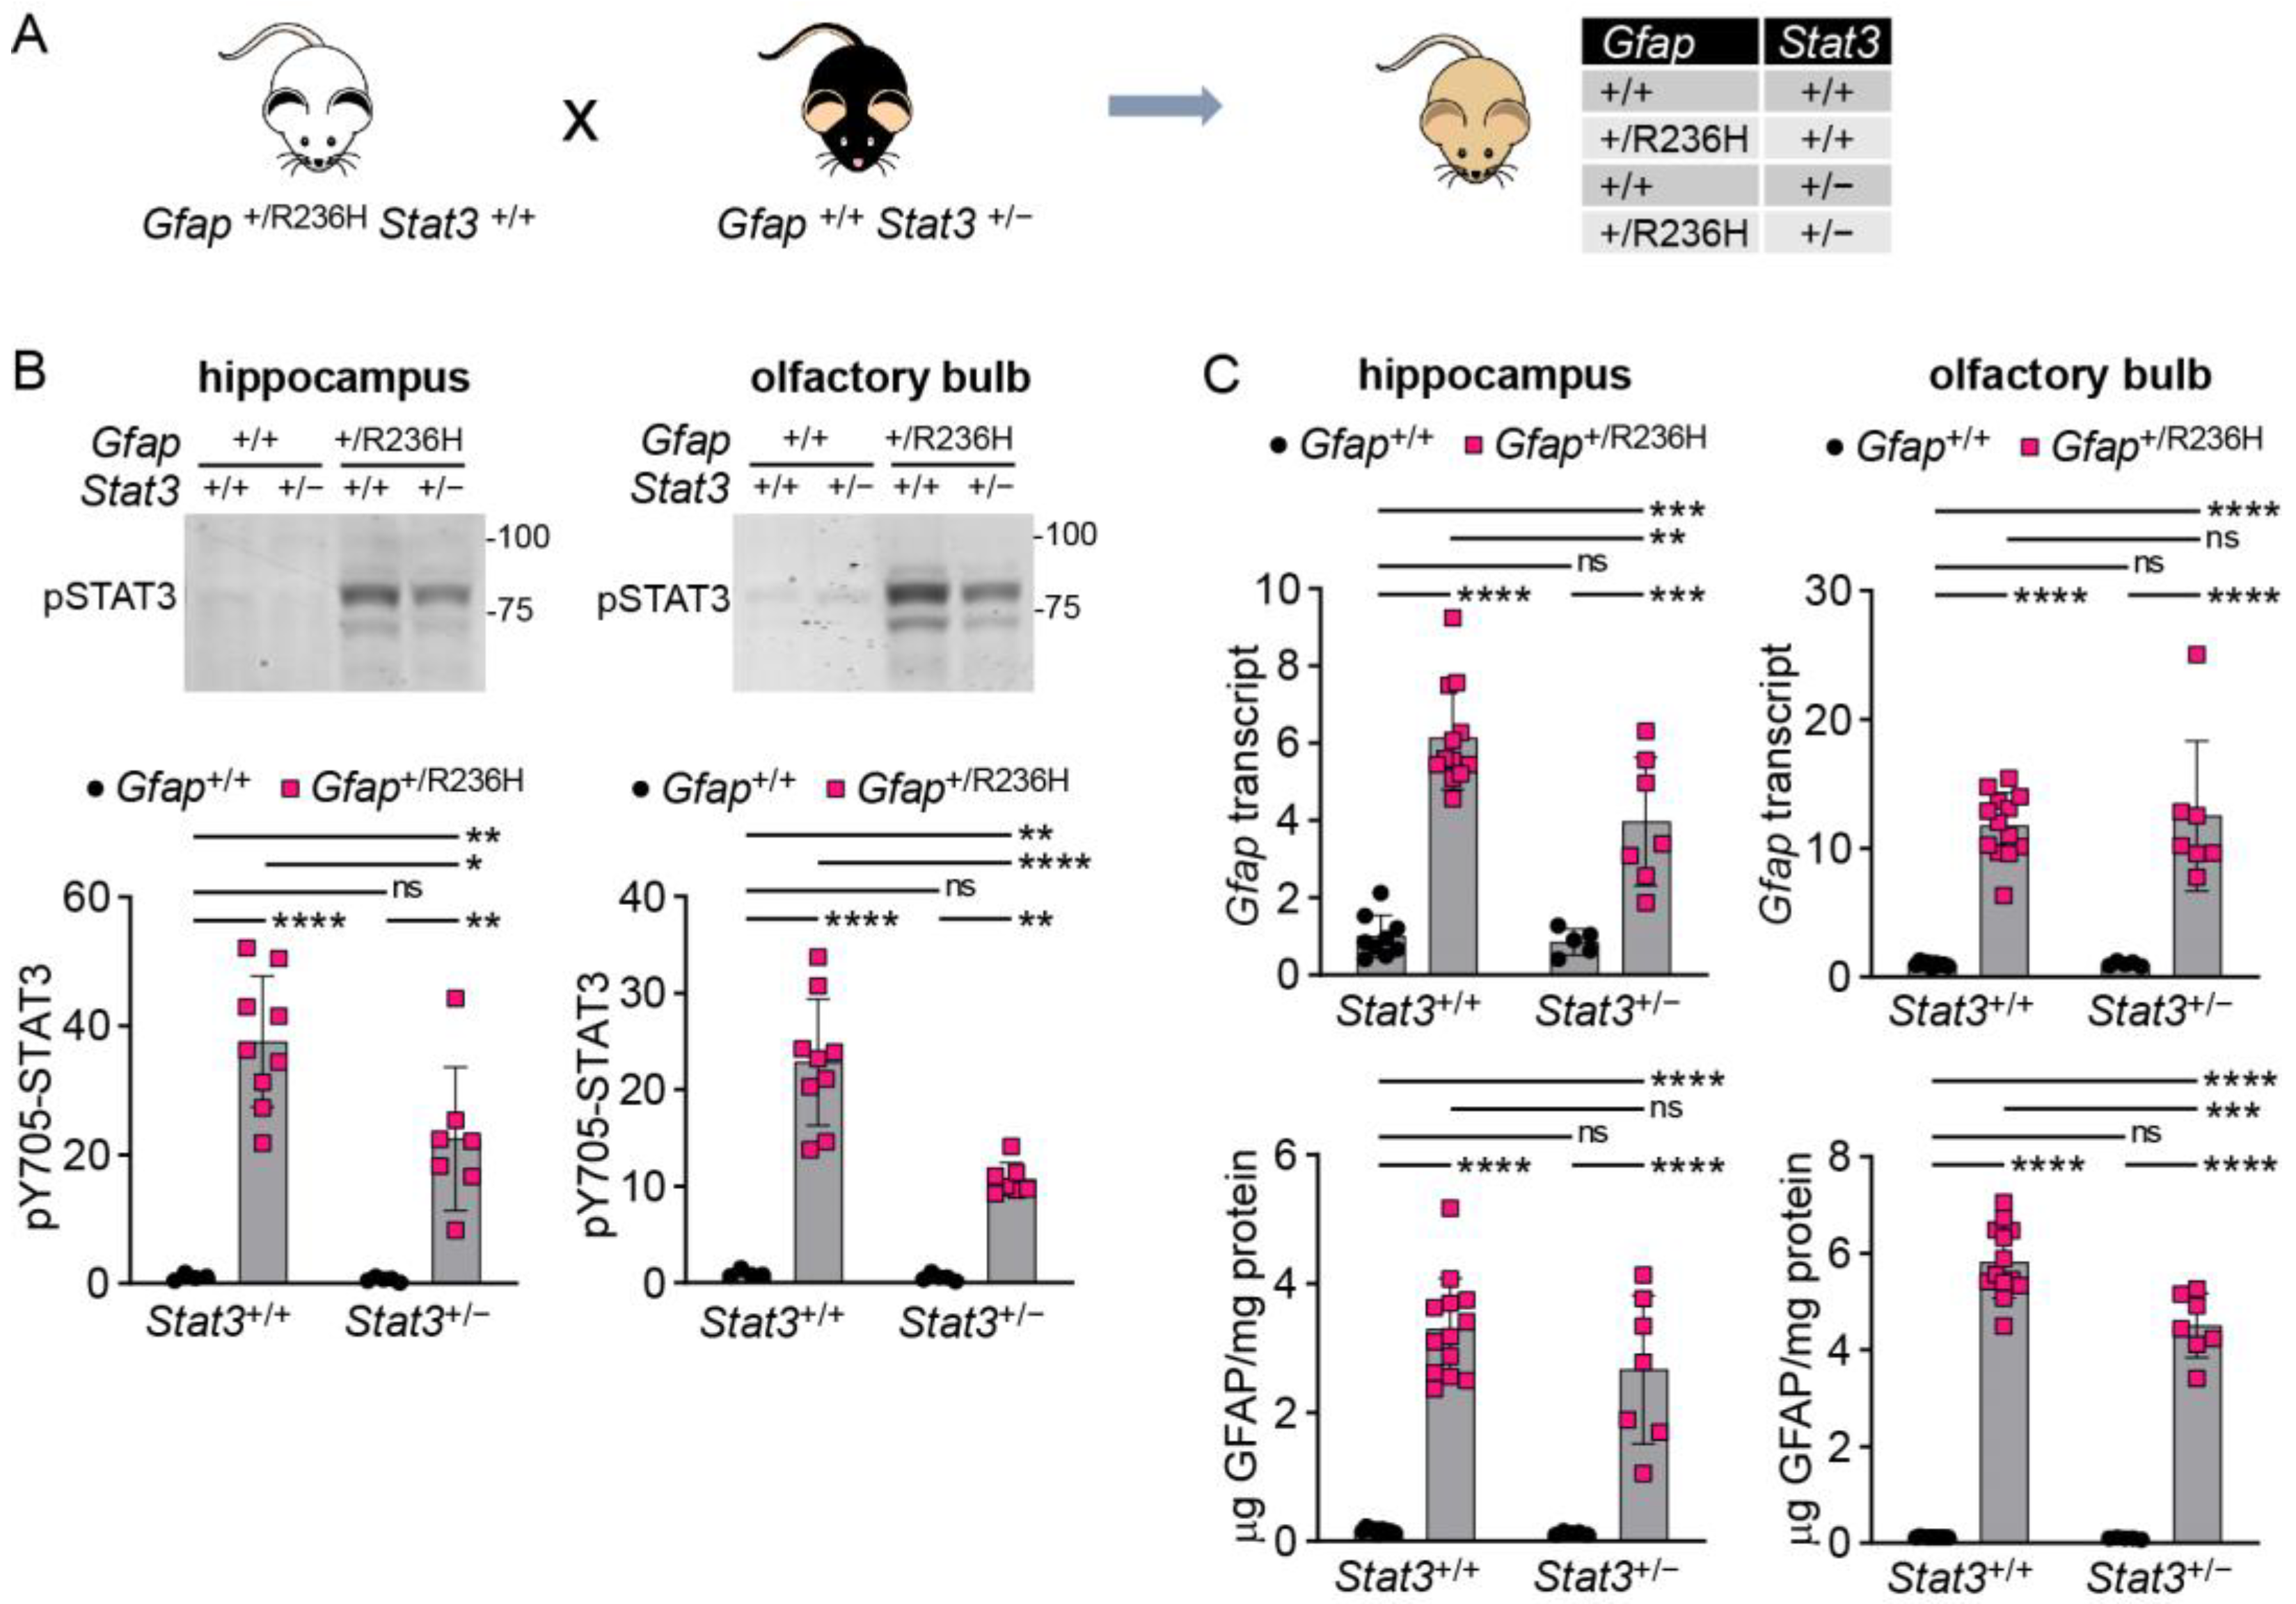
3.2. Genetic Knockdown of STAT3 in AxD Model Mice

STAT3 is a pleiotropic transcription factor, and complete knockout by deletion of both alleles is lethal [28]. To further explore whether reduced STAT3 activation affects GFAP expression, we generated heterozygous constitutive knockout mice from the Stat3tm2Aki strain [22] (see methods), and this line was crossed with Gfap+/R236H mice (Figure 2A). At 12 weeks of age, Gfap+/R236H; Stat3+/− mice exhibited reduced pSTAT3 protein in hippocampus and olfactory bulb (Figure 2B), two regions known to have elevated GFAP in AxD mouse models. Quantitation of Gfap transcript and GFAP protein demonstrated only subtle and inconsistent differences (Figure 2C), suggesting that even at reduced levels, pSTAT3 activation is still sufficient to elevate Gfap expression, or that other pathways are involved in Gfap transactivation in AxD.

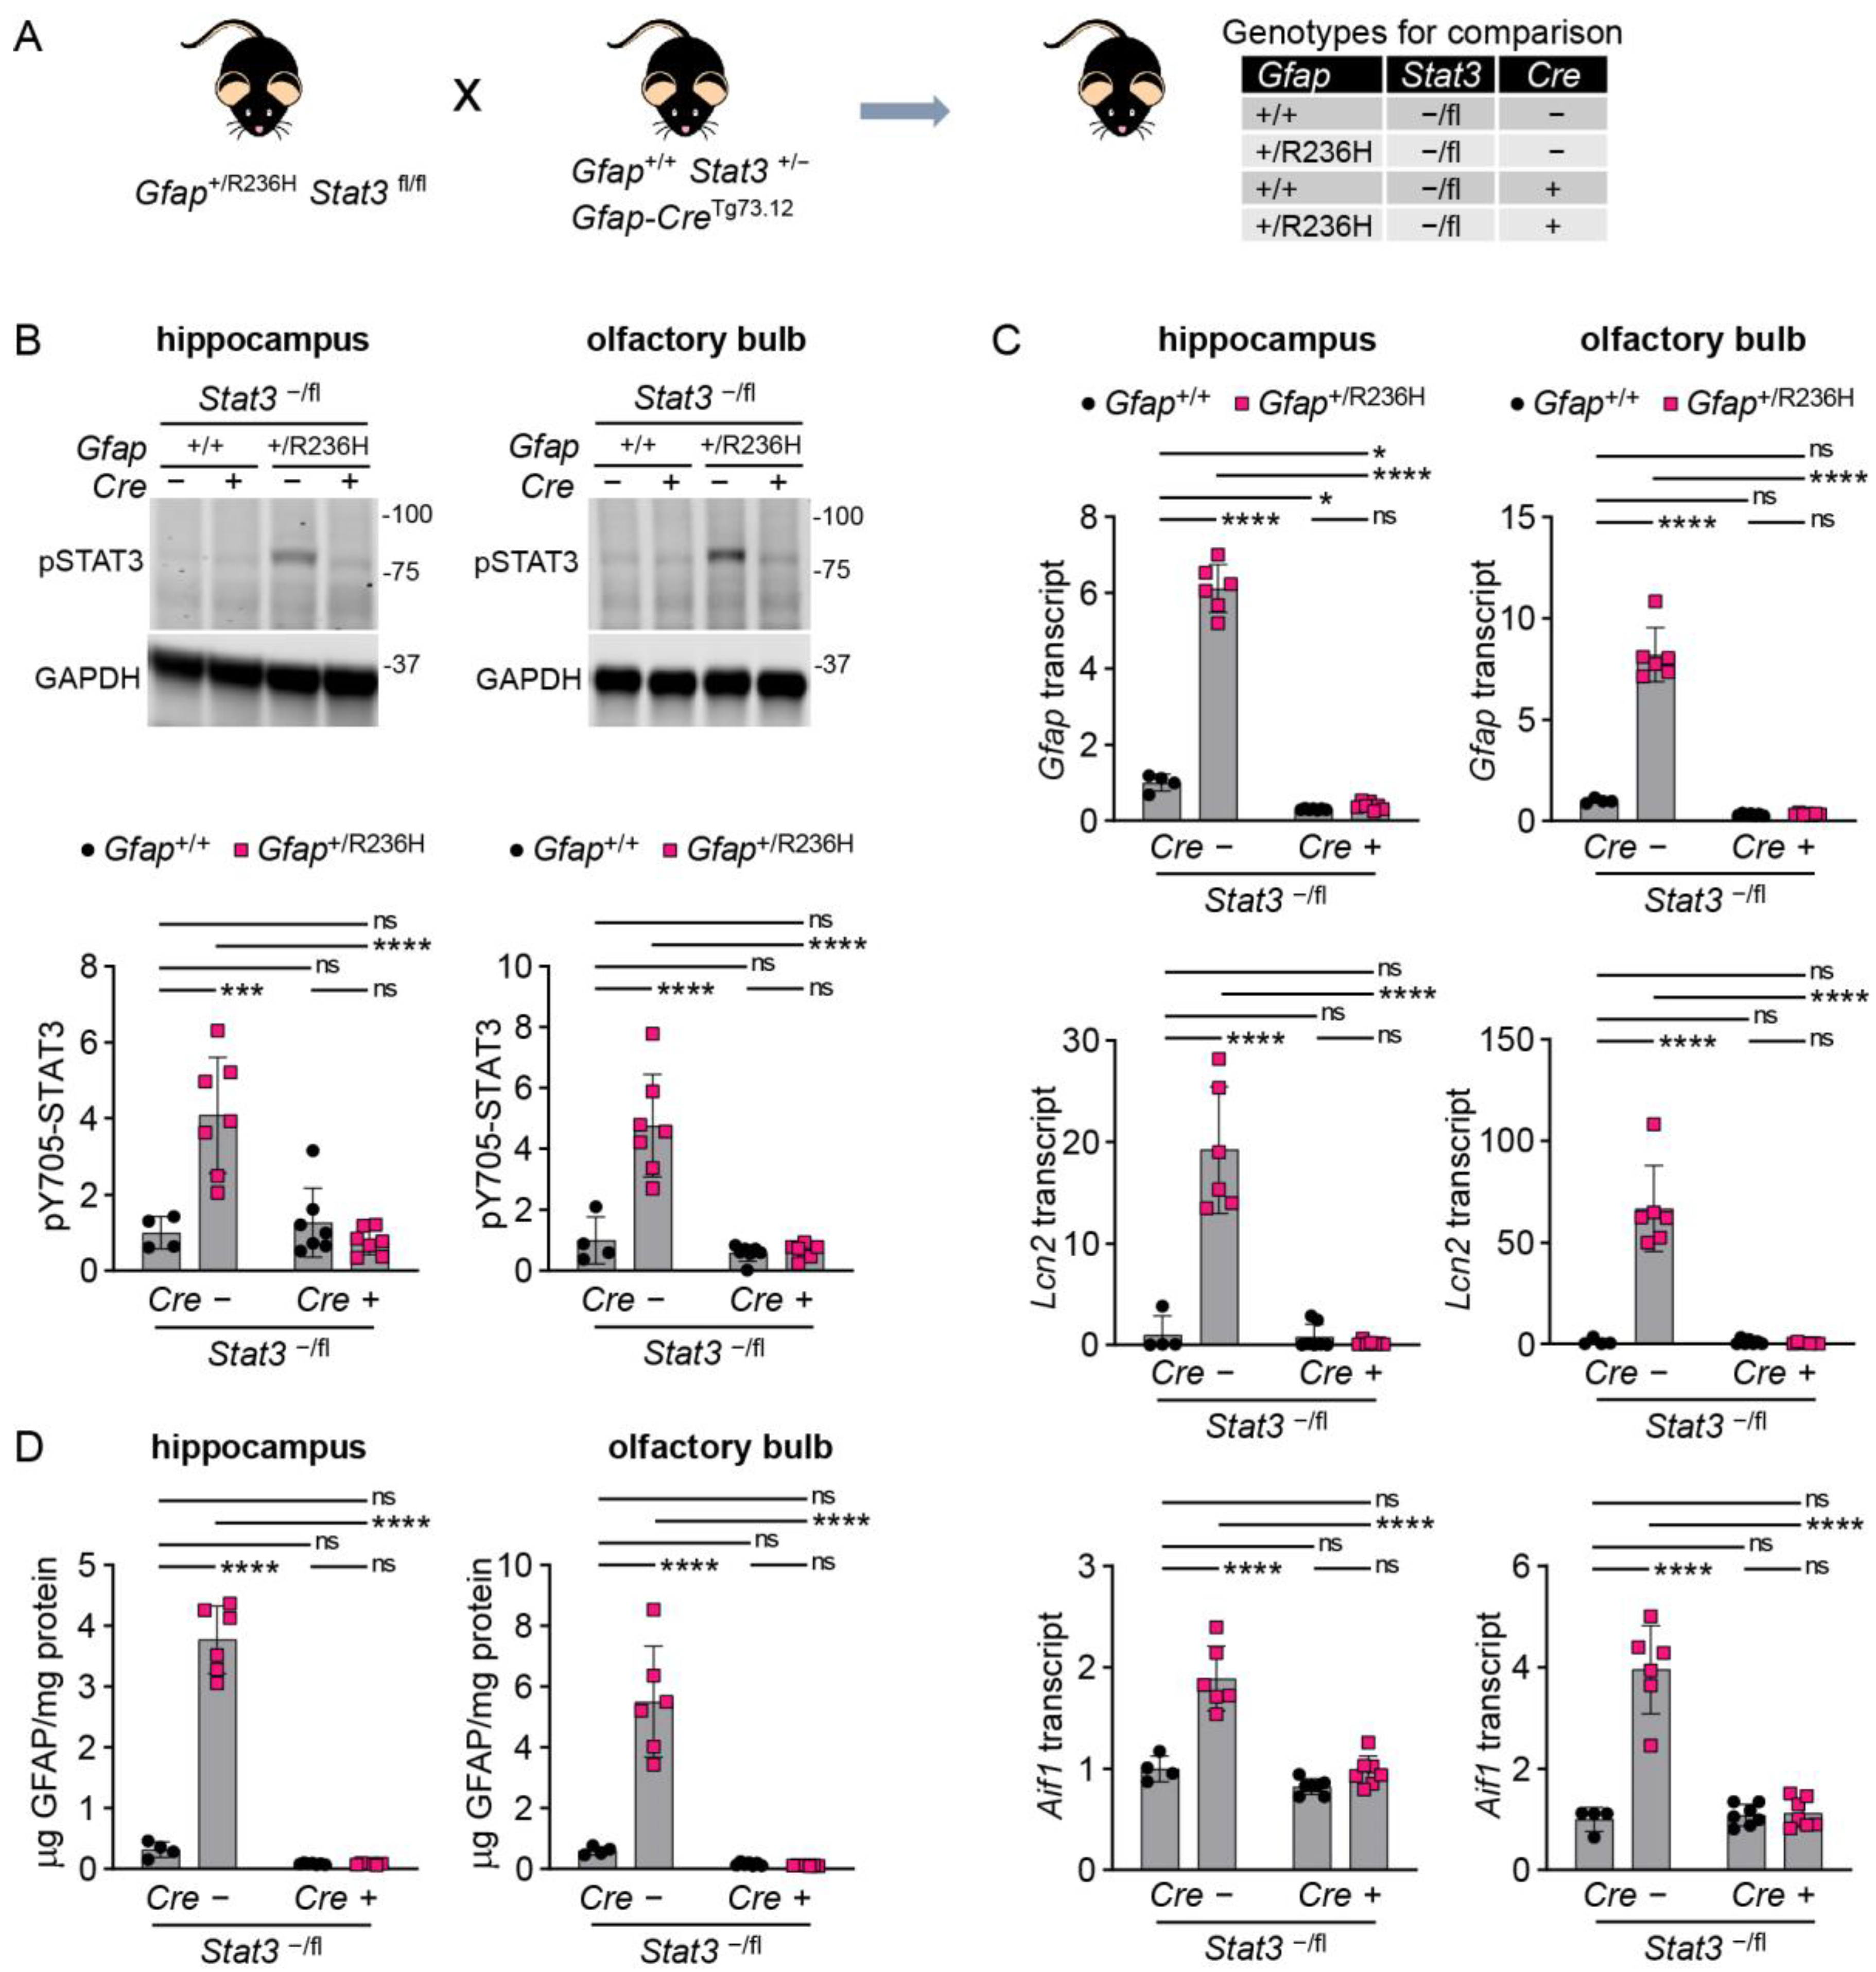
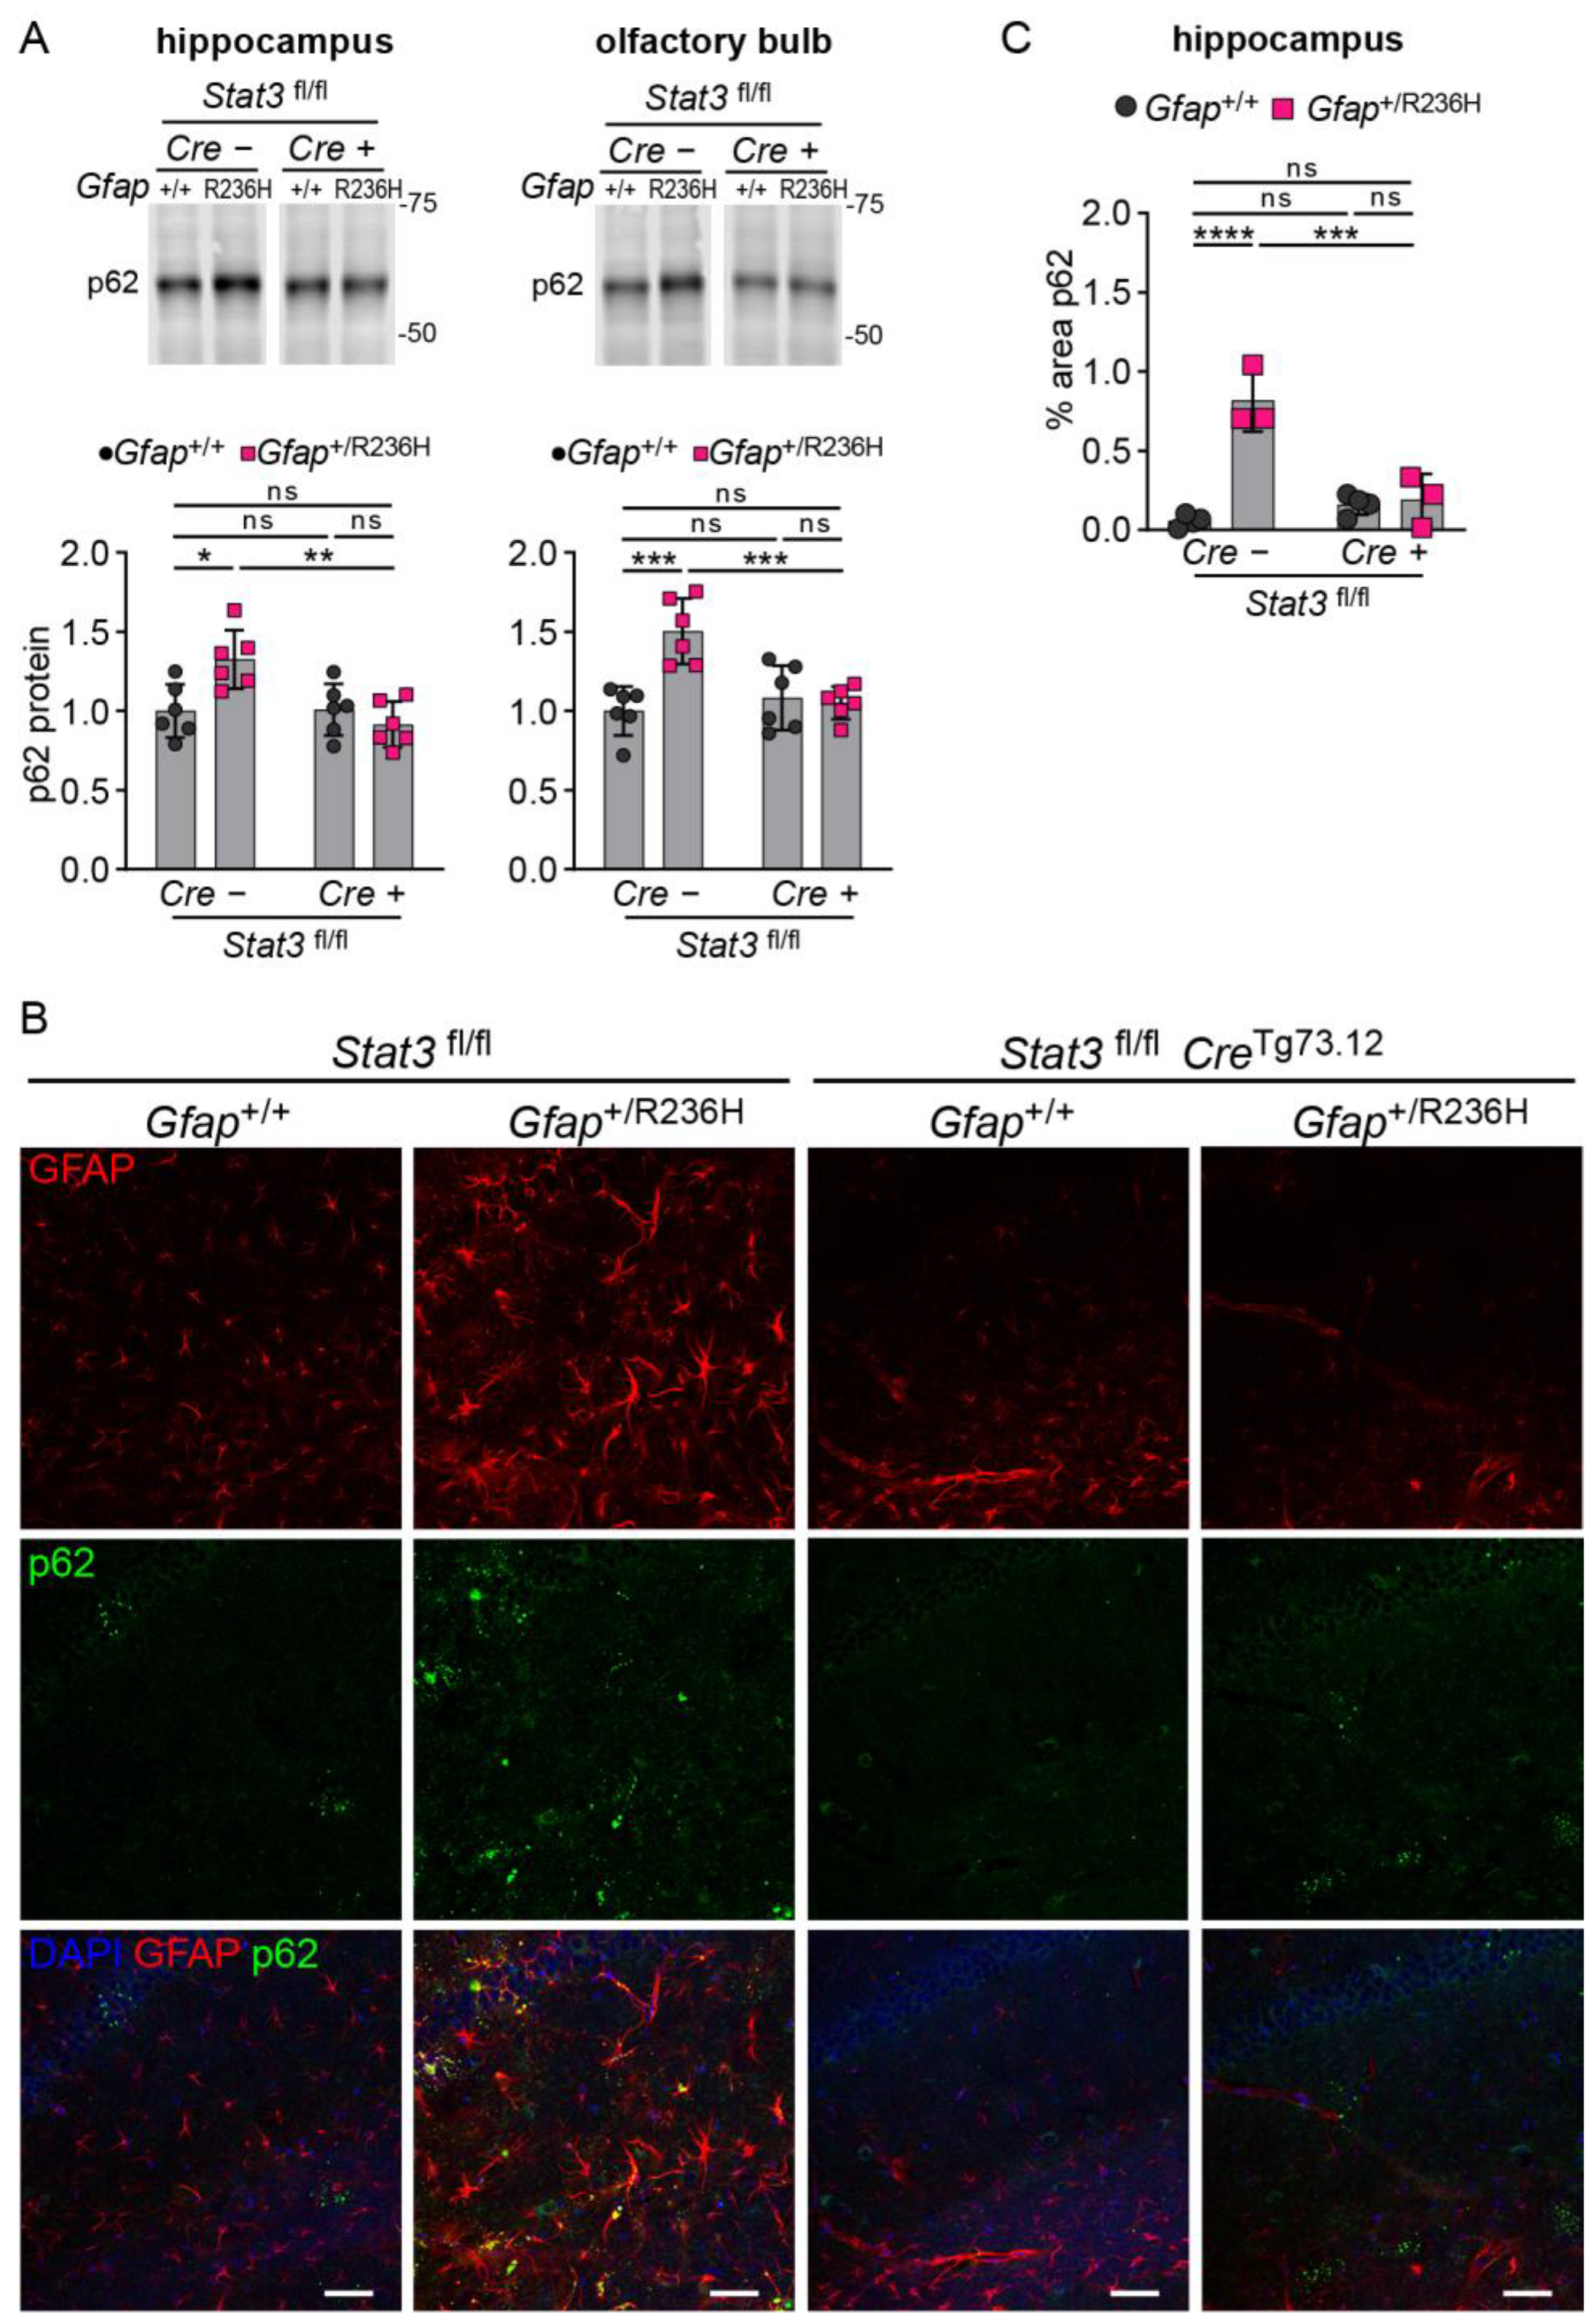
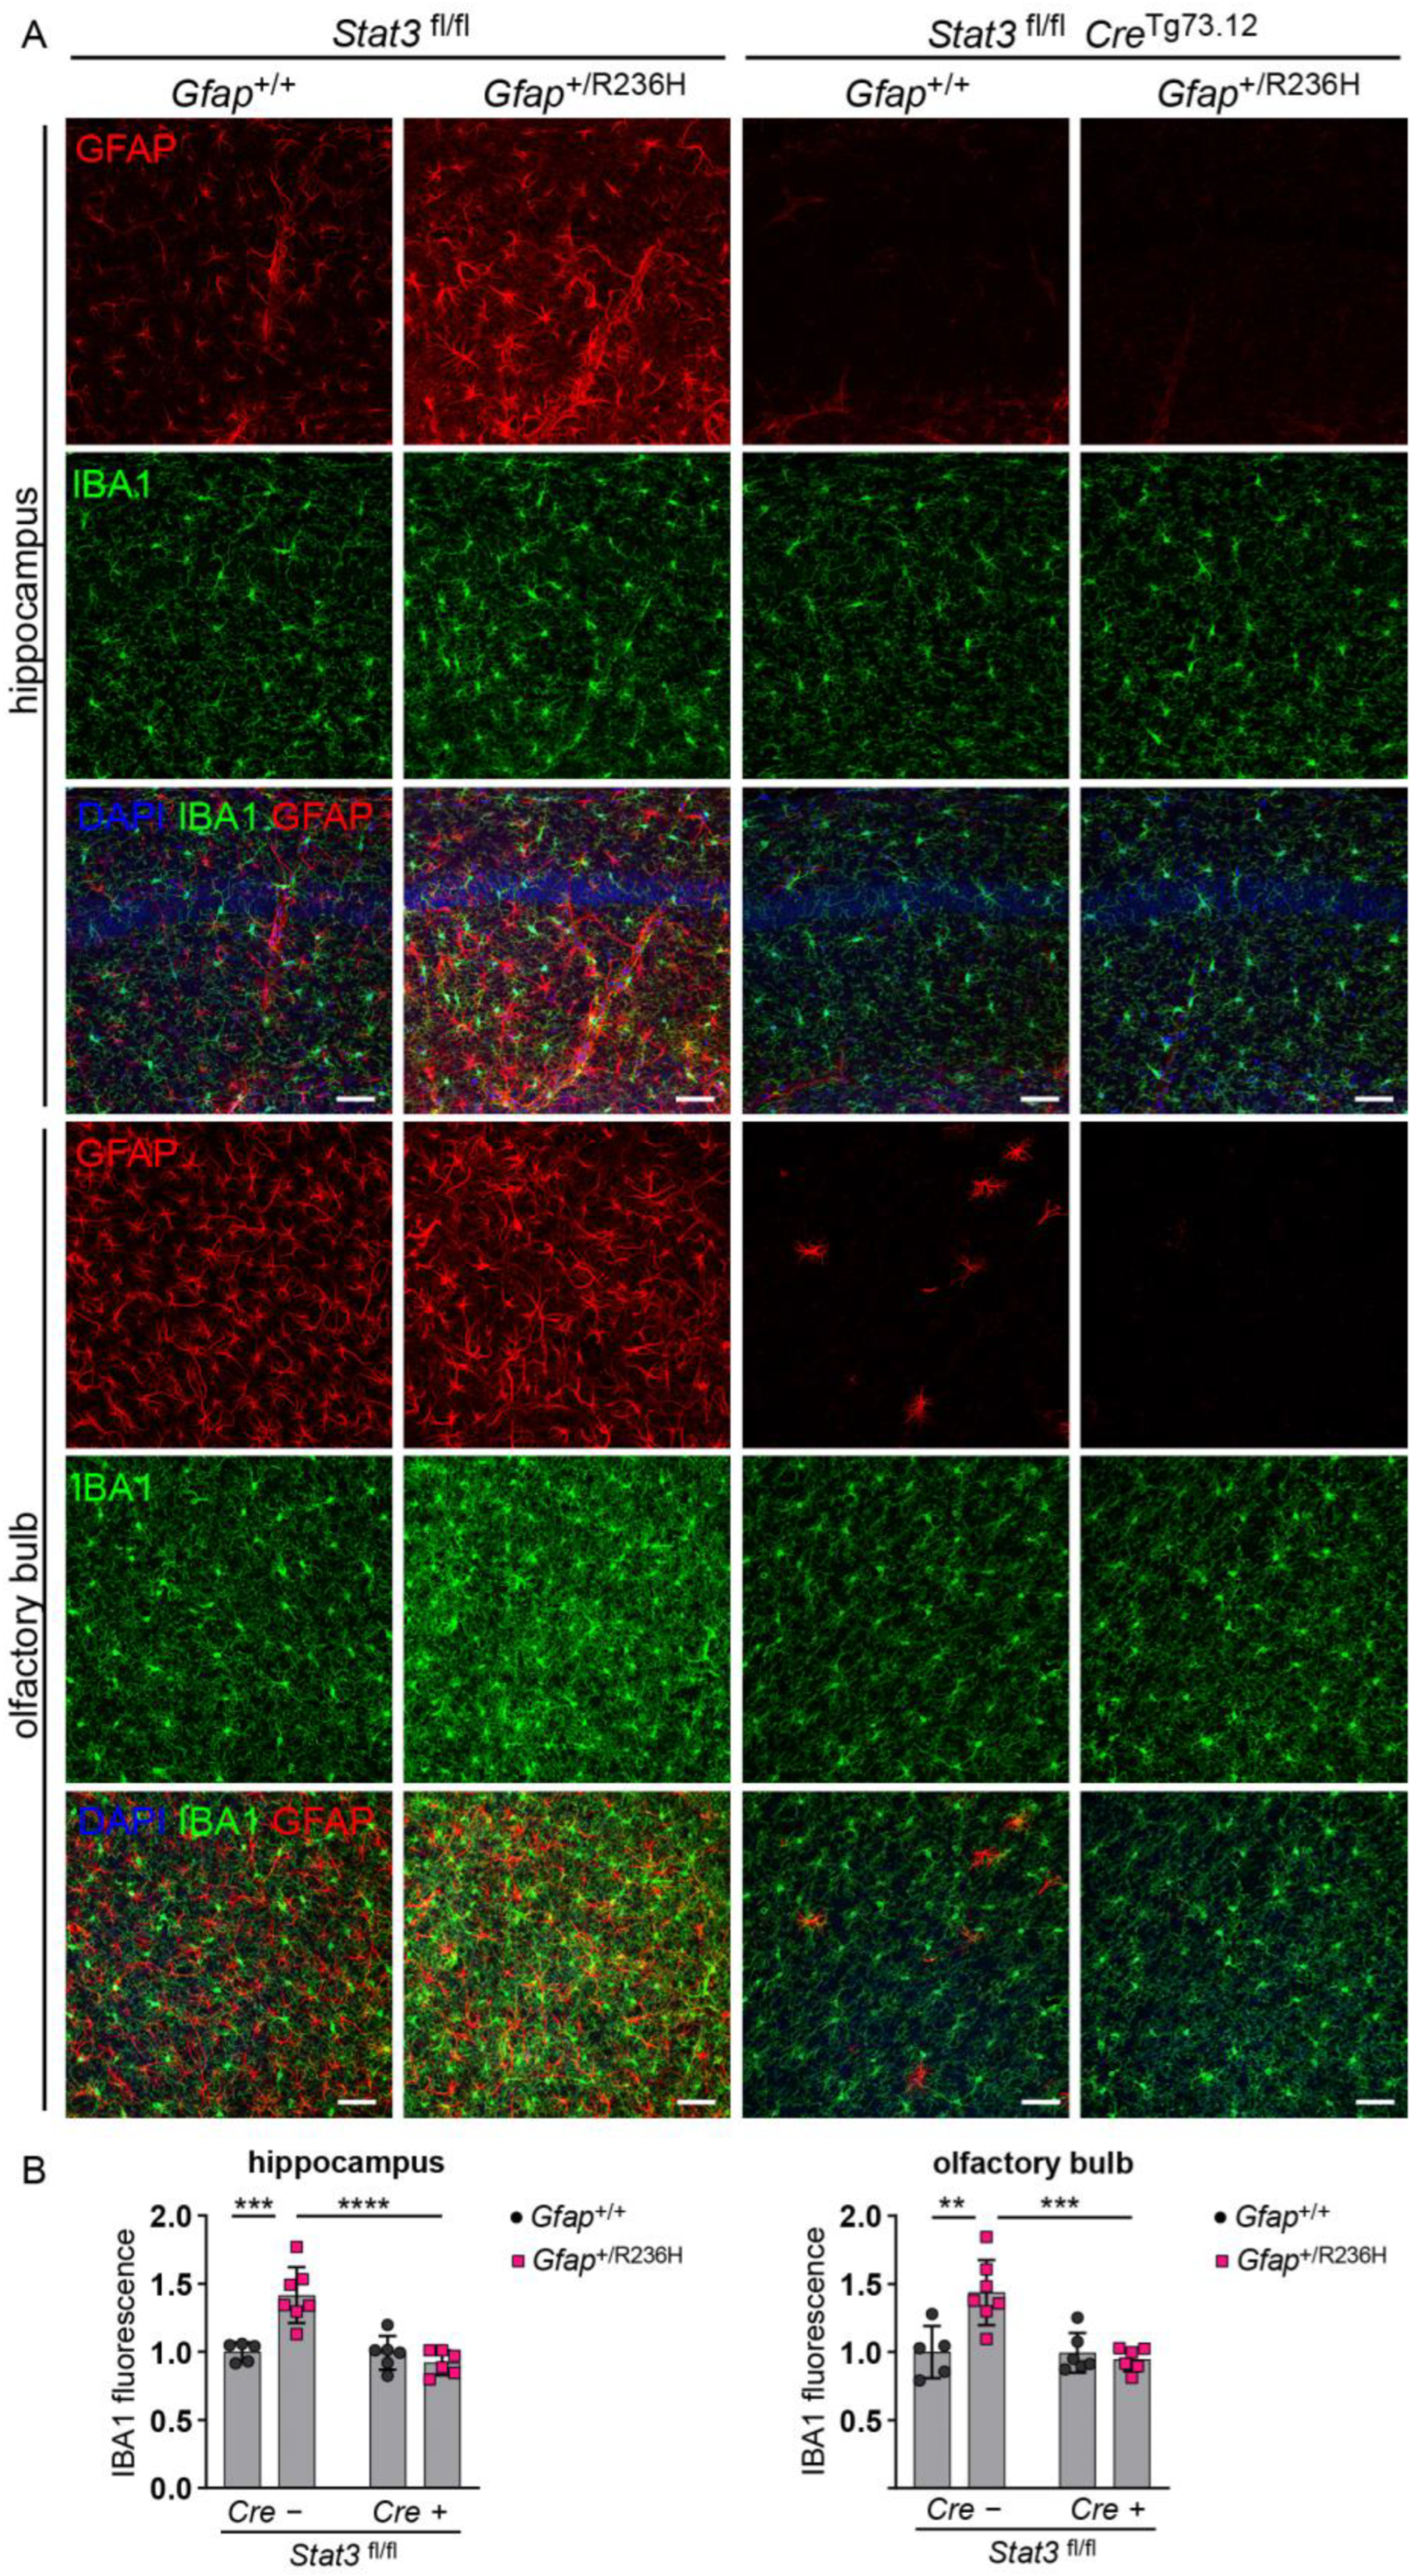
3.3. Conditional Knockout of STAT3 in Gfap Expressing Cells Prevents GFAP Elevation and Stress Response in AxD Model Mice

To specifically assess the role of STAT3 in Gfap expressing cells, we next used a transgenic line (Tg73.12) expressing Cre recombinase under the control of the mouse Gfap promoter [23], in combination with the floxed (fl) Stat3 mice. The genes for GFAP and STAT3 are located within a 2 megabase interval on mouse chromosome 11. However, we were successful in combining the floxed Stat3 allele with the R236H Gfap mutation, which required a homologous recombination event to generate a Gfap+/R236H; Stat3fl/fl line. To facilitate complete STAT3 knockout in astrocytes, the Gfap-Cre-Tg73.12 line was crossed with heterozygous Stat3+/− knockout mice to produce Tg73.12; Stat3+/− mice. This line was crossed with the Gfap+/R236H; Stat3fl/fl line, and animals carrying both knockout and floxed Stat3 alleles (-/fl) were analyzed (Figure 3A, all mice congenic in C57BL/6J). At 8 weeks of age Gfap+/R236H; Stat3−/fl mice negative for the Tg73.12 Cre transgene showed the typical increase in pSTAT3 activation, while those that were positive for Cre demonstrated pSTAT3 levels similar to mice with wild-type Gfap in both hippocampus and olfactory bulb (Figure 3B). Analysis of Gfap mRNA in the same mice demonstrated that conditional Stat3 knockout in astrocytes reduced transcription to levels at or below the amount observed in Gfap+/+ mice (Figure 3C). Quantification of Lcn2 (lipocalin 2) and Aif1 (Iba1) as markers of reactive astrocytes and microglia, respectively, also showed normalization in Gfap+/R236H mice with Stat3 knockout (Figure 3C). Finally, GFAP protein measures showed reduction with Stat3 knockout in Gfap+/R236H mice (Figure 3D), suggesting that protein accumulation is tied to elevated expression.
To assess whether GFAP mutation might eventually cause protein accumulation with age, we performed similar experiments in older mice (12 weeks and 6 months), when pathology was increased in the model. For these experiments, we used mice carrying the floxed Stat3 gene on both alleles (fl/fl) for a more exact comparison between full STAT3 expression and the targeted knockout condition (Figure 4A). At 12 weeks of age, we observed a reduction in phosphorylated STAT3 similar to that observed above at 8 weeks, and total STAT3 expression, which was also elevated in Gfap+/R236H mice, was normalized by blocking STAT3 activation (Figure 4B). GFAP protein was reduced by STAT3 inactivation in all brain regions analyzed and spinal cord (Figure 4C), with no significant difference between Cre positive Gfap+/R236H and Gfap+/+ mice. Complete knockout of Stat3 resulted in GFAP levels at or below those measured in wild-type animals.
To assess disrupted proteostasis and protein aggregation, we analyzed the autophagy cargo protein p62/SQSTM1 (sequestosome), which facilitates degradation of ubiquitinated proteins and colocalizes with Rosenthal fibers [29,30], and found that blocking STAT3 activation reduced p62 accumulation in Gfap+/R236H mice as shown by western analysis in Figure 5A. These results were confirmed by immunofluorescence in animals at 6 months of age, which exhibited no GFAP aggregation or p62 accumulation when STAT3 phosphorylation was prevented in astrocytes (Figure 5B,C). Finally, Iba1 immunolabeling showed reduced microglial expression, indicating the prevention of neuroinflammation (Figure 6).

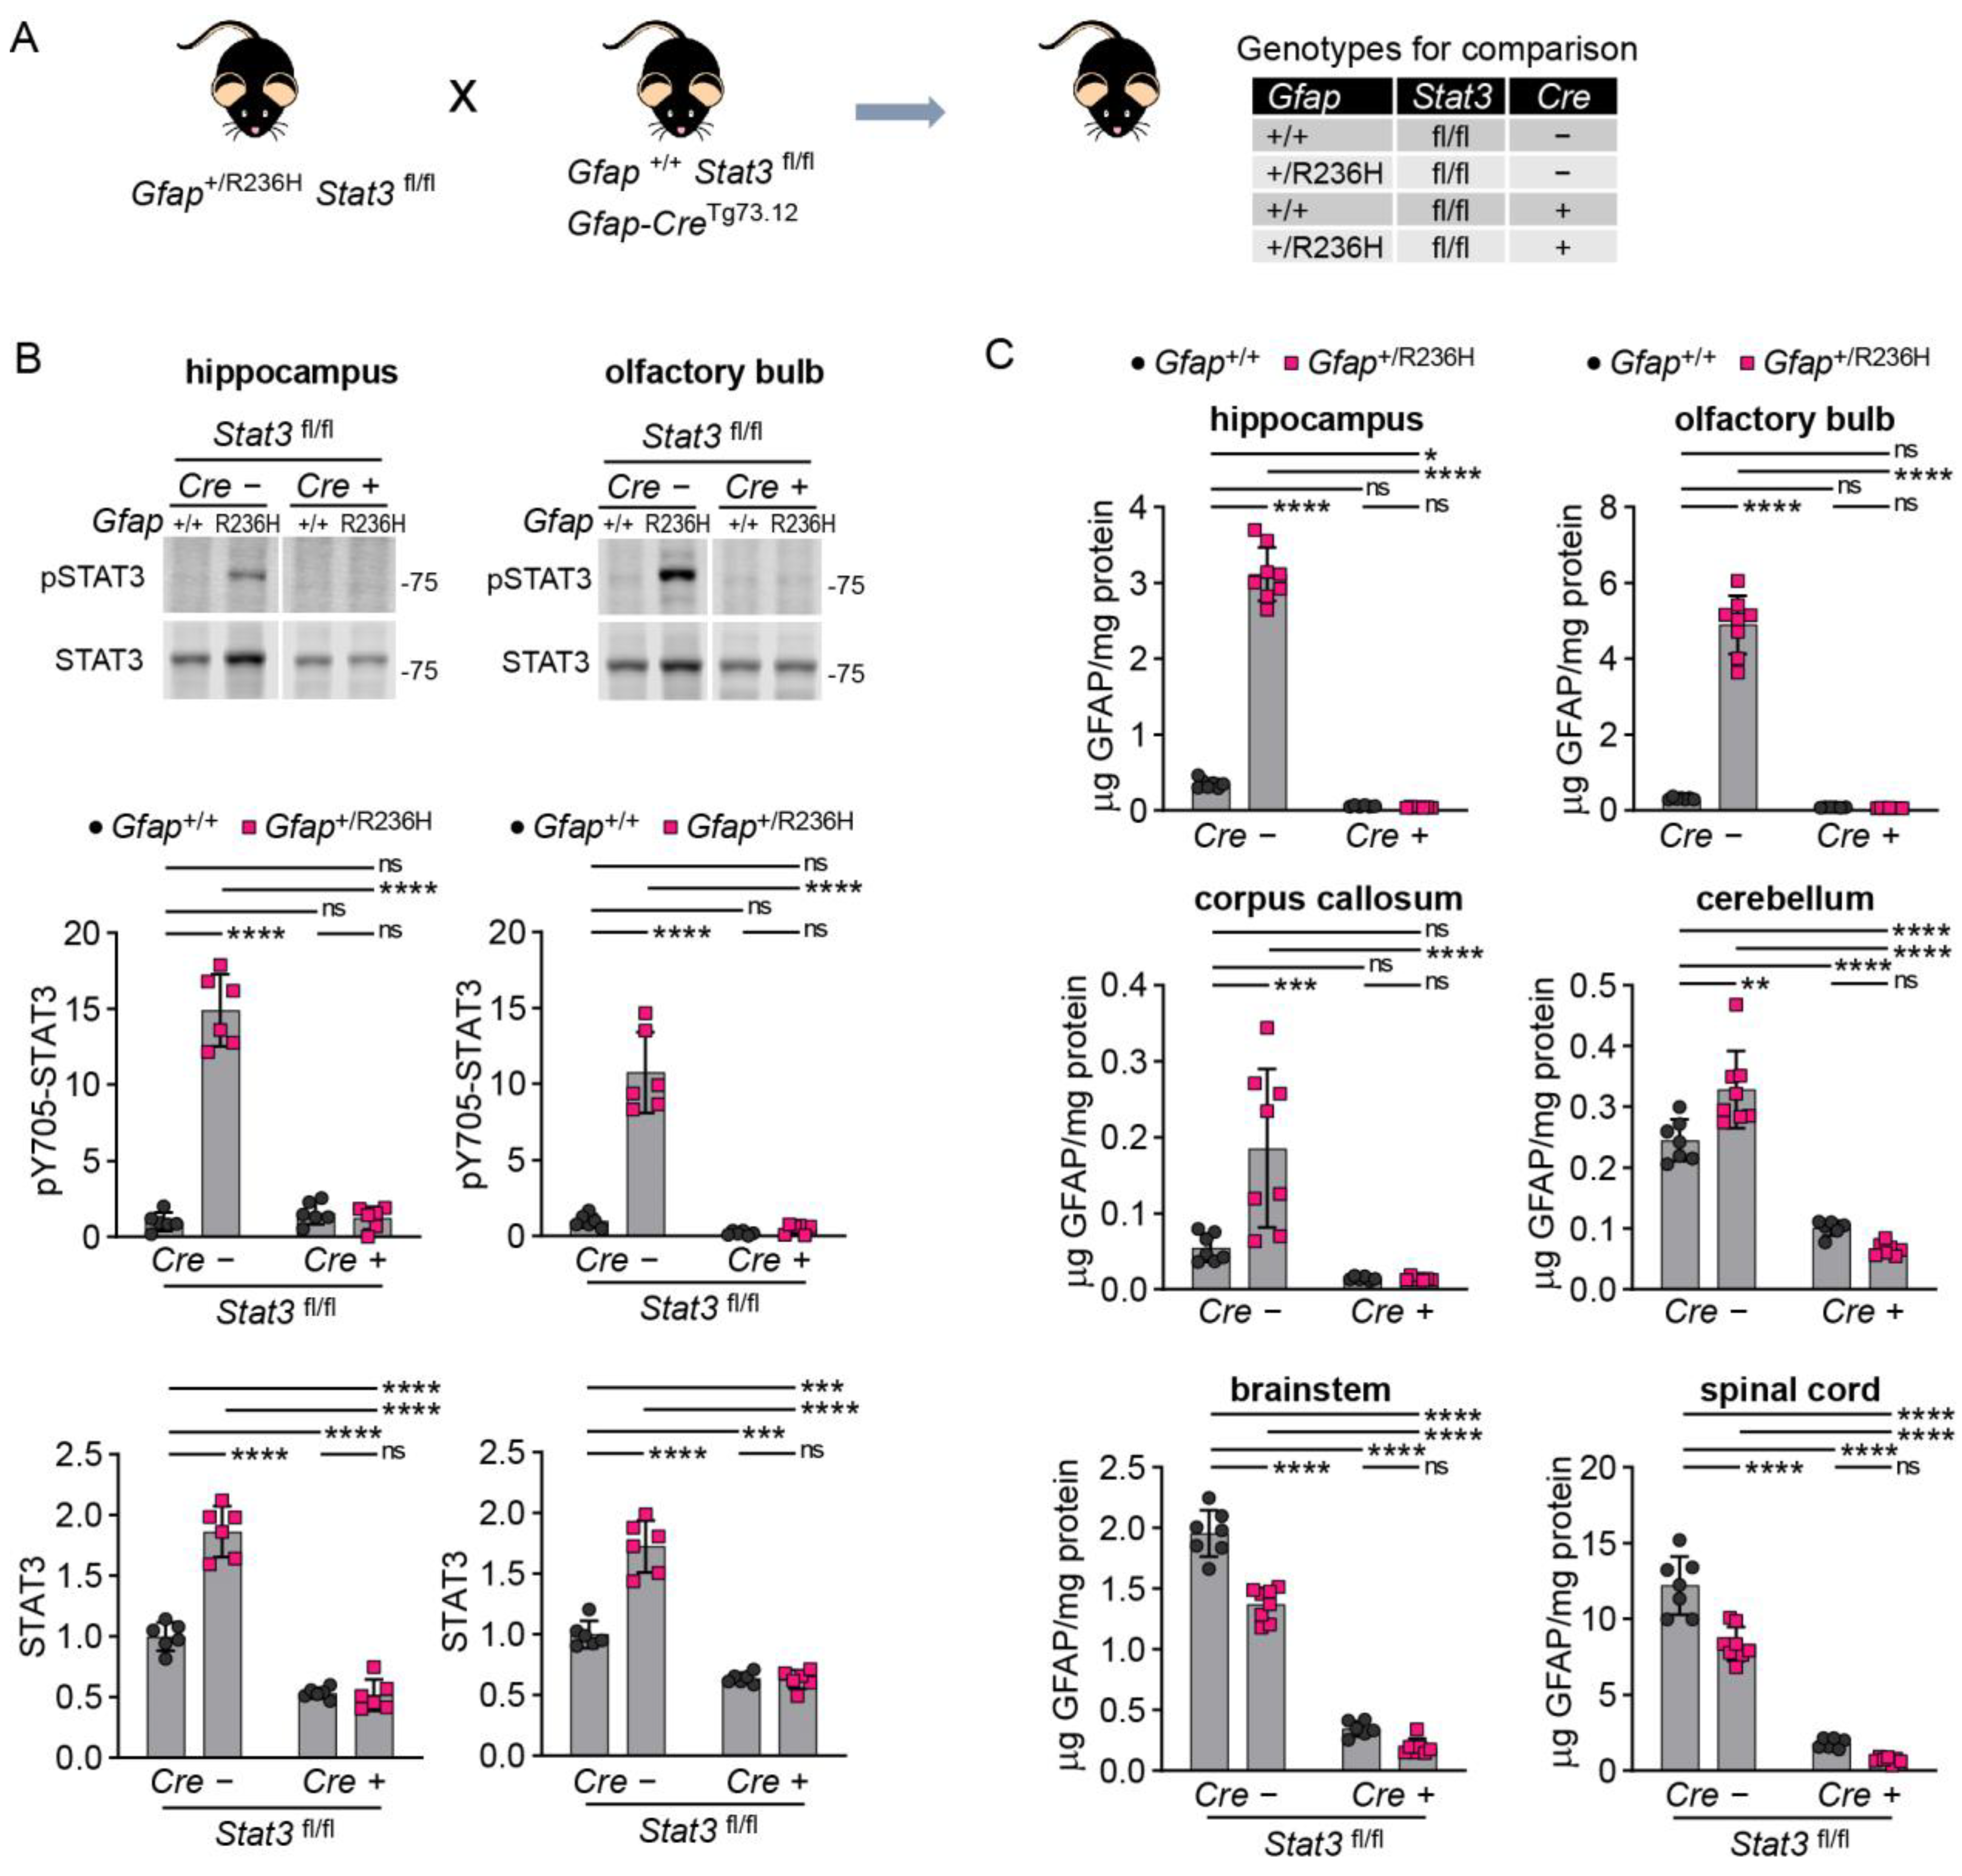
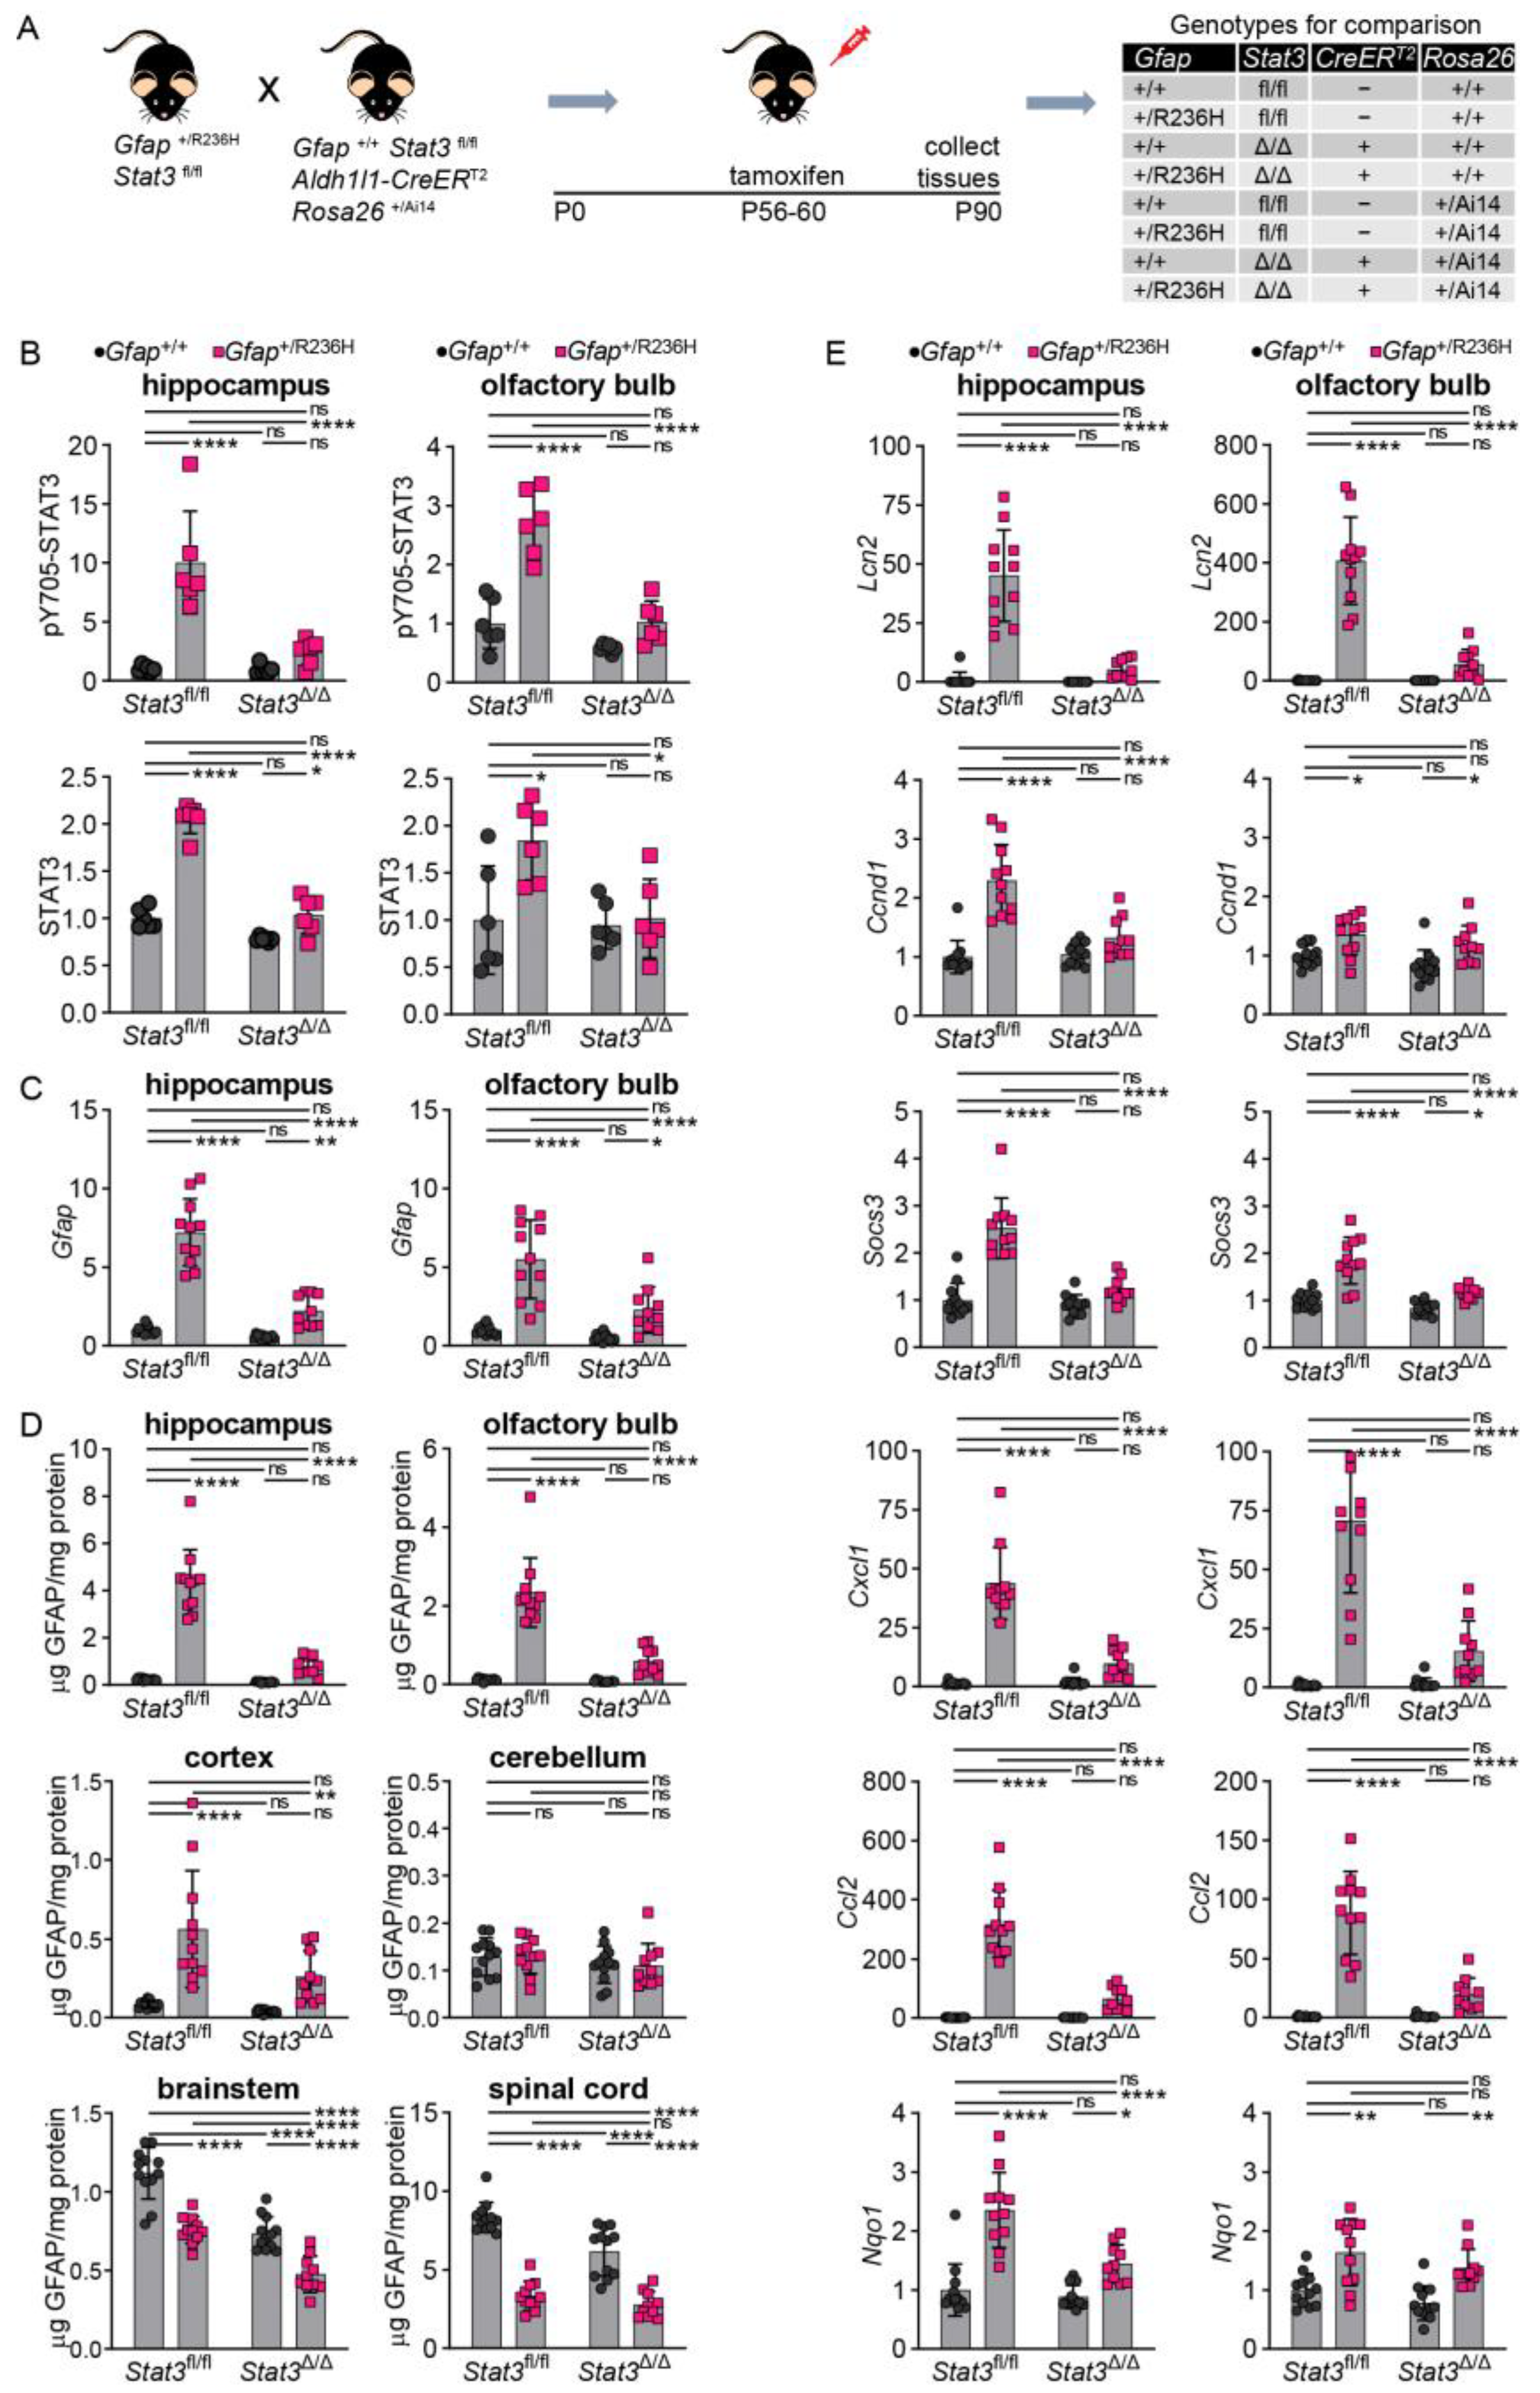
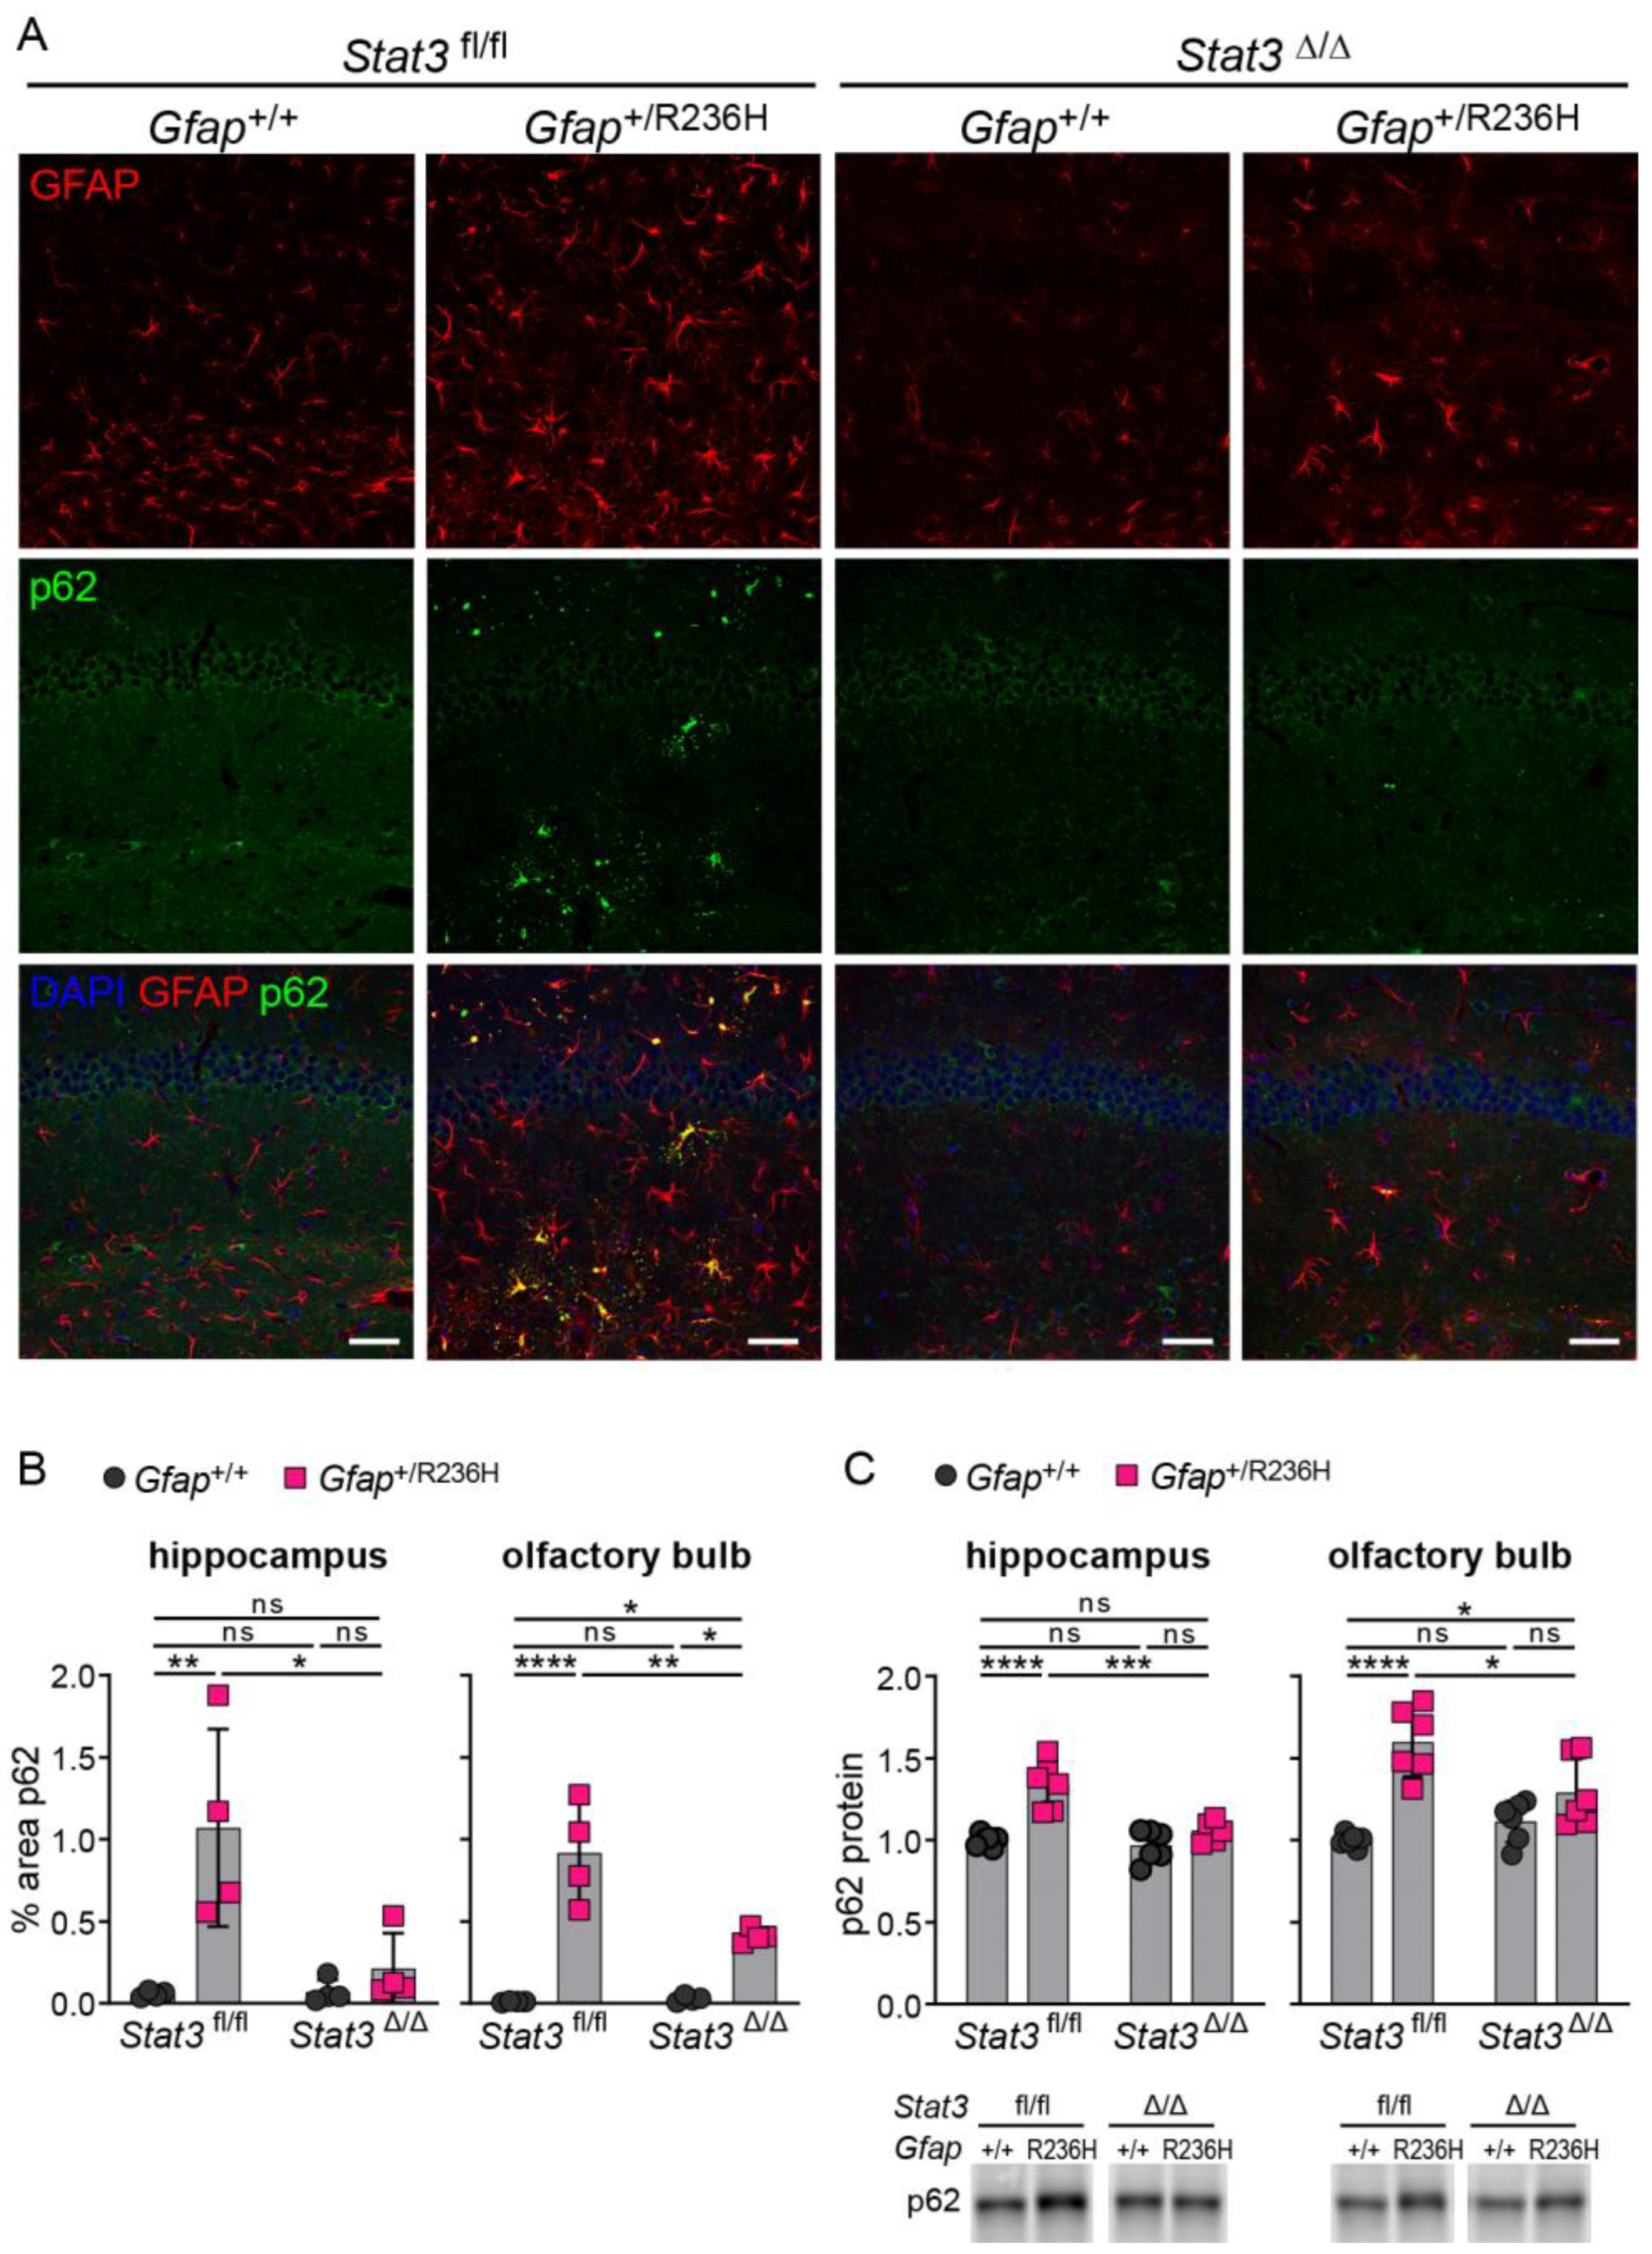
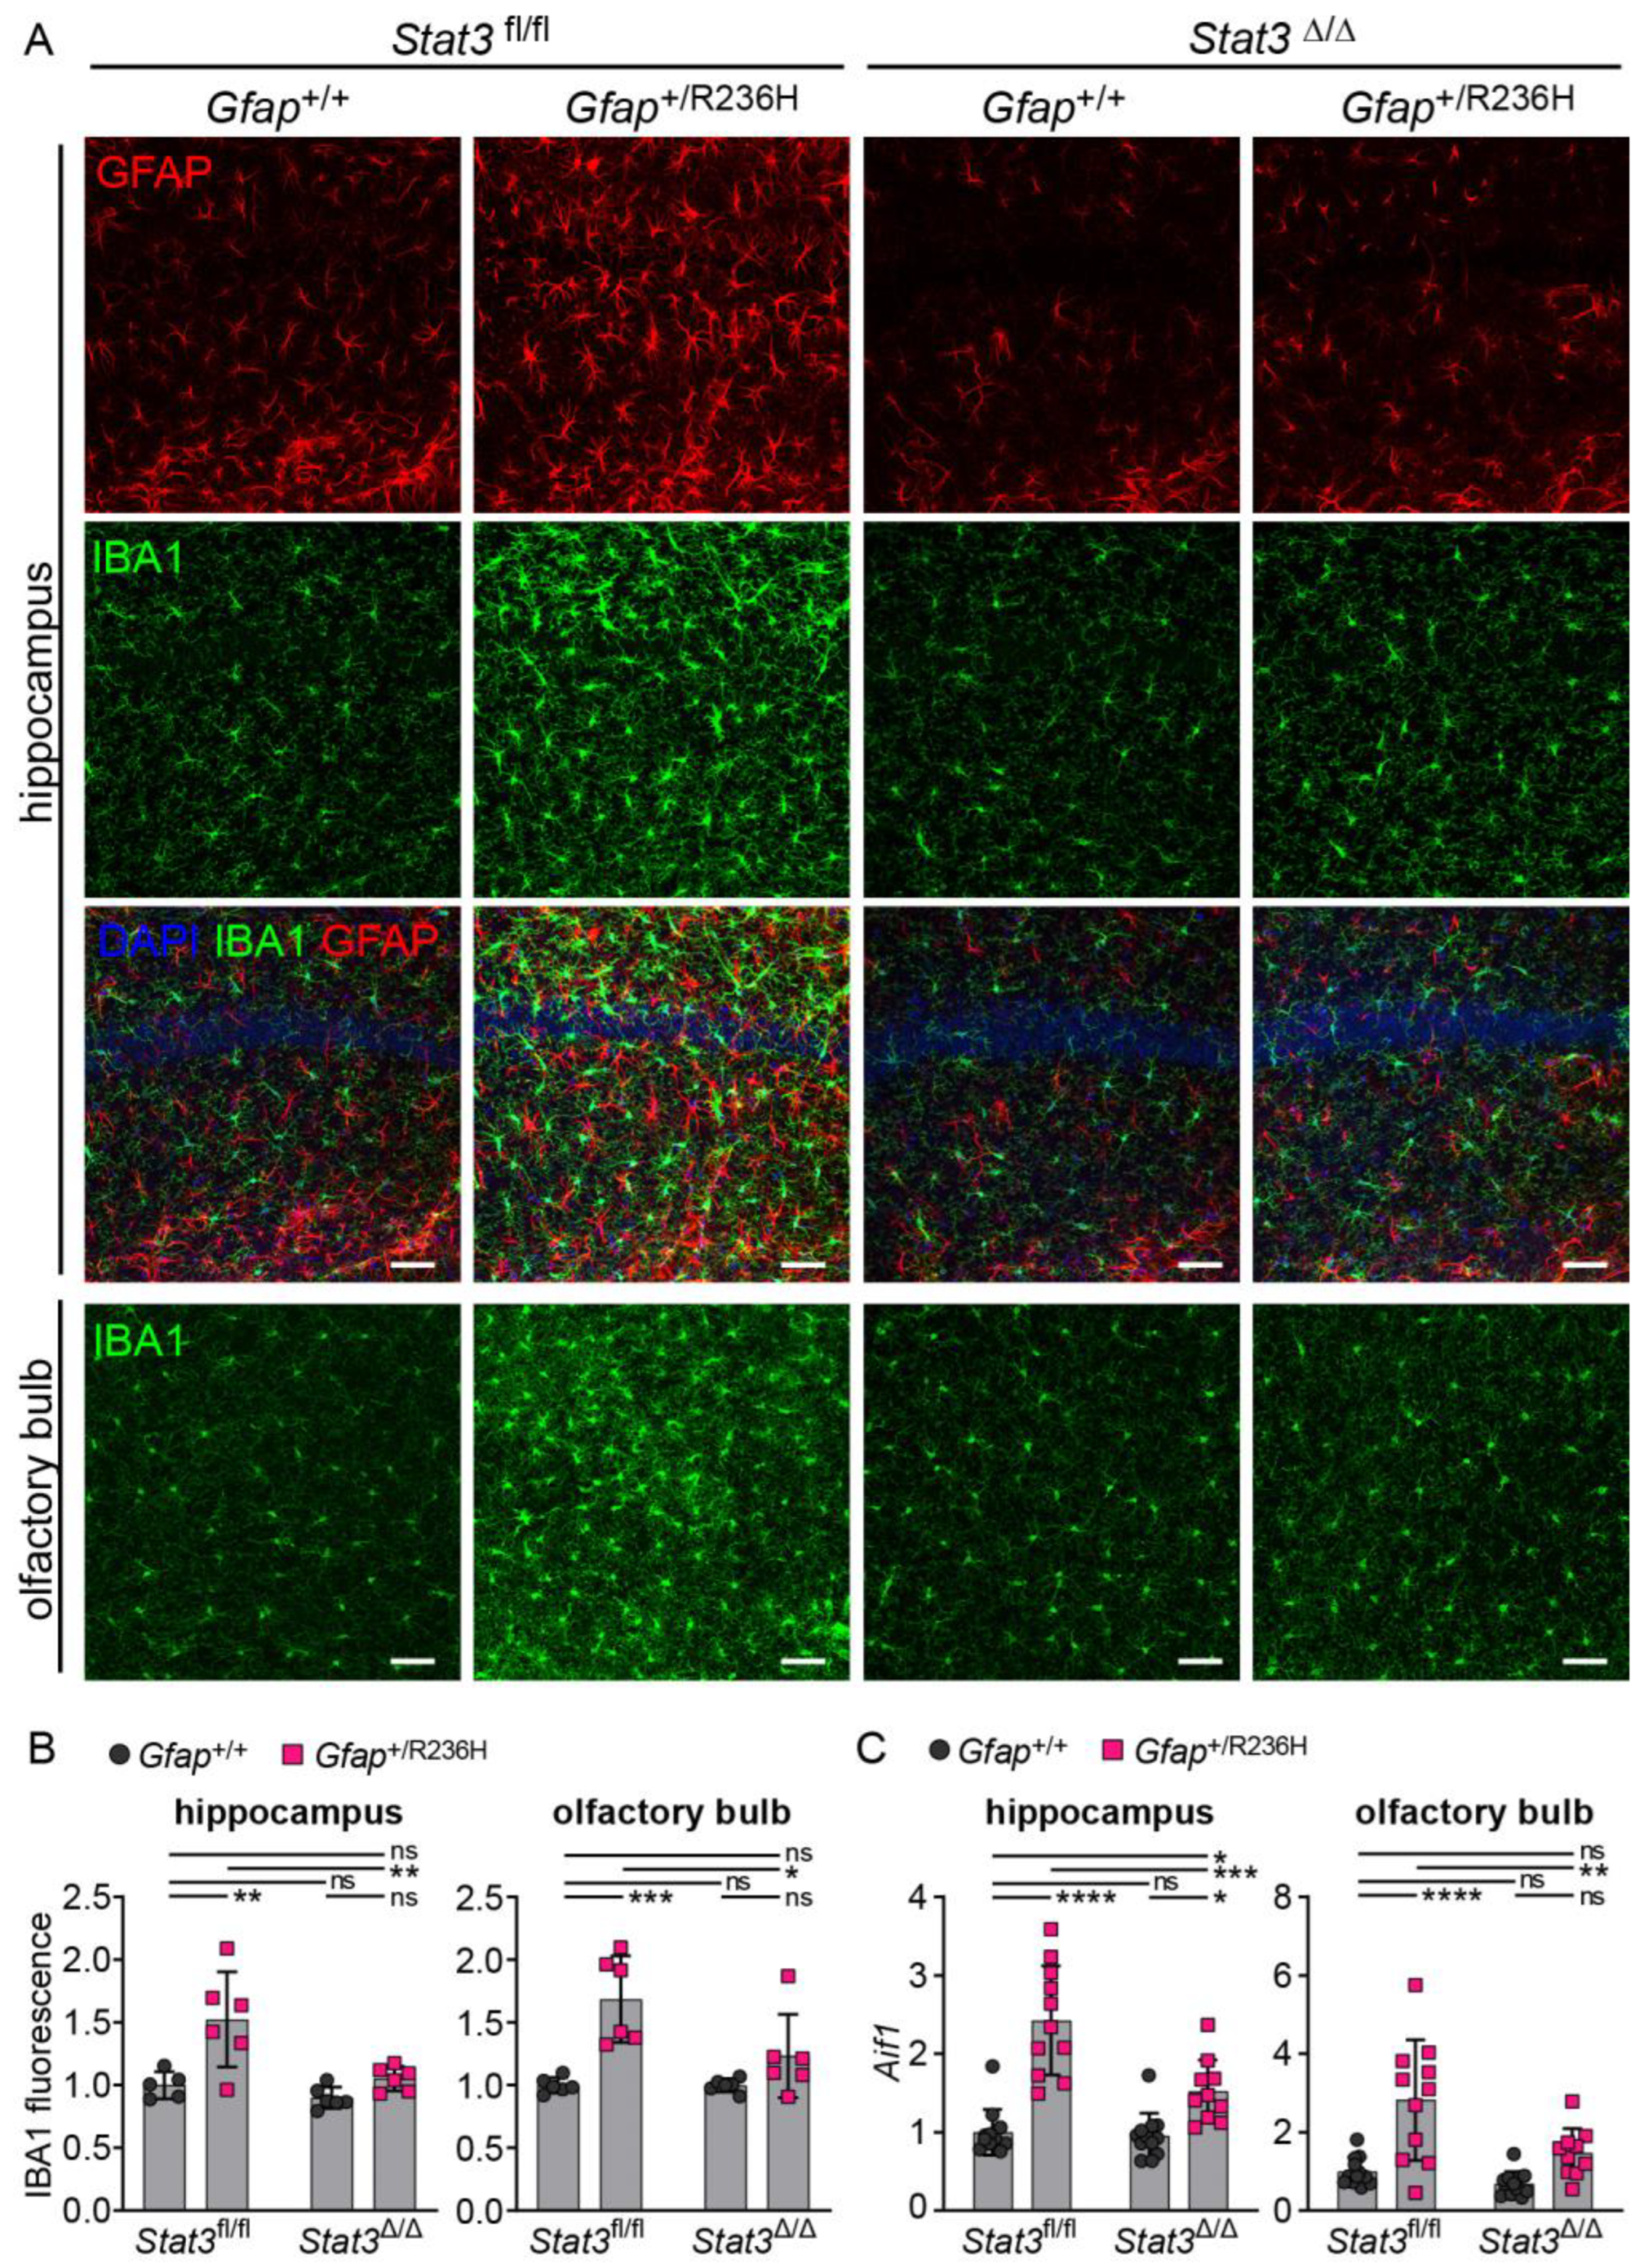
3.4. Inducible STAT3 Knockout in Adult AxD Mouse Model Astrocytes Reverses GFAP Pathology and Normalizes Reactive Astrocytes and Microglia

To investigate whether genetic manipulation of STAT3 phosphorylation can affect GFAP accumulation in adult AxD model mice with established pathology [5,6], we took advantage of a tamoxifen-inducible astrocyte-specific CreERT2 line using the Aldh1l1 promoter [24]. We first crossed the Aldh1l1-CreERT2 line to the Cre-reporter line Ai14 [25] and subsequently bred those mice with the Stat3fl/fl line. Gfap+/R236H; Stat3fl/fl mice were then crossed to the CreERT2; Ai14; Stat3fl/fl line. Gfap+/R236H and Gfap+/+ animals that were either positive or negative for Cre were treated with tamoxifen for 5 days at 2 months of age, and tissues collected at 3 months of age (Figure 7A).
An initial assessment of efficacy for tamoxifen induction of Cre recombination in astrocytes using the Ai14 tdTomato reporter showed that 83% of GFAP positive astrocytes in hippocampus and 87% in olfactory bulb were also positive for tdTomato (364+/436 and 748+/858 astrocytes, respectively). We determined whether STAT3 was activated and found that Gfap+/R236H; Stat3fl/fl mice (without Cre) showed the same increase in pSTAT3, whereas mice expressing Cre (Stat3Δ/Δ) demonstrated pSTAT3 levels similar to those of Gfap+/+ mice in both hippocampus and olfactory bulb (Figure 7B). Total STAT3 protein showed similar changes, although not as pronounced.
We next examined whether blocking STAT3 activation in adult AxD model mice could reverse GFAP accumulation. Transcript analysis demonstrated a significant reduction in Gfap expression in hippocampus and olfactory bulb (Figure 7C). Analysis of GFAP protein showed reductions in all brain regions examined except for cerebellum (Figure 7D). Spinal cord, which had decreased amounts of GFAP in Gfap+/R236H mice, also showed no further reduction in protein. Lcn2 transcript was measured as a surrogate marker of astrogliosis, and expression was normalized with STAT3 inactivation (Figure 7E). Other transcripts regulated by STAT3, including Socs3 and Ccnd1, were also decreased in hippocampus, and Socs3 was reduced in olfactory bulb. Transcripts for small chemokines Cxcl1 and Ccl2 were reduced, suggesting a normalization of the neuroinflammatory response, and Nqo1 (NAD(P)H quinone oxidoreductase), a target of the Nrf2/ARE antioxidant stress response pathway, was reduced in hippocampus but not olfactory bulb (Figure 7E).
To determine whether reduced GFAP expression led to reduced aggregation and improved proteostasis, we immunolabeled p62 positive aggregates as a measure of Rosenthal fibers and found that protein aggregation was reversed in Gfap+/R236H mice by blocking STAT3 activation (Figure 8A,B). Quantification of p62 by western analysis showed a similar reduction in hippocampus and olfactory bulb (Figure 8C).
Finally, to assess the effects of STAT3 inhibition in astrocytes on neuroinflammation in general, we examined microglia activation by labeling with Iba1 and found that microglia appeared to return to a normal state with reduced Iba1 expression (Figure 9A,B). Transcript analysis of the gene for Iba1 (Aif1) also showed a reduction in hippocampus and olfactory bulb after blocking STAT3 activation in Gfap+/R236H mice (Figure 9C).

4. Discussion

GFAP expression and accumulation have been shown to correlate with AxD severity [8], and STAT3 is known to regulate GFAP transcription in development and in response to injury [14]. In mouse models of AxD, regions of the CNS with the greatest increase in GFAP expression also demonstrate significant STAT3 phosphorylation. In addition, we showed that STAT3 was activated in gray matter astrocytes in a patient with the disease. Here, we investigated whether blocking STAT3 phosphorylation could be used to manipulate Gfap expression and prevent or reverse protein accumulation in Gfap+R236H mice. Initial experiments with heterozygous Stat3+/− knockout mice achieved significant reduction in phosphorylated STAT3-Y705, but these differences were not sufficient to consistently reduce Gfap expression. In addition to STAT3, several other transcription factors and their binding sites in the GFAP promoter have been tested for their influence on basal expression and the injury response [14]. AP-1 in particular has been suggested to regulate Gfap elevation in different injury models [31], including a transgenic mouse model of AxD that overexpresses wild-type human GFAP [7], but whether AP-1 or other factors contribute to Gfap elevation in Gfap+R236H mice has not yet been tested.
To further investigate the role of STAT3 in reactive AxD astrocytes, we used a conditional knockout approach to target Stat3 in Gfap expressing cells and found that Stat3 knockout reduced GFAP levels and prevented the reactive astrocyte response, similarly to other studies in acute injury models [12,15] and models of neurodegeneration [16,32]. STAT3 is an essential regulator of astrocyte differentiation and maturation, and by prohibiting STAT3 activation during astrocyte development, GFAP transcript and protein were reduced even in Gfap+/+ mice. AxD severity is tied to GFAP expression, and in these experiments, further transactivation of the Gfap promoter was prevented. Reduced GFAP suggests that mutant protein does not reach a toxic threshold and that astrocytes are able to maintain proteostasis and avoid a reactive stress response.
GFAP is also expressed in progenitor cells, and early activation of the Gfap-promoter-driven Cre transgene (Tg73.12) as described above leads to excision of floxed genes in both astrocytes and other differentiated cell types, including neurons [23]. To specifically evaluate the role of STAT3 activation in reactive astrocytes with existing GFAP accumulation and protein aggregation [5,6], we used an inducible CreERT2 line controlled by the Aldh1l1 promoter [24]. Knocking down STAT3 in adult mice with established GFAP pathology reduced Gfap expression and the concomitant stress and neuroinflammatory response and reversed GFAP accumulation and aggregation. We cannot exclude the formal possibility that Cre itself has an effect independent of STAT3 [33]; however, we consider this unlikely given the lack of change in markers for astro- and microgliosis (e.g., Lcn2, Aif1) in the presence of Cre in Gfap+/+ mice (Figure 3C, Figure 7E and Figure 9C). These results demonstrate that STAT3 is a key factor in Gfap elevation and GFAP accumulation, and that blocking STAT3 activation may provide a therapeutic target for AxD.
STAT3 activation is not necessarily detrimental, and as has been shown in other models of CNS injury or neurodegenerative disease, the consequences are context-dependent [34,35,36,37,38,39,40]. In Huntington’s disease, for example, activation of JAK/STAT3 signaling improves proteostasis by increasing gene expression in proteasome and lysosomal pathways [39]. However, given the role of STAT3 in Gfap transactivation, inhibiting STAT3 in AxD would have the direct benefit of reducing levels of mutant GFAP and preventing protein misfolding and the resulting cellular toxicity. More extensive analyses of AxD tissues and controls will be needed to firmly establish the role of STAT3 in the human disorder.
Although we do not know the initiating events leading to STAT3 activation, our results support our hypothesis that activation of STAT3 contributes to a positive feedback loop that drives increased GFAP expression, protein accumulation, and ultimately astrocyte dysfunction. GFAP is one of the most highly expressed proteins in astrocytes, and a misfolded mutant form could disrupt a myriad of cellular processes, including vesicular transport and mitochondrial function, which could lead to oxidative stress and activation of MAP kinase pathways. Activation of JNK and p38 has been demonstrated in cellular models of AxD [41,42], and MAP kinases could activate AP-1 and NFκB, leading to increased IL-6 to activate the IL-6/JAK/STAT3 pathway.
In this study, we took advantage of the wealth of available genetic tools to manipulate STAT3 activation in our mouse models of AxD. Gfap+R236H mice recapitulate many of the pathological features of human disease and have been instrumental in investigating mechanisms and modifiers of the disease [43]; however, they have only subtle behavioral deficits and limited functional outcome measures [5,44]. For future studies to test whether inhibiting STAT3 pharmacologically has therapeutic value, we recently developed a rat model of AxD [19], which, in addition to STAT3 activation, exhibits motor deficits and other clinically relevant phenotypes for improved functional assessment. Inhibitors of the JAK/STAT pathway have been approved to treat inflammatory disorders, hematopoietic malignancies, and solid tumors [20,21], and JAK inhibitors have been shown to be effective in suppressing STAT3 activation in glioblastoma, experimental autoimmune encephalomyelitis (EAE) models of multiple sclerosis, and a model of Parkinson’s disease [45,46,47,48]. The JAK inhibitor baricitinib was recently evaluated in clinical trials for Aicardi–Goutieres syndrome, an interferonopathy that also leads to white matter deficits, with results suggesting improved neurological function [49]. Although JAK inhibition can have adverse side effects [50,51], strategies to specifically target STAT3 with small molecules have been effective in preclinical models of Alzheimer’s disease [32,52] and may provide alternatives for reducing GFAP pathology in AxD.

Author Contributions

Conceptualization and Methodology, T.L.H., L.W., M.B.F. and A.M.; Formal Analysis, T.L.H., S.C., A.L., L.W. and M.B.F.; Investigation, T.L.H., S.C., A.L. and L.W.; Resources, T.L.H., M.B.F. and A.M.; Writing—Original Draft Preparation, T.L.H. and A.M.; Writing—Review and Editing, T.L.H., L.W., M.B.F. and A.M.; Project Administration, T.L.H.; Funding Acquisition, T.L.H., M.B.F. and A.M. All authors have read and agreed to the published version of the manuscript.

Funding

This work was supported by grants from the NIH NINDS (NS093482 and NS110719 to T.L.H.) and NICHD (HD076892 to A.M., HD090256 and HD105353 core grants to the Waisman Center IDDRC), and by End Alexander disease and the Juanma Fund.

Institutional Review Board Statement

All animal studies were approved by the College of Letters and Sciences and Vice Chancellor Office for Research and Graduate Education Animal Care and Use Committee within the University of Wisconsin-Madison under protocol numbers G005568 (approved 8 September 2016), G006167 (approved 4 August 2019), and G006276 (approved 1 March 2020).

Informed Consent Statement

Not applicable.

Data Availability Statement

All relevant data are included in the current report.

Acknowledgments

We would like to thank Michael Sofroniew for sharing the floxed STAT3 line from Takeda et al., 1998, and Denice Springman and Jacob Loeffelholz for technical support.

Conflicts of Interest

The authors declare no conflict of interest. The funders had no role in the design of the study; in the collection, analyses, or interpretation of data; in the writing of the manuscript; or in the decision to publish the results.

References

  1. Messing, A.; Brenner, M.; Feany, M.B.; Nedergaard, M.; Goldman, J.E. Alexander disease. J. Neurosci. 2012, 32, 5017–5023. [Google Scholar] [CrossRef] [PubMed] [Green Version]
  2. Prust, M.; Wang, J.; Morizono, H.; Messing, A.; Brenner, M.; Gordon, E.; Hartka, T.; Sokohl, A.; Schiffmann, R.; Gordish-Dressman, H.; et al. GFAP mutations, age at onset, and clinical subtypes in Alexander disease. Neurology 2011, 77, 1287–1294. [Google Scholar] [CrossRef] [Green Version]
  3. Brenner, M.; Johnson, A.B.; Boespflug-Tanguy, O.; Rodriguez, D.; Goldman, J.E.; Messing, A. Mutations in GFAP, encoding glial fibrillary acidic protein, are associated with Alexander disease. Nat. Genet. 2001, 27, 117–120. [Google Scholar] [CrossRef] [PubMed]
  4. Brenner, M.; Goldman, J.E.; Quinlan, R.A.; Messing, A. Alexander Disease: A Genetic Disorder of Astrocytes. In Astrocytes in Pathophysiology of the Nervous System, 1st ed.; Parpura, V., Haydon, P.G., Eds.; Springer: Boston, MA, USA, 2009; pp. 591–648. [Google Scholar]
  5. Hagemann, T.L.; Connor, J.X.; Messing, A. Alexander disease-associated glial fibrillary acidic protein mutations in mice induce Rosenthal fiber formation and a white matter stress response. J. Neurosci. 2006, 26, 11162–11173. [Google Scholar] [CrossRef] [PubMed] [Green Version]
  6. Hagemann, T.L.; Jobe, E.M.; Messing, A. Genetic ablation of Nrf2/antioxidant response pathway in Alexander disease mice reduces hippocampal gliosis but does not impact survival. PLoS ONE 2012, 7, e37304. [Google Scholar] [CrossRef]
  7. Messing, A.; Head, M.W.; Galles, K.; Galbreath, E.J.; Goldman, J.E.; Brenner, M. Fatal encephalopathy with astrocyte inclusions in GFAP transgenic mice. Am. J. Pathol. 1998, 152, 391–398. [Google Scholar]
  8. Jany, P.L.; Hagemann, T.L.; Messing, A. GFAP expression as an indicator of disease severity in mouse models of Alexander disease. ASN Neuro. 2013, 5, art:e00109. [Google Scholar] [CrossRef] [Green Version]
  9. Bonni, A.; Sun, Y.; Nadal-Vicens, M.; Bhatt, A.; Frank, D.A.; Rozovsky, I.; Stahl, N.; Yancopoulos, G.D.; Greenberg, M.E. Regulation of gliogenesis in the central nervous system by the JAK-STAT signaling pathway. Science 1997, 278, 477–483. [Google Scholar] [CrossRef]
  10. Nakashima, K.; Yanagisawa, M.; Arakawa, H.; Kimura, N.; Hisatsune, T.; Kawabata, M.; Miyazono, K.; Taga, T. Synergistic signaling in fetal brain by STAT3-Smad1 complex bridged by p300. Science 1999, 284, 479–482. [Google Scholar] [CrossRef]
  11. Sriram, K.; Benkovic, S.A.; Hebert, M.A.; Miller, D.B.; O’Callaghan, J.P. Induction of gp130-related cytokines and activation of JAK2/STAT3 pathway in astrocytes precedes up-regulation of glial fibrillary acidic protein in the 1-methyl-4-phenyl-1,2,3,6-tetrahydropyridine model of neurodegeneration: Key signaling pathway for astrogliosis in vivo? J. Biol. Chem. 2004, 279, 19936–19947. [Google Scholar] [CrossRef] [Green Version]
  12. Herrmann, J.E.; Imura, T.; Song, B.; Qi, J.; Ao, Y.; Nguyen, T.K.; Korsak, R.A.; Takeda, K.; Akira, S.; Sofroniew, M.V. STAT3 is a critical regulator of astrogliosis and scar formation after spinal cord injury. J. Neurosci. 2008, 28, 7231–7243. [Google Scholar] [CrossRef] [PubMed] [Green Version]
  13. Yeo, S.; Bandyopadhyay, S.; Messing, A.; Brenner, M. Transgenic analysis of GFAP promoter elements. Glia 2013, 61, 1488–1499. [Google Scholar] [CrossRef] [PubMed] [Green Version]
  14. Brenner, M.; Messing, A. Regulation of GFAP Expression. ASN Neuro. 2021, 13, 1759091420981206. [Google Scholar] [CrossRef]
  15. O’Callaghan, J.P.; Kelly, K.A.; VanGilder, R.L.; Sofroniew, M.V.; Miller, D.B. Early Activation of STAT3 Regulates Reactive Astrogliosis Induced by Diverse Forms of Neurotoxicity. PLoS ONE 2014, 9, e102003. [Google Scholar] [CrossRef] [PubMed] [Green Version]
  16. Ben Haim, L.; Ceyzeriat, K.; Carrillo-de Sauvage, M.A.; Aubry, F.; Auregan, G.; Guillermier, M.; Ruiz, M.; Petit, F.; Houitte, D.; Faivre, E.; et al. The JAK/STAT3 Pathway Is a Common Inducer of Astrocyte Reactivity in Alzheimer’s and Huntington’s Diseases. J. Neurosci. 2015, 35, 2817–2829. [Google Scholar] [CrossRef] [PubMed] [Green Version]
  17. Ceyzériat, K.; Ben Haim, L.; Denizot, A.; Pommier, D.; Matos, M.; Guillemaud, O.; Palomares, M.A.; Abjean, L.; Petit, F.; Gipchtein, P.; et al. Modulation of astrocyte reactivity improves functional deficits in mouse models of Alzheimer’s disease. Acta Neuropathol. Commun. 2018, 6, 104. [Google Scholar] [CrossRef] [PubMed] [Green Version]
  18. LaPash Daniels, C.M.; Paffenroth, E.; Austin, E.V.; Glebov, K.; Lewis, D.; Walter, J.; Messing, A. Lithium decreases glial fibrillary acidic protein in a mouse model of Alexander disease. PLoS ONE 2015, 10, e0138132. [Google Scholar] [CrossRef] [PubMed] [Green Version]
  19. Hagemann, T.L.; Powers, B.; Lin, N.H.; Mohamed, A.F.; Dague, K.L.; Hannah, S.C.; Bachmann, G.; Mazur, C.; Rigo, F.; Olsen, A.L.; et al. Antisense therapy in a rat model of Alexander disease reverses GFAP pathology, white matter deficits, and motor impairment. Sci. Transl. Med. 2021, 13, eabg4711. [Google Scholar] [CrossRef]
  20. Johnson, D.E.; O’Keefe, R.A.; Grandis, J.R. Targeting the IL-6/JAK/STAT3 signalling axis in cancer. Nat. Rev. Clin. Oncol. 2018, 15, 234–248. [Google Scholar] [CrossRef]
  21. Tanaka, Y.; Luo, Y.; O’Shea, J.J.; Nakayamada, S. Janus kinase-targeting therapies in rheumatology: A mechanisms-based approach. Nat. Rev. Rheumatol. 2022, 18, 133–145. [Google Scholar] [CrossRef]
  22. Takeda, K.; Kaisho, T.; Yoshida, N.; Takeda, J.; Kishimoto, T.; Akira, S. Stat3 activation is responsible for IL-6-dependent T cell proliferation through preventing apoptosis: Generation and characterization of T cell-specific Stat3-deficient mice. J. Immunol. 1998, 161, 4652–4660. [Google Scholar] [CrossRef] [PubMed]
  23. Garcia, A.D.; Doan, N.B.; Imura, T.; Bush, T.G.; Sofroniew, M.V. GFAP-expressing progenitors are the principal source of constitutive neurogenesis in adult mouse forebrain. Nat. Neurosci. 2004, 7, 1233–1241. [Google Scholar] [CrossRef] [PubMed]
  24. Srinivasan, R.; Lu, T.Y.; Chai, H.; Xu, J.; Huang, B.S.; Golshani, P.; Coppola, G.; Khakh, B.S. New Transgenic Mouse Lines for Selectively Targeting Astrocytes and Studying Calcium Signals in Astrocyte Processes In Situ and In Vivo. Neuron 2016, 92, 1181–1195. [Google Scholar] [CrossRef] [PubMed] [Green Version]
  25. Madisen, L.; Zwingman, T.A.; Sunkin, S.M.; Oh, S.W.; Zariwala, H.A.; Gu, H.; Ng, L.L.; Palmiter, R.D.; Hawrylycz, M.J.; Jones, A.R.; et al. A robust and high-throughput Cre reporting and characterization system for the whole mouse brain. Nat. Neurosci. 2010, 13, 133–140. [Google Scholar] [CrossRef] [Green Version]
  26. Tronche, F.; Kellendonk, C.; Kretz, O.; Gass, P.; Anlag, K.; Orban, P.C.; Bock, R.; Klein, R.; Schütz, G. Disruption of the glucocorticoid receptor gene in the nervous system results in reduced anxiety. Nat. Genet. 1999, 23, 99–103. [Google Scholar] [CrossRef]
  27. Hagemann, T.L.; Gaeta, S.A.; Smith, M.A.; Johnson, D.A.; Johnson, J.A.; Messing, A. Gene expression analysis in mice with elevated glial fibrillary acidic protein and Rosenthal fibers reveals a stress response followed by glial activation and neuronal dysfunction. Hum. Mol. Genet. 2005, 14, 2443–2458. [Google Scholar] [CrossRef] [Green Version]
  28. Takeda, K.; Noguchi, K.; Shi, W.; Tanaka, T.; Matsumoto, M.; Yoshida, N.; Kishimoto, T.; Akira, S. Targeted disruption of the mouse Stat3 gene leads to early embryonic lethality. Proc. Natl. Acad. Sci. USA 1997, 94, 3801–3804. [Google Scholar] [CrossRef] [Green Version]
  29. Zatloukal, K.; Stumptner, C.; Fuchsbichler, A.; Heid, H.; Schnoelzer, M.; Kenner, L.; Kleinert, R.; Prinz, M.; Aguzzi, A.; Denk, H. p62 is a common component of cytoplasmic inclusions in protein aggregation diseases. Am. J. Pathol. 2002, 160, 255–263. [Google Scholar] [CrossRef] [Green Version]
  30. Cohen-Kaplan, V.; Livneh, I.; Avni, N.; Cohen-Rosenzweig, C.; Ciechanover, A. The ubiquitin-proteasome system and autophagy: Coordinated and independent activities. Int. J. Biochem. Cell Biol. 2016, 79, 403–418. [Google Scholar] [CrossRef]
  31. Brenner, M.; Messing, A.; Olsen, M.L. AP-1 and the injury response of the GFAP gene. J. Neurosci. Res. 2019, 97, 149–161. [Google Scholar] [CrossRef]
  32. Reichenbach, N.; Delekate, A.; Plescher, M.; Schmitt, F.; Krauss, S.; Blank, N.; Halle, A.; Petzold, G.C. Inhibition of Stat3-mediated astrogliosis ameliorates pathology in an Alzheimer’s disease model. EMBO Mol. Med. 2019, 11, e9665. [Google Scholar] [CrossRef]
  33. Loonstra, A.; Vooijs, M.; Beverloo, H.B.; Allak, B.A.; van Drunen, E.; Kanaar, R.; Berns, A.; Jonkers, J. Growth inhibition and DNA damage induced by Cre recombinase in mammalian cells. Proc. Natl. Acad. Sci. USA 2001, 98, 9209–9214. [Google Scholar] [CrossRef] [PubMed] [Green Version]
  34. Okada, S.; Nakamura, M.; Katoh, H.; Miyao, T.; Shimazaki, T.; Ishii, K.; Yamane, J.; Yoshimura, A.; Iwamoto, Y.; Toyama, Y.; et al. Conditional ablation of Stat3 or Socs3 discloses a dual role for reactive astrocytes after spinal cord injury. Nat. Med. 2006, 12, 829–834. [Google Scholar] [CrossRef] [PubMed]
  35. Qin, H.; Yeh, W.I.; De Sarno, P.; Holdbrooks, A.T.; Liu, Y.; Muldowney, M.T.; Reynolds, S.L.; Yanagisawa, L.L.; Fox, T.H., 3rd; Park, K.; et al. Signal transducer and activator of transcription-3/suppressor of cytokine signaling-3 (STAT3/SOCS3) axis in myeloid cells regulates neuroinflammation. Proc. Natl. Acad. Sci. USA 2012, 109, 5004–5009. [Google Scholar] [CrossRef] [Green Version]
  36. Hristova, M.; Rocha-Ferreira, E.; Fontana, X.; Thei, L.; Buckle, R.; Christou, M.; Hompoonsup, S.; Gostelow, N.; Raivich, G.; Peebles, D. Inhibition of Signal Transducer and Activator of Transcription 3 (STAT3) reduces neonatal hypoxic-ischaemic brain damage. J. Neurochem. 2016, 136, 981–994. [Google Scholar] [CrossRef]
  37. Anderson, M.A.; Burda, J.E.; Ren, Y.; Ao, Y.; O’Shea, T.M.; Kawaguchi, R.; Coppola, G.; Khakh, B.S.; Deming, T.J.; Sofroniew, M.V. Astrocyte scar formation aids central nervous system axon regeneration. Nature 2016, 532, 195–200. [Google Scholar] [CrossRef] [PubMed] [Green Version]
  38. Tyzack, G.E.; Hall, C.E.; Sibley, C.R.; Cymes, T.; Forostyak, S.; Carlino, G.; Meyer, I.F.; Schiavo, G.; Zhang, S.C.; Gibbons, G.M.; et al. A neuroprotective astrocyte state is induced by neuronal signal EphB1 but fails in ALS models. Nat. Commun. 2017, 8, 1164. [Google Scholar] [CrossRef] [Green Version]
  39. Abjean, L.; Ben Haim, L.; Riquelme-Perez, M.; Gipchtein, P.; Derbois, C.; Palomares, M.A.; Petit, F.; Herard, A.S.; Gaillard, M.C.; Guillermier, M.; et al. Reactive astrocytes promote proteostasis in Huntington’s disease through the JAK2-STAT3 pathway. Brain 2023, 146, 149–166. [Google Scholar] [CrossRef]
  40. Burda, J.E.; O’Shea, T.M.; Ao, Y.; Suresh, K.B.; Wang, S.; Bernstein, A.M.; Chandra, A.; Deverasetty, S.; Kawaguchi, R.; Kim, J.H.; et al. Divergent transcriptional regulation of astrocyte reactivity across disorders. Nature 2022, 606, 557–564. [Google Scholar] [CrossRef]
  41. Tang, G.; Yue, Z.; Talloczy, Z.; Hagemann, T.; Cho, W.; Messing, A.; Sulzer, D.L.; Goldman, J.E. Autophagy induced by Alexander disease-mutant GFAP accumulation is regulated by p38/MAPK and mTOR signaling pathways. Hum. Mol. Genet. 2008, 17, 1540–1555. [Google Scholar] [CrossRef] [Green Version]
  42. Tang, G.; Xu, Z.; Goldman, J.E. Synergistic effects of the SAPK/JNK and the proteasome pathway on glial fibrillary acidic protein (GFAP) accumulation in Alexander disease. J. Biol. Chem. 2006, 281, 38634–38643. [Google Scholar] [CrossRef] [PubMed] [Green Version]
  43. Hagemann, T.L. Alexander disease: Models, mechanisms, and medicine. Curr. Opin. Neurobiol. 2021, 72, 140–147. [Google Scholar] [CrossRef] [PubMed]
  44. Hagemann, T.L.; Paylor, R.; Messing, A. Deficits in adult neurogenesis, contextual fear conditioning, and spatial learning in a Gfap mutant mouse model of Alexander disease. J. Neurosci. 2013, 33, 18698–18706. [Google Scholar] [CrossRef] [Green Version]
  45. Liu, Y.; Holdbrooks, A.T.; De Sarno, P.; Rowse, A.L.; Yanagisawa, L.L.; McFarland, B.C.; Harrington, L.E.; Raman, C.; Sabbaj, S.; Benveniste, E.N.; et al. Therapeutic efficacy of suppressing the Jak/STAT pathway in multiple models of experimental autoimmune encephalomyelitis. J. Immunol. 2014, 192, 59–72. [Google Scholar] [CrossRef] [Green Version]
  46. Qin, H.; Buckley, J.A.; Li, X.; Liu, Y.; Fox, T.H., 3rd; Meares, G.P.; Yu, H.; Yan, Z.; Harms, A.S.; Li, Y.; et al. Inhibition of the JAK/STAT Pathway Protects Against α-Synuclein-Induced Neuroinflammation and Dopaminergic Neurodegeneration. J. Neurosci. 2016, 36, 5144–5159. [Google Scholar] [CrossRef] [Green Version]
  47. McFarland, B.C.; Ma, J.Y.; Langford, C.P.; Gillespie, G.Y.; Yu, H.; Zheng, Y.; Nozell, S.E.; Huszar, D.; Benveniste, E.N. Therapeutic potential of AZD1480 for the treatment of human glioblastoma. Mol. Cancer Ther. 2011, 10, 2384–2393. [Google Scholar] [CrossRef] [PubMed] [Green Version]
  48. Groot, J.; Ott, M.; Wei, J.; Kassab, C.; Fang, D.; Najem, H.; O’Brien, B.; Weathers, S.P.; Matsouka, C.K.; Majd, N.K.; et al. A first-in-human Phase I trial of the oral p-STAT3 inhibitor WP1066 in patients with recurrent malignant glioma. CNS Oncol. 2022, 11, Cns87. [Google Scholar] [CrossRef]
  49. Vanderver, A.; Adang, L.; Gavazzi, F.; McDonald, K.; Helman, G.; Frank, D.B.; Jaffe, N.; Yum, S.W.; Collins, A.; Keller, S.R.; et al. Janus Kinase Inhibition in the Aicardi-Goutières Syndrome. N. Engl. J. Med. 2020, 383, 986–989. [Google Scholar] [CrossRef]
  50. Verstovsek, S.; Hoffman, R.; Mascarenhas, J.; Soria, J.C.; Bahleda, R.; McCoon, P.; Tang, W.; Cortes, J.; Kantarjian, H.; Ribrag, V. A phase I, open-label, multi-center study of the JAK2 inhibitor AZD1480 in patients with myelofibrosis. Leuk. Res. 2015, 39, 157–163. [Google Scholar] [CrossRef]
  51. Scott, B.L.; Becker, P.S. JAK/STAT Pathway Inhibitors and Neurologic Toxicity: Above All Else Do No Harm? JAMA Oncol. 2015, 1, 651–652. [Google Scholar] [CrossRef]
  52. Mehla, J.; Singh, I.; Diwan, D.; Nelson, J.W.; Lawrence, M.; Lee, E.; Bauer, A.Q.; Holtzman, D.M.; Zipfel, G.J. STAT3 inhibitor mitigates cerebral amyloid angiopathy and parenchymal amyloid plaques while improving cognitive functions and brain networks. Acta Neuropathol. Commun. 2021, 9, 193. [Google Scholar] [CrossRef] [PubMed]
Figure 1. STAT3 activation in AxD. (A) Comparison of fold increase in Gfap transcript among different brain regions and spinal cord in Gfap+/R236H mice as measured by qPCR. Results for olfactory bulb (OB), cortex (Ctx), hippocampus (Hip), cerebellum (CB), brainstem (BS) and cervical spinal cord (SC) are shown (males at 8 weeks, ANOVA with Sidak’s post-tests, data reanalyzed from Figure 2 of Jany et al., 2013 [8]). (B) Western analysis of pY705-STAT3 and total STAT3 in different brain regions and spinal cord of Gfap+/R236H (R236H) and wild-type (WT) mice (different animal in each lane). (C) Graphs represent fold change comparisons of R236H over WT for immunoblots as shown in (B) (males at 3 months, ANOVA with Sidak’s post-tests) (D) Quantification of transcripts regulated by STAT3 or related to neuroinflammation in hippocampus (Hip) and corpus callosum (CC) in Gfap+/R236H mice. Relative values are normalized to Rn18s and expressed as a fold change compared to the wild-type average (males and females, Hip at 8 weeks, CC at 12 weeks, two-tailed t-test). (E) Immunolabeling of pY705-STAT3 (red) and GFAP (green) in Gfap+/R236H mouse hippocampus (CA1), olfactory bulb (OB), frontal cortex adjacent to the corpus callosum (Ctx/CC), and brainstem (BS). Left panel shows a wild-type (WT) mouse, and remaining panels represent Gfap+/R236H mice (R236H, males and females at 2 months). (F) Immunolabeling of pY705-STAT3 (green) and GFAP (red) in gray matter astrocytes from a 1-year-old patient with AxD. Arrows in (E,F) indicate pSTAT3 labeled nuclei. All mice are FVB/N. ** p < 0.01, *** p < 0.001, **** p < 0.0001 for all statistics. Scale bars = 10 µm.
Cells 12 00978 g001
Figure 2. Genetic knockdown of Stat3 in AxD model mice has marginal effects on Gfap expression. (A) Genetic cross to generate Gfap+/R236H mice with reduced STAT3 activation. (B,C) Quantitation of pY705-STAT3 by immunoblotting (B), and Gfap transcript by qPCR and protein by ELISA (C) in olfactory bulb and hippocampus from Gfap+/R236H mice and Gfap+/+ littermate controls with heterozygous knockout of the STAT3-Y705 phosphorylation site. Values represent fold change relative to the average for Gfap+/+; Stat3+/+ mice. FVBB6F1 male and female mice were used at 12 weeks of age. Two-way ANOVA with Sidak’s post-tests, * p < 0.05, ** p < 0.01, *** p < 0.001, **** p < 0.0001.
Cells 12 00978 g002
Figure 3. GFAP and stress markers in AxD model mice with conditional genetic knockout of Stat3 in Gfap expressing cells at 8 weeks of age. (A) Genetic cross to generate Gfap+/R236H mice and Gfap+/+ littermate controls with heterozygous knockout/floxed (-/fl) Stat3 alleles and a Gfap-promoter-driven Cre transgene Tg73.12. (BD) Quantitation of pY705-STAT3 protein by immunoblotting (B), Gfap, Lcn2, and Aif1 transcripts by qPCR (C), and GFAP protein by ELISA (D) in hippocampus and olfactory bulb. Values in (B,C) are normalized to GAPDH and Rn18s, respectively, and represent fold change relative to the average for Gfap+/+; Stat3/fl; Cre (-) mice. C57BL/6J males and females, two-way ANOVA with Sidak’s post-tests, * p < 0.05, *** p < 0.001, **** p < 0.0001, ns = not significant.
Cells 12 00978 g003
Figure 4. GFAP protein in AxD model mice with conditional genetic knockout of Stat3 in Gfap expressing cells at 12 weeks of age. (A) Genetic cross to generate Gfap+/R236H mice and Gfap+/+ littermate controls with both Stat3 alleles floxed (fl/fl) and a Gfap-promoter-driven Cre transgene (Tg73.12). (B,C) Quantitation of pY705-STAT3 and total STAT3 protein in olfactory bulb and hippocampus by immunoblotting (B), and GFAP protein in multiple brain regions and cervical spinal cord by ELISA (C). Values in (B) are normalized to total protein and represent fold change relative to the average for Gfap+/+; Stat3fl/fl; Cre (-) mice. C57BL/6J males and females, two-way ANOVA with Sidak’s post-tests, * p < 0.05, ** p < 0.01, *** p < 0.001, **** p < 0.0001, ns = not significant.
Cells 12 00978 g004
Figure 5. p62/SQSTM1 expression and protein aggregation in AxD model mice with conditional knockout of Stat3 in Gfap expressing cells. (A) Quantification of p62/SQSTM1 protein in olfactory bulb and hippocampus from Gfap+/R236H mice and Gfap+/+ littermate controls (3 months of age) collected from the same Stat3fl/lf; CreTg73.12 genetic cross as shown in Figure 4A. (B,C) Immunofluorescence labeling of p62 and GFAP in hippocampus (B), and quantification of percent area for p62 (C) in mice from the same cross at 6 months of age. Values in (A) are normalized to total protein and represent fold change relative to the average for Gfap+/+; Stat3fl/fl; Cre (-) mice. C57BL/6J males and females, two-way ANOVA with Sidak’s post-tests, * p < 0.05, ** p < 0.01, *** p < 0.001, **** p < 0.0001, ns = not significant. Scale bars = 50 µm.
Cells 12 00978 g005
Figure 6. Iba1 expression in microglia from AxD model mice with conditional knockout of Stat3 in Gfap expressing cells. (A,B) Immunofluorescence labeling (A) and quantification (B) of Iba1 in hippocampus and olfactory bulb from Gfap+/R236H mice and Gfap+/+ littermate controls (6 months of age) collected from the same Stat3fl/lf, CreTg73.12 genetic cross as shown in Figure 4A. GFAP is also labeled for comparison. Values in (B) represent fold change relative to the average for Gfap+/+; Stat3fl/fl; Cre (-) mice. C57BL/6J males and females, two-way ANOVA with Sidak’s post-tests, ** p < 0.01, *** p < 0.001, **** p < 0.0001, ns = not significant. Scale bars = 50 µm.
Cells 12 00978 g006
Figure 7. STAT3, GFAP, and other stress and immune related markers in AxD model mice after induced genetic knockout of Stat3 in astrocytes. (A) Genetic cross to generate Gfap+/R236H mice and Gfap+/+ littermate controls with both Stat3 alleles floxed (fl/fl) and a tamoxifen-inducible Aldh1l1-promoter driven CreERT2 transgene. All mice were treated with tamoxifen at 2 months of age for 5 days, and tissues collected at 3 months of age. Timeline in right panel shows targeted postnatal (P) days. Stat3 alleles in animals expressing the Aldh1l1-CreERT2 transgene are indicated as Δ (Stat3Δ/Δ). (B,C) Quantitation of pY705-STAT3 and total STAT3 protein by immunoblotting (B), and Gfap transcript by qPCR (C) in hippocampus and olfactory bulb. (D) GFAP protein quantification in multiple brain regions and cervical spinal cord. (E) Quantification of transcripts reflecting reactive gliosis (Lcn2), STAT3 activation (Ccnd1, Socs3), neuroinflammation (Cxcl1, Ccl2), and oxidative stress (Nqo1) in hippocampus and olfactory bulb. Values in (B) are normalized to total protein and in (C,E) to Rn18s, and all represent fold change relative to the average for Gfap+/+; Stat3fl/fl; Cre (-) mice. C57BL/6J males and females, two-way ANOVA with Sidak’s post-tests, * p < 0.05, ** p < 0.01, **** p < 0.0001, ns = not significant.
Cells 12 00978 g007
Figure 8. p62/SQSTM1 expression and protein aggregation in AxD model mice after inducing genetic knockout of Stat3 in astrocytes. (A,B) Immunofluorescence labeling of p62 and GFAP in hippocampus (A), and quantitation of percent area (B) in hippocampus and olfactory bulb from Gfap+/R236H mice and Gfap+/+ littermate controls (3 months of age) derived from the same Stat3fl/fl, CreERT2 genetic cross and tamoxifen treatment schedule as shown in Figure 7A. Stat3 alleles in animals expressing the Aldh1l1-CreERT2 transgene are indicated as Δ (Stat3Δ/Δ). (C) Quantification of p62/SQSTM1 protein in olfactory bulb and hippocampus by western analysis of a separate group of mice from the same genetic cross and treatment described in (A,B). C57BL/6J males and females, two-way ANOVA with Sidak’s post-tests, * p < 0.05, ** p < 0.01, *** p < 0.001, **** p < 0.0001, ns = not significant. Scale bars = 50 µm.
Cells 12 00978 g008
Figure 9. Microglial Iba1 expression in AxD model mice after inducible knockout of Stat3 in astrocytes. (A,B) Immunofluorescence labeling (A) and quantification (B) of Iba1 in hippocampus and olfactory bulb from Gfap+/R236H mice and Gfap+/+ littermate controls (3 months of age) derived from the same Stat3fl/fl, CreERT2 genetic cross and tamoxifen treatment schedule as shown in Figure 7A. Stat3 alleles in animals expressing the Aldh1l1-CreERT2 transgene are indicated as Δ (Stat3Δ/Δ). GFAP is also shown in hippocampus for comparison. (C) Quantification of Aif1 transcript (Iba1 gene, normalized to Rn18s) in olfactory bulb and hippocampus by qPCR. Values represent fold change relative to the average for Gfap+/+; Stat3fl/fl; Cre (-) mice. C57BL/6J males and females, two-way ANOVA with Sidak’s post-tests, * p < 0.05, ** p < 0.01, *** p < 0.001, **** p < 0.0001, ns = not significant. Scale bars = 50 µm.
Cells 12 00978 g009
Table 1. Primer sets for quantitative PCR.
GeneForward PrimerReverse Primer
GfapCAA CGT TAA GCT AGC CCT GGA CATCTC ACC ATC CCG CAT CTC CAC AGT
Aif1GCC AAA GCA GGG ATT TGC AGGGG AAC CCC AAG TTT CTC CA
Ccl2CTG GAG CAT CCA CGT GTT GGCAT TCC TTC TTG GGG TCA GC
Ccnd1GCG TAC CCT GAC ACC AAT CTC CTCTT CGC ACT TCT GCT CCT CAC
Cxcl1GCC ACA CTC AAG AAT GGT CGACC AGA CAG GTG CCA TCA GA
Il6GAC TTC CAT CCA GTT GCC TTC TAAG TAG GGA AGG CCG TGG TT
Lcn2AGA CTT CCG GAG CGA TCA GTTCT GAT CCA GTA GCG ACA GC
Nqo1CGG TAT TAC GAT CCT CCC TCA ACAAGC CTC TAC AGC AGC CTC CTT CAT
Socs3AAG GCC GGA GAT TTC GCT TCGGG AAA CTT GCT GTG GGT GA
Stat3ACG AAA GTC AGG TTG CTG GTGCT GCC GTT GTT AGA CTC CT
Thbs1TGC CCT GCC CAC CAC GAT TCAGCA TAG CCG GGC TTG CAC TCA CA
Rn18sCGC CGC TAG AGG TGA AAT TCTCGA ACC TCC GAC TTT CGT TCT
Table 2. Antibodies used in study.
AssayAntigenHostMono/PolySourceCatalog No.RRIDDilution
ELISAGFAPmousemono SMI 26BioLegend837602AB_25653801:1000
ELISAGFAPrabbitpolyDako/AgilentZ0334AB_100133821:5000
IFGFAPmousemono GA5Millipore SigmaG6171AB_18408931:1000
IFGFAPrabbitpolyDako/AgilentZ0334AB_100133821:1000
IFIba1rabbitpolyWako019-19741AB_8395041:500
IFp62/SQSTM1mousemono 2C11AbnovaH00008878-M01AB_4370851:100
IFSTAT3-pY705rabbitmono D3A7Cell Signaling9145AB_24910091:200
WesternGAPDHmousemono 6C5Fitzgerald10R-G109AAB_12858081:10,000
WesternGAPDHrabbitpolyAbcamAb9485AB_3072751:2500
Westernp62/SQSTM1mousemono 2C11AbnovaH00008878-M01AB_4370851:5000
WesternSTAT3mouse mono 124H6Cell Signaling9139SAB_3317571:5000
WesternSTAT3-pY705rabbitmono D3A7Cell Signaling9145SAB_27994071:5000
Assay2nd AntigenHostConjugateSourceCatalog No.RRIDDilution
ELISArabbit-IgGgoatHRPMillipore SigmaA6154AB_2582841:10,000
IFmouse-IgGgoatAlexa Fluor 568Thermo-InvitrogenA11031AB_1446961:500
IFmouse-IgGgoatAlexa Fluor 647Thermo-InvitrogenA32728AB_26332771:500
IFrabbit-IgGgoatAlexa Fluor 488Thermo-InvitrogenA11034AB_25762171:500
IFmouse-IgGdonkeyAlexa Fluor 488Thermo-InvitrogenA21202AB_1416071:500
IFrabbit-IgGdonkeyAlexa Fluor 546Thermo-InvitrogenA10040AB_25340161:500
Westernmouse-IgGgoatAlexa Fluor 680Thermo-InvitrogenA21057AB_25357231:10,000
Westernmouse-IgGgoatDyLight 800Thermo ScientificSA5-10176AB_25567561:10,000
Westernrabbit-IgGgoatAlexa Fluor 680Thermo-InvitrogenA21109AB_25357581:10,000
Westernrabbit-IgGgoatDyLight 800Thermo Scientific35571AB_6149471:10,000
Disclaimer/Publisher’s Note: The statements, opinions and data contained in all publications are solely those of the individual author(s) and contributor(s) and not of MDPI and/or the editor(s). MDPI and/or the editor(s) disclaim responsibility for any injury to people or property resulting from any ideas, methods, instructions or products referred to in the content.

