
Assessment of the Impact of the Application of a Quercetin—Copper Complex on the Course of Physiological and Biochemical Processes in Wheat Plants (Triticum aestivum L.) Growing under Saline Conditions


Abstract
:1. Introduction
2. Materials and Methods
2.1. Synthesis of the Quercetin—Copper (II) (Q-Cu (II)) Complex
2.2. Pot Experimental Design
2.3. Measurement of Physiological Parameters
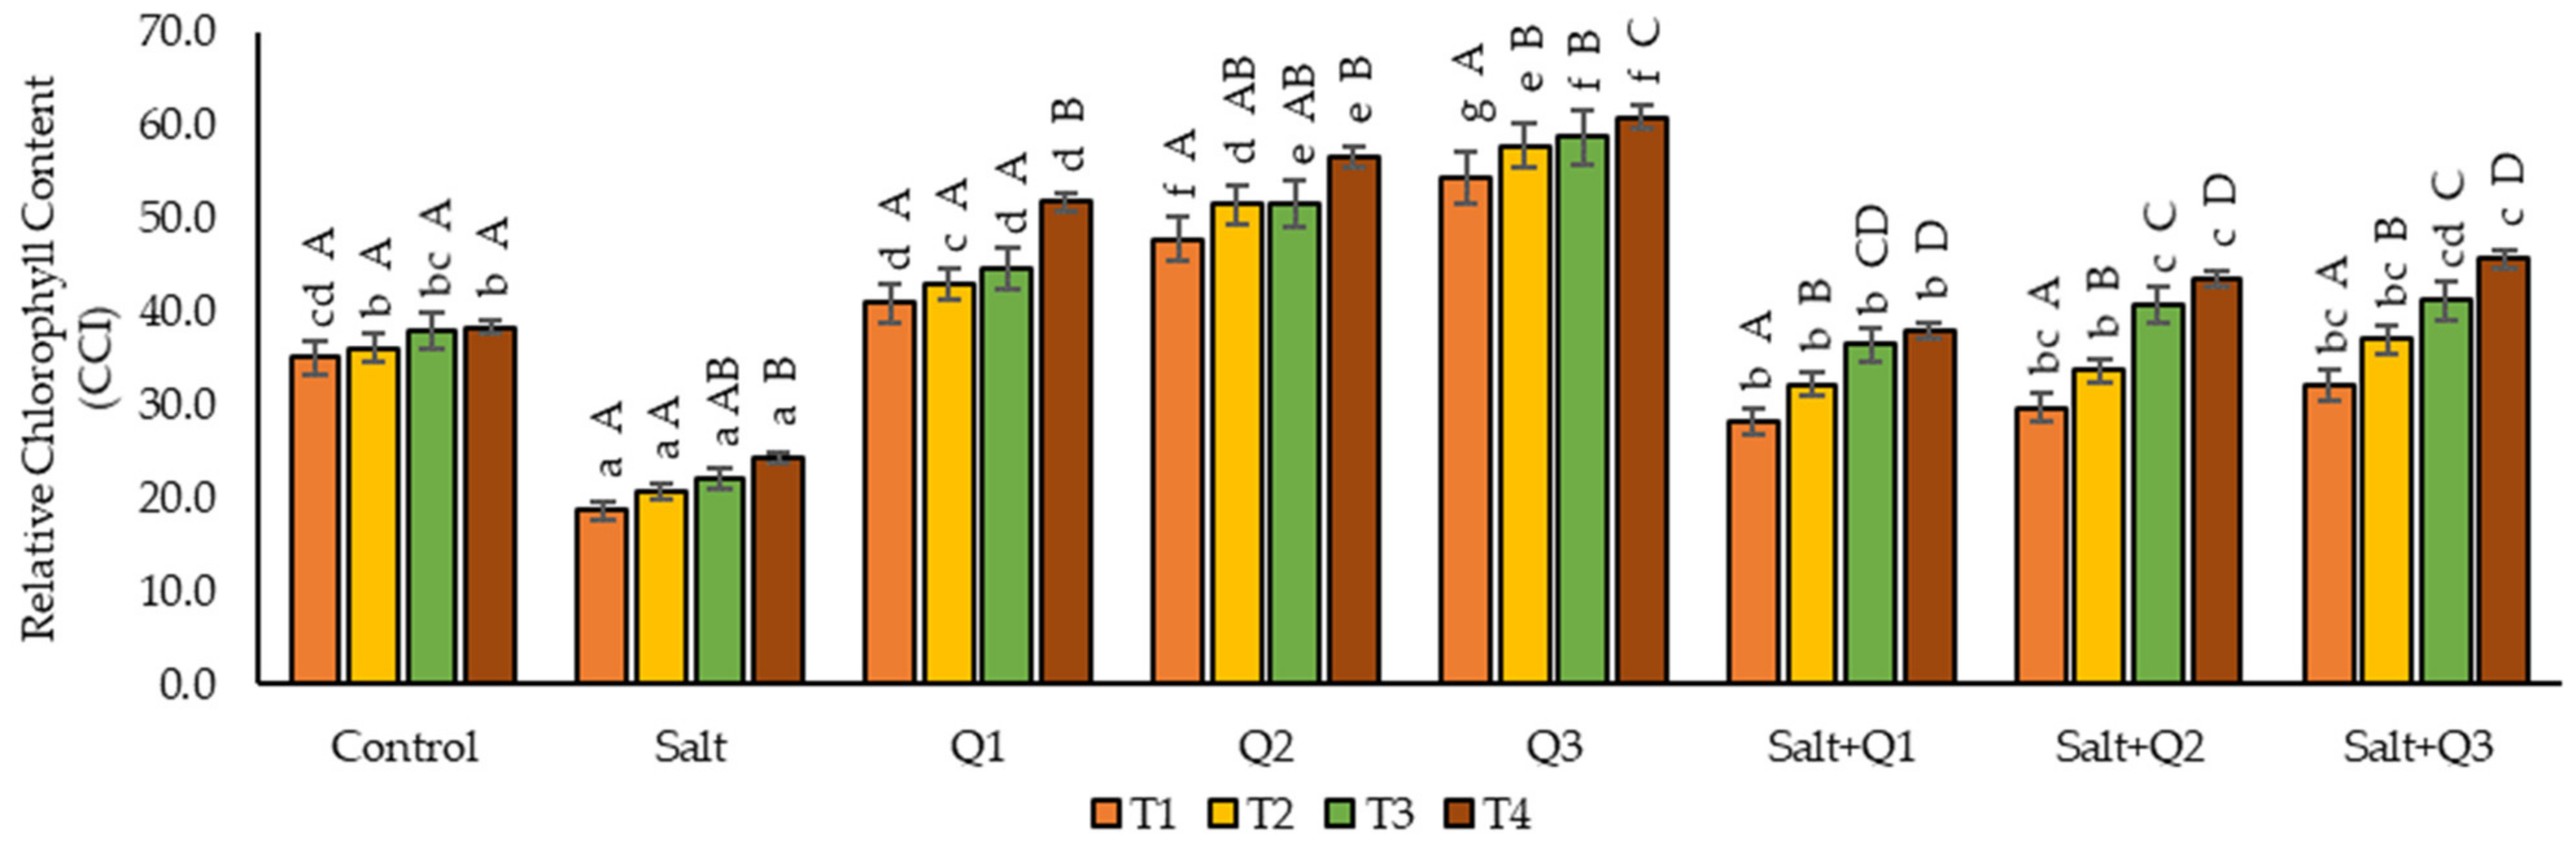
2.3.1. Relative Chlorophyll Content
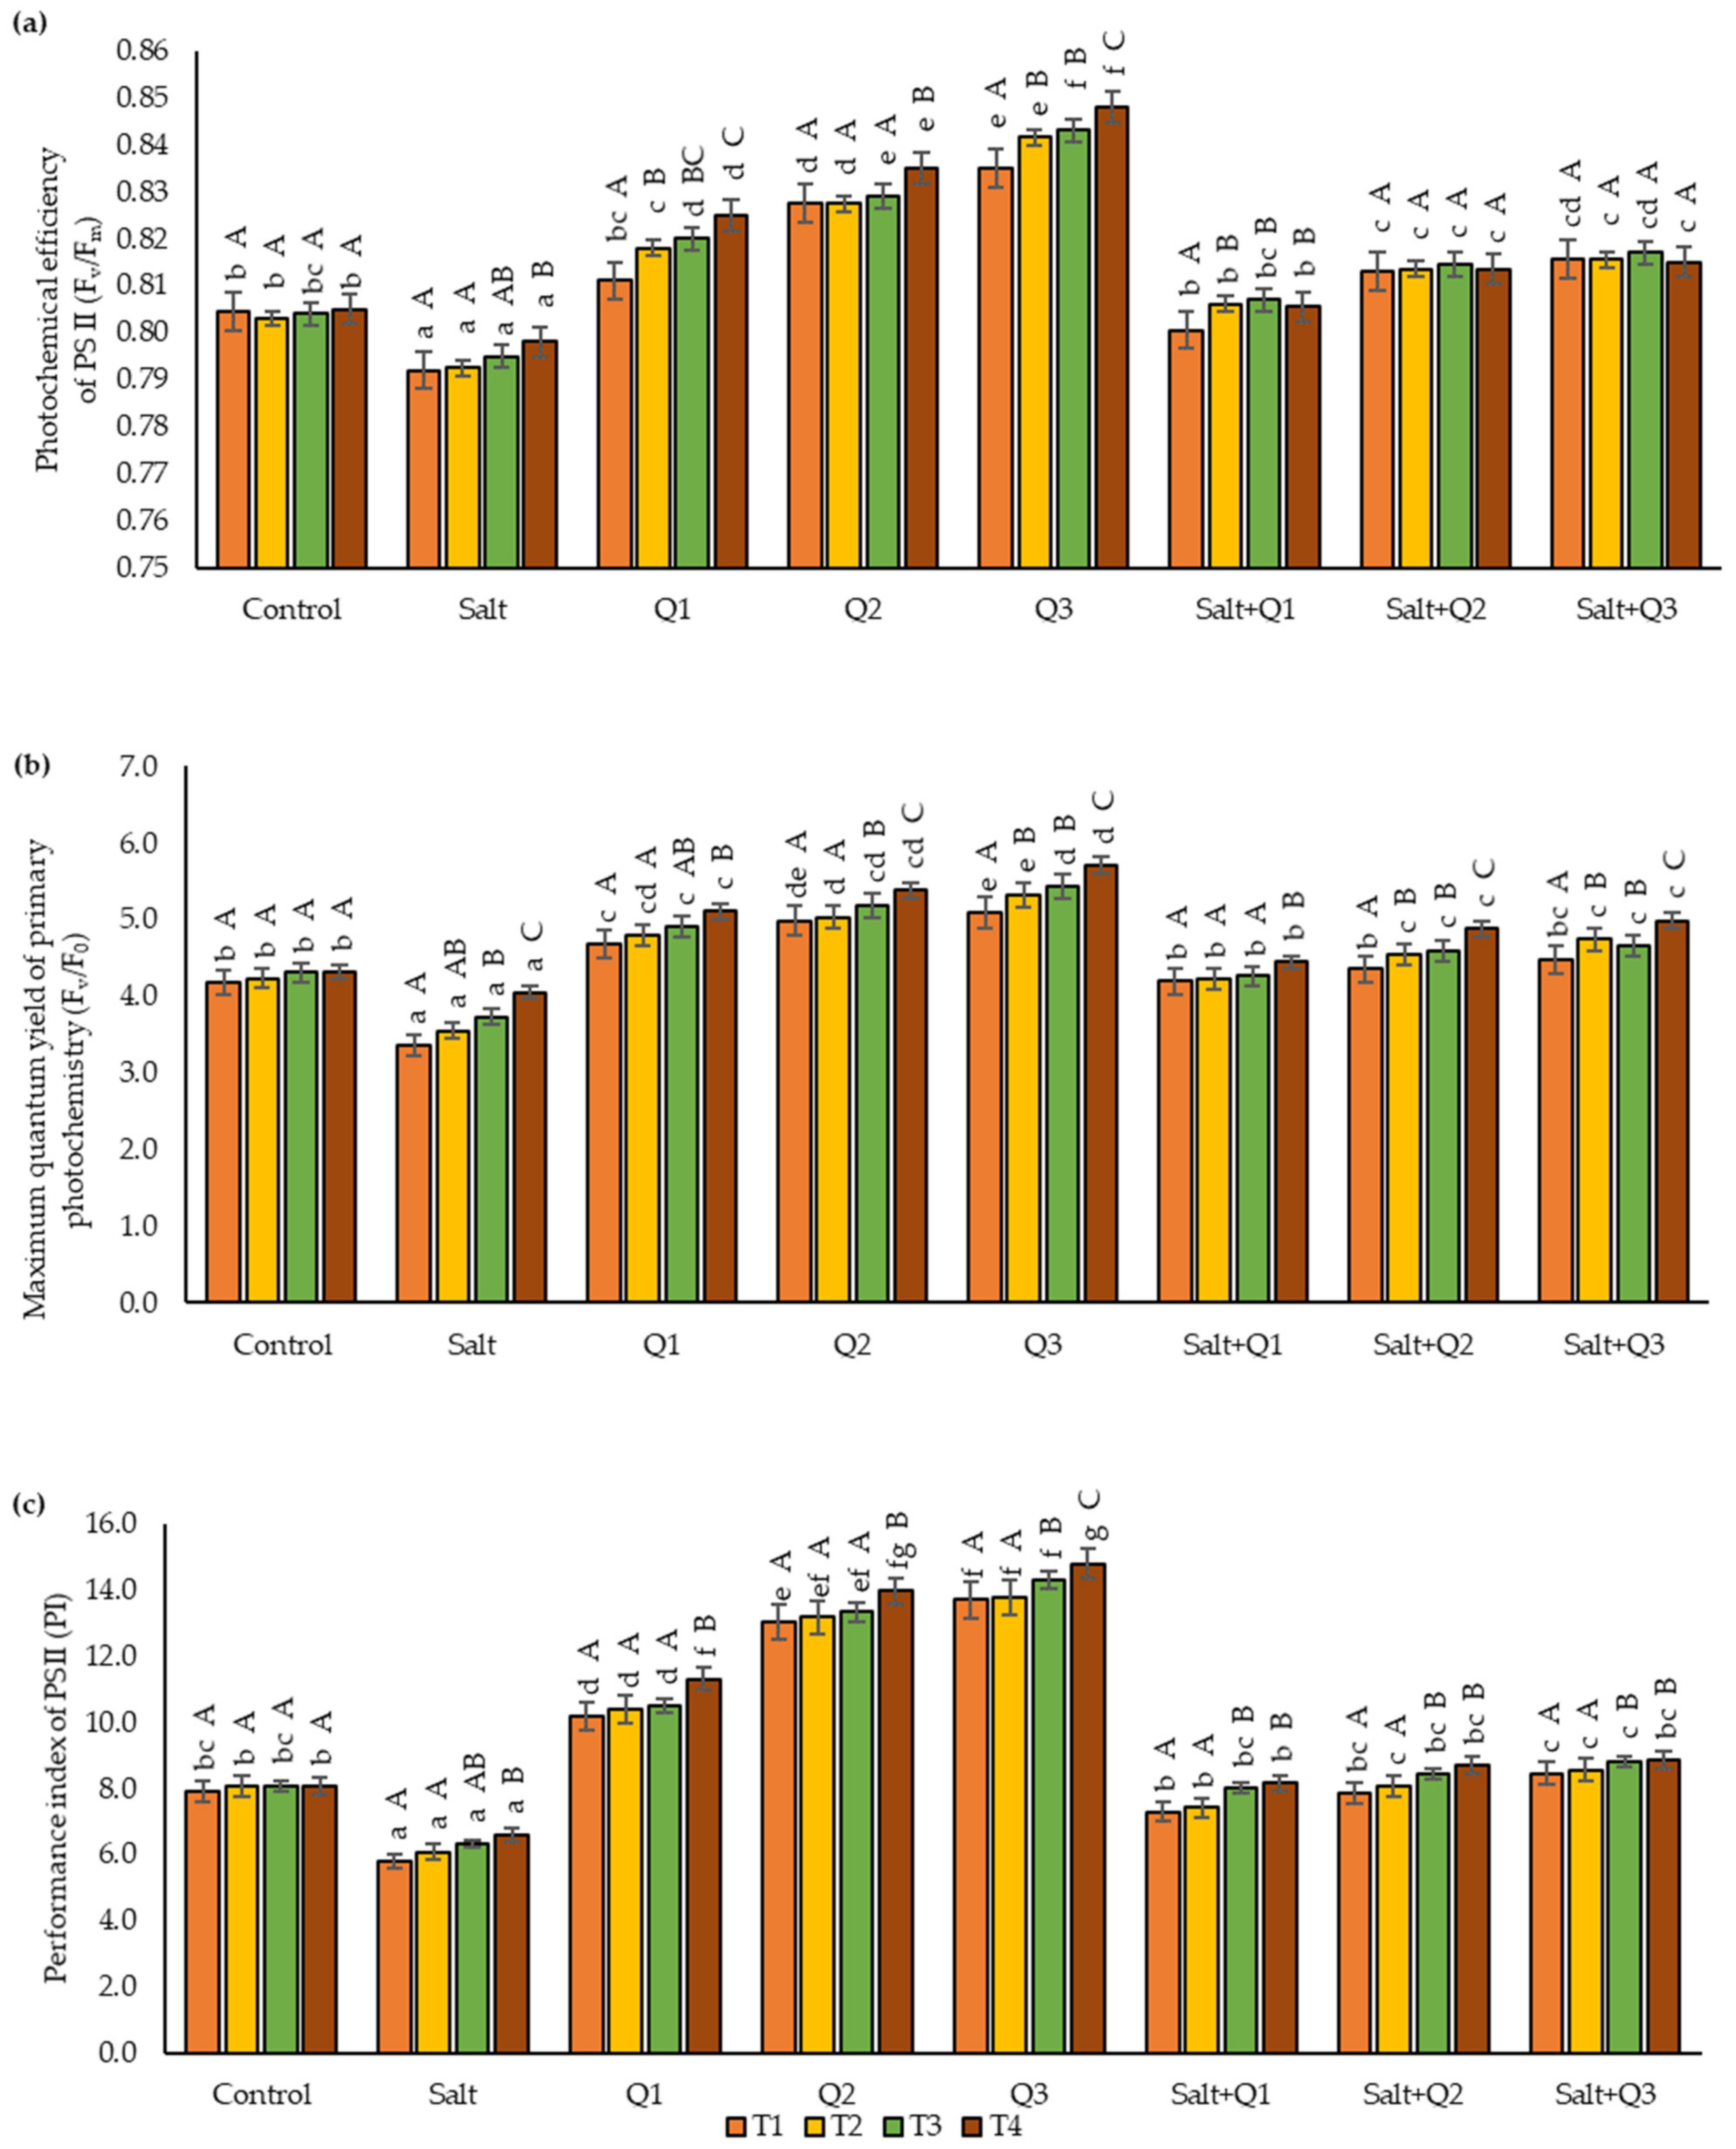
2.3.2. Chlorophyll Fluorescence
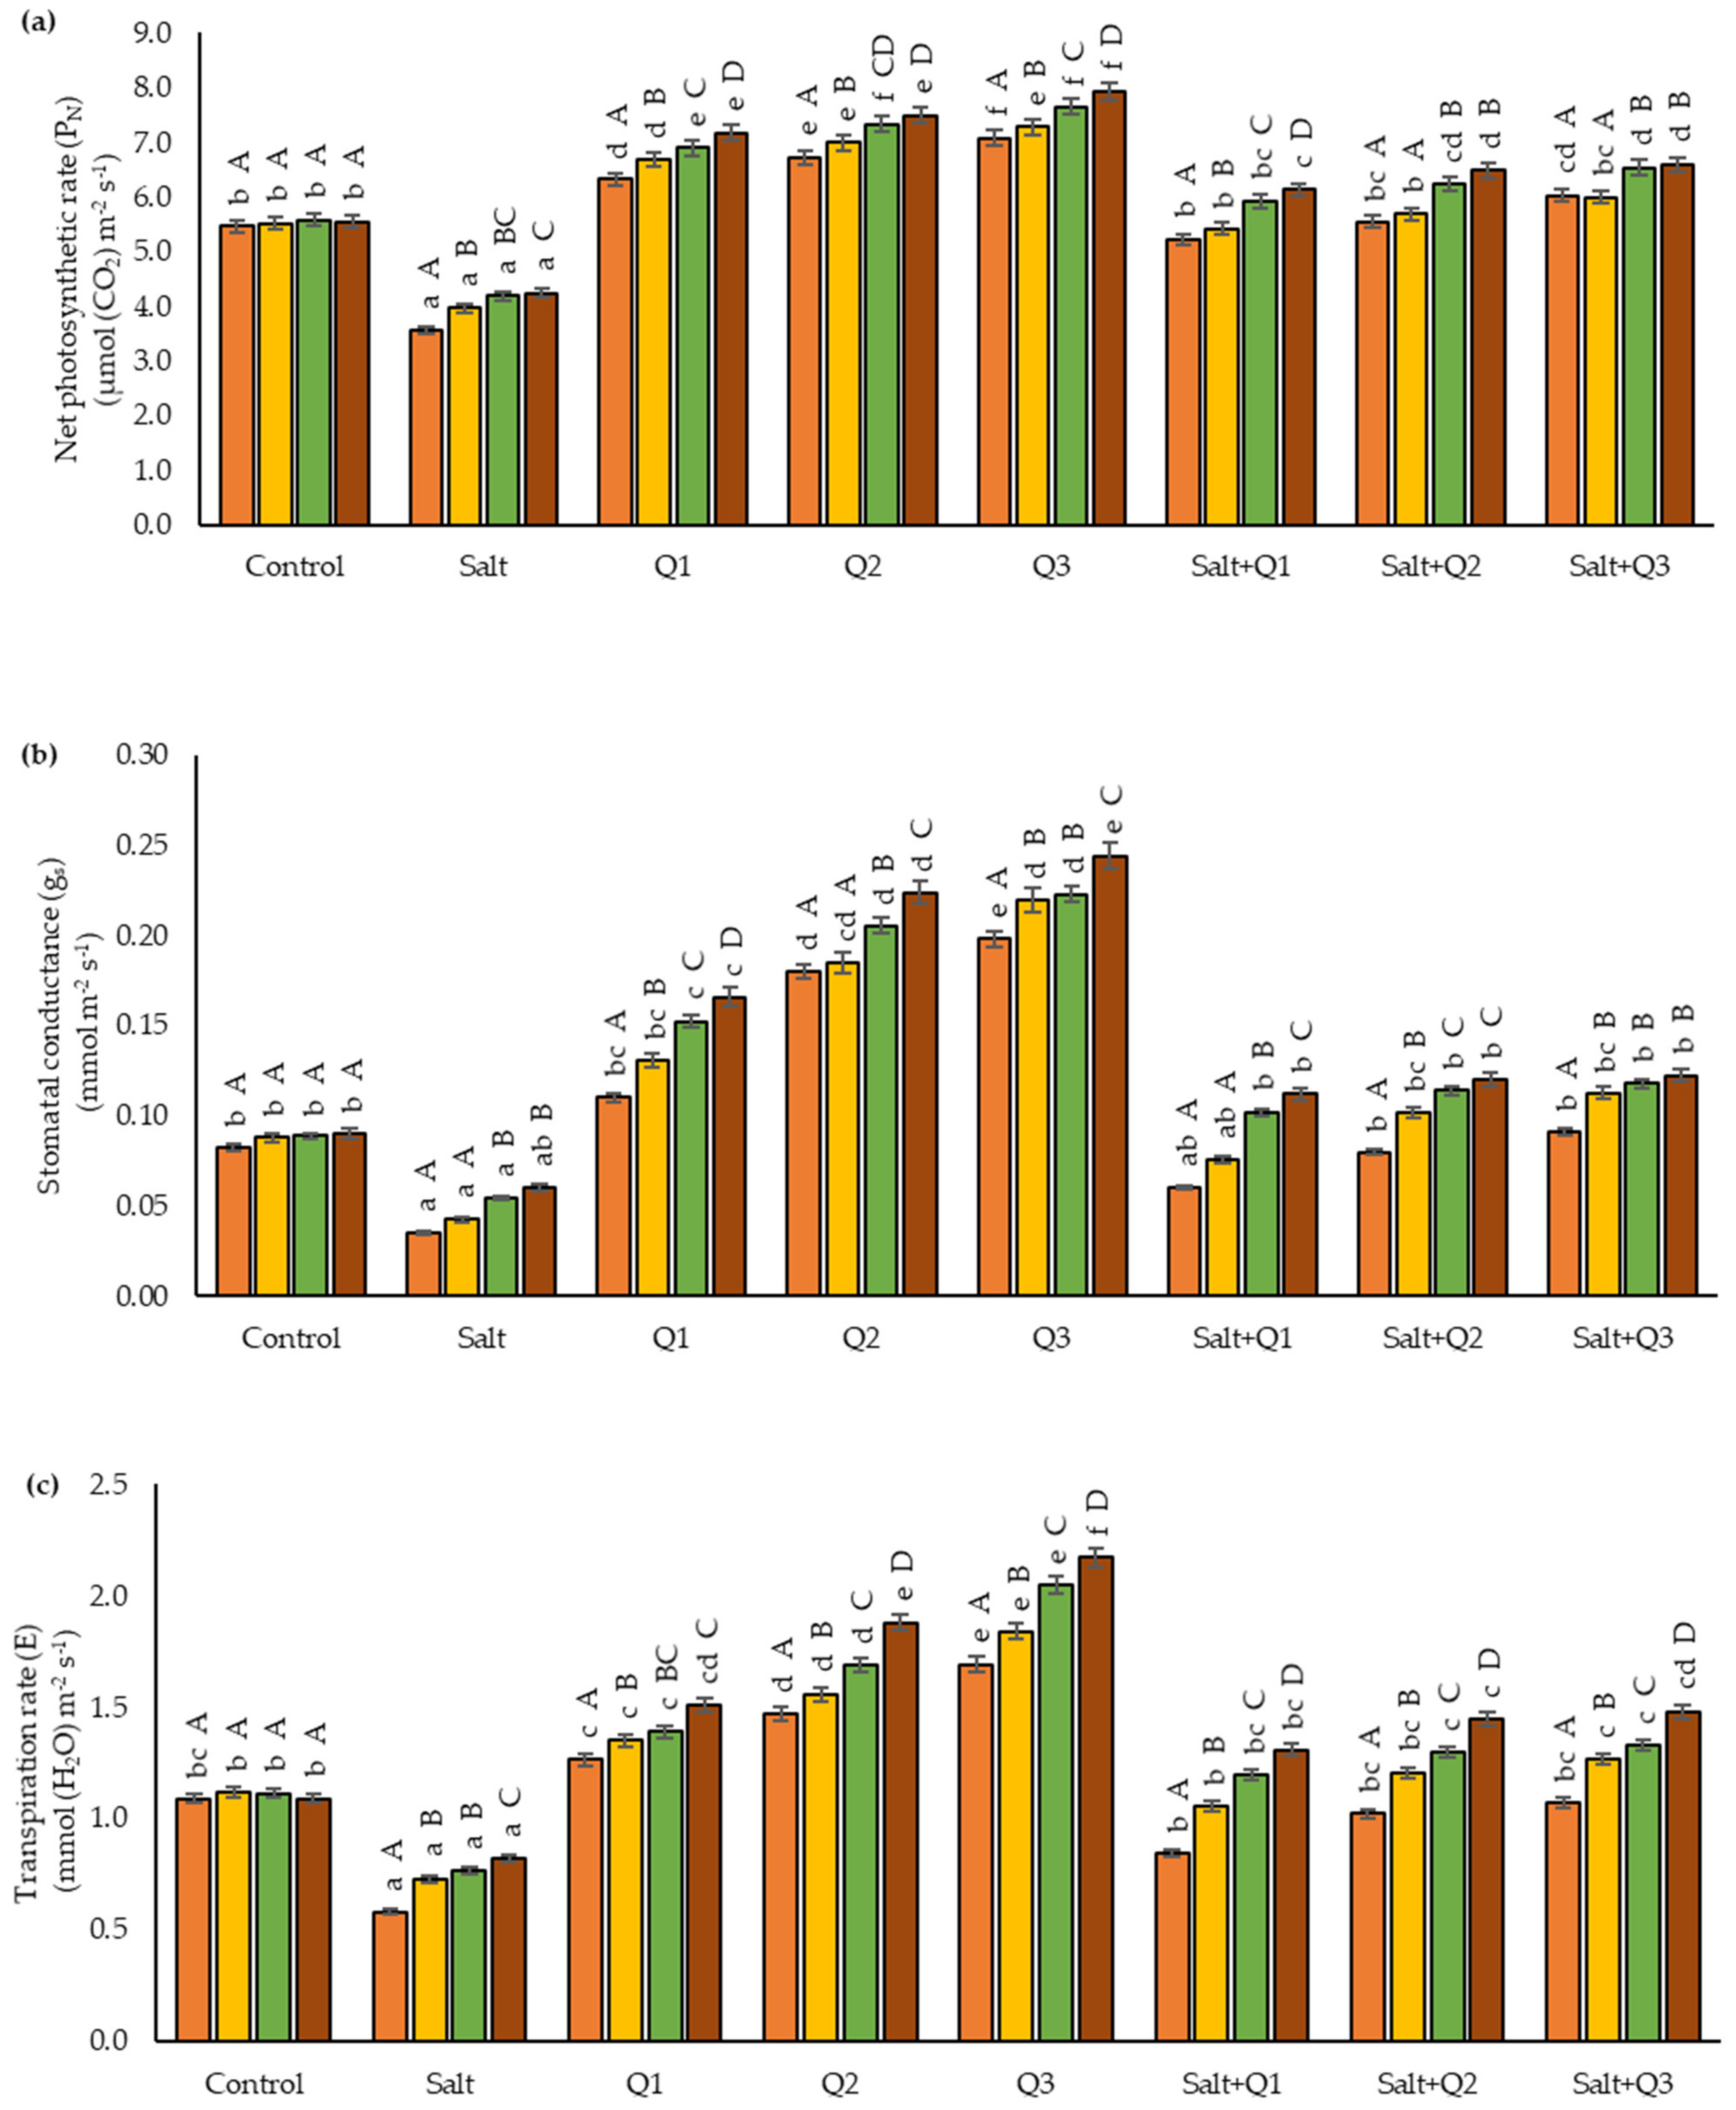
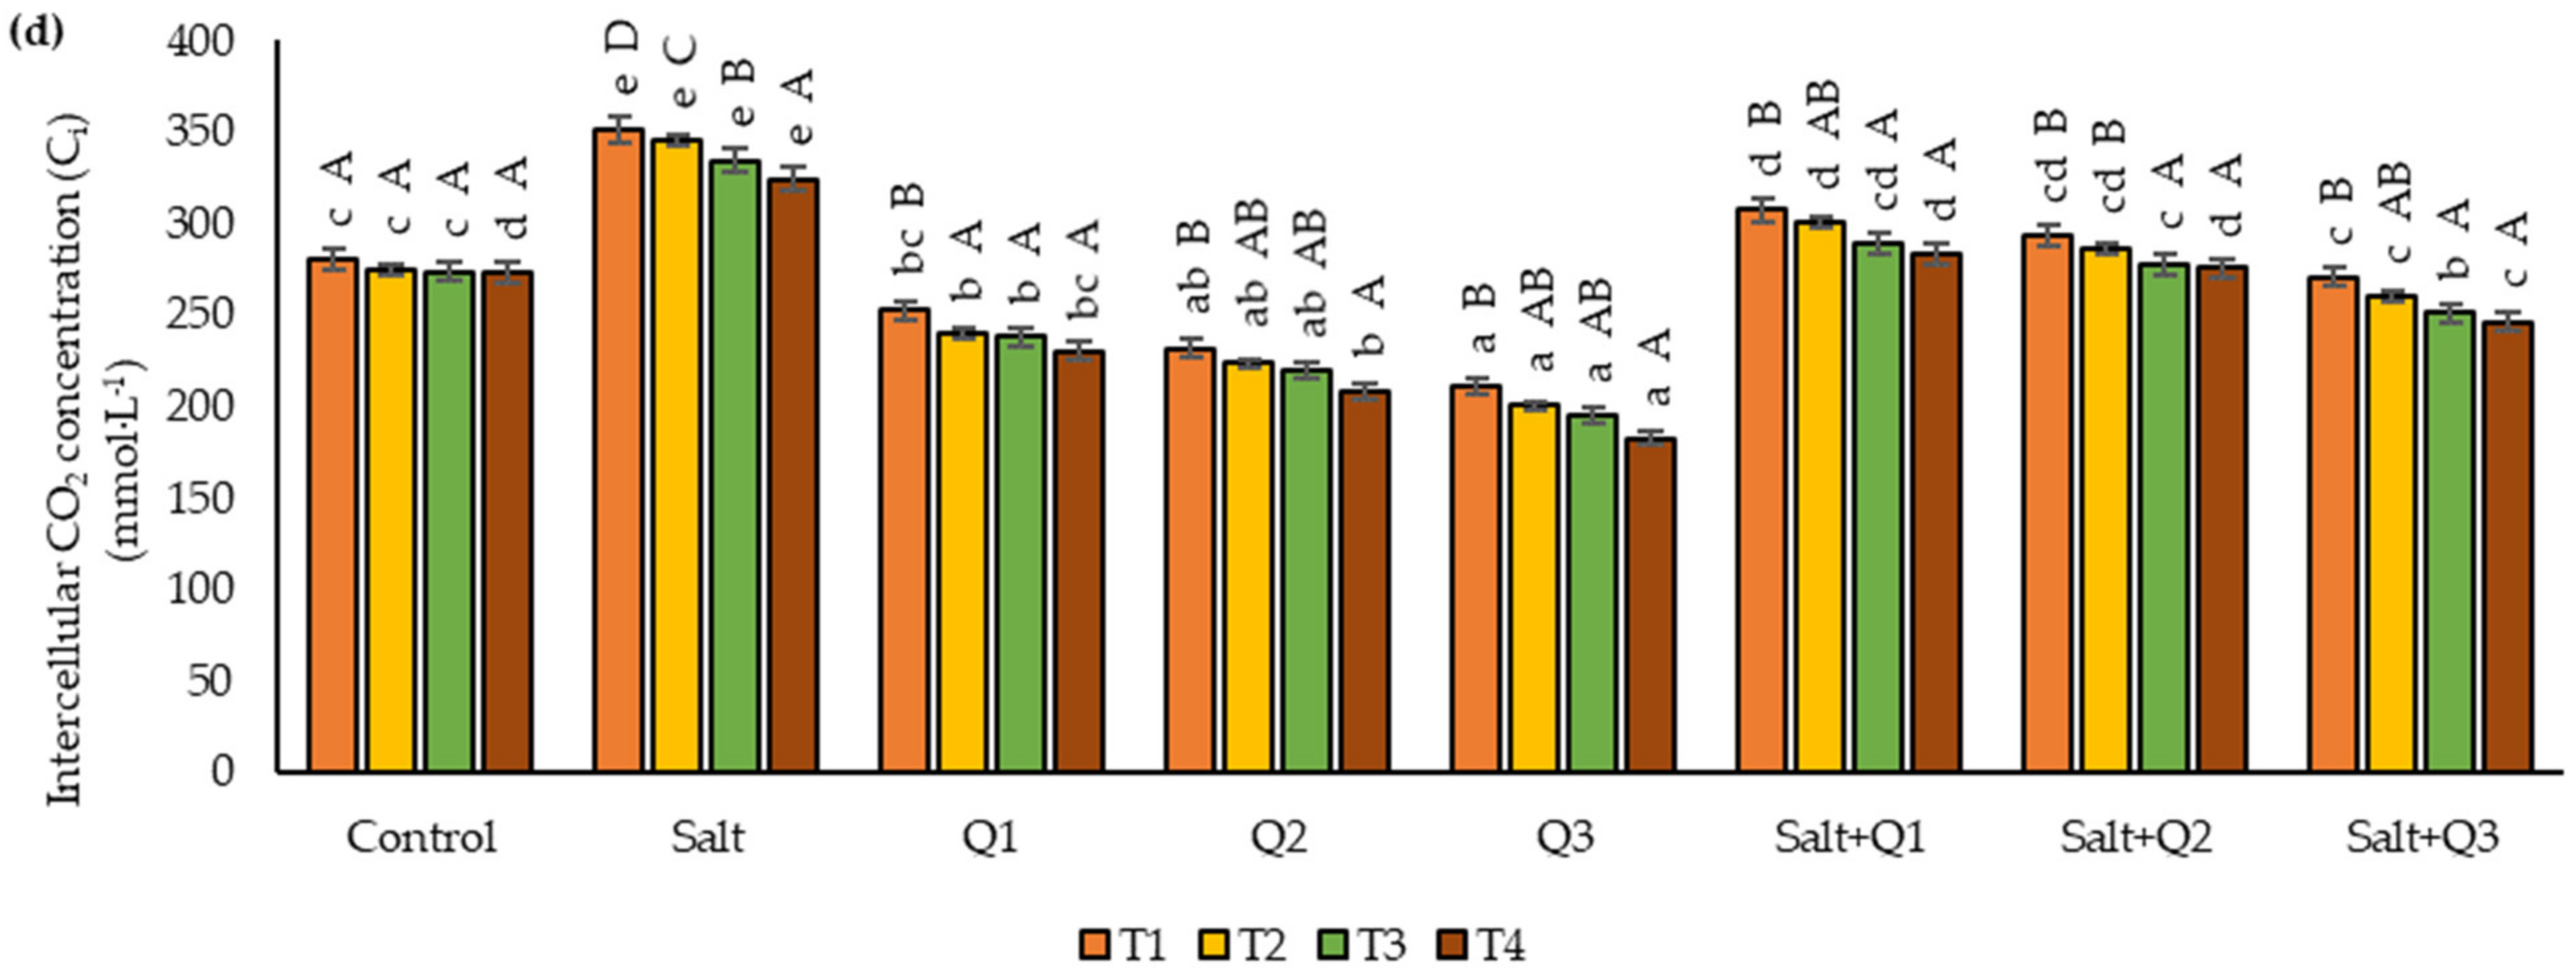
2.3.3. Gas Exchange
2.4. Measurement of Biochemical Parameters
2.4.1. Determination of the ROS Level
2.4.2. Determination of Enzyme Activity
2.5. Statistical Analysis
3. Results
3.1. Relative Chlorophyll Content
3.2. Chlorophyll Fluorescence
3.3. Gas Exchange
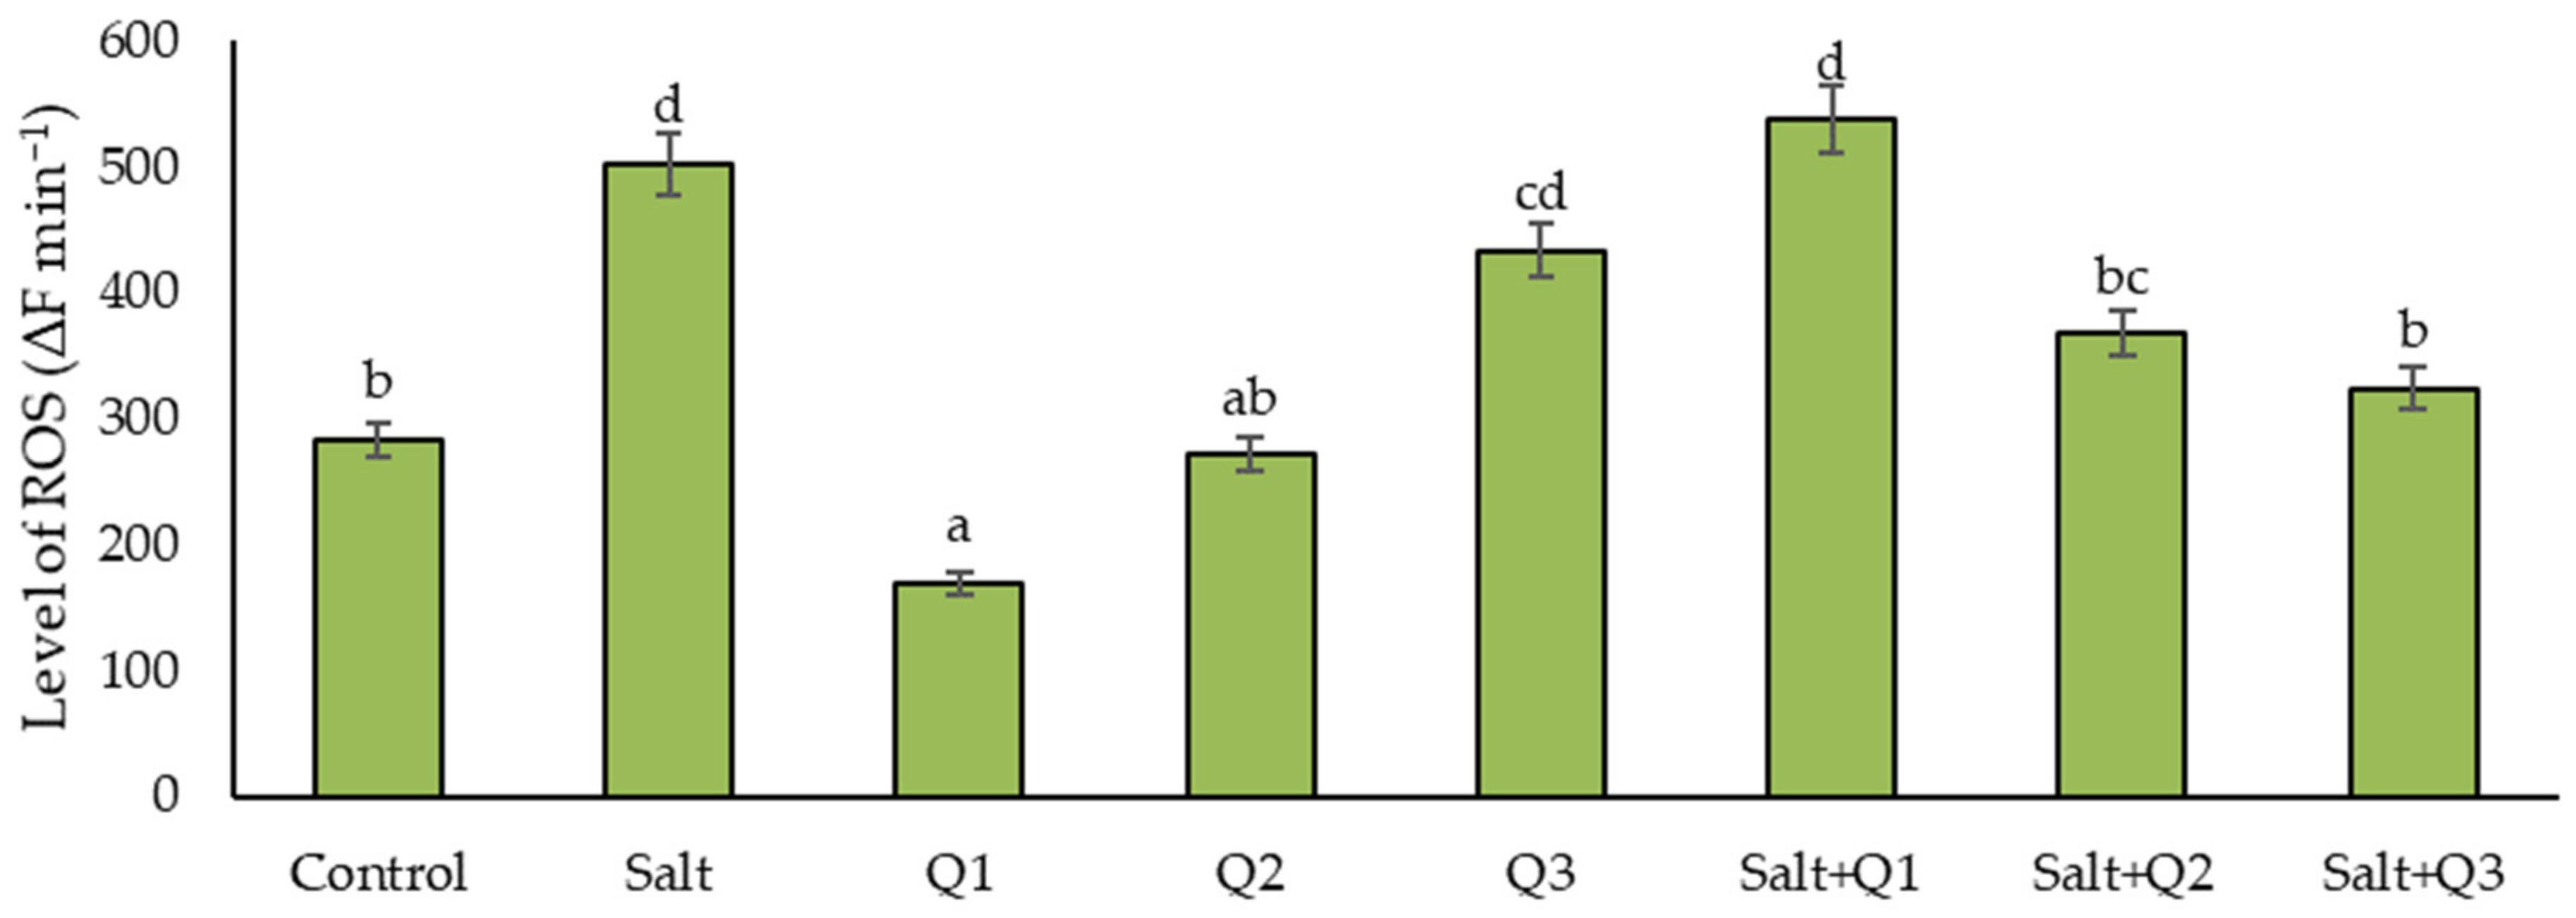
3.4. Level of ROS
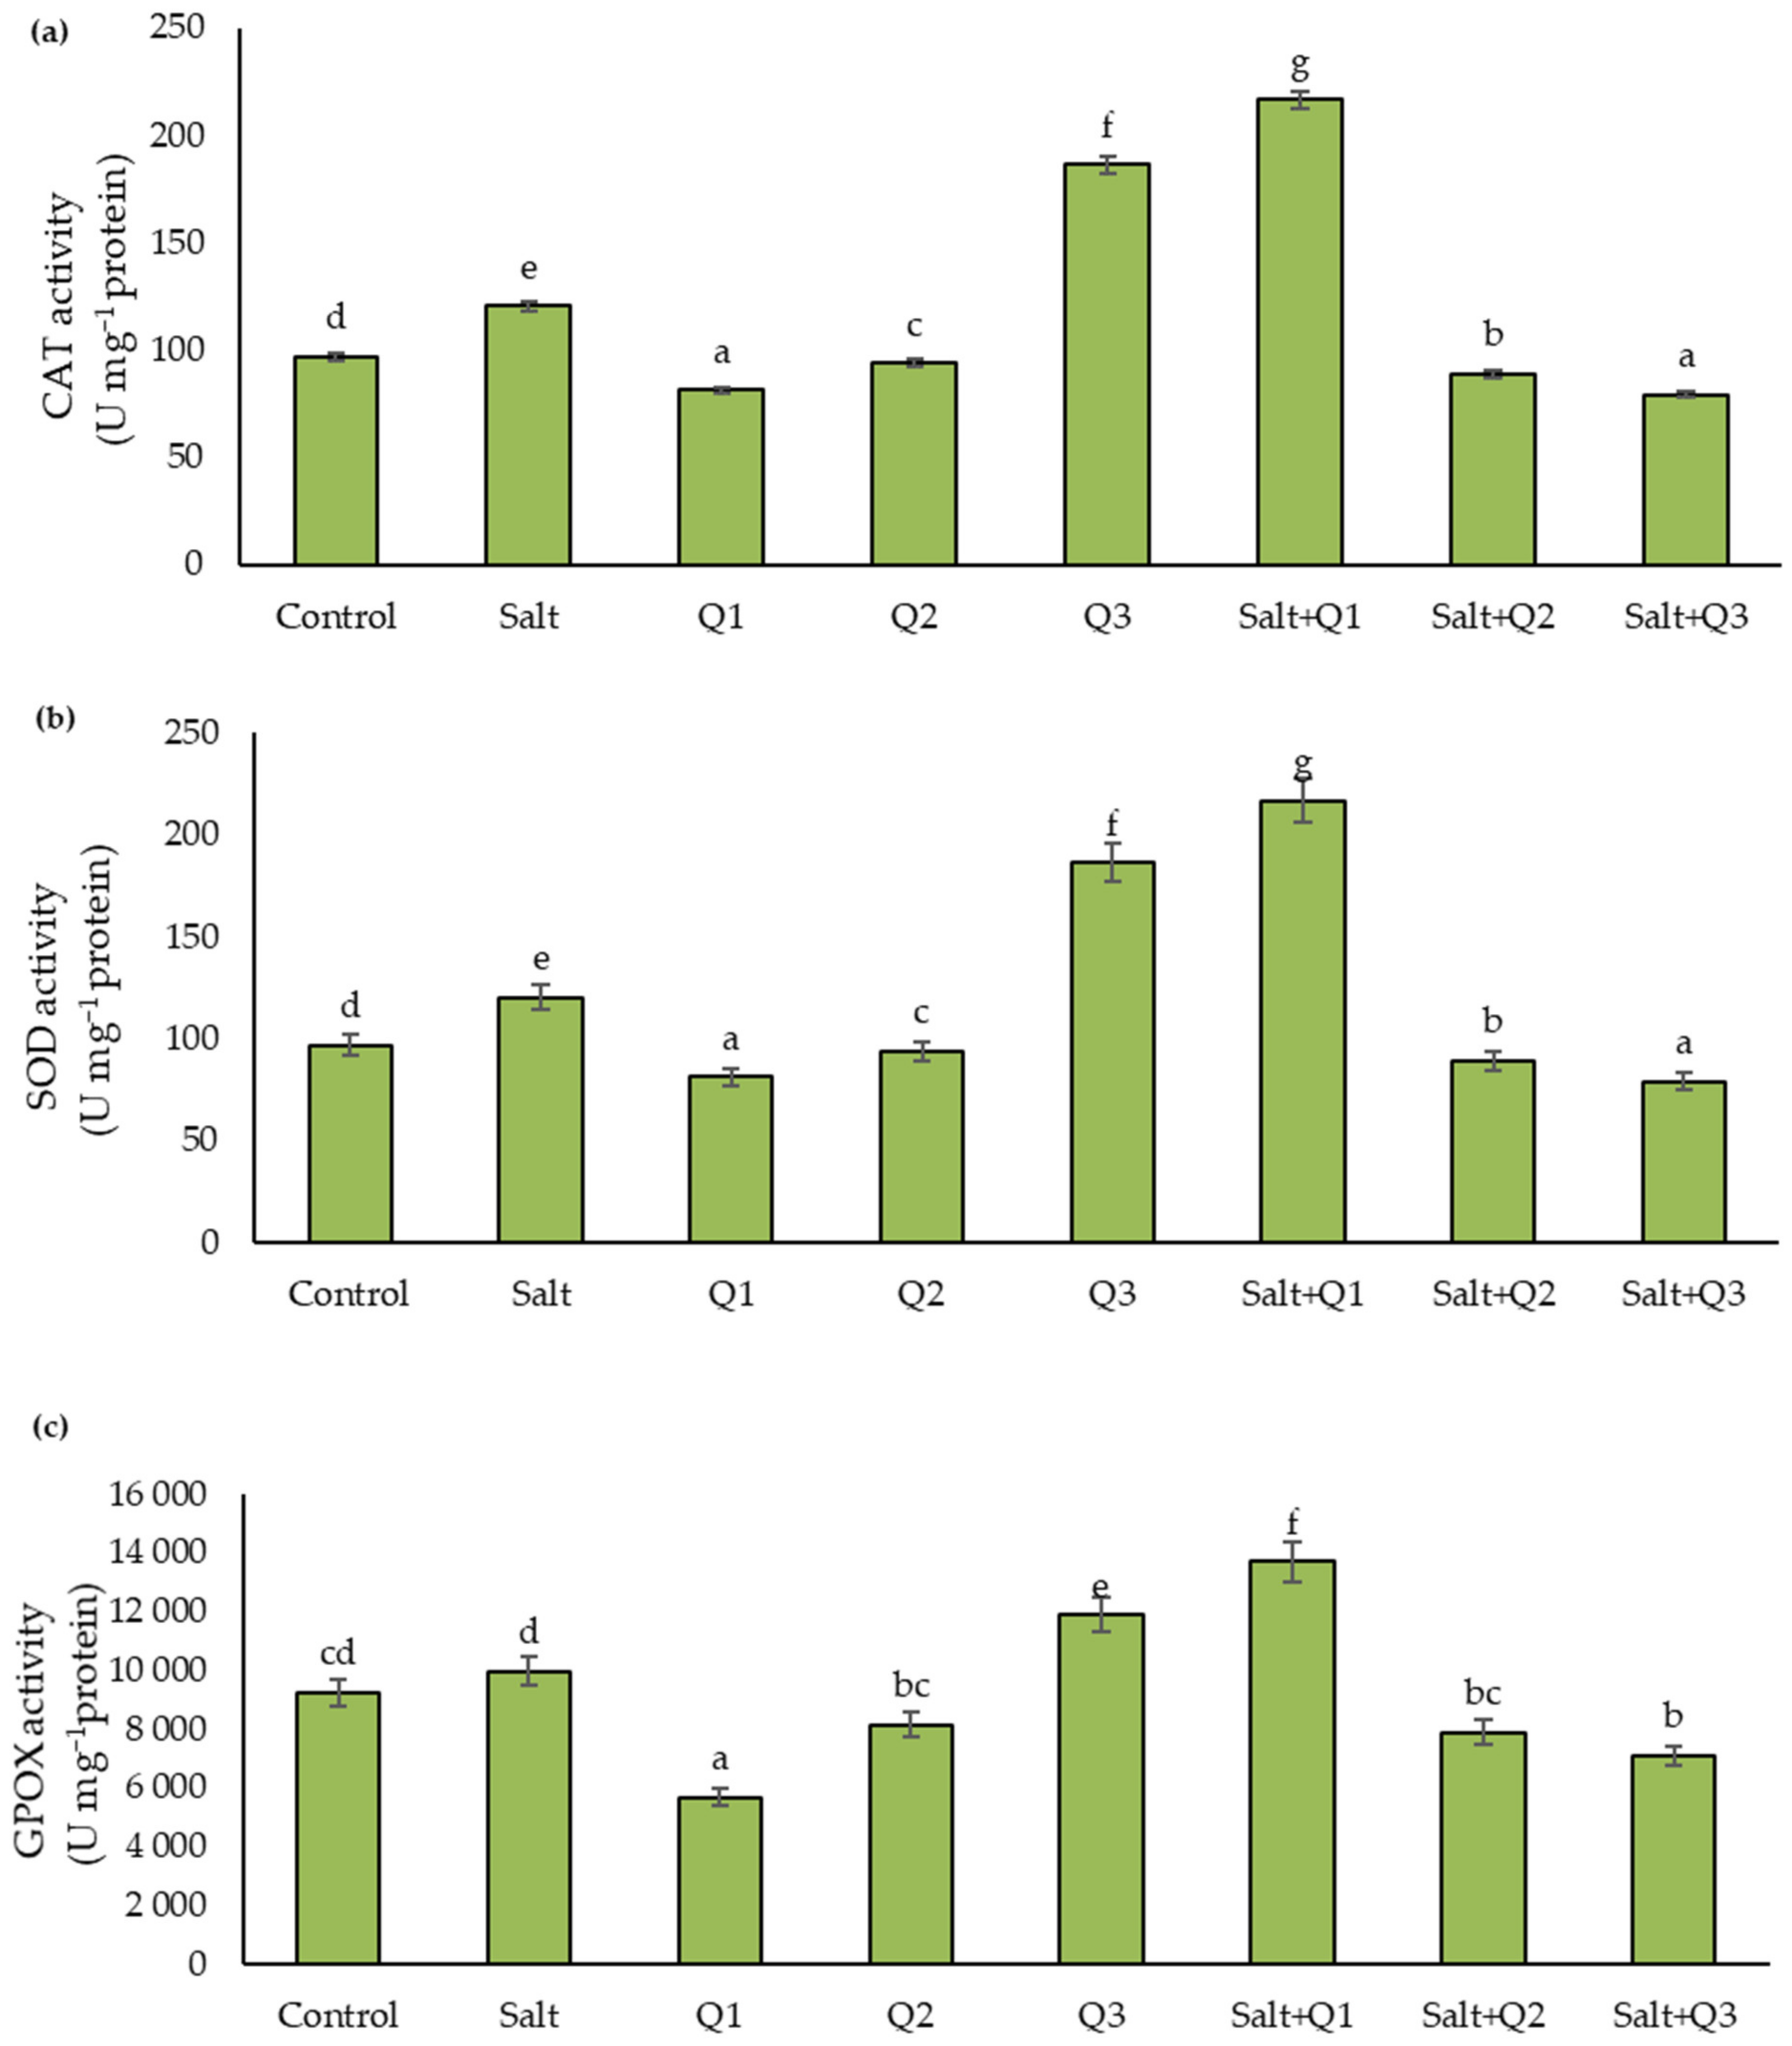
3.5. Activity of Enzymes
3.6. Regression Equation
4. Discussion
4.1. Effect of Salt Stress on Wheat Plants
4.2. Effect of Exogenous Application of Q-Cu (II) on Wheat Plants
4.2.1. Effect on Plants Not Exposed to Salt Stress
4.2.2. Effect on Plants Exposed to Salt Stress
5. Conclusions
Author Contributions
Funding
Institutional Review Board Statement
Informed Consent Statement
Data Availability Statement
Conflicts of Interest
References
- Shewry, P.R. Wheat. J. Exp. Bot. 2009, 60, 1537–1553. [Google Scholar] [CrossRef] [PubMed]
- Shewry, P.R.; Hey, S.J. The contribution of wheat to human diet and health. Food Energy Secur. 2015, 4, 178–202. [Google Scholar] [CrossRef] [PubMed]
- Thompson, L.U. Antioxidants and hormone-mediated health benefits of whole grains. Crit. Rev. Food Sci. Nutr. 1994, 34, 473–497. [Google Scholar] [CrossRef]
- Li, J.; Zhu, Y.; Yadav, M.P.; Li, J. Effect of various hydrocolloids on the physical and fermentation properties of dough. Food Chem. 2019, 271, 165–173. [Google Scholar] [CrossRef] [PubMed]
- Food and Agriculture Organization of the United Nations, F. FAOSTAT. 2016. 2016. Available online: http://www.fao.org/faostat/en/#home (accessed on 2 February 2022).
- Saddiq, M.; Iqbal, S.; Hafeez, M.; Ibrahim, A.; Raza, A.; Fatima, E.; Baloch, H.; Jahanzaib; Woodrow, P.; Ciarmiello, L. Effect of Salinity Stress on Physiological Changes in Winter and Spring Wheat. Agronomy 2021, 11, 1193. [Google Scholar] [CrossRef]
- Corwin, D.L. Climate change impacts on soil salinity in agricultural areas. Eur. J. Soil Sci. 2021, 72, 842–862. [Google Scholar] [CrossRef]
- Gupta, B.; Huang, B. Mechanism of Salinity Tolerance in Plants: Physiological, Biochemical, and Molecular Characterization. Int. J. Genom. 2014, 2014, 701596. [Google Scholar] [CrossRef] [PubMed]
- Arif, Y.; Singh, P.; Siddiqui, H.; Bajguz, A.; Hayat, S. Salinity induced physiological and biochemical changes in plants: An omic approach towards salt stress tolerance. Plant Physiol. Biochem. 2020, 156, 64–77. [Google Scholar] [CrossRef]
- Isayenkov, S.V.; Maathuis, F.J.M. Plant Salinity Stress: Many Unanswered Questions Remain. Front. Plant Sci. 2019, 10, 80. [Google Scholar] [CrossRef] [Green Version]
- James, R.A.; Blake, C.; Byrt, C.S.; Munns, R. Major genes for Na+ exclusion, Nax1 and Nax2 (wheat HKT1;4 and HKT1;5), decrease Na+ accumulation in bread wheat leaves under saline and waterlogged conditions. J. Exp. Bot. 2011, 62, 2939–2947. [Google Scholar] [CrossRef] [Green Version]
- Munns, R.; Tester, M. Mechanisms of salinity tolerance. Annu. Rev. Plant Biol. 2008, 59, 651–681. [Google Scholar] [CrossRef] [PubMed] [Green Version]
- Pan, T.; Liu, M.; Kreslavski, V.D.; Zharmukhamedov, S.K.; Nie, C.; Yu, M.; Kuznetsov, V.V.; Allakhverdiev, S.I.; Shabala, S. Non-stomatal limitation of photosynthesis by soil salinity. Crit. Rev. Environ. Sci. Technol. 2021, 51, 791–825. [Google Scholar] [CrossRef]
- Zahra, N.; Mahmood, S.; Raza, Z.A. Salinity stress on various physiological and biochemical attributes of two distinct maize (Zea mays L.) genotypes. J. Plant Nutr. 2018, 41, 1368–1380. [Google Scholar] [CrossRef]
- Oyiga, B.C.; Sharma, R.C.; Shen, J.; Baum, M.; Ogbonnaya, F.C.; Léon, J.; Ballvora, A. Identification and Characterization of Salt Tolerance of Wheat Germplasm Using a Multivariable Screening Approach. J. Agron. Crop Sci. 2016, 202, 472–485. [Google Scholar] [CrossRef]
- Wang, L.; Pan, D.; Li, J.; Tan, F.; Hoffmann-Benning, S.; Liang, W.; Chen, W. Proteomic analysis of changes in the Kandelia candel chloroplast proteins reveals pathways associated with salt tolerance. Plant Sci. 2015, 231, 159–172. [Google Scholar] [CrossRef]
- Abdelkader, A.F.; Aronsson, H.; Sundqvist, C. High salt stress in wheat leaves causes retardation of chlorophyll accumulation due to a limited rate of protochlorophyllide formation. Physiol. Plant. 2007, 130, 157–166. [Google Scholar] [CrossRef]
- Abdeshahian, M.; Nabipour, M.; Meskarbashee, M. Chlorophyll fluorescence as criterion for the diagnosis salt stress in wheat (Triticum aestivum) plants. World Acad. Sci. Eng. Technol. 2010, 71, 569–571. [Google Scholar] [CrossRef]
- Mehta, P.; Jajoo, A.; Mathur, S.; Bharti, S. Chlorophyll a fluorescence study revealing effects of high salt stress on Photosystem II in wheat leaves. Plant Physiol. Biochem. 2010, 48, 16–20. [Google Scholar] [CrossRef]
- Murata, N.; Takahashi, S.; Nishiyama, Y.; Allakhverdiev, S.I. Photoinhibition of photosystem II under environmental stress. Biochim. Biophys. Acta (BBA) Bioenerg. 2007, 1767, 414–421. [Google Scholar] [CrossRef] [Green Version]
- Kumari, A.; Parida, A. Metabolomics and network analysis reveal the potential metabolites and biological pathways involved in salinity tolerance of the halophyte Salvadora persica. Environ. Exp. Bot. 2018, 148, 85–99. [Google Scholar] [CrossRef]
- De Freitas, P.A.F.; De Carvalho, H.H.; Costa, J.H.; Miranda, R.D.S.; Saraiva, K.D.D.C.; De Oliveira, F.D.B.; Coelho, D.G.; Prisco, J.T.; Gomes-Filho, E. Salt acclimation in sorghum plants by exogenous proline: Physiological and biochemical changes and regulation of proline metabolism. Plant Cell Rep. 2019, 38, 403–416. [Google Scholar] [CrossRef] [PubMed]
- Seleiman, M.F.; Aslam, M.T.; Alhammad, B.A.; Hassan, M.U.; Maqbool, R.; Chattha, M.U.; Khan, I.; Gitari, H.I.; Uslu, O.S.; Roy, R.; et al. Salinity stress in wheat: Effects, mechanisms and management strategies. Phyton-Int. J. Exp. Bot. 2021, 91, 337. [Google Scholar] [CrossRef]
- Parihar, P.; Singh, S.; Singh, R.; Singh, V.P.; Prasad, S.M. Effect of salinity stress on plants and its tolerance strategies: A review. Environ. Sci. Pollut. Res. 2015, 22, 4056–4075. [Google Scholar] [CrossRef] [PubMed]
- Noctor, G.; Foyer, C.H. Ascorbate and glutathione: Keeping active oxygen under control. Annu. Rev. Plant Physiol. Plant Mol. Biol. 1998, 49, 249–279. [Google Scholar] [CrossRef]
- Rohman, M.M.; Talukder, M.Z.A.; Hossain, M.G.; Uddin, M.S.; Amiruzzaman, M.; Biswas, A.; Ahsan, A.F.M.S.; Chowdhury, M.A.Z. Saline sensitivity leads to oxidative stress and increases the antioxidants in presence of proline and betaine in maize (Zea mays L.) inbred. Plant Omics. J. 2016, 9, 35–47. [Google Scholar]
- Rohman, M.; Islam, R.; Monsur, M.B.; Amiruzzaman, M.; Fujita, M.; Hasanuzzaman, M. Trehalose Protects Maize Plants from Salt Stress and Phosphorus Deficiency. Plants 2019, 8, 568. [Google Scholar] [CrossRef] [Green Version]
- De Azevedo Neto, A.D.; Prisco, J.T.; Enéas-Filho, J.; de Abreu, C.E.B.; Gomes-Filho, E. Effect of salt stress on antioxidative enzymes and lipid peroxidation in leaves and roots of salt-tolerant and salt-sensitive maize genotypes. Environ. Exp. Bot. 2006, 56, 87–94. [Google Scholar] [CrossRef]
- Hasanuzzaman, M.; Bhuyan, M.H.M.B.; Anee, T.I.; Parvin, K.; Nahar, K.; Mahmud, J.A.; Fujita, M. Regulation of Ascorbate-Glutathione Pathway in Mitigating Oxidative Damage in Plants under Abiotic Stress. Antioxidants 2019, 8, 384. [Google Scholar] [CrossRef] [Green Version]
- Feng, K.; Yu, J.; Cheng, Y.; Ruan, M.; Wang, R.; Ye, Q.; Zhou, G.; Li, Z.; Yao, Z.; Yang, Y.; et al. The SOD Gene Family in Tomato: Identification, Phylogenetic Relationships, and Expression Patterns. Front. Plant Sci. 2016, 7, 1279. [Google Scholar] [CrossRef] [Green Version]
- Kiani, R.; Arzani, A.; Maibody, S.A.M.M. Polyphenols, Flavonoids, and Antioxidant Activity Involved in Salt Tolerance in Wheat, Aegilops cylindrica and Their Amphidiploids. Front. Plant Sci. 2021, 12, 646221. [Google Scholar] [CrossRef]
- Şirin, S.; Aslım, B. Determination of antioxidant capacity, phenolic acid composition and antiproliferative effect associated with phenylalanine ammonia lyase (PAL) activity in some plants naturally growing under salt stress. Med. Chem. Res. 2018, 28, 229–238. [Google Scholar] [CrossRef]
- Løvdal, T.; Olsen, K.M.; Slimestad, R.; Verheul, M.; Lillo, C. Synergetic effects of nitrogen depletion, temperature, and light on the content of phenolic compounds and gene expression in leaves of tomato. Phytochem. 2010, 71, 605–613. [Google Scholar] [CrossRef] [PubMed]
- Manzoor, M.F.; Hussain, A.; Sameen, A.; Sahar, A.; Khan, S.; Siddique, R.; Aadil, R.M.; Xu, B. Novel extraction, rapid assessment and bioavailability improvement of quercetin: A review. Ultrason. Sonochemistry 2021, 78, 105686. [Google Scholar] [CrossRef]
- Torreggiani, A.; Tamba, M.; Trinchero, A.; Bonora, S. Copper(II)–Quercetin complexes in aqueous solutions: Spectroscopic and kinetic properties. J. Mol. Struct. 2005, 744–747, 759–766. [Google Scholar] [CrossRef]
- Bukhari, S.B.; Memon, S.; Mahroof-Tahir, M.; Bhanger, M. Synthesis, characterization and antioxidant activity copper–quercetin complex. Spectrochim. Acta Part A: Mol. Biomol. Spectrosc. 2009, 71, 1901–1906. [Google Scholar] [CrossRef]
- Shabbir, Z.; Sardar, A.; Shabbir, A.; Abbas, G.; Shamshad, S.; Khalid, S.; Natasha; Murtaza, G.; Dumat, C.; Shahid, M. Copper uptake, essentiality, toxicity, detoxification and risk assessment in soil-plant environment. Chemosphere 2020, 259, 127436. [Google Scholar] [CrossRef]
- Singh, P.; Arif, Y.; Bajguz, A.; Hayat, S. The role of quercetin in plants. Plant Physiol. Biochem. 2021, 166, 10–19. [Google Scholar] [CrossRef]
- Jańczak-Pieniążek, M.; Migut, D.; Piechowiak, T.; Buczek, J.; Balawejder, M. The Effect of Exogenous Application of Quercetin Derivative Solutions on the Course of Physiological and Biochemical Processes in Wheat Seedlings. Int. J. Mol. Sci. 2021, 22, 6882. [Google Scholar] [CrossRef]
- IUSS Working Group WRB. International soil classification system for naming soils and creating legends for soil maps. In Word Reference Base for Soil Resources 2014, Update 2015; Word Soil Resources Reports No. 106; FAO: Rome, Italy, 2015; pp. 172–173. Available online: https://www.iuss.org/archived-content/archived-int-year-of-soils-2015/archived-working-groups-for-iys/working-group-world-reference-base-for-soil-resources-wrb/ (accessed on 9 February 2022).
- BBCH Working Group. Growth Stages of Mono-and Dicotyledonous Plants, 2nd ed.; Meier, U., Ed.; Federal Biological Research Centre for Agriculture and Forestry: Bonn, Germany, 2001. Available online: https://www.politicheagricole.it/flex/AppData/WebLive/Agrometeo/MIEPFY800/BBCHengl2001.pdf (accessed on 2 July 2010).
- Maxwell, K.; Johnson, G.N. Chlorophyll fluorescence—A practical guide. J. Exp. Bot. 2000, 51, 659–668. [Google Scholar] [CrossRef]
- Strasser, R.J.; Tsimilli-Michael, M.; Srivastava, A. Analysis of the chlorophyll a fluorescence transient. In Chlorophyll a Fluorescence: A Signature of Photosynthesis; Papageorgiou, G.C., Govindjee, Eds.; Springer: Dordrecht, The Netherlands, 2004; pp. 321–362. [Google Scholar] [CrossRef]
- Piechowiak, T.; Balawejder, M. Impact of ozonation process on the level of selected oxidative stress markers in raspberries stored at room temperature. Food Chem. 2019, 298, 125093. [Google Scholar] [CrossRef]
- Hadwan, M.H.; Ali, S.K. New spectrophotometric assay for assessments of catalase activity in biological samples. Anal. Biochem. 2018, 542, 29–33. [Google Scholar] [CrossRef] [PubMed]
- Uarrota, V.G.; Moresco, R.; Schmidt, E.C.; Bouzon, Z.L.; Nunes, E.D.C.; Neubert, E.D.O.; Peruch, L.; Rocha, M.; Maraschin, M. The role of ascorbate peroxidase, guaiacol peroxidase, and polysaccharides in cassava ( Manihot esculenta Crantz) roots under postharvest physiological deterioration. Food Chem. 2016, 197, 737–746. [Google Scholar] [CrossRef] [PubMed] [Green Version]
- Kruger, N.J. The Bradford method for protein quantitation. In The Protein Protocols Handbook. Springer Protocols Handbooks; Walker, J.M., Ed.; Humana Press: Totowa, NJ, USA, 2009; pp. 17–24. [Google Scholar]
- Tsai, Y.-C.; Chen, K.-C.; Cheng, T.-S.; Lee, C.; Lin, S.-H.; Tung, C.-W. Chlorophyll fluorescence analysis in diverse rice varieties reveals the positive correlation between the seedlings salt tolerance and photosynthetic efficiency. BMC Plant Biol. 2019, 19, 403. [Google Scholar] [CrossRef] [Green Version]
- Baker, N.R. Applications of chlorophyll fluorescence can improve crop production strategies: An examination of future possibilities. J. Exp. Bot. 2004, 55, 1607–1621. [Google Scholar] [CrossRef] [Green Version]
- Wang, R.L.; Hua, C.; Zhou, F.; Zhou, Q.-C. Effects of NaCl stress on photochemical activity and thylakoid membrane polypeptide composition of a salt-tolerant and a salt-sensitive rice cultivar. Photosynthetica 2009, 47, 125–127. [Google Scholar] [CrossRef]
- Zw, S.; Lk, R.; Jw, F.; Li, Q.; Kj, W.; Mm, G.; Wang, L.; Li, J.; Gx, Z.; Zy, Y.; et al. Salt response of photosynthetic electron transport system in wheat cultivars with contrasting tolerance. Plant Soil Environ. 2016, 62, 515–521. [Google Scholar] [CrossRef] [Green Version]
- Kanwal, H.; Ashraf, M.; Shahbaz, M. Assessment of salt tolerance of some newly developed and candidate wheat (Triticum aestivum L.) cultivars using gas exchange and chlorophyll fluorescence attributes. Pak. J. Bot. 2011, 43, 2693–2699. [Google Scholar]
- Chaves, M.M.; Flexas, J.; Pinheiro, C. Photosynthesis under drought and salt stress: Regulation mechanisms from whole plant to cell. Ann. Bot. 2009, 103, 551–560. [Google Scholar] [CrossRef] [Green Version]
- Guo, R.; Yang, Z.; Li, F.; Yan, C.; Zhong, X.; Liu, Q.; Xia, X.; Li, H.; Zhao, L. Comparative metabolic responses and adaptive strategies of wheat (Triticum aestivum) to salt and alkali stress. BMC Plant Biol. 2015, 15, 170. [Google Scholar] [CrossRef] [Green Version]
- Wang, Y.; Stevanato, P.; Yu, L.; Zhao, H.; Sun, X.; Sun, F.; Li, J.; Geng, G. The physiological and metabolic changes in sugar beet seedlings under different levels of salt stress. J. Plant Res. 2017, 130, 1079–1093. [Google Scholar] [CrossRef]
- Elkelish, A.A.; Soliman, M.H.; Alhaithloul, H.A.; El-Esawi, M.A. Selenium protects wheat seedlings against salt stress-mediated oxidative damage by up-regulating antioxidants and osmolytes metabolism. Plant Physiol. Biochem. 2019, 137, 144–153. [Google Scholar] [CrossRef] [PubMed]
- Parvin, K.; Hasanuzzaman, M.; Bhuyan, M.H.M.B.; Mohsin, S.M.; Fujita, A.M. Quercetin Mediated Salt Tolerance in Tomato through the Enhancement of Plant Antioxidant Defense and Glyoxalase Systems. Plants 2019, 8, 247. [Google Scholar] [CrossRef] [PubMed] [Green Version]
- Migut, D.; Jańczak-Pieniążek, M.; Piechowiak, T.; Buczek, J.; Balawejder, M. Physiological Response of Maize Plants (Zea mays L.) to the Use of the Potassium Quercetin Derivative. Int. J. Mol. Sci. 2021, 22, 7384. [Google Scholar] [CrossRef]
- Dobrikova, A.G.; Apostolova, E.L. Damage and protection of the photosynthetic apparatus from UV-B radiation. II. Effect of quercetin at different pH. J. Plant Physiol. 2015, 184, 98–105. [Google Scholar] [CrossRef]
- Yildiztugay, E.; Ozfidan-Konakci, C.; Kucukoduk, M.; Turkan, I. Flavonoid Naringenin Alleviates Short-Term Osmotic and Salinity Stresses Through Regulating Photosynthetic Machinery and Chloroplastic Antioxidant Metabolism in Phaseolus vulgaris. Front. Plant Sci. 2020, 11, 682. [Google Scholar] [CrossRef] [PubMed]
- Kobylińska, A. Exogenous quercetin as a proliferation stimulator in tobacco BY-2 cells. J. Elementology 2012, 22, 245–258. [Google Scholar] [CrossRef]
- Brunetti, C.; Fini, A.; Sebastiani, F.; Gori, A.; Tattini, M. Modulation of Phytohormone Signaling: A Primary Function of Flavonoids in Plant–Environment Interactions. Front. Plant Sci. 2018, 9, 1042. [Google Scholar] [CrossRef] [PubMed] [Green Version]
- Agati, G.; Stefano, G.; Biricolti, S.; Tattini, M. Mesophyll distribution of ‘antioxidant’ flavonoid glycosides in Ligustrum vulgare leaves under contrasting sunlight irradiance. Ann. Bot. 2009, 104, 853–861. [Google Scholar] [CrossRef] [Green Version]
- Agati, G.; Biricolti, S.; Guidi, L.; Ferrini, F.; Fini, A.; Tattini, M. The biosynthesis of flavonoids is enhanced similarly by UV radiation and root zone salinity in L. vulgare leaves. J. Plant Physiol. 2011, 168, 204–212. [Google Scholar] [CrossRef]
- Pękal, A.; Biesaga, M.; Pyrzynska, K. Interaction of quercetin with copper ions: Complexation, oxidation and reactivity towards radicals. BioMetals 2010, 24, 41–49. [Google Scholar] [CrossRef]
- Leng, P.; Yuan, B.; Guo, Y. The role of abscisic acid in fruit ripening and responses to abiotic stress. J. Exp. Bot. 2013, 65, 4577–4588. [Google Scholar] [CrossRef] [PubMed]
- Danquah, A.; de Zelicourt, A.; Colcombet, J.; Hirt, H. The role of ABA and MAPK signaling pathways in plant abiotic stress responses. Biotechnol. Adv. 2014, 32, 40–52. [Google Scholar] [CrossRef] [PubMed]
- Kurepa, J.; Shull, T.E.; Smalle, J.A. Quercetin feeding protects plants against oxidative stress. F1000Research 2016, 5, 2430. [Google Scholar] [CrossRef] [Green Version]
- Mierziak, J.; Kostyn, K.; Kulma, A. Flavonoids as Important Molecules of Plant Interactions with the Environment. Molecules 2014, 19, 16240–16265. [Google Scholar] [CrossRef] [PubMed]

| Parameters | Regression Equation | R2 | |
|---|---|---|---|
| CCL | y = 31.007 ***−15.164 salt stress *** + 6.284 concentration *** + 2.980 term *** | 0.939 | |
| Chlorophyll Fluorescence | Fv/Fm | y = 0.804 *** + 0.010 concentration ***−0.016 salt stress *** + 0.002 term *** | 0.919 |
| Fv/F0 | y = 4.031 *** + 0.356 concentration ***−0.600 salt stress *** + 0.141 term *** | 0.931 | |
| PI | y = 8.702 ***−3.825 salt stress *** + 1.455 concentration *** + 0.260 term | 0.885 | |
| Gas Exchange | PN | y = 5.101 *** + 0.674 concentration ***−1.244 salt stress *** + 0.247 term *** | 0.886 |
| gs | y= 0.080 ***+ 0.033 concentration ***−0.074 salt stress ***+ 0.013 term *** | 0.892 | |
| E | y = 0.899 *** + 0.231 concentration ***−0.429 salt stress *** + 0.109 term *** | 0.918 | |
| Ci | y = 289.875 *** + 60.125 salt stress ***−25.563 concentration ***−7.188 term *** | 0.977 | |
| ROS | y = 289.134 *** + 143.379 salt stress ** | 0.325 | |
| Activity of Enzymes | CAT | A regression model has not been identified | |
| SOD | A regression model has not been identified | ||
| GPOX | A regression model has not been identified | ||
Publisher’s Note: MDPI stays neutral with regard to jurisdictional claims in published maps and institutional affiliations. |
© 2022 by the authors. Licensee MDPI, Basel, Switzerland. This article is an open access article distributed under the terms and conditions of the Creative Commons Attribution (CC BY) license (https://creativecommons.org/licenses/by/4.0/).
Share and Cite
Jańczak-Pieniążek, M.; Migut, D.; Piechowiak, T.; Balawejder, M. Assessment of the Impact of the Application of a Quercetin—Copper Complex on the Course of Physiological and Biochemical Processes in Wheat Plants (Triticum aestivum L.) Growing under Saline Conditions. Cells 2022, 11, 1141. https://doi.org/10.3390/cells11071141
Jańczak-Pieniążek M, Migut D, Piechowiak T, Balawejder M. Assessment of the Impact of the Application of a Quercetin—Copper Complex on the Course of Physiological and Biochemical Processes in Wheat Plants (Triticum aestivum L.) Growing under Saline Conditions. Cells. 2022; 11(7):1141. https://doi.org/10.3390/cells11071141
Chicago/Turabian StyleJańczak-Pieniążek, Marta, Dagmara Migut, Tomasz Piechowiak, and Maciej Balawejder. 2022. "Assessment of the Impact of the Application of a Quercetin—Copper Complex on the Course of Physiological and Biochemical Processes in Wheat Plants (Triticum aestivum L.) Growing under Saline Conditions" Cells 11, no. 7: 1141. https://doi.org/10.3390/cells11071141
APA StyleJańczak-Pieniążek, M., Migut, D., Piechowiak, T., & Balawejder, M. (2022). Assessment of the Impact of the Application of a Quercetin—Copper Complex on the Course of Physiological and Biochemical Processes in Wheat Plants (Triticum aestivum L.) Growing under Saline Conditions. Cells, 11(7), 1141. https://doi.org/10.3390/cells11071141