
Scrutinizing Mechanisms of the ‘Obesity Paradox in Sepsis’: Obesity Is Accompanied by Diminished Formation of Neutrophil Extracellular Traps (NETs) Due to Restricted Neutrophil–Platelet Interactions

 , , , and
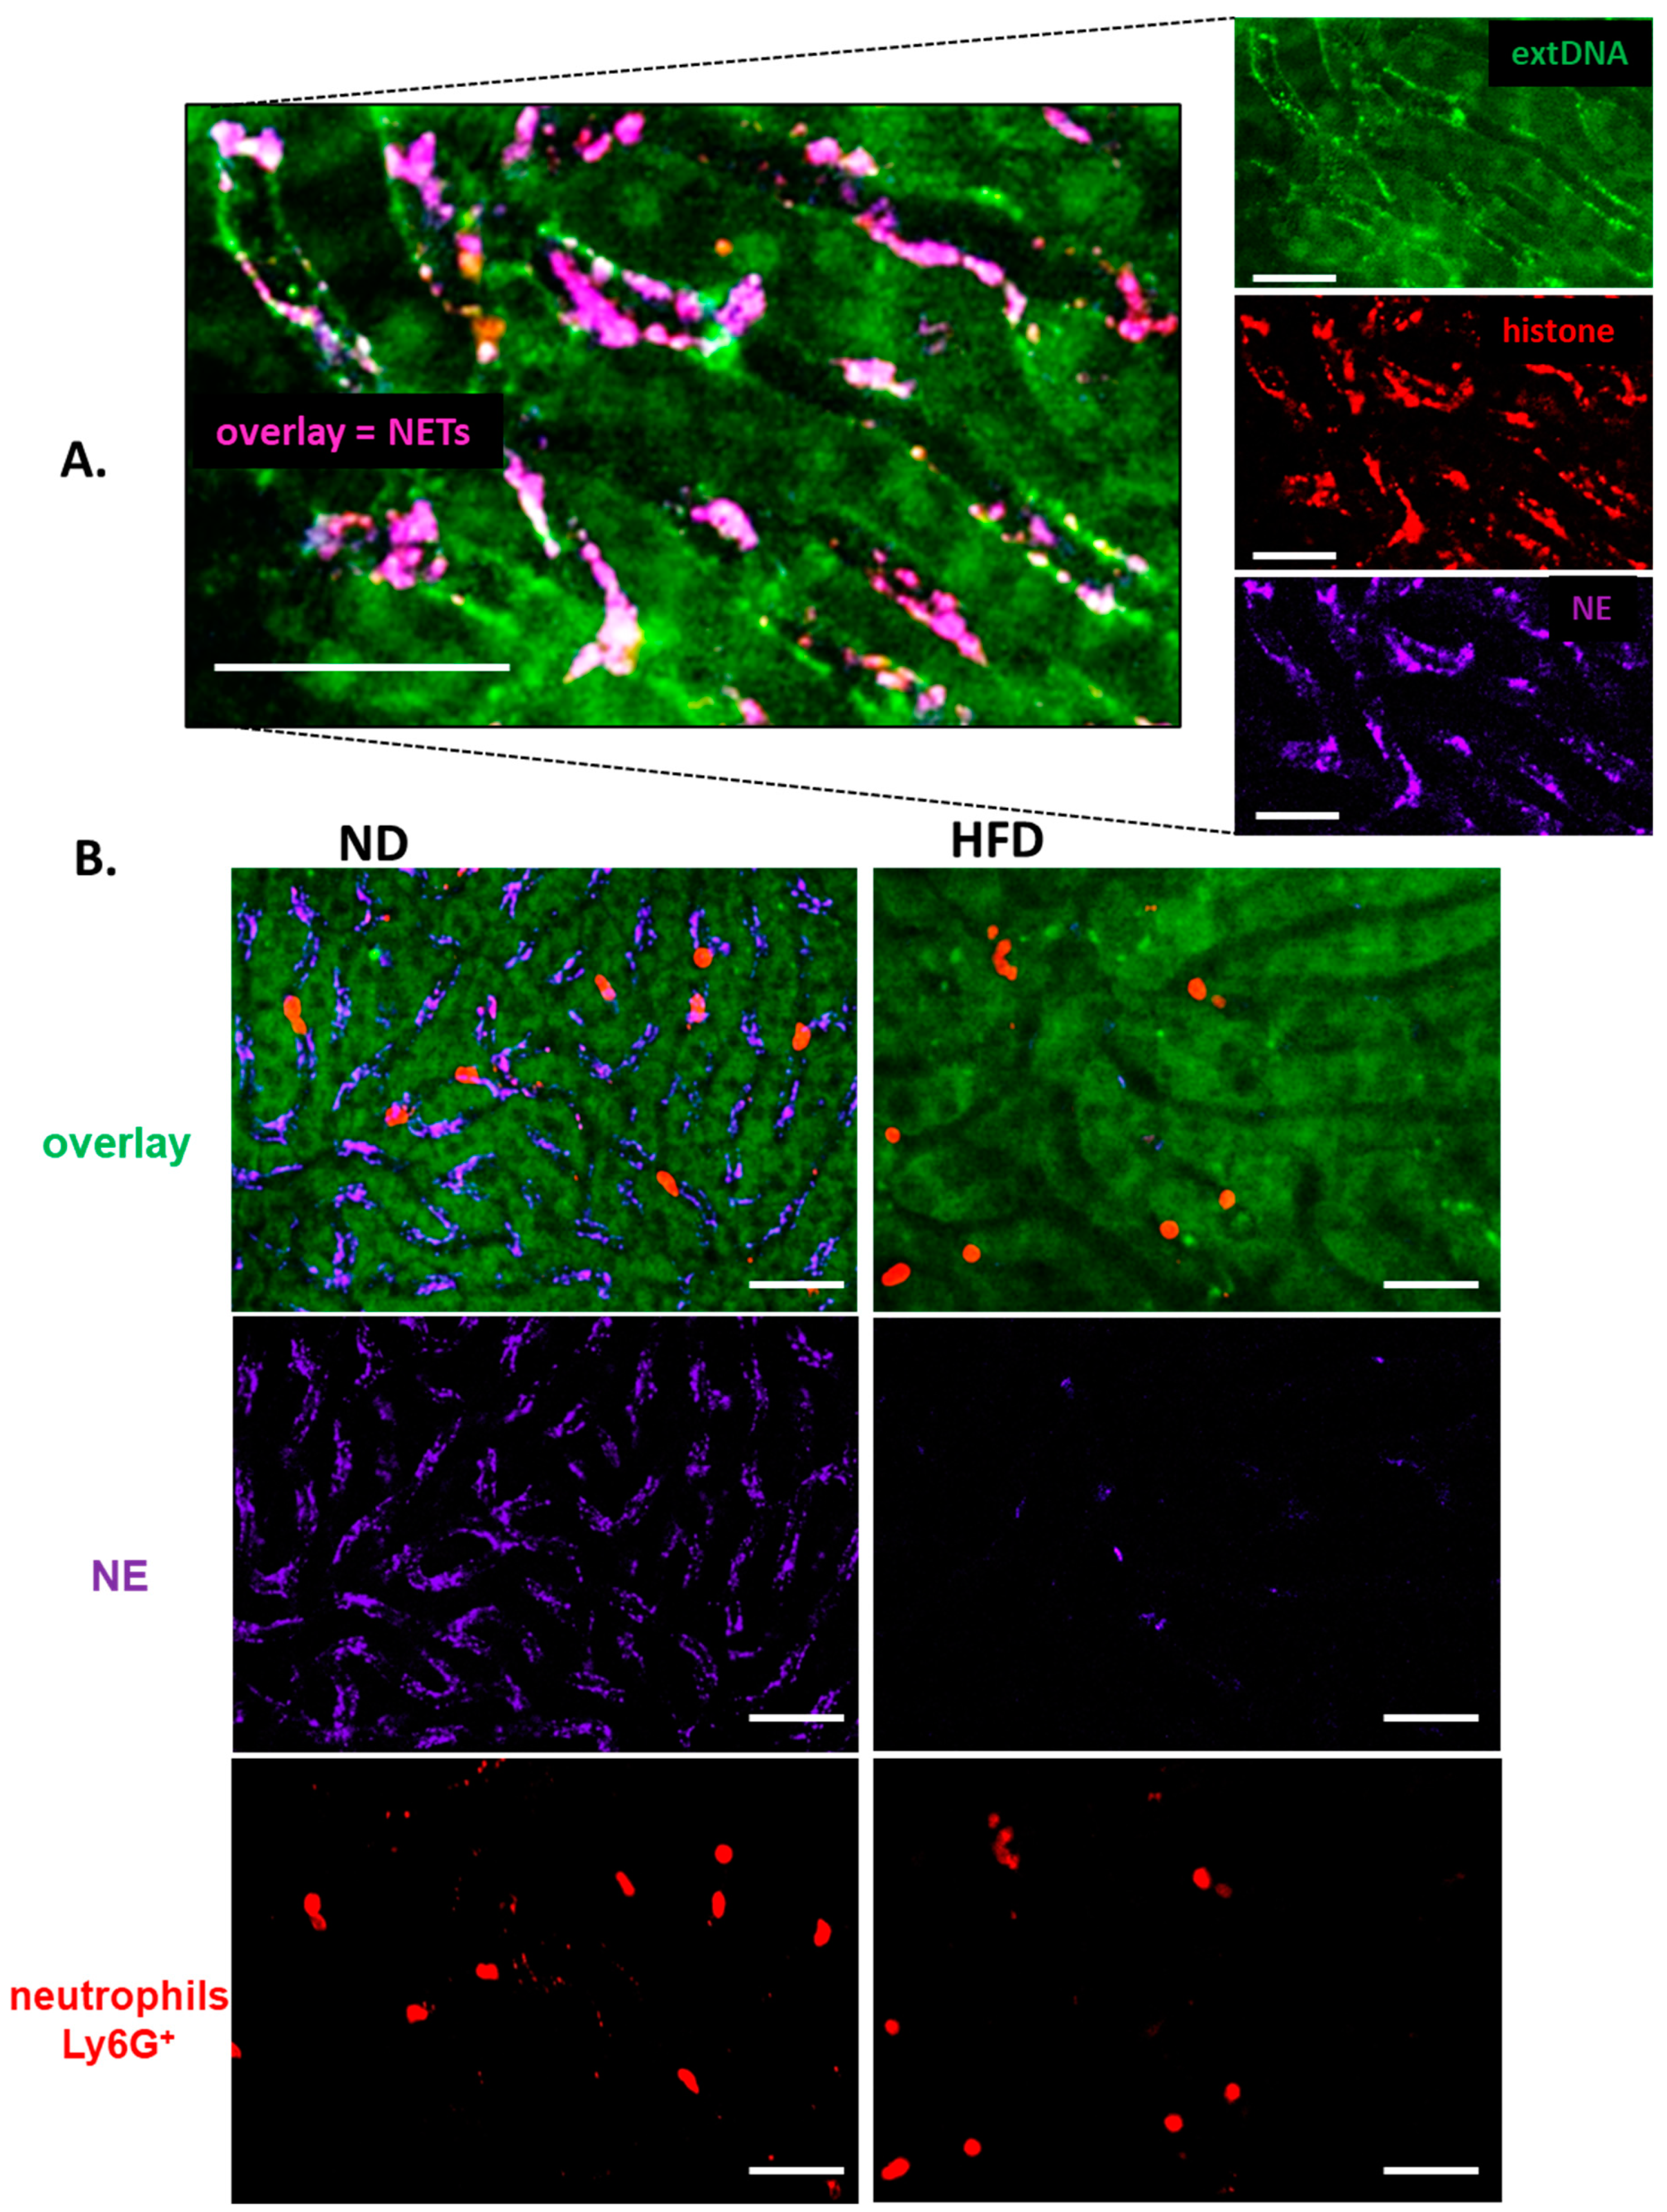
Abstract
1. Introduction
2. Materials and Methods
2.1. Diet- and Genetic-Driven Models of Obesity
2.2. Systemic Inflammation Models: Endotoxemia and S. aureus-Induced Sepsis
2.3. ADAMTS13 and DNase Treatment
2.4. Recombinant Leptin and Leptin Neutralizing Antibody Treatments
2.5. CXCR2 Chemokine Receptor Antagonist Treatment
2.6. IL-33 Neutralizing Antibody
2.7. Preparation of the Mouse Liver for Intravital Microscopy
2.8. Preparation of the Adipose Tissue for Intravital Microscopy
2.9. Spinning Disk Confocal Intravital Microscopy (SD-IVM)
2.10. 3D Reconstruction of Liver Cross-Sections
2.11. NET Formation Analyses In Vivo
2.12. Neutrophil, Kupffer Cell and Platelet Quantification In Vivo
2.13. Estimation of Platelet Interactions with Neutrophils and Kupffer Cells
2.14. Platelets Isolation and Transfusion
2.15. P-Selectin Blocking Experiments
2.16. NET Formation Analyses Ex Vivo
2.17. Neutrophil Elastase Activity
2.18. Alanine Transaminase (ALT) Activity
2.19. Triglyceride, Cholesterol, Glucose, and Leptin Levels
2.20. Flow Cytometry
2.21. Cytokine Measurement
2.22. Statistical Analyses
3. Results
3.1. Metabolic Shift in Obese Mice
3.2. Liver Is Affected in Obese Mice
3.3. Formation of NETs in Liver Sinusoids Is Impaired in Obese Mice
3.4. Neutrophil Counts in the Adipose Tissue and Blood versus Peripheral Tissues
3.5. Involvement of CXCR2, Leptin, and IL-33 in Neutrophil Influx and Casting of NETs
3.6. Weaker NET Formation by Neutrophils of Obese Mice Does Not Result from Intrinsic Defects
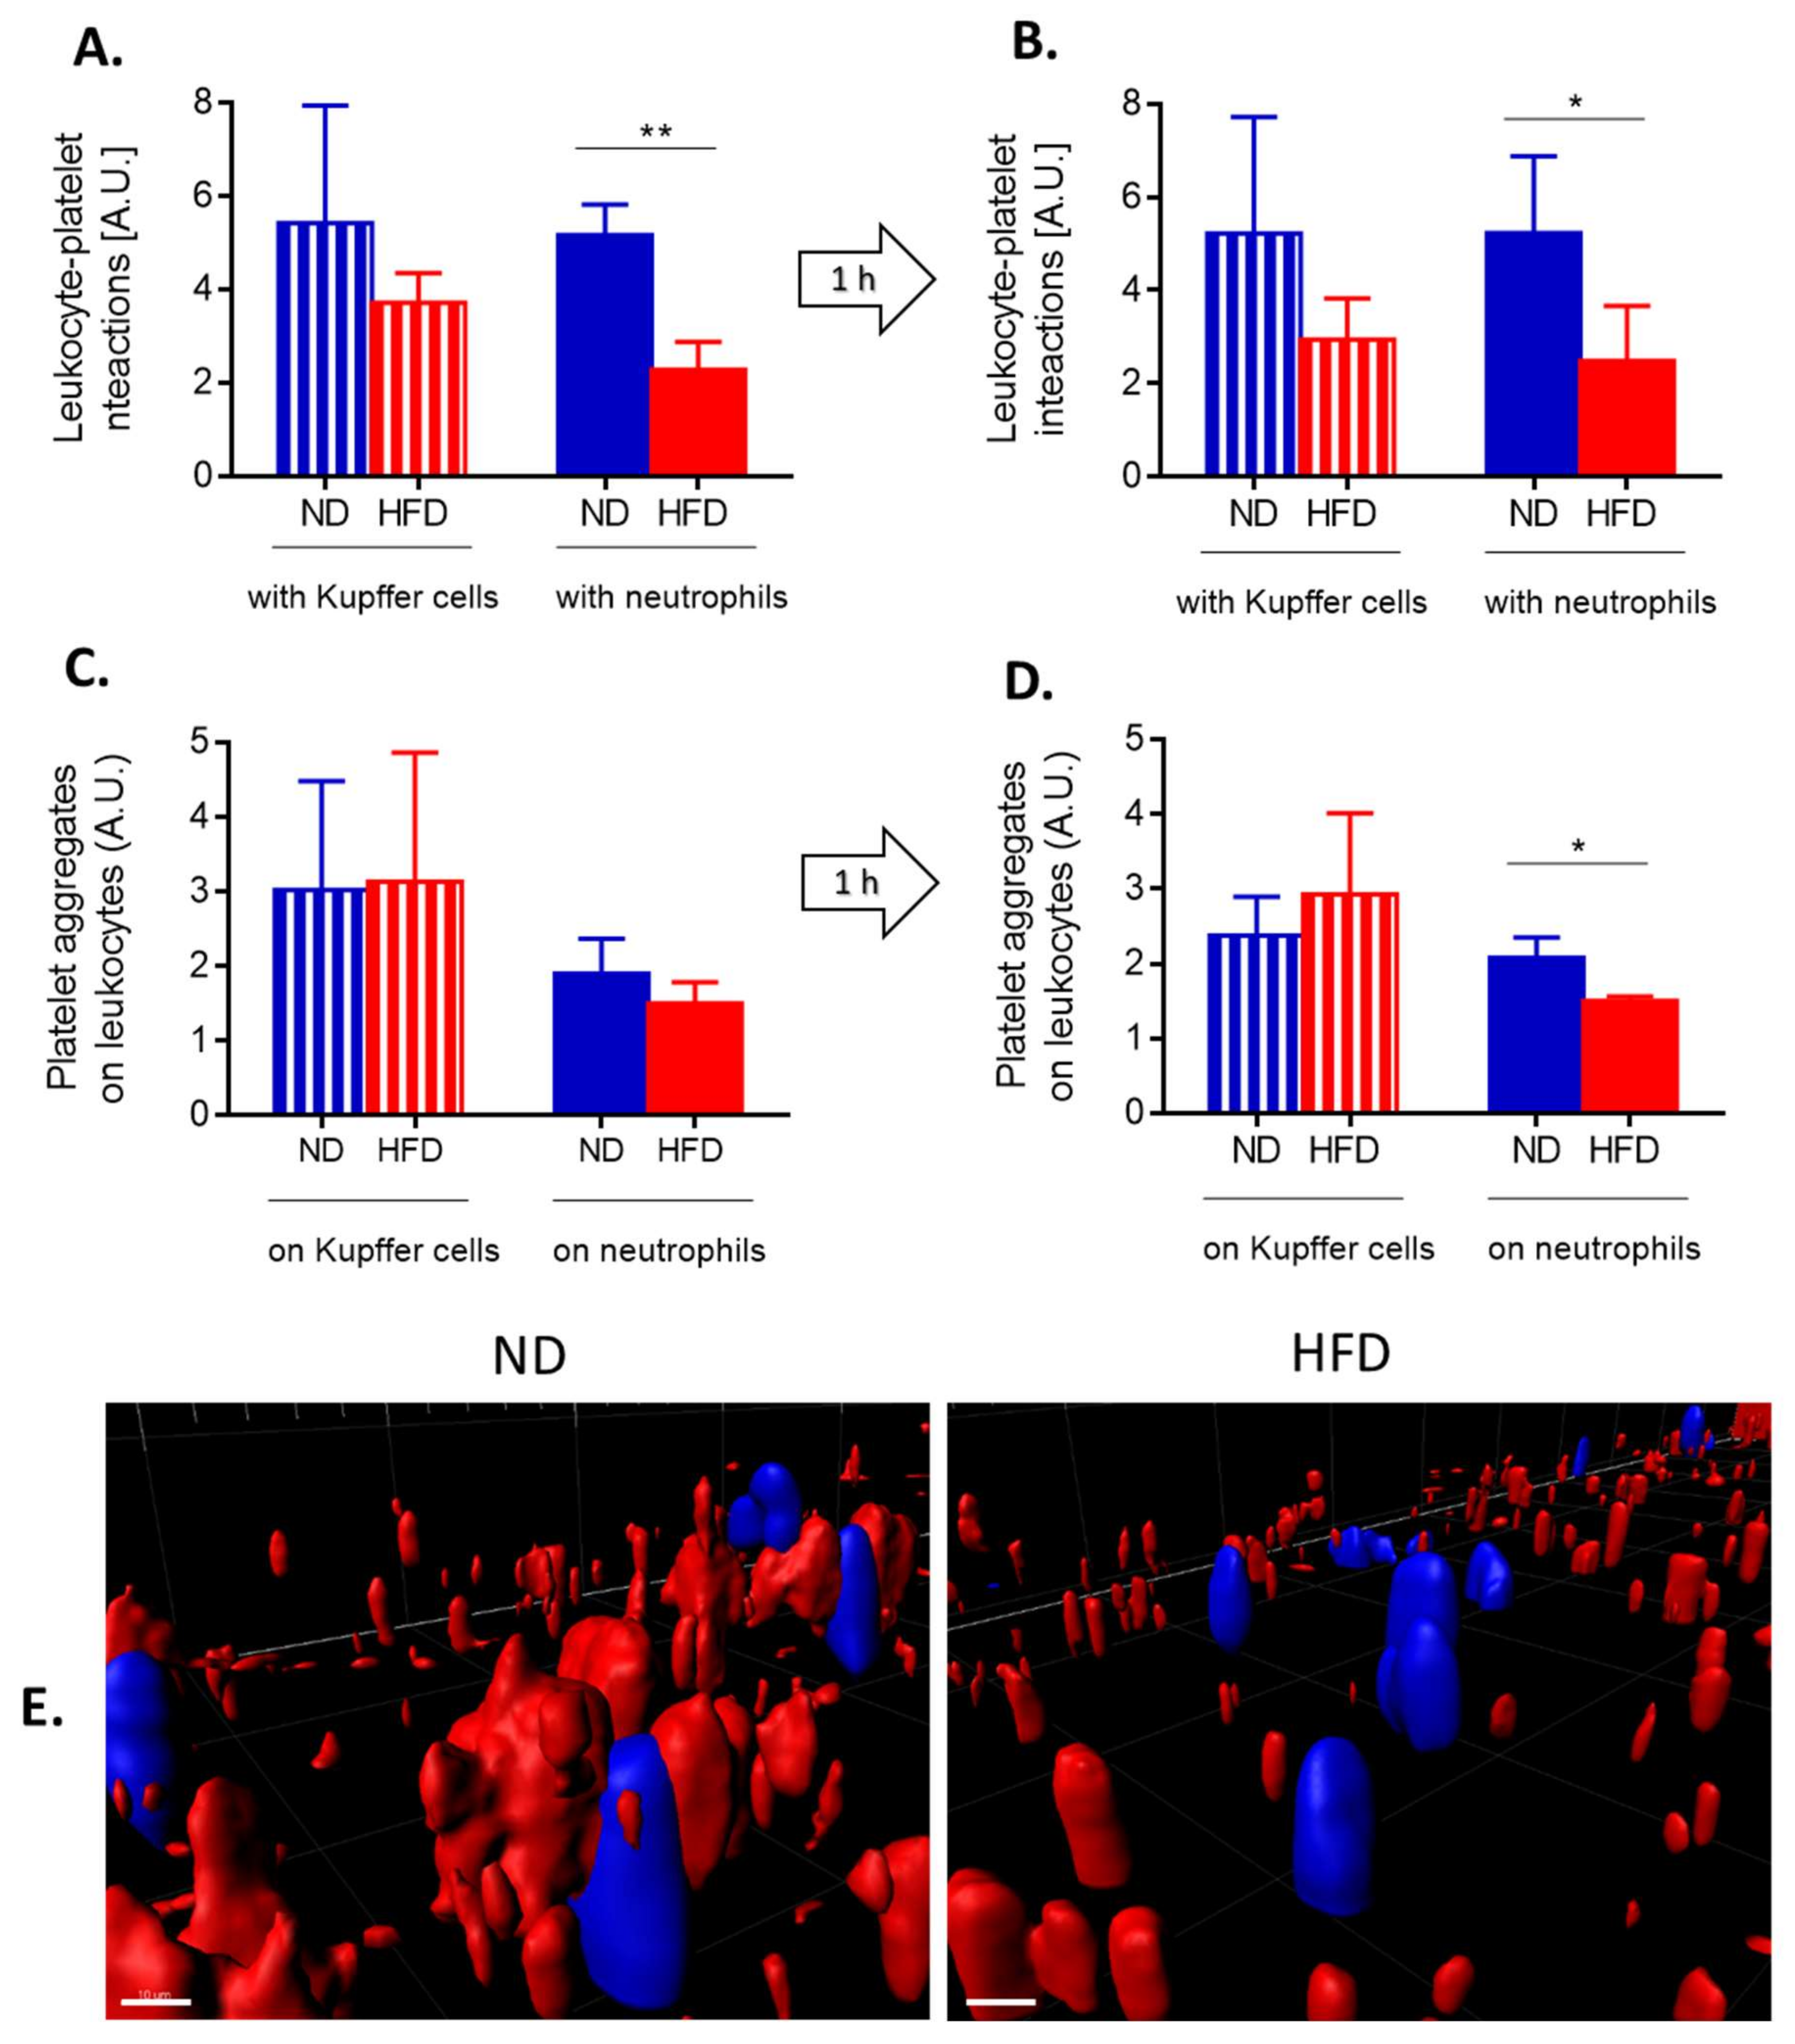
3.7. Interactions of Platelets with Neutrophils and Kupffer Cells
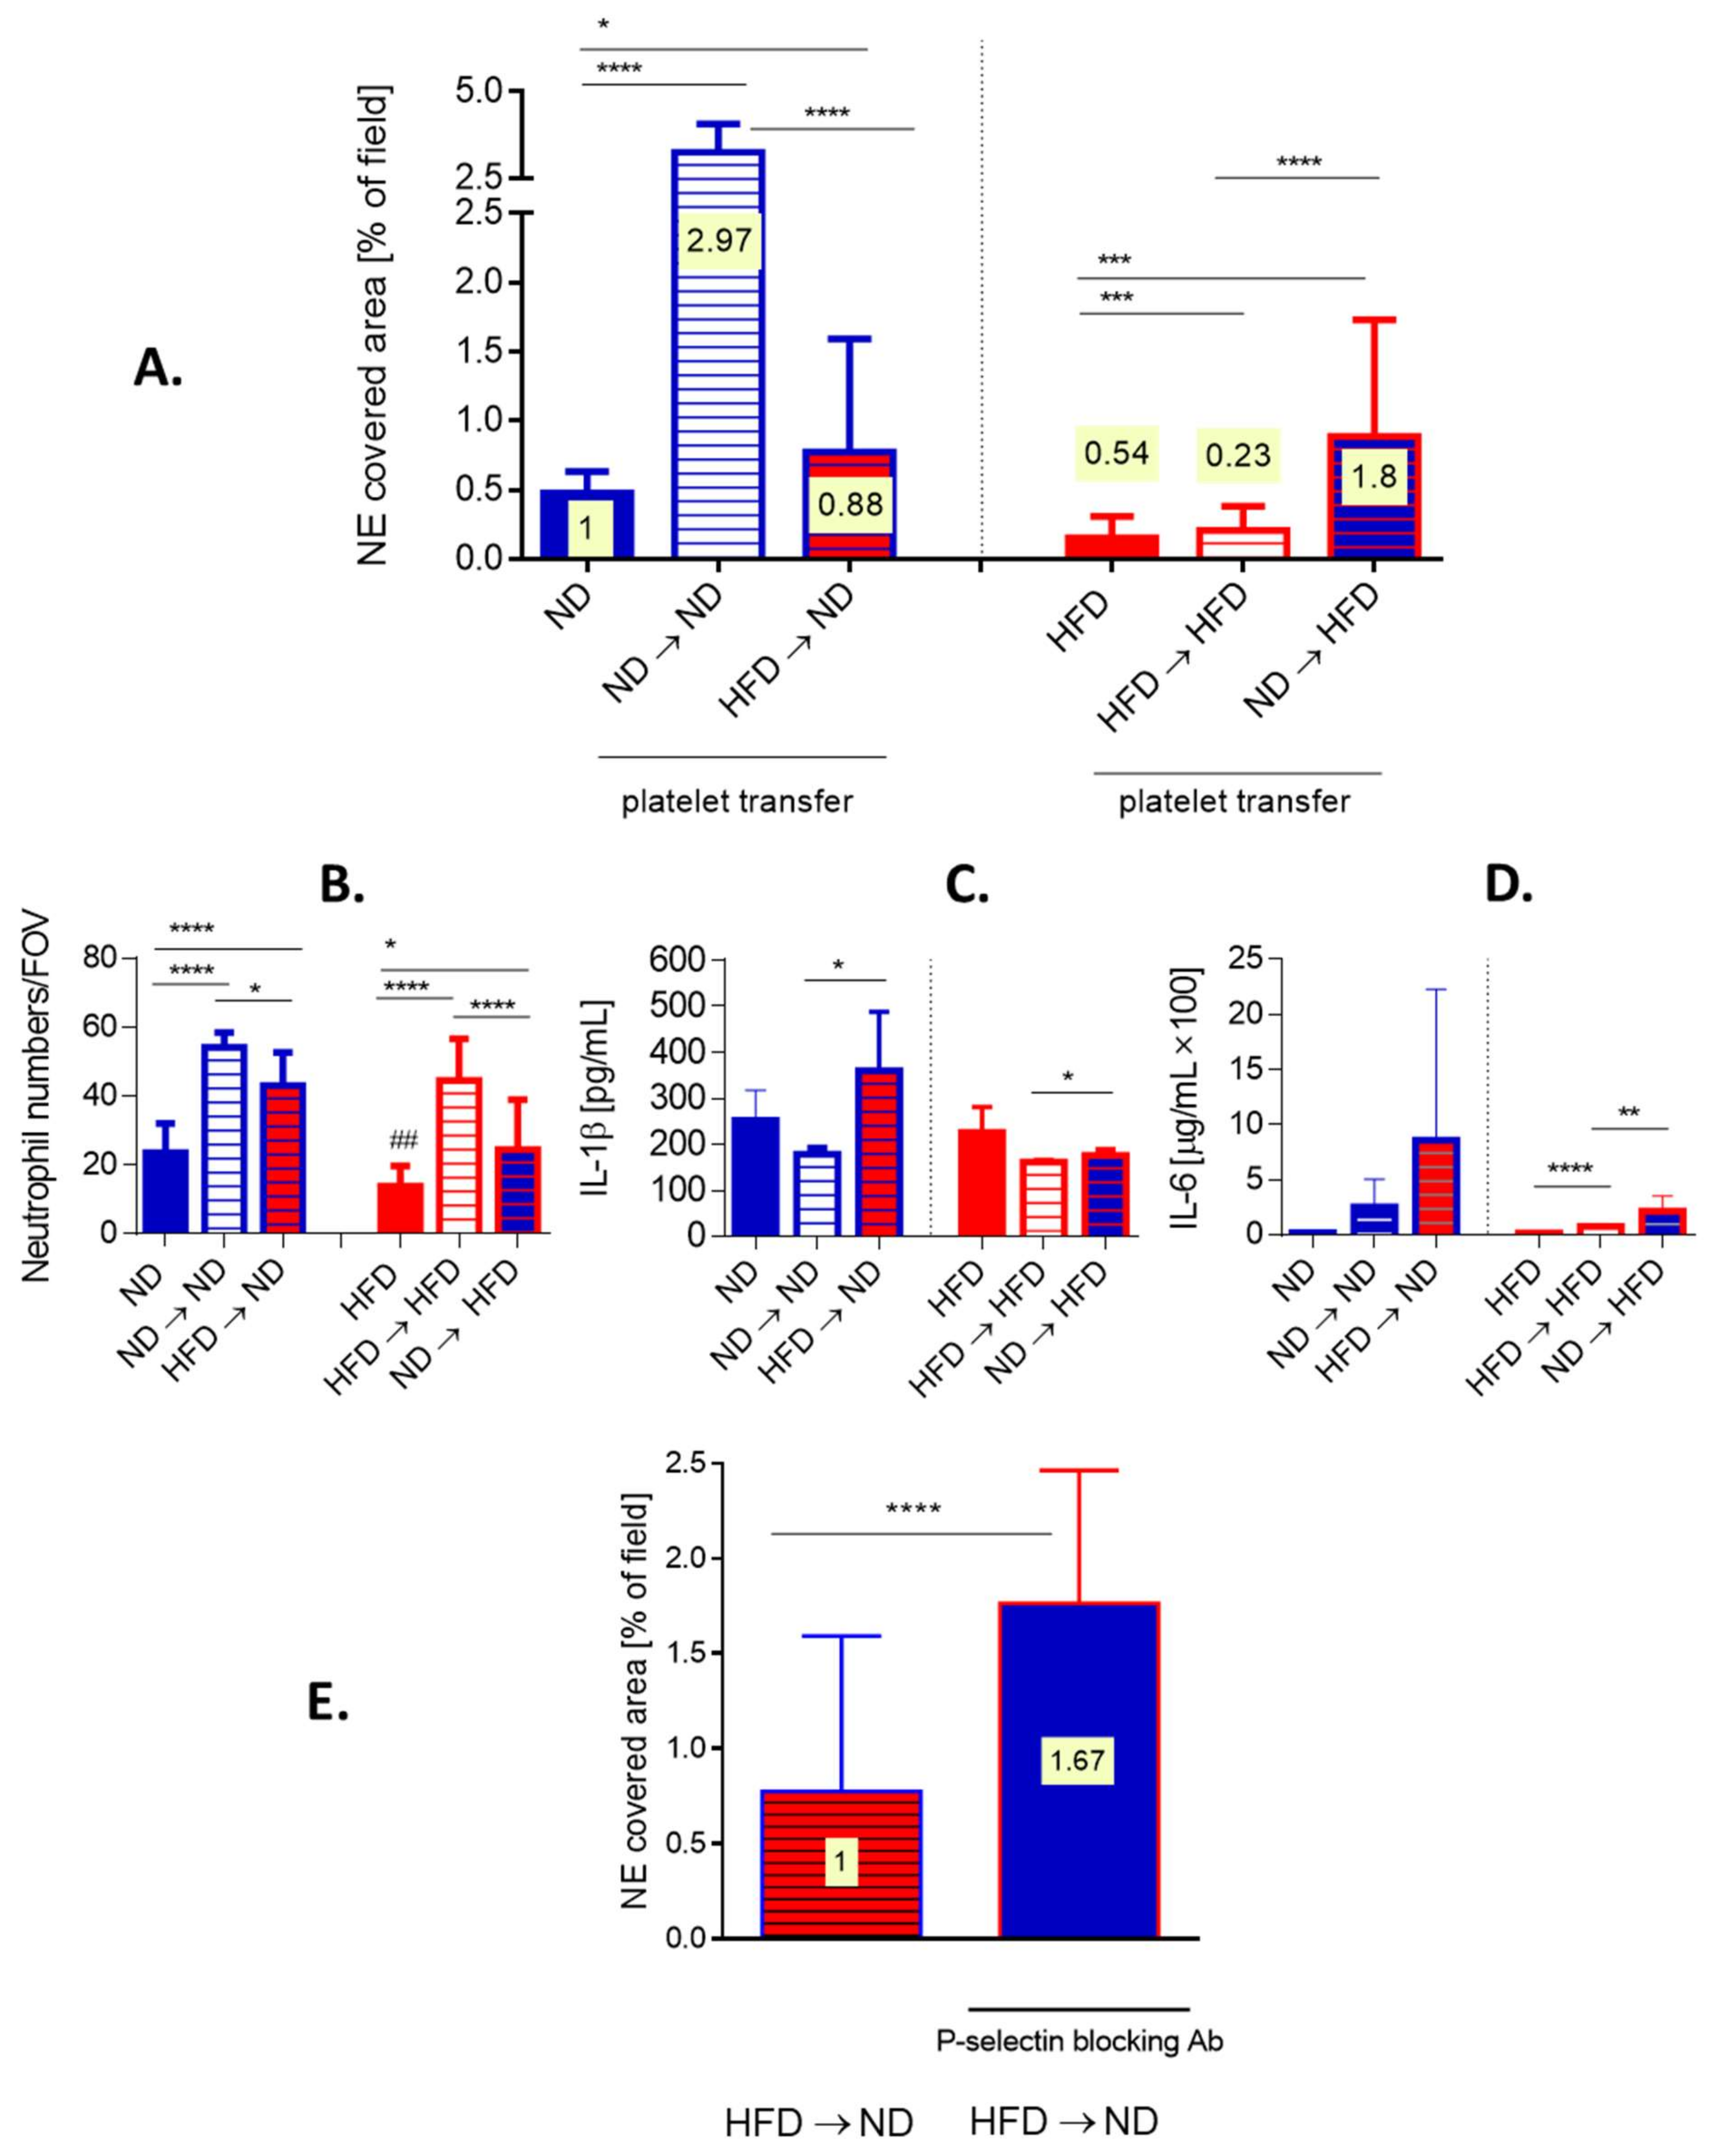
3.8. Transfer of Platelets Confirms Dysregulation of Platelet–Neutrophil Interactions in Obese Mice
4. Discussion
Supplementary Materials
Author Contributions
Funding
Institutional Review Board Statement
Informed Consent Statement
Data Availability Statement
Conflicts of Interest
References
- Singer, M.; Deutschman, C.S.; Seymour, C.; Shankar-Hari, M.; Annane, D.; Bauer, M.; Bellomo, R.; Bernard, G.R.; Chiche, J.D.; Coopersmith, C.M.; et al. The third international consensus definitions for sepsis and septic shock (sepsis-3). Jama J. Am. Med. Assoc. 2016, 315, 801–810. [Google Scholar] [CrossRef] [PubMed]
- Cecconi, M.; Evans, L.; Levy, M.; Rhodes, A. Sepsis and septic shock. Lancet 2018, 392, 75–87. [Google Scholar] [CrossRef]
- Genga, K.R.; Russell, J.A. Update of Sepsis in the Intensive Care Unit. J. Innate Immun. 2017, 9, 441–455. [Google Scholar] [CrossRef] [PubMed]
- Van Der Poll, T.; Van De Veerdonk, F.L.; Scicluna, B.P.; Netea, M.G. The immunopathology of sepsis and potential therapeutic targets. Nat. Rev. Immunol. 2017, 17, 407–420. [Google Scholar] [CrossRef] [PubMed]
- Hotchkiss, R.S.; Monneret, G.; Payen, D. Sepsis-induced immunosuppression: From cellular dysfunctions to immunotherapy. Nat. Rev. Immunol. 2013, 13, 862–874. [Google Scholar] [CrossRef]
- Kolaczkowska, E.; Jenne, C.N.; Surewaard, B.G.J.; Thanabalasuriar, A.; Lee, W.-Y.; Sanz, M.-J.; Mowen, K.; Opdenakker, G.; Kubes, P. Molecular mechanisms of NET formation and degradation revealed by intravital imaging in the liver vasculature. Nat. Commun. 2015, 6, 6673. [Google Scholar] [CrossRef]
- McDonald, B.; Davis, R.P.; Kim, S.-J.; Tse, M.; Esmon, C.T.; Kolaczkowska, E.; Jenne, C.N. Platelets and neutrophil extracellular traps collaborate to promote intravascular coagulation during sepsis in mice. Blood 2017, 129, 1357–1367. [Google Scholar] [CrossRef] [PubMed]
- Jenne, C.N.; Wong, C.H.; Zemp, F.J.; McDonald, B.; Rahman, M.M.; Forsyth, P.A.; McFadden, G.; Kubes, P. Neutrophils recruited to sites of infection protect from virus challenge by releasing neutrophil extracellular traps. Cell Host Microbe 2013, 13, 169–180. [Google Scholar] [CrossRef]
- McDonald, B.; Urrutia, R.; Yipp, B.G.; Jenne, C.N.; Kubes, P. Intravascular neutrophil extracellular traps capture bacteria from the bloodstream during sepsis. Cell Host Microbe 2012, 12, 324–333. [Google Scholar] [CrossRef]
- Kolaczkowska, E.; Kubes, P. Neutrophil recruitment and function in health and inflammation. Nat. Rev. Immunol. 2013, 13, 159–175. [Google Scholar] [CrossRef]
- Brinkmann, V.; Reichard, U.; Goosmann, C.; Fauler, B.; Uhlemann, Y.; Weiss, D.S.; Weinrauch, Y.; Zychlinsky, A. Neutrophil extracellular traps kill bacteria. Science 2004, 303, 1532–1535. [Google Scholar] [CrossRef]
- Yipp, B.G.; Kim, J.H.; Lima, R.; Zbytnuik, L.D.; Petri, B.; Swanlund, N.; Ho, M.; Szeto, V.G.; Tak, T.; Koenderman, L.; et al. The lung is a host defense niche for immediate neutrophil-mediated vascular protection. Sci. Immunol. 2017, 2, eaam8929. [Google Scholar] [CrossRef] [PubMed]
- Tanaka, K.; Koike, Y.; Shimura, T.; Okigami, M.; Ide, S.; Toiyama, Y.; Okugawa, Y.; Inoue, Y.; Araki, T.; Uchida, K.; et al. In vivo characterization of neutrophil extracellular traps in various organs of a murine sepsis model. PLoS ONE 2014, 9, e111888. [Google Scholar] [CrossRef]
- Yipp, B.G.; Petri, B.; Salina, D.; Jenne, C.N.; Scott, B.N.; Zbytnuik, L.D.; Pittman, K.; Asaduzzaman, M.; Wu, K.; Meijndert, H.C.; et al. Infection-induced NETosis is a dynamic process involving neutrophil multitasking in vivo. Nat. Med. 2012, 18, 1386–1393. [Google Scholar] [CrossRef]
- Vanheule, V.; Boff, D.; Mortier, A.; Janssens, R.; Petri, B.; Kolaczkowska, E.; Kubes, P.; Berghmans, N.; Struyf, S.; Kungl, A.J.; et al. CXCL9-derived peptides differentially inhibit neutrophil migration in vivo through interference with glycosaminoglycan interactions. Front. Immunol. 2017, 8, 530. [Google Scholar] [CrossRef]
- Massberg, S.; Grahl, L.; von Bruehl, M.L.; Manukyan, D.; Pfeiler, S.; Goosmann, C.; Brinkmann, V.; Lorenz, M.; Bidzhekov, K.; Khandagale, A.B.; et al. Reciprocal coupling of coagulation and innate immunity via neutrophil serine proteases. Nat. Med. 2010, 16, 887–896. [Google Scholar] [CrossRef]
- Xu, J.; Zhang, X.; Monestier, M.; Esmon, N.L.; Esmon, C.T. Extracellular histones are mediators of death through TLR2 and TLR4 in mouse fatal liver injury. J. Immunol. 2011, 187, 2626–2631. [Google Scholar] [CrossRef]
- Boeltz, S.; Amini, P.; Anders, H.J.; Andrade, F.; Bilyy, R.; Chatfield, S.; Cichon, I.; Clancy, D.M.; Desai, J.; Dumych, T.; et al. To NET or not to NET:current opinions and state of the science regarding the formation of neutrophil extracellular traps. Cell Death Differ. 2019, 26, 395–408. [Google Scholar] [CrossRef] [PubMed]
- Cichon, I.; Ortmann, W.; Bednarz, A.; Lenartowicz, M.; Kolaczkowska, E. Reduced Neutrophil Extracellular Trap (NET) Formation During Systemic Inflammation in Mice With Menkes Disease and Wilson Disease: Copper Requirement for NET Release. Front. Immunol. 2019, 10, 3021. [Google Scholar] [CrossRef] [PubMed]
- Woznica, E.A.; Inglot, M.; Woznica, R.K.; Lysenko, L. Liver dysfunction in sepsis. Adv. Clin. Exp. Med. 2018, 27, 547–552. [Google Scholar] [CrossRef] [PubMed]
- Assinger, A.; Schrottmaier, W.C.; Salzmann, M.; Rayes, J. Platelets in sepsis: An update on experimental models and clinical data. Front. Immunol. 2019, 10, 1687. [Google Scholar] [CrossRef]
- Jenne, C.N.; Wong, C.H.; Petri, B.; Kubes, P. The use of spinning-disk confocal microscopy for the intravital analysis of platelet dynamics in response to systemic and local inflammation. PLoS ONE 2011, 6, e25109. [Google Scholar] [CrossRef]
- Huang, Y.; Paxton, W.A.; Wolinsky, S.M.; Neumann, A.U.; Zhang, L.; He, T.; Kang, S.; Ceradini, D.; Jin, Z.; Yazdanbakhsh, K.; et al. The role of a mutant CCR5 allele in HIV-1 transmission and disease progression. Nat. Med. 1996, 2, 1240–1243. [Google Scholar] [CrossRef]
- Jagan, N.; Morrow, L.E.; Walters, R.W.; Plambeck, R.W.; Wallen, T.J.; Patel, T.M.; Malesker, M.A. Sepsis and the Obesity Paradox: Size Matters in More Than One Way. Crit. Care Med. 2020, 48, 776–782. [Google Scholar] [CrossRef]
- Arabi, Y.M.; Dara, S.I.; Tamim, H.M.; Rishu, A.H.; Bouchama, A.; Khedr, M.K.; Feinstein, D.; Parrillo, J.E.; Wood, K.E.; Keenan, S.P.; et al. Clinical characteristics, sepsis interventions and outcomes in the obese patients with septic shock: An international multicenter cohort study. Crit. Care 2013, 17, R72. [Google Scholar] [CrossRef] [PubMed]
- Pepper, D.J.; Demirkale, C.Y.; Sun, J.; Rhee, C.; Fram, D.; Eichacker, P.; Klompas, M.; Suffredini, A.F.; Kadri, S.S. Does Obesity Protect Against Death in Sepsis? A Retrospective Cohort Study of 55,038 Adult Patients. Crit. Care Med. 2019, 47, 643–650. [Google Scholar] [CrossRef] [PubMed]
- Siegl, D.; Annecke, T.; Johnson, B.L.; Schlag, C.; Martignoni, A.; Huber, N.; Conzen, P.; Caldwell, C.C.; Tschop, J. Obesity-induced hyperleptinemia improves survival and immune response in a murine model of sepsis. Anesthesiol. 2014, 121, 98–114. [Google Scholar] [CrossRef] [PubMed]
- Fujiwara, M.; Miyoshi, M.; Sakai, S.; Nishiokada, A.; Aoyama-Ishikawa, M.; Maeshige, N.; Usami, Y.; Hamada, Y.; Takahashi, M.; Usami, M. Lard-based high-fat diet increases secretory leukocyte protease inhibitor expression and attenuates the inflammatory response of acute lung injury in endotoxemic rats. Clin. Nutr. 2015, 34, 997–1009. [Google Scholar] [CrossRef]
- Robinson, J.; Swift-Scanlan, T.; Salyer, J. Obesity and 1-Year Mortality in Adults After Sepsis: A Systematic Review. Biol. Res. Nurs. 2019, 22, 103–113. [Google Scholar] [CrossRef] [PubMed]
- Tchernof, A.; Després, J.P. Pathophysiology of human visceral obesity: An update. Physiol. Rev. 2013, 93, 359–404. [Google Scholar] [CrossRef]
- Xu, W.; Pepper, D.; Sun, J.; Welsh, J.; Cui, X.; Eichacker, P.Q. The Effects of Obesity on Outcome in Preclinical Animal Models of Infection and Sepsis: A Systematic Review and Meta-Analysis. J. Obes. 2020, 2020, 1508764. [Google Scholar] [CrossRef]
- Mittwede, P.N.; Clemmer, J.S.; Bergin, P.F.; Xiang, L. Obesity and critical illness: Insights from animal models. Shock 2016, 45, 349–358. [Google Scholar] [CrossRef]
- Milić, S.; Lulić, D.; Štimac, D. Non-alcoholic fatty liver disease and obesity: Biochemical, metabolic and clinical presentations. World J. Gastroenterol. 2014, 20, 9330–9337. [Google Scholar] [CrossRef]
- Kalani, C.; Venigalla, T.; Bailey, J.; Udeani, G.; Surani, S. Sepsis Patients in Critical Care Units with Obesity: Is Obesity Protective? Cureus 2020, 12, e6929. [Google Scholar] [CrossRef]
- Wacharasint, P.; Boyd, J.H.; Russell, J.A.; Walley, K.R. One size does not fit all in severe infection: Obesity alters outcome, susceptibility, treatment, and inflammatory response. Crit Care 2013, 17, R122. [Google Scholar] [CrossRef] [PubMed]
- Stapleton, R.D.; Dixon, A.E.; Parsons, P.E.; Ware, L.B.; Suratt, B.T. The association between BMI and plasma cytokine levels in patients with acute lung injury. Chest 2010, 138, 568–577. [Google Scholar] [CrossRef] [PubMed]
- Arble, D.M.; Vitaterna, M.H.; Turek, F.W. Rhythmic leptin is required for weight gain from circadian desynchronized feeding in the mouse. PLoS ONE 2011, 6, e25079. [Google Scholar] [CrossRef] [PubMed]
- Konstantinides, S.; Schäfer, K.; Neels, J.G.; Dellas, C.; Loskutoff, D.J. Inhibition of endogenous leptin protects mice from arterial and venous thrombosis. Arter. Thromb. Vasc. Biol. 2004, 24, 2196–2201. [Google Scholar] [CrossRef] [PubMed]
- Wong, C.H.; Jenne, C.N.; Petri, B.; Chrobok, N.L.; Kubes, P. Nucleation of platelets with blood-borne pathogens on Kupffer cells precedes other innate immunity and contributes to bacterial clearance. Nat. Immunol. 2013, 14, 785–792. [Google Scholar] [CrossRef]
- Nikolic, I.; Leiva, M.; Sabio, G. The role of stress kinases in metabolic disease. Nat. Rev. Endocrinol. 2020, 16, 697–716. [Google Scholar] [CrossRef]
- Kolbus, D.; Ramos, O.H.; Berg, K.E.; Persson, J.; Wigren, M.; Björkbacka, H.; Fredrikson, G.N.; Nilsson, J. CD8+T cell activation predominate early immune responses to hypercholesterolemia in Apoe-/-mice. Bmc Immunol. 2010, 11, 58. [Google Scholar] [CrossRef] [PubMed]
- Mansuy-Aubert, V.; Zhou, Q.L.; Xie, X.; Gong, Z.; Huang, J.Y.; Khan, A.R.; Aubert, G.; Candelaria, K.; Thomas, S.; Shin, D.J.; et al. Imbalance between neutrophil elastase and its inhibitor alpha1-antitrypsin in obesity alters insulin sensitivity, inflammation, and energy expenditure. Cell Metab. 2013, 17, 534–548. [Google Scholar] [CrossRef]
- Brotfain, E.; Hadad, N.; Shapira, Y.; Avinoah, E.; Zlotnik, A.; Raichel, L.; Levy, R. Neutrophil functions in morbidly obese subjects. Clin. Exp. Immunol. 2015, 181, 156–163. [Google Scholar] [CrossRef]
- Talukdar, S.; Oh da, Y.; Bandyopadhyay, G.; Li, D.; Xu, J.; McNelis, J.; Lu, M.; Li, P.; Yan, Q.; Zhu, Y.; et al. Neutrophils mediate insulin resistance in mice fed a high-fat diet through secreted elastase. Nat. Med. 2012, 18, 1407–1412. [Google Scholar] [CrossRef] [PubMed]
- Neels, J.G.; Badeanlou, L.; Hester, K.D.; Samad, F. Keratinocyte-derived chemokine in obesity. Expression, regulation, and role in adipose macrophage infiltration and glucose homeostasis. J. Biol. Chem. 2009, 284, 20692–20698. [Google Scholar] [CrossRef]
- Siebert, A.; Goren, I.; Pfeilschifter, J.; Frank, S. Anti-Inflammatory Effects of Rosiglitazone in Obesity-Impaired Wound Healing Depend on Adipocyte Differentiation. PLoS ONE 2016, 11, e0168562. [Google Scholar] [CrossRef]
- Alves-Filho, J.C.; Sonego, F.; Souto, F.O.; Freitas, A.; Verri, W.A., Jr.; Auxiliadora-Martins, M.; Basile-Filho, A.; McKenzie, A.N.; Xu, D.; Cunha, F.Q.; et al. Interleukin-33 attenuates sepsis by enhancing neutrophil influx to the site of infection. Nat. Med. 2010, 16, 708–712. [Google Scholar] [CrossRef]
- Zeyda, M.; Wernly, B.; Demyanets, S.; Kaun, C.; Hammerle, M.; Hantusch, B.; Schranz, M.; Neuhofer, A.; Itariu, B.K.; Keck, M.; et al. Severe obesity increases adipose tissue expression of interleukin-33 and its receptor ST2, both predominantly detectable in endothelial cells of human adipose tissue. Int. J. Obes. 2013, 37, 658–665. [Google Scholar] [CrossRef] [PubMed]
- Clark, S.R.; Ma, A.C.; Tavener, S.A.; McDonald, B.; Goodarzi, Z.; Kelly, M.M.; Patel, K.D.; Chakrabarti, S.; McAvoy, E.; Sinclair, G.D.; et al. Platelet TLR4 activates neutrophil extracellular traps to ensnare bacteria in septic blood. Nat. Med. 2007, 13, 463–469. [Google Scholar] [CrossRef]
- Vachharajani, V.; Russell, J.M.; Scott, K.L.; Conrad, S.; Stokes, K.Y.; Tallam, L.; Hall, J.; Granger, D.N. Obesity exacerbates sepsis-induced inflammation and microvascular dysfunction in mouse brain. Microcirculation 2005, 12, 183–194. [Google Scholar] [CrossRef]
- Lelubre, C.; Vincent, J.L. Mechanisms and treatment of organ failure in sepsis. Nat. Rev. Nephrol. 2018, 14, 417–427. [Google Scholar] [CrossRef] [PubMed]
- Opal, S.M. The host response to endotoxin, antilipopolysaccharide strategies, and the management of severe sepsis. Int. J. Med. Microbiol. 2007, 297, 365–377. [Google Scholar] [CrossRef] [PubMed]
- Clément, K.; Vaisse, C.; Lahlou, N.; Cabrol, S.; Pelloux, V.; Cassuto, D.; Gourmelen, M.; Dina, C.; Chambaz, J.; Lacorte, J.M.; et al. A mutation in the human leptin receptor gene causes obesity and pituitary dysfunction. Nature 1998, 392, 398–401. [Google Scholar] [CrossRef] [PubMed]
- Luo, L.; Zhang, S.; Wang, Y.; Rahman, M.; Syk, I.; Zhang, E.; Thorlacius, H. Proinflammatory role of neutrophil extracellular traps in abdominal sepsis. Am. J. Physiol. Lung Cell Mol. Physiol. 2014, 307, L586–L596. [Google Scholar] [CrossRef] [PubMed]
- Lefrançais, E.; Mallavia, B.; Zhuo, H.; Calfee, C.S.; Looney, M.R. Maladaptive role of neutrophil extracellular traps in pathogen-induced lung injury. Jci Insight 2018, 3. [Google Scholar] [CrossRef]
- Kambas, K.; Mitroulis, I.; Apostolidou, E.; Girod, A.; Chrysanthopoulou, A.; Pneumatikos, I.; Skendros, P.; Kourtzelis, I.; Koffa, M.; Kotsianidis, I.; et al. Autophagy Mediates the Delivery of Thrombogenic Tissue Factor to Neutrophil Extracellular Traps in Human Sepsis. PLoS ONE 2012, 7, e45427. [Google Scholar] [CrossRef] [PubMed]
- Kaufman, T.; Magosevich, D.; Moreno, M.C.; Guzman, M.A.; D’Atri, L.P.; Carestia, A.; Fandiño, M.E.; Fondevila, C.; Schattner, M. Nucleosomes and neutrophil extracellular traps in septic and burn patients. Clin. Immunol. 2017, 183, 254–262. [Google Scholar] [CrossRef] [PubMed]
- Seemann, S.; Zohles, F.; Lupp, A. Comprehensive comparison of three different animal models for systemic inflammation. J. Biomed. Sci. 2017, 24, 60. [Google Scholar] [CrossRef]
- Wiekowski, M.T.; Chen, S.-C.; Zalamea, P.; Wilburn, B.P.; Kinsley, D.J.; Sharif, W.W.; Jensen, K.K.; Hedrick, J.A.; Manfra, D.; Lira, S.A. Disruption of Neutrophil Migration in a Conditional Transgenic Model: Evidence for CXCR2 Desensitization In Vivo. J. Immunol. 2001, 167, 7102–7110. [Google Scholar] [CrossRef]
- Funamoto, S.; Meili, R.; Lee, S.; Parry, L.; Firtel, R.A. Spatial and temporal regulation of 3-phosphoinositides by PI 3-kinase and PTEN mediates chemotaxis. Cell 2002, 109, 611–623. [Google Scholar] [CrossRef]
- Susek, K.H.; Karvouni, M.; Alici, E.; Lundqvist, A. The Role of CXC Chemokine Receptors 1-4 on Immune Cells in the Tumor Microenvironment. Front. Immunol. 2018, 9, 2159. [Google Scholar] [CrossRef] [PubMed]
- Stillie, R.; Farooq, S.M.; Gordon, J.R.; Stadnyk, A.W. The functional significance behind expressing two IL-8 receptor types on PMN. J. Leukoc. Biol. 2009, 86, 529–543. [Google Scholar] [CrossRef]
- Chavey, C.; Fajas, L. CXCL5 drives obesity to diabetes, and further. Aging (Albany. Ny). 2009, 1, 674–677. [Google Scholar] [CrossRef] [PubMed]
- Craciun, F.L.; Schuller, E.R.; Remick, D.G. Early enhanced local neutrophil recruitment in peritonitis-induced sepsis improves bacterial clearance and survival. J. Immunol. 2010, 185, 6930–6938. [Google Scholar] [CrossRef] [PubMed]
- Nijhuis, J.; Rensen, S.S.; Slaats, Y.; Van Dielen, F.M.H.; Buurman, W.A.; Greve, J.W.M. Neutrophil activation in morbid obesity, chronic activation of acute inflammation. Obesity 2009, 17, 2014–2018. [Google Scholar] [CrossRef]
- Wang, H.; Wang, Q.; Venugopal, J.; Wang, J.; Kleiman, K.; Guo, C.; Eitzman, D.T. Obesity-induced Endothelial Dysfunction is Prevented by Neutrophil Extracellular Trap Inhibition. Sci. Rep. 2018, 8, 1–7. [Google Scholar] [CrossRef]
- Braster, Q.; Roig, C.S.; Hartwig, H.; Beckers, L.; Den Toom, M.; Doring, Y.; Daemen, M.J.; Lutgens, E.; Soehnlein, O. Inhibition of NET release fails to reduce adipose tissue inflammation in mice. PLoS ONE 2016, 11, e0163922. [Google Scholar] [CrossRef]
- D’Abbondanza, M.; Martorelli, E.E.; Ricci, M.A.; De Vuono, S.; Migliola, E.N.; Godino, C.; Corradetti, S.; Siepi, D.; Paganelli, M.T.; Maugeri, N.; et al. Increased plasmatic NETs by-products in patients in severe obesity. Sci. Rep. 2019, 9, 1–10. [Google Scholar] [CrossRef]
- Moorthy, A.N.; Tan, K.B.; Wang, S.; Narasaraju, T.; Chow, V.T. Effect of High-Fat Diet on the Formation of Pulmonary Neutrophil Extracellular Traps during Influenza Pneumonia in BALB/c Mice. Front. Immunol. 2016, 7, 289. [Google Scholar] [CrossRef]
- Teijeira, Á.; Garasa, S.; Gato, M.; Alfaro, C.; Migueliz, I.; Cirella, A.; de Andrea, C.; Ochoa, M.C.; Otano, I.; Etxeberria, I.; et al. CXCR1 and CXCR2 Chemokine Receptor Agonists Produced by Tumors Induce Neutrophil Extracellular Traps that Interfere with Immune Cytotoxicity. Immunity 2020, 52, 856–871.e8. [Google Scholar] [CrossRef]
- Abella, V.; Scotece, M.; Conde, J.; Pino, J.; Angel Gonzalez-Gay, M.; Gómez-Reino, J.J.; Mera, A.; Lago, F.; Gómez, R.; Gualillo, O. Leptin in the interplay of inflammation, metabolism and immune system disorders. Nat. Rev. Rheumatol. 2017, 13, 100–109. [Google Scholar] [CrossRef]
- Bornstein, S.R.; Licinio, J.; Tauchnitz, R.; Engelmann, L.; Negrão, A.B.; Gold, P.; Chrousos, G.P. Plasma leptin levels are increased in survivors of acute sepsis: Associated loss of diurnal rhythm in cortisol and leptin secretion. J. Clin. Endocrinol. Metab. 1998, 83, 280–283. [Google Scholar] [CrossRef]
- Kamp, V.M.; Langereis, J.D.; van Aalst, C.W.; van der Linden, J.A.; Ulfman, L.H.; Koenderman, L. Physiological Concentrations of Leptin Do Not Affect Human Neutrophils. PLoS ONE 2013, 8, e73170. [Google Scholar] [CrossRef] [PubMed]
- Caldefie-Chezet, F.; Poulin, A.; Vasson, M.P. Leptin regulates functional capacities of polymorphonuclear neutrophils. Free Radic. Res. 2003, 37, 809–814. [Google Scholar] [CrossRef]
- Myers, M.G.; Leibel, R.L.; Seeley, R.J.; Schwartz, M.W. Obesity and leptin resistance: Distinguishing cause from effect. Trends Endocrinol. Metab. 2010, 21, 643–651. [Google Scholar] [CrossRef]
- Lin, R.C.; Zhang, Y.; Pradhan, K.; Li, L. TICAM2-related pathway mediates neutrophil exhaustion. Sci. Rep. 2020, 10, 14397. [Google Scholar] [CrossRef]
- Vilahur, G.; Ben-Aicha, S.; Badimon, L. New insights into the role of adipose tissue in thrombosis. Cardiovasc. Res. 2017, 113, 1046–1054. [Google Scholar] [CrossRef] [PubMed]
- Barrachina, M.N.; Morán, L.A.; Izquierdo, I.; Casanueva, F.F.; Pardo, M.; García, Á. Analysis of platelets from a diet-induced obesity rat model: Elucidating platelet dysfunction in obesity. Sci. Rep. 2020, 10, 1–10. [Google Scholar] [CrossRef]
- Rivera, C.A.; Gaskin, L.; Singer, G.; Houghton, J.; Allman, M. Western diet enhances hepatic inflammation in mice exposed to cecal ligation and puncture. Bmc Physiol. 2010, 10, 20. [Google Scholar] [CrossRef]
- Wang, X.F.; Buechler, N.L.; Yoza, B.K.; McCall, C.E.; Vachharajani, V. Adiponectin treatment attenuates inflammatory response during early sepsis in obese mice. J. Inflamm. Res. 2016, 9, 167–174. [Google Scholar] [CrossRef] [PubMed]
- Singer, G.; Stokes, K.Y.; Terao, S.; Granger, D.N. Sepsis-induced intestinal microvascular and inflammatory responses in obese mice. Shock 2009, 31, 275–279. [Google Scholar] [CrossRef] [PubMed]
- Michels, A.; Dwyer, C.N.; Mewburn, J.; Nesbitt, K.; Kawecki, C.; Lenting, P.; Swystun, L.L.; Lillicrap, D. VWF (von Willebrand Factor) Is a Critical Mediator of Deep Vein Thrombosis in a Mouse Model of Diet-Induced Obesity. Arterioscler. Thromb. Vasc. Biol. 2020, 40, 2860–2874. [Google Scholar] [CrossRef] [PubMed]
- Merten, M.; Thiagarajan, P. P-selectin expression on platelets determines size and stability of platelet aggregates. Circulation 2000, 102, 1931–1936. [Google Scholar] [CrossRef]
- Frenette, P.S.; Denis, C.V.; Weiss, L.; Jurk, K.; Subbarao, S.; Kehrel, B.; Hartwig, J.H.; Vestweber, D.; Wagner, D.D. P-selectin glycoprotein ligand 1 (PSGL-1) is expressed on platelets and can mediate platelet-endothelial interactions in vivo. J. Exp. Med. 2000, 191, 1413–1422. [Google Scholar] [CrossRef]
- Heymann, F.; Tacke, F. Immunology in the liver—From homeostasis to disease. Nat Rev Gastroenterol Hepatol 2016, 13, 88–110. [Google Scholar] [CrossRef] [PubMed]
- Sakurai, K.; Miyashita, T.; Okazaki, M.; Yamaguchi, T.; Ohbatake, Y.; Nakanuma, S.; Okamoto, K.; Sakai, S.; Kinoshita, J.; Makino, I.; et al. Role for neutrophil extracellular traps (NETs) and platelet aggregation in early sepsis-induced hepatic dysfunction. Vivo (Brooklyn) 2017, 31, 1051–1058. [Google Scholar] [CrossRef]
- Camicia, G.; Pozner, R.; De Larrañaga, G. Neutrophil extracellular traps in sepsis. Shock 2014, 42, 286–294. [Google Scholar] [CrossRef] [PubMed]


Publisher’s Note: MDPI stays neutral with regard to jurisdictional claims in published maps and institutional affiliations. |
© 2021 by the authors. Licensee MDPI, Basel, Switzerland. This article is an open access article distributed under the terms and conditions of the Creative Commons Attribution (CC BY) license (http://creativecommons.org/licenses/by/4.0/).
Share and Cite
Cichon, I.; Ortmann, W.; Santocki, M.; Opydo-Chanek, M.; Kolaczkowska, E. Scrutinizing Mechanisms of the ‘Obesity Paradox in Sepsis’: Obesity Is Accompanied by Diminished Formation of Neutrophil Extracellular Traps (NETs) Due to Restricted Neutrophil–Platelet Interactions. Cells 2021, 10, 384. https://doi.org/10.3390/cells10020384
Cichon I, Ortmann W, Santocki M, Opydo-Chanek M, Kolaczkowska E. Scrutinizing Mechanisms of the ‘Obesity Paradox in Sepsis’: Obesity Is Accompanied by Diminished Formation of Neutrophil Extracellular Traps (NETs) Due to Restricted Neutrophil–Platelet Interactions. Cells. 2021; 10(2):384. https://doi.org/10.3390/cells10020384
Chicago/Turabian StyleCichon, Iwona, Weronika Ortmann, Michal Santocki, Malgorzata Opydo-Chanek, and Elzbieta Kolaczkowska. 2021. "Scrutinizing Mechanisms of the ‘Obesity Paradox in Sepsis’: Obesity Is Accompanied by Diminished Formation of Neutrophil Extracellular Traps (NETs) Due to Restricted Neutrophil–Platelet Interactions" Cells 10, no. 2: 384. https://doi.org/10.3390/cells10020384
APA StyleCichon, I., Ortmann, W., Santocki, M., Opydo-Chanek, M., & Kolaczkowska, E. (2021). Scrutinizing Mechanisms of the ‘Obesity Paradox in Sepsis’: Obesity Is Accompanied by Diminished Formation of Neutrophil Extracellular Traps (NETs) Due to Restricted Neutrophil–Platelet Interactions. Cells, 10(2), 384. https://doi.org/10.3390/cells10020384