Article

Boron Uptake by Navel Orange Seedlings as Influenced by Irrigation Water, Rootstock and Soil Texture

Instituto Valenciano de Investigaciones Agrarias-IVIA, Centro Para el Desarrollo de la Agricultura Sostenible-CDAS, Carretera CV-315, km 10.7, 46113 València, Moncada, Spain
*
Author to whom correspondence should be addressed.
Agronomy 2026, 16(4), 418; https://doi.org/10.3390/agronomy16040418
Submission received: 13 January 2026 / Revised: 28 January 2026 / Accepted: 30 January 2026 / Published: 9 February 2026

Abstract

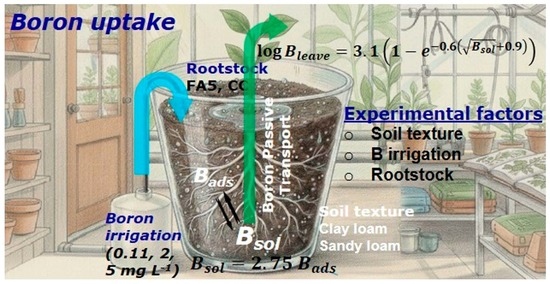
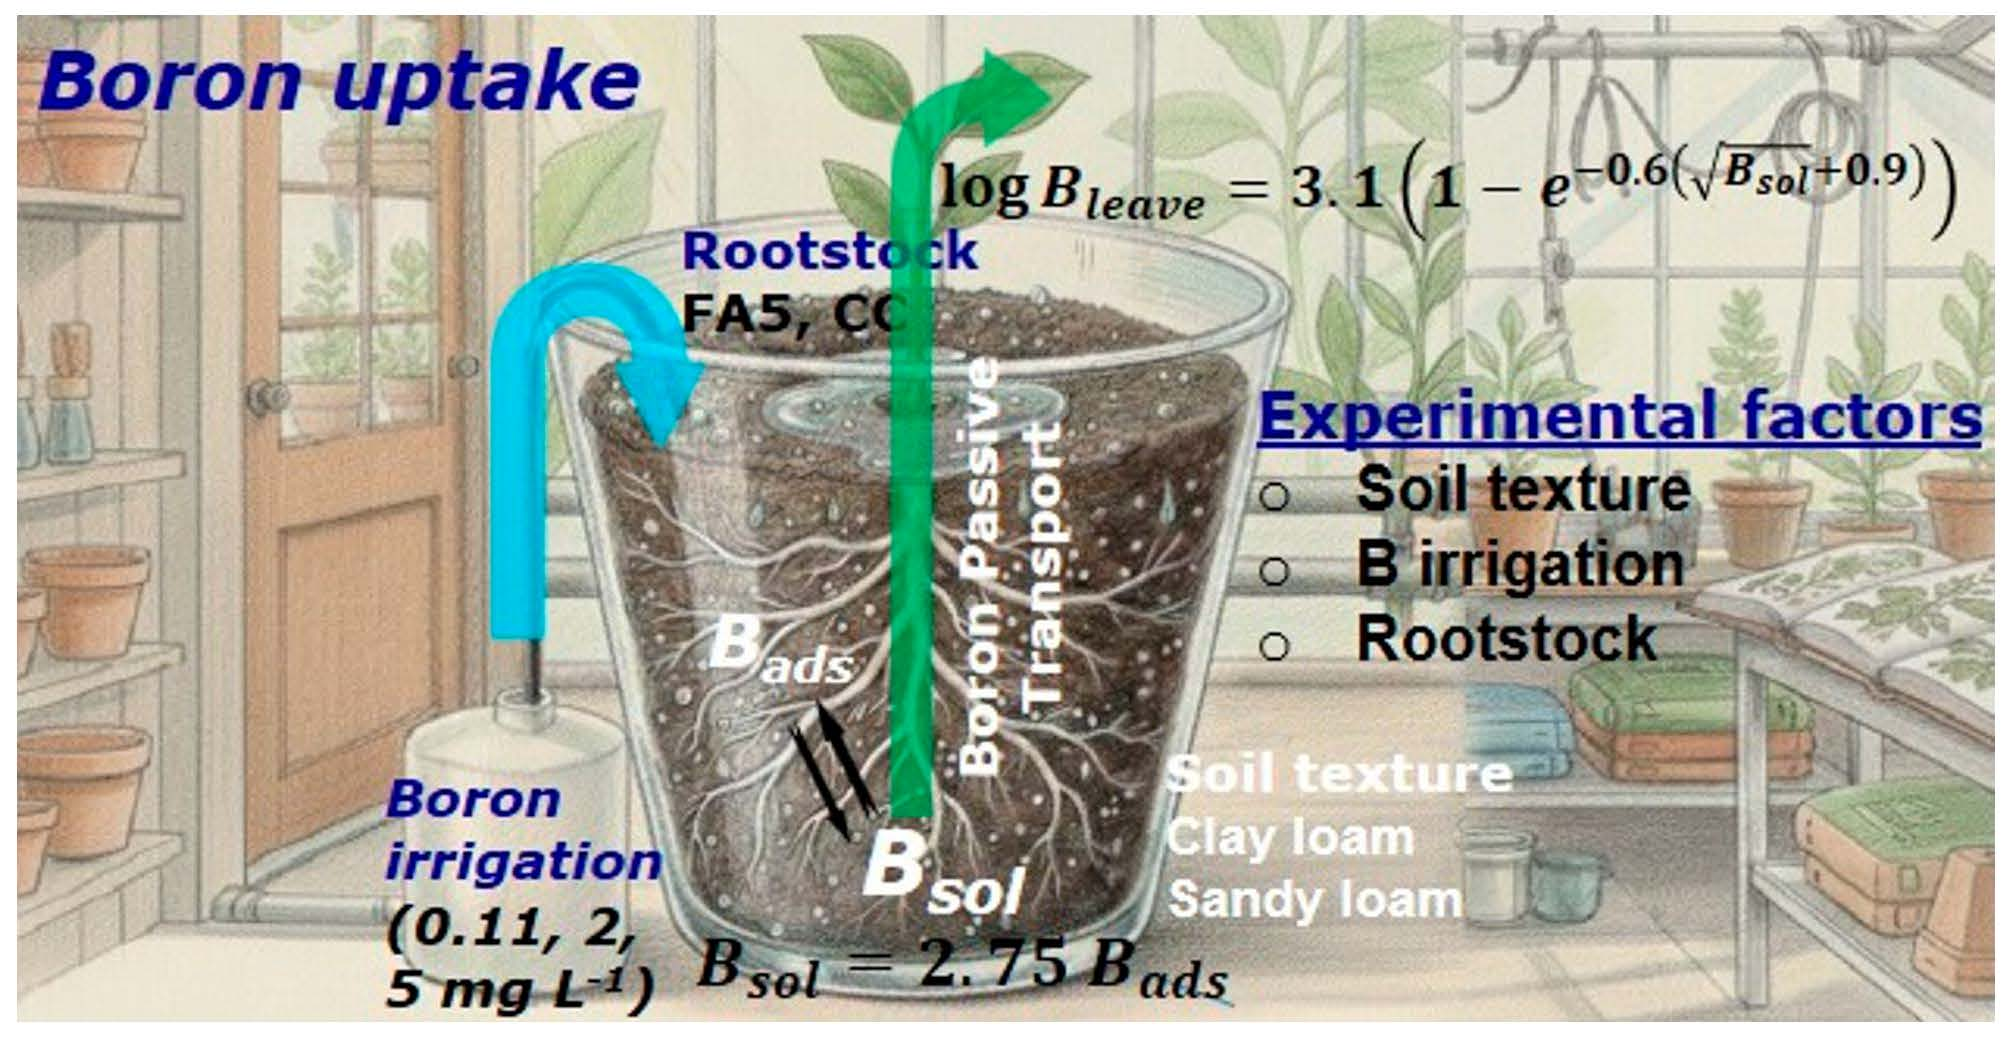
Boron (B) is an essential but narrow-range micronutrient for citrus, with toxicity risks heightened in dry regions due to potentially high-B irrigation water and limited soil leaching. ‘Forner-Alcaide 5’ (FA5) is a promising rootstock for enhancing B-tolerance of sweet orange, but it had not been sufficiently tested before this study, specifically considering soil texture. Therefore, this greenhouse study investigated the effects on B absorption and biomass buildup of irrigating navel orange seedlings (cv. Navelina) grafted onto ‘Carrizo’ citrange (CC) and FA5 rootstocks, with 0.11, 2, or 5 mg B L−1 waters and grown in clay loam or sandy loam soils. The results of this complete three-factor trial revealed that leaves are the primary sink for B (24–1300 mg kg−1), indicating passive, transpiration-driven uptake and limited phloem redistribution. The presumed absence of sugar alcohols, and the weak binding affinity of B to the abundant sucrose, may account for the restricted phloem mobility of B in citrus, consistent with the mechanistic interpretation proposed in this study. FA5 rootstock showed greater B tolerance, sustaining 28% higher biomass than CC at 2 mg L−1 B. Plant B uptake was found to be more related to soil soluble B than adsorbed B. Interestingly, the relationship followed a diminishing-returns pattern, thereby suggesting a balancing feedback mechanism, potentially based on B-induced stomatal closure. This analytical link between irrigation B and plant accumulation offers a framework for managing B toxicity, pending field validation.

Graphical Abstract

1. Introduction

Boron (B) is considered an essential micronutrient for crop development, but the margin between its nutritional and toxic concentrations is narrow, making its agricultural management challenging [1,2,3,4]. Crop B tolerance is assessed based on the concentration of this element in the irrigation water, with tolerance thresholds that range between 0.05 mg L−1 for very sensitive crops and 15 mg L−1 for very tolerant ones [5]. In particular, citrus is very sensitive, with a tolerance threshold ranging between 0.50 and 0.75 mg L−1 [6,7].
Interestingly, the thresholds used to define crop B tolerance were established in trials performed in sandy soils [7] to minimize interference from soil properties. However, plant B availability strongly depends on soil characteristics. Therefore, the same irrigation water B concentration can have markedly different effects on crops depending on soil properties [4,8,9].
Soil pH, texture, and soil organic matter (SOM) are key factors controlling the distribution of B in soils between soluble and adsorbed forms, with the soluble fraction representing the pool available for plant uptake [10]. Soluble B consists primarily of boric acid (B(OH)3) and borate (B(OH)4), which exist in a pH-dependent equilibrium that favors B(OH)3 below pH 9.2 [11]. Because B(OH)3 is a small, uncharged molecule, biological membranes are highly permeable to it, allowing passive diffusion into root cells, subsequent loading into the xylem, upward transport to the shoot [12], and concentration in the leaves because phloem redistribution is limited, particularly in citrus [13]. In contrast, soil adsorbed B is bound to clay-sized minerals and SOM, mainly through inner-sphere complexes with hydroxyl groups [14]. Like the soluble forms, adsorbed B is in dynamic, pH-dependent equilibrium with soluble B [15,16].
B essentiality is traditionally considered multifaceted because it influences diverse plant physiological processes, in which its unique capacity to bond to compounds with cis-hydroxyl groups, i.e., cis-diols, makes it irreplaceable [17,18]. Primarily, B plays a key role in cell wall maintenance through the formation of ester B bridges between polysaccharides within the cell wall and between the cell wall and the plasma membrane [19,20,21]. However, precisely because of its strong affinity for cis-diols, B also readily binds to ribose, both as a free sugar and as part of RNA, ATP, and NAD(P)H, thereby interfering with the functions of these important metabolites [22].
The disruption of plant metabolism caused by excess B leads to elevated production of reactive oxygen species (ROS), particularly in organs where B accumulates the most, such as the leaves, thereby impairing the photosynthetic function [23,24,25]. Ultimately, B excess manifests as leaf injuries, growth inhibition, and yield reduction [26,27,28,29,30]. Crop-damaging levels of B are most often observed in drylands, where soil B is usually high, because, if added through the irrigation water, the limited drainage prevents its leaching [31,32]. Precisely, in these water-scarce areas, non-conventional irrigation with desalinated seawater (DSW) and reclaimed water (RW), which are usually high in B (>1 mg L−1), is increasingly introduced [33,34]. Therefore, the safe use of DSW and RW requires an understanding of how crop B uptake depends on irrigation water B and soil characteristics, specifically in citrus, due to their low B tolerance.
Beyond irrigation water and soil characteristics, the rootstock is central to crop B uptake, since it provides the entry point for B into the plant and mediates its transport to the scion. This key role has been made particularly evident for grafted citrus in which successful adaptation to excess B has been linked to, specifically, root and xylem morphology and reciprocal signaling between rootstock and scion [35].
Among citrus rootstocks ‘Citrange’ Carrizo (CC) has recently become a benchmark for B tolerance testing [23,25,36,37,38,39]. This hybrid of Citrus sinensis (L.) Osbeck and Poncirus trifoliata originated from a mutant seed of ‘Troyer’ citrange in ‘Carrizo’ Springs, Texas (USA). CC is widely used as a rootstock in major citrus-growing regions worldwide because of its vigor and broad cultivar compatibility [40]. However, CC has also notable limitations, including sensitivity to soil salinity, lime and B [36,38]. As a result, research efforts have focused on developing alternative rootstocks for citrus cultivation in regions where such unfavorable soil conditions prevail.
One promising alternative to CC is ‘Forner-Alcaide 5’ (FA5), which is a hybrid of Citrus reshni (‘Cleopatra’ mandarin) and Poncirus trifoliata. FA5 is valued for its tolerance to soil salinity, lime and waterlogging, as well as resistance to citrus tristeza virus (CTV), nematodes, and Phytophthora spp. [41]. In terms of B tolerance, ungrafted FA5 has shown strong root resilience and reduced B accumulation in all plant organs compared with CC, though its leaves exhibit equal or greater physiological vulnerability [23]. These findings underscore the need to advance to the next stage of germplasm testing, in which FA5 should be evaluated as a grafted rootstock for a representative citrus cultivar. Sweet orange is a particularly suitable candidate, as it represents nearly 50% of global citrus production [42]. To our knowledge, such an evaluation of FA5, especially under contrasting soil conditions, has not yet been carried out.
Therefore, this study aims to evaluate the B uptake capacity of navel orange grafted onto FA5 in comparison to the CC benchmark, across soils with contrasting textures and to develop, consequently, a quantitative model that relates B uptake by citrus seedlings to soil B.

2. Materials and Methods

2.1. Experimental Layout

A total of 108 Citrus sinensis (cv. Navelina) seedlings grafted onto two rootstocks: CC (n = 54) and FA5 (n = 54) were cultivated in pots (14.5 cm in diameter × 17.5 cm in height) filled with two soils of contrasting textures and irrigated with water containing three different B concentrations. A complete factorial design of 12 treatments (2 rootstocks × 2 soil textures × 3 B concentrations) was set up, with nine seedlings, i.e., replicates, randomly assigned per treatment. The seedlings were randomly arranged on a bench in a temperature-controlled (18–26 °C) greenhouse and the trial lasted 336 days, from planting on 18 October 2022 to 19 September 2023.

2.2. Plant Material

The rootstock seedlings grafted with Navel orange were provided by the plant nursery Viveros Beniplant S.L. (Peñíscola, Castellón, Spain).

2.3. Soil and Irrigation

A silty clay loam soil, very low in organic matter and strongly calcareous, was obtained from the peat and soil supplier Abonos Conde (Paterna, Valencia, Spain). The soil was sieved to 2 mm and divided into two portions. One portion was mixed with 50% silica sand (0.6–0.8 mm), while the other was left unmixed. This procedure yielded two soil types that could be commonly found under real-world conditions: a clay loam and a sandy loam (Table 1). Both presented comparable pH and low SOM, which was intended to avoid their interference in this study (Table 1). Each pot was filled with 3.6 kg of soil, achieving an average bulk density of 1.24 g cm−3, representative of non-compacted agricultural soils.
Irrigation was supplied via a drip system with one 2 L h−1 emitter per pot, using tap water of almost constant composition (Table 2), in which analytical grade boric acid was dissolved to obtain three B concentrations (0.11, 2, and 5 mg L−1). A total of 37.8 L per pot was applied to keep the soil water content near field capacity, thereby avoiding plant water stress and minimizing drainage.

2.4. Samplings and Laboratory Analyses

Over the 336-day experiment (18 October 2022–19 September 2023), three seedlings, together with their corresponding soils, were randomly and independently selected from each treatment at three dates (27 March, 22 June, and 19 September 2023) and taken to the laboratory for analysis.
Soils were left to dry at room conditions. Then, the air-dried soils were disaggregated to pass a 2 mm mesh sieve. The soil hygroscopic water content was determined by weight difference before and after drying a subsample at 105 °C for 24 h in a DIGIHEAT laboratory oven (J.P. Selecta, Barcelona, Spain). Next, two operationally defined soil B fractions were obtained: soluble B and adsorbed B.
The soluble B was extracted by equilibrating 10 g air-dried soil subsamples with 25 mL of CaCl2 0.025 M for 2 h in a reciprocal shaker, the suspensions centrifuged, and the supernatants decanted, filtered and saved at 4 °C. The adsorbed B was extracted by resuspending the sedimented soil materials and equilibrating with 15 mL of CaCl2 0.025 M for 30 min on a reciprocal shaker. This procedure was repeated five times to ensure the extraction of all readily desorbable adsorbed B, thereby simulating the effects of intensive leaching with water of low–moderate salinity. The five filtered supernatants were joined together and saved at 4 °C. The B concentration in both extracts was determined by inductively coupled plasma atomic emission spectrophotometry (ICP-AES) following the ISO 11855:1996 water analysis standard [43] using an iCAP 6500 Duo spectrometer (Thermo Fisher Scientific Inc., Waltham, MA, USA).
Collected plants were split into three different organs, i.e., leaves, stems, and roots. Then, every plant material was weighed, briefly rinsed with tap water, followed by type 1 water to remove all external dirt, but without extracting internal B. Then, the plant material was dried in an air-forced Dry Big laboratory oven (J.P. Selecta, Barcelona, Spain) at 65 °C for 5 days. The oven-dried plant samples were weighed to determine the water content they had when fresh, and subsamples were taken and ground to pass a 200 µm mesh sieve. The B concentration in the plant samples was determined by ICP-AES in concentrated HNO3 and 33% H2O2 microwave digestion extracts [44], following the same standard and using the same spectrometer as stated for soil extracts.

2.5. Data Analyses

Before the statistical analyses, the normality of empirical distributions for B concentrations in plant organs (leaves, roots, and stems), soil fractions (soluble and adsorbed), and plant biomass, was assessed by calculating skewness and kurtosis coefficients. If these coefficients were outside the ±1 bounds, the distributions were considered non-normal [45]. Remarkably, non-normality in dependent variable distributions undermines the assumption of homogeneity of variances required to obtain reliable analysis of variance (ANOVA) results [46]. Consequently, Box–Cox transformations, such as logarithmic, square root, etc., of the original variables were tried, and the skewness and kurtosis of the transformed data distributions were evaluated again to check if the transformations had worked. The SPSS statistical package v19 (Chicago, IL, USA) was used to perform all the data analyses.
Four or three-way ANOVA was performed to determine how the B concentration in the different soil–plant system compartments, namely, soil solution and solids, plant leaves, stems, and roots, depended on the experimental factors: the B concentration factor at three levels (0.11, 2 and 5 mg L−1), the soil texture factor at two levels (sandy loam and clay loam), and the rootstock factor at two levels (CC and FA5). The sampling date at three levels (27 March, 22 June, and 19 September 2023) was treated as another fixed effects factor. Interactions were tested until the second-order and if the experimental factors presented a significant effect (p < 0.05) on any of the B concentrations, the treatment means were separated using Duncan’s multiple range test because of its power to detect significant effects while controlling for Type I errors [47].
Following the rationale outlined in the discussion section below, Mitscherlich functions of the form given by Equation (1) were fitted to relate plant B concentration (y) to soil B concentration (x), with a, b and x0 as fitting parameters, with the aim of developing a model for plant B uptake.
y = a   ( 1 e b   x + x 0 )
Model parameters (a, b and x0) were estimated by minimizing the sum of squared differences between predicted and observed B concentrations in plant organs, using the generalized reduced gradient (GRG) nonlinear optimization algorithm [48]. Goodness of fit was evaluated using the coefficient of determination (R2). Confidence intervals were estimated using bootstrap resampling.

3. Results

3.1. Boron Concentration in Plants and Soils

Foliar B concentration ranged from marginal (25 mg kg−1) to toxic (up to 1300 mg kg−1), surpassing on average (270 mg kg−1) the established toxicity threshold for citrus (260 mg kg−1 [49]. Next, root B followed with concentrations within a lower range (7–690 mg kg−1) and finally, stem B with between 12 and 55 mg kg−1 (Table 3). Accordingly, leaves appear to be the primary plant site for B accumulation, presenting significantly more B concentration than roots or stems (Table 3). Interestingly, root and foliar B exhibited highly positively skewed and leptokurtic distributions, whereas stem B more closely approximated normality (Table 3). For root and foliar B, normality was achieved after logarithmic transformation. Although not needed for stem B, this was also subjected to logarithmic transformation to ensure consistency in the ensuing data analyses.
Soil B concentrations covered an even wider range of order-of-magnitude than plant B concentrations, with adsorbed B (0.08–17 mg kg−1) consistently exceeding soluble B (0.01–10 mg L−1), indicating dominant adsorption (Table 3). Soluble B showed a moderately positively skewed and leptokurtic distribution, whereas adsorbed B fulfilled the criteria for normality (Table 3). For both, the logarithmic transformation did not sufficiently improve normality. However, the square root did, as the skewness and kurtosis values closer to zero show (Table 3).

3.2. Plant Biomass

Total plant dry biomass at trial end ranged between 60 and 225 g with a mean of 120 g (Table 4). Root and stem biomass were quite similar, whereas leaf biomass seemed to be slightly lower. In absolute terms, biomass at trial end was 15–20% lower than that reported for younger trees in comparable studies [23,50]. However, in relative terms it remained consistent with those studies [50]. Biomass partitioning showed roots as the dominant sink (37.2% of total), followed by stems (35.7%) and leaves (27.1%), reflecting typical resource allocation in young grafted citrus seedlings.
In general, plant biomass presented a positively skewed and leptokurtic distribution, with root biomass as the farthest away from normality, leaf biomass as the nearest and total biomass in between both, but strictly not fulfilling the requirements for normality (Table 4). Application of the logarithmic transformation successfully normalized the biomass distribution in all organs by reducing skewness and kurtosis to under 0.5 in absolute value (Table 4), thereby making them meet parametric test assumptions for the subsequent analyses.

3.3. Boron in Soils and Plants Throughout Treatments

The results of the four-way ANOVAs indicated that the irrigation water B concentration determined to a large extent the soil B concentration, both soluble and adsorbed, and also the B concentration in leaves and roots, but not in stems (Table 5). Furthermore, a significant interaction between irrigation water B concentration and sampling date revealed (Table 5) that its effect on both soil B fractions, as well as on B in leaves and roots, changed in magnitude or direction over time, thereby pointing towards an accumulation effect on both soils and plants.
Interestingly, the rootstock factor (CC versus FA5) had no significant effect on the B concentration in any compartment of the soil–plant system. In addition, the effects of the irrigation B concentration did not differ between CC and FA5 rootstocks. However, the significant rootstock-by-date interaction for leaf B (Table 5) suggests a change in the speed of B plant accumulation depending on the rootstock. Specifically, at the beginning of the trial (up to 160 days), CC accumulated B in leaves more rapidly than FA5. However, by the end of the trial, the FA5 rootstock closed the gap of B concentration with CC.
Soil texture exhibited an effect on soil adsorbed B and on leaf B. Specifically, the clay loam accumulated more adsorbed B than the sandy loam. However, soil texture did not change the effect of the irrigation water B on B concentration in any compartment of the soil–plant system. On the contrary, for soil adsorbed and leaf B, a significant soil-by-date interaction emerged, with the sandy loam accumulating B more rapidly at the beginning of the trial (up to 160 days), which suggests delayed equilibrium (Table 5).

3.3.1. Boron Build-Up in Soils

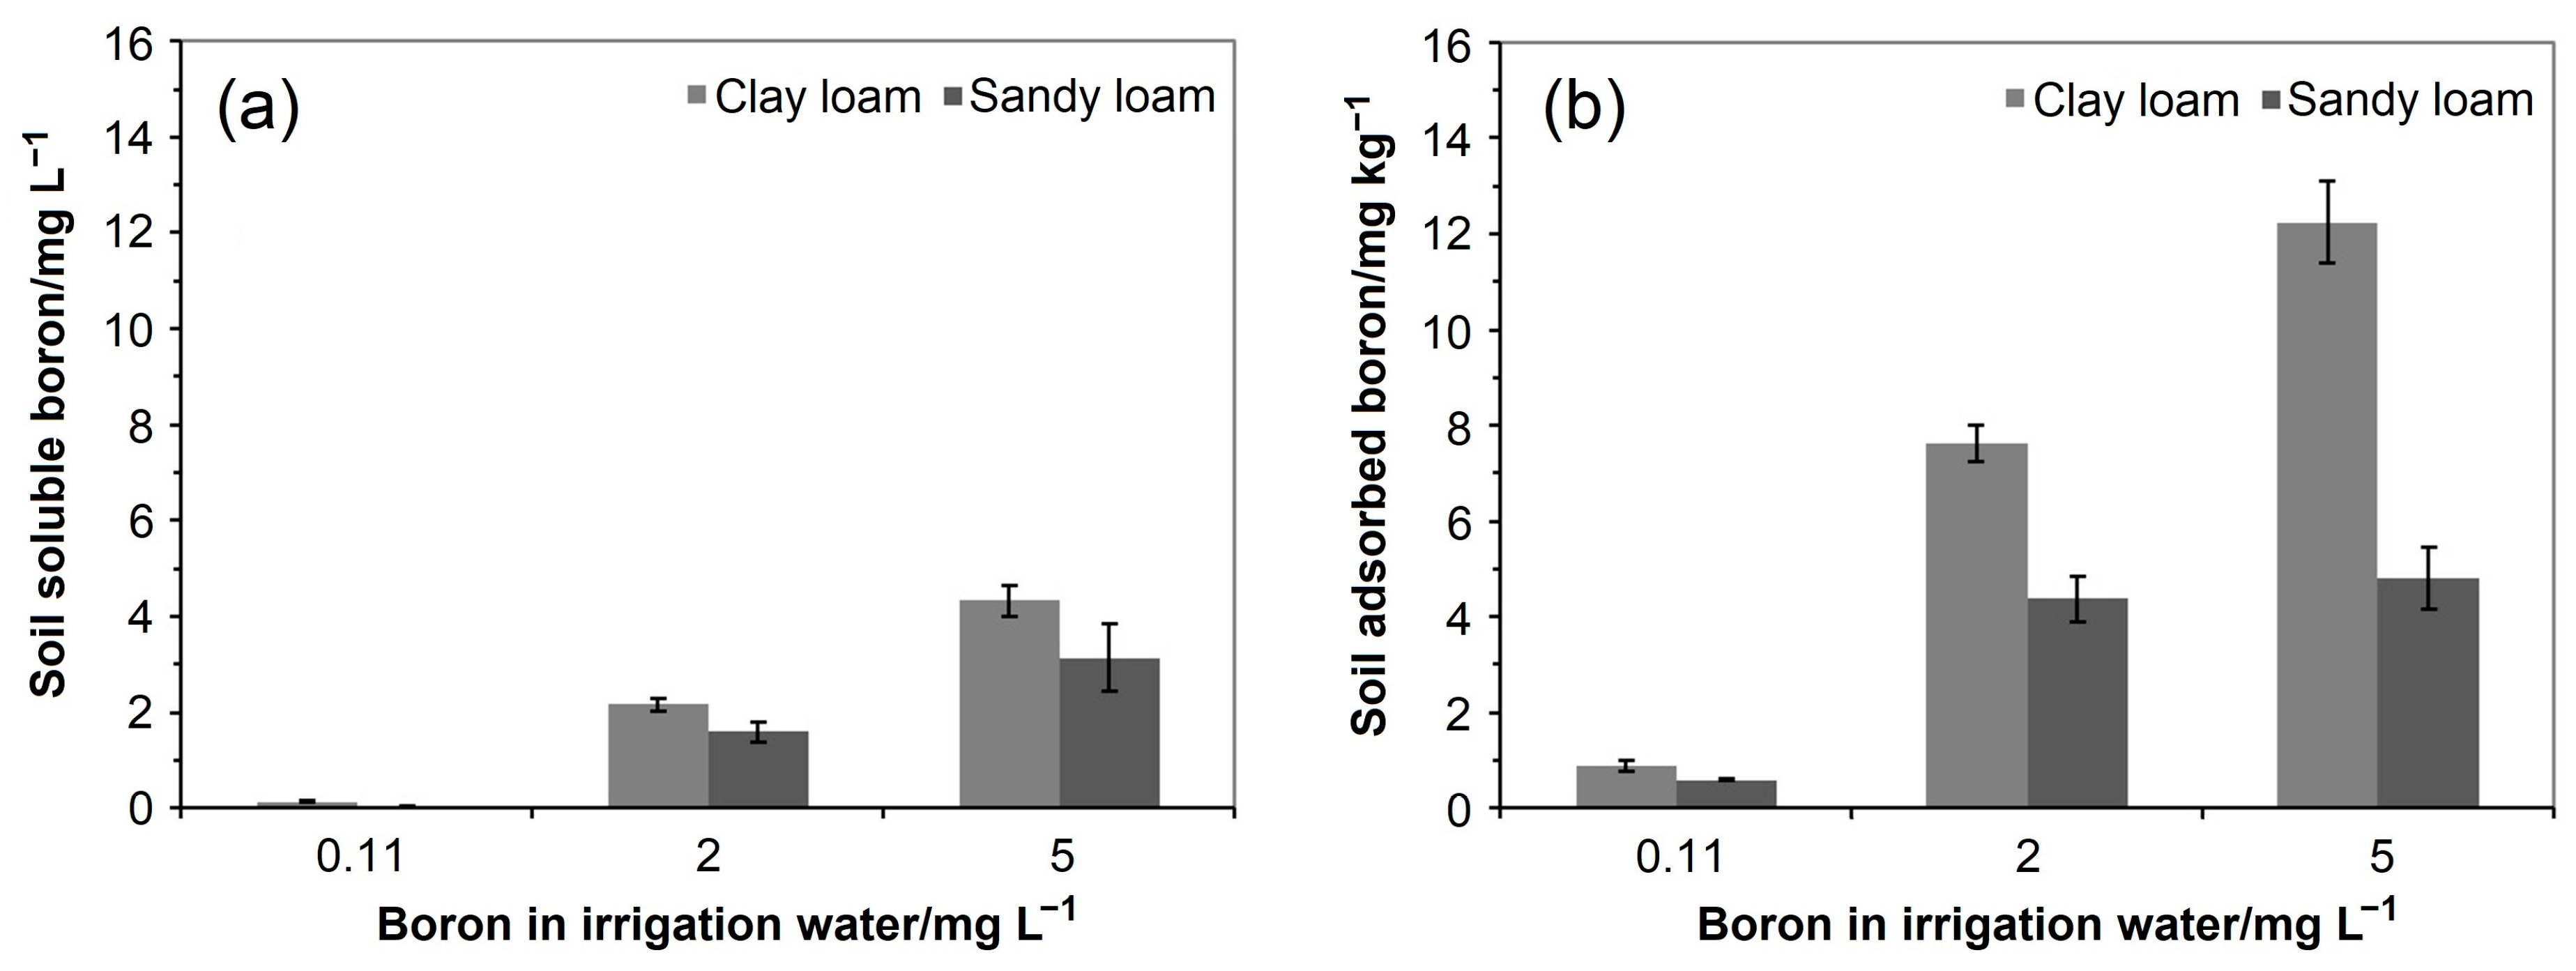
Increasing irrigation water B concentration raised both soluble and adsorbed B in the soil (Figure 1). In contrast, higher clay content did not affect soluble B but did increase adsorbed B. Specifically, the clay loam contained significantly more adsorbed B (maximum of 14.2 mg kg−1) than the sandy loam (4.37 mg kg−1; Figure 1).
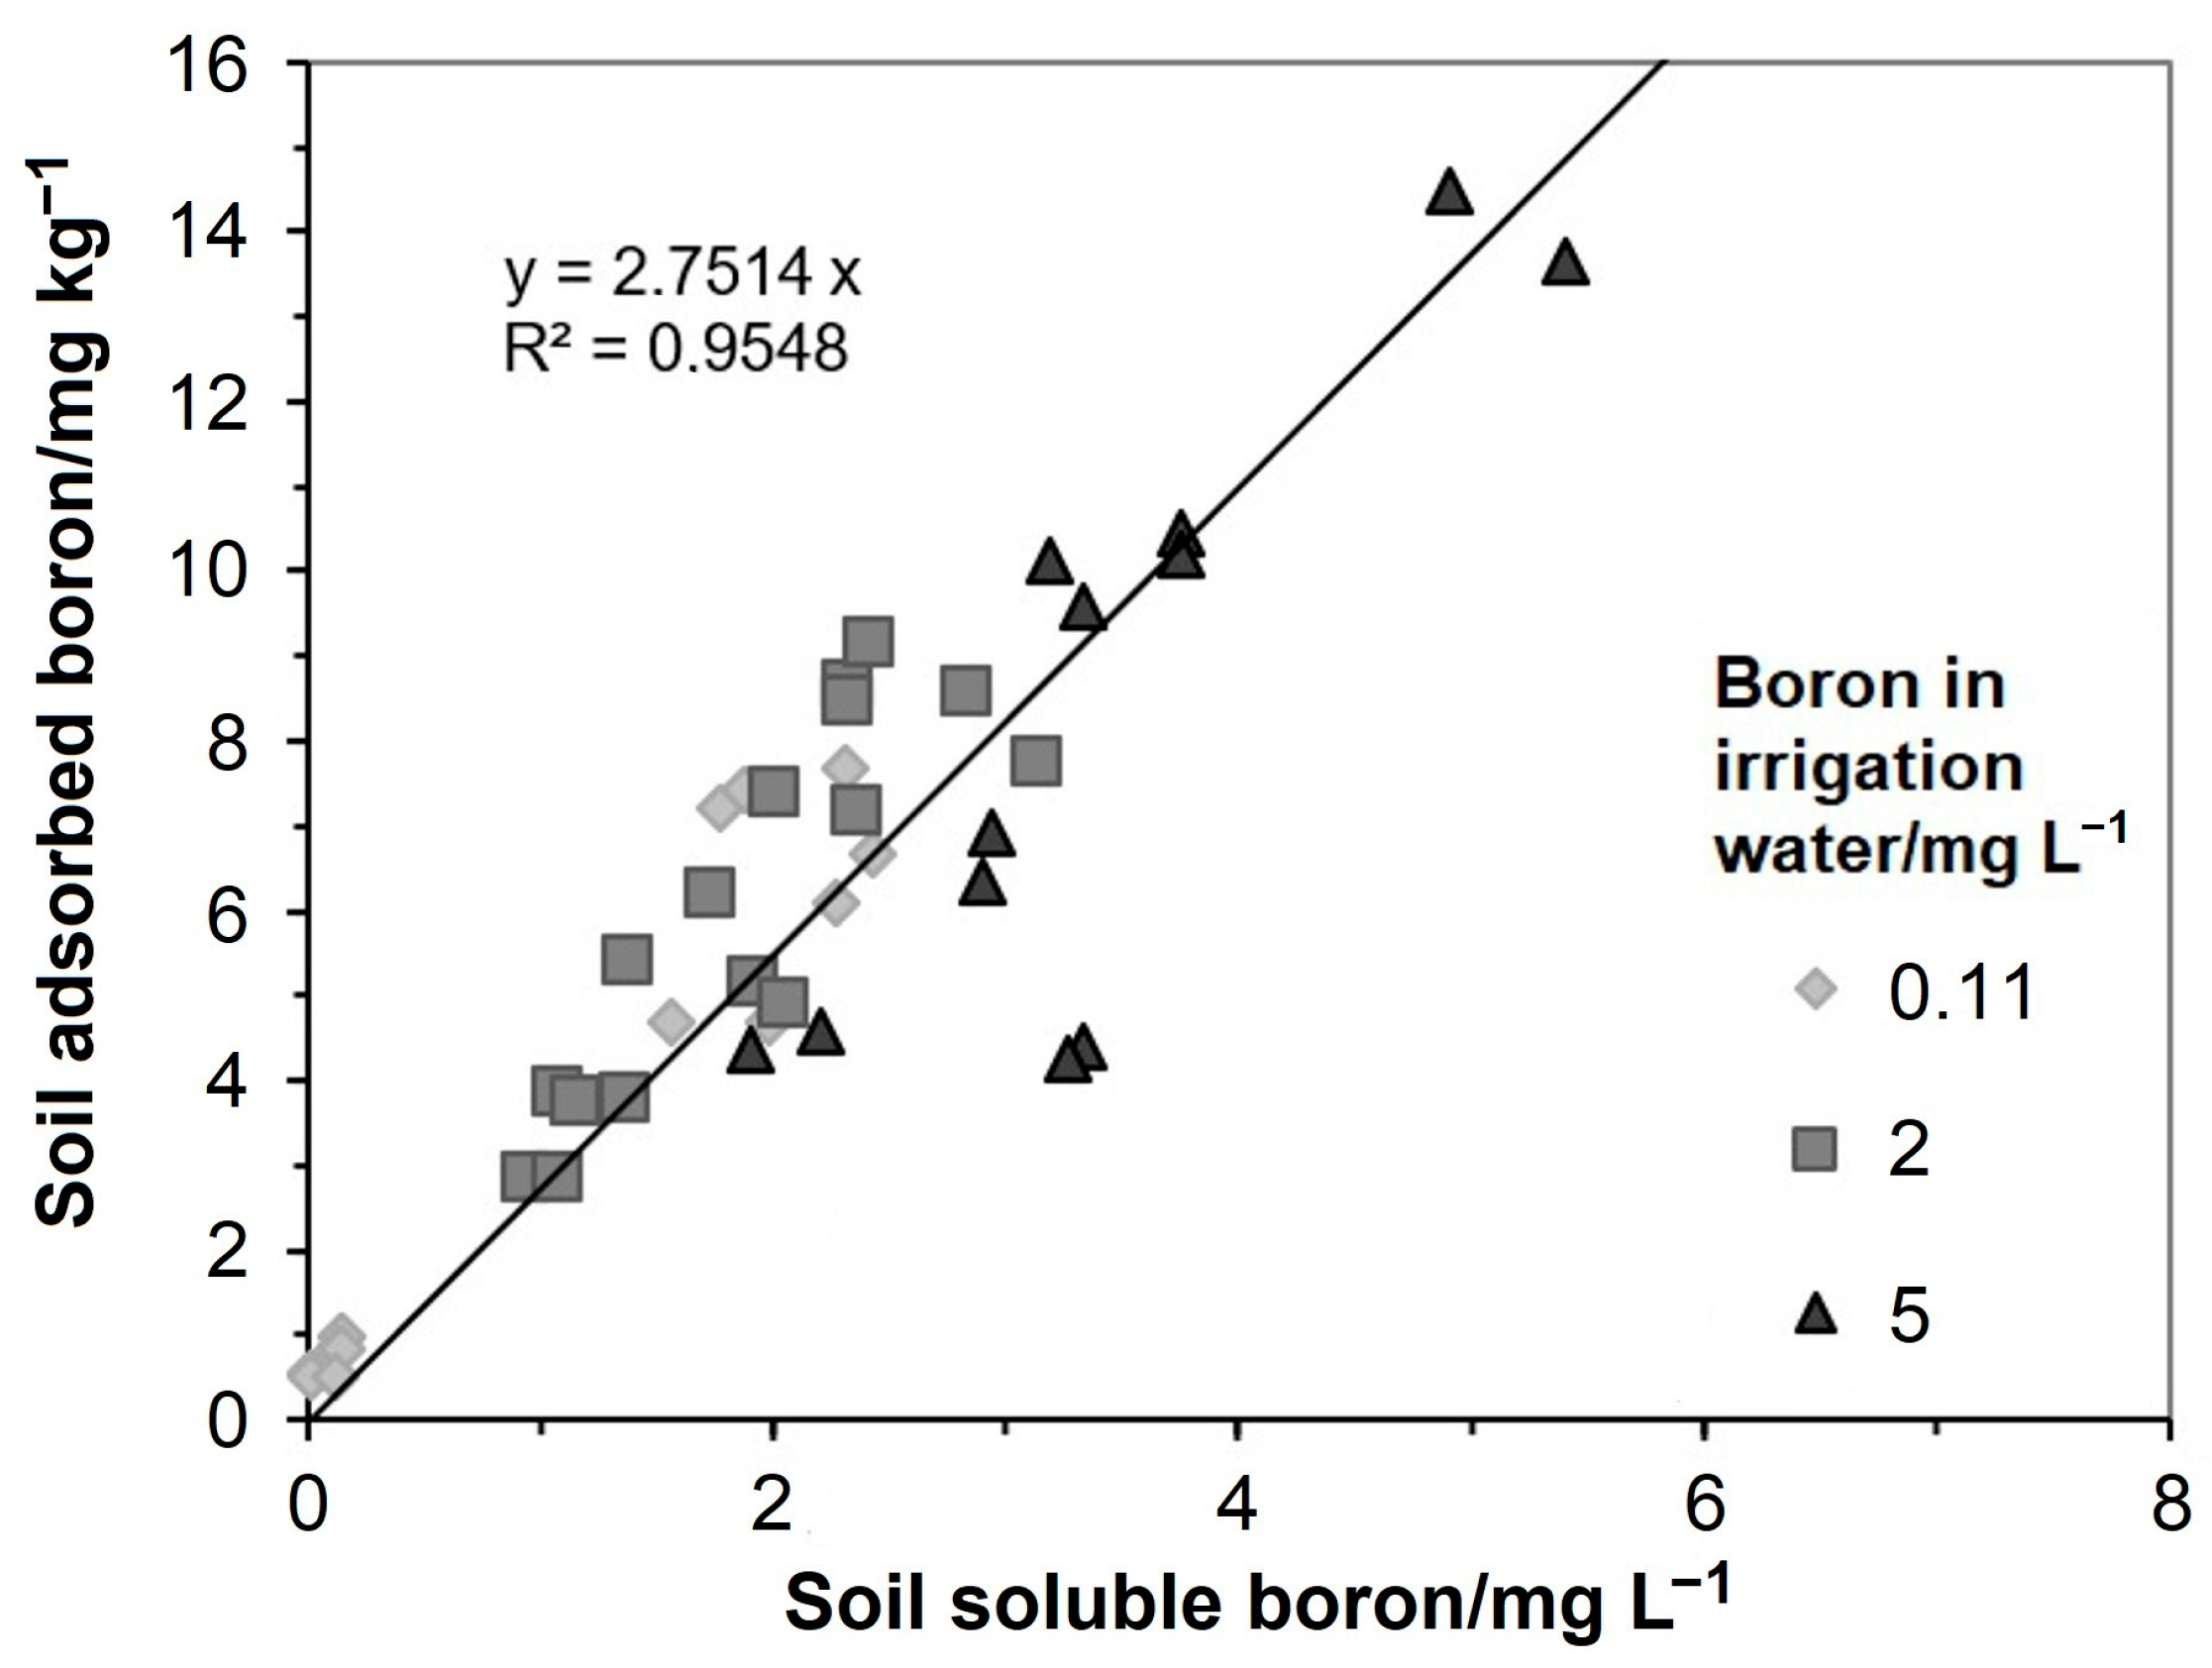
At the end of the experiment, the equilibrium between soluble and adsorbed soil B featured an adsorbed-to-soluble B ratio of 2.75 (Figure 2).

3.3.2. Boron Uptake by Plants

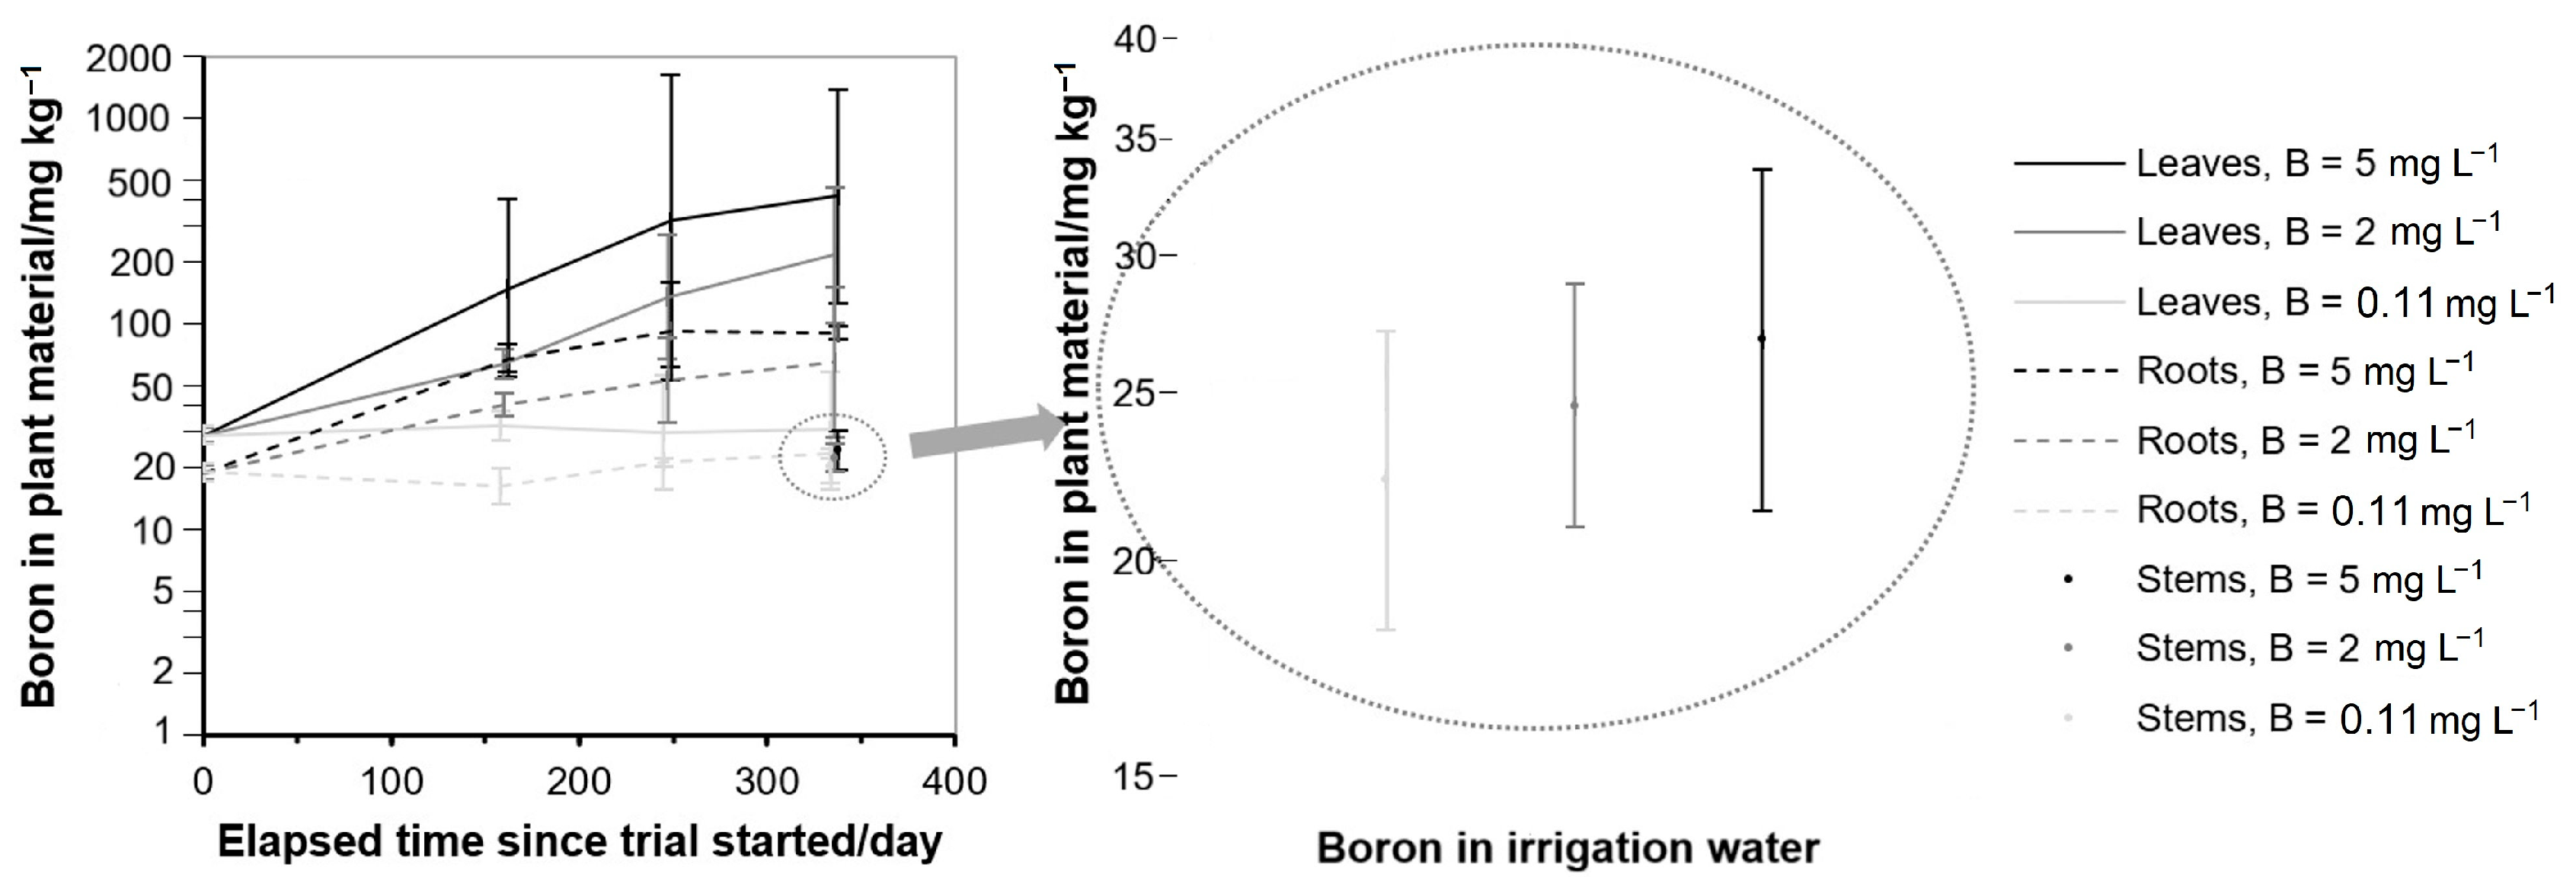
Leaf and root B increased progressively with irrigation water B. In contrast, stem B at the end of the experiment remained lower and independent of irrigation water B (Figure 3).

3.4. Plant Biomass Throughout Treatments

The results of the three-way ANOVAs at trial end indicate that the irrigation water B significantly determined the biomass of leaves, but not of roots or stems or in total (Table 5). Interestingly, the absence of significant interactions between irrigation water B and the other factors in the experimental layout (Table 5) suggests that the effects of water B on plant biomass were consistent across soil textures and, notably, did not differ between the CC and FA5 rootstocks. Soil had no effect on plant biomass, nor did it influence its response to water B. In contrast, the rootstock factor significantly affected stem and root biomass, and consequently total biomass, but had no effect on leaf biomass (Table 5).
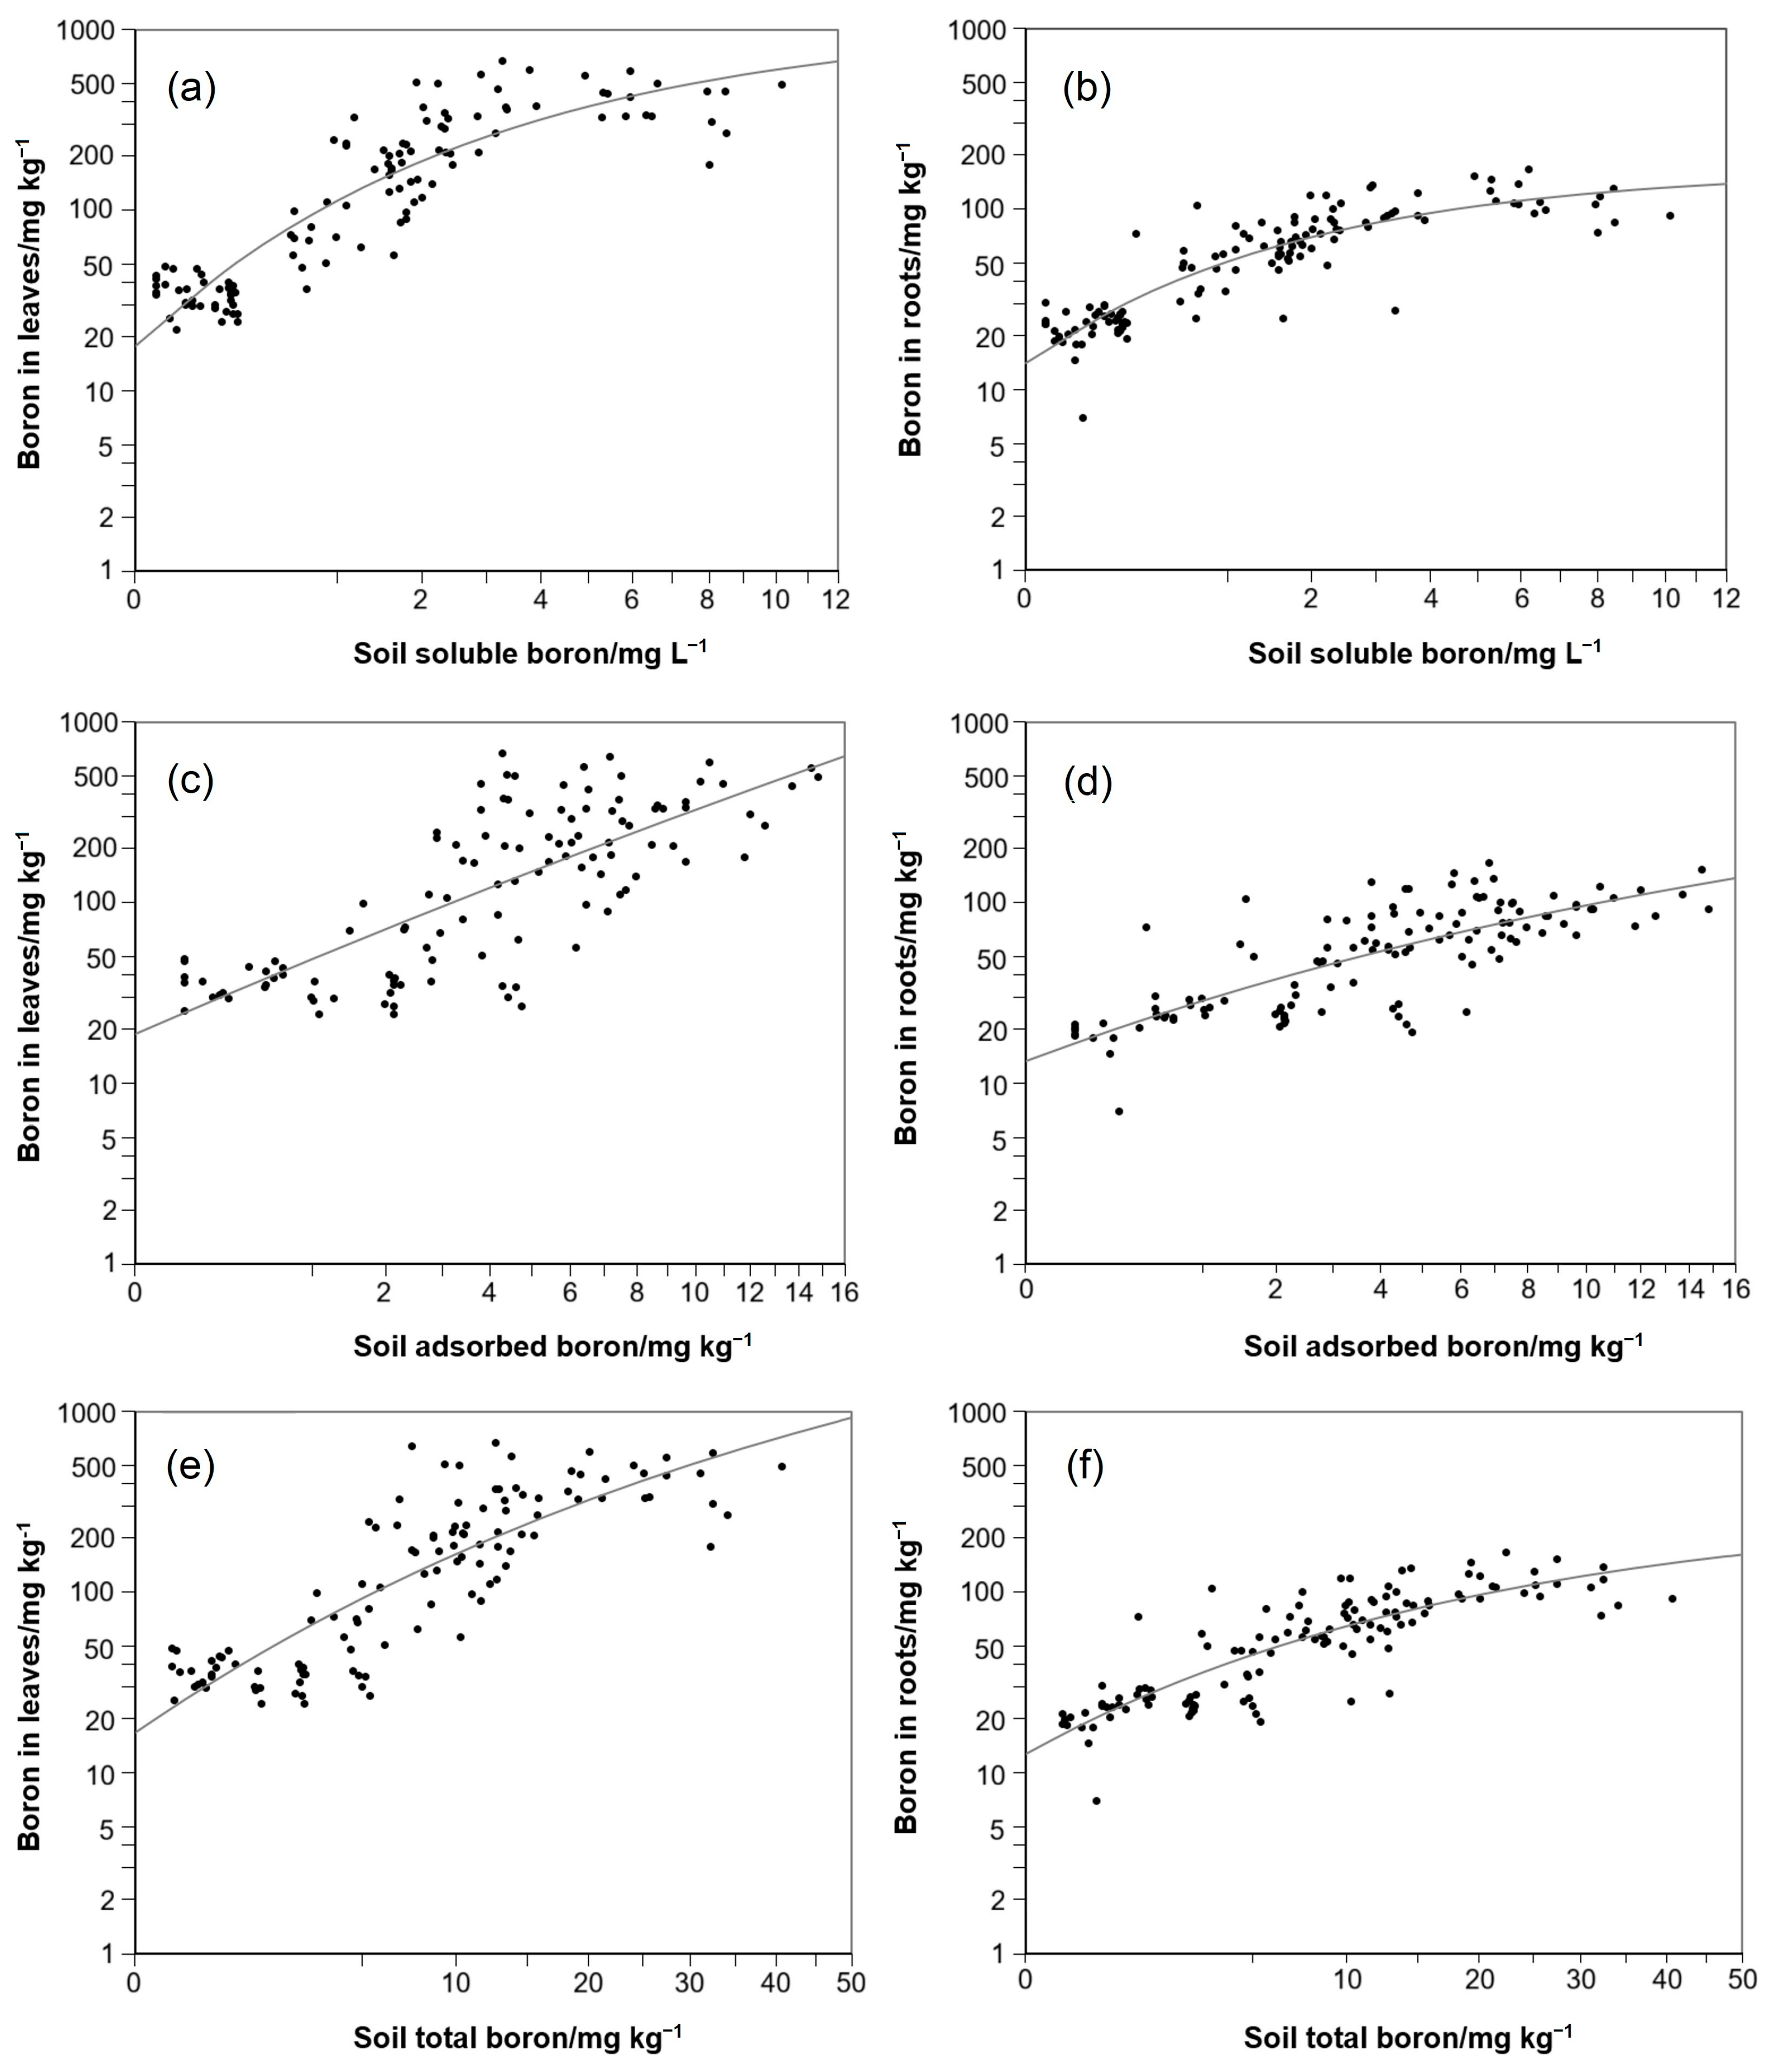
Specifically, under low-boron conditions, no significant differences were observed between the two rootstocks. In contrast, under boron application, the FA5 rootstock produced 39% more total biomass than CC (Table 6). In particular, FA5 biomass increased from 0.11 to 2 mg L−1, peaking at this level, and then declined between 2 and 5 mg L−1 (Table 6). Remarkably, however, biomass at 5 mg L−1 remained higher than at 0.11 mg L−1 (Table 6). These results indicate that FA5 exhibits greater tolerance to B than CC, with a toxicity threshold likely around 2 mg L−1 in irrigation water, which corresponds to approximately 220 mg kg−1 in leaves (Figure 4).

3.5. Modeling Plant Boron Uptake

The analysis of B concentrations in plant organs and soils showed a broad concentration range, supporting the suitability of the dataset for developing a model that simulates B uptake by citrus. To support model development, we examined the plots of B concentration in leaves and roots in particular, which serve as primary B storage sites to plant-available soil B.
The plotted data suggest the existence of curvilinear relationships between the decimal logarithms of both leaf and root B concentrations and the square roots of the three soil B fractions (soluble, adsorbed and total). In all cases, leaf and root B showed a gradually diminishing increase that approached a saturation limit, which was markedly higher in leaves than in roots (Figure 4). The shapes of these curves resembled a Mitscherlich-type response, and this function was therefore fitted to the experimental data in each case (Figure 4). In contrast, stem B was almost constant throughout the range of variation in the soil B fractions.
The determination coefficients (R2) of the fitted Mitscherlich function that relate leaf and root B to all three plant-available soil B fractions were significantly over 0.5 (Table 7). However, the functions featuring soil soluble B presented highly significantly higher R2 than the functions featuring soil total B (p < 0.003) and soil adsorbed B (p < 3 × 10⁻¹⁰) in this order. There were also highly significant differences between adsorbed and total (p < 2 × 10⁻⁴; Table 7). Conversely, the functions featuring foliar and root B did not present significantly different R2 (p > 0.1 and Table 7). These results indicate that foliar and root B are closely linked to soil B and, especially, to the soluble fraction.
The diminishing-returns pattern of the relationship between leaf and root B and soil B fractions, i.e., approximately linear at low concentrations but gradually leveling off towards a saturation ceiling at higher concentrations, is consistent with a physiological uptake limit. Conversely, stem B content showed no significant dependence on soil B (Figure 4), supporting the role of stems as B transport pathways rather than storage sites.

4. Discussion

The pronounced foliar accumulation of B, together with the markedly low concentrations in roots and stems observed in this study, supports the notion that leaves act as the primary sink for B in citrus (Table 3), which is consistent with previous findings [51,52]. This pattern aligns with the passive uptake of B, its upward transport via the transpiration stream, and the limited redistribution from leaves [53].
Leaf and root B increased progressively with irrigation water B, supporting passive uptake via transpiration-driven xylem transport. In contrast, stem B at the end of the experiment remained lower and independent of irrigation water B (Figure 3), corroborating limited phloem mobility [51,54]. In plants, boric acid enters the roots primarily by passive diffusion due to the small size and neutral charge of the B(OH)3 molecule [12]. Boron is subsequently loaded into the xylem and transported to the shoots via the transpiration stream, ultimately reaching the leaves [13]. Within leaf cells, B binds to complex cell wall polysaccharides, particularly rhamnogalacturonan II, thereby becoming key to the structural integrity of the cell wall [19]. In addition to its retention in the cell wall, boron, especially under conditions of excess, can bind to anthocyanins, facilitating its compartmentalization within vacuoles [18]. However, especially in citrus species, the substantial accumulation of B in leaves may exceed its vacuolar compartmentalization capacity, which may partially explain the pronounced B sensitivity observed in this genus [55].
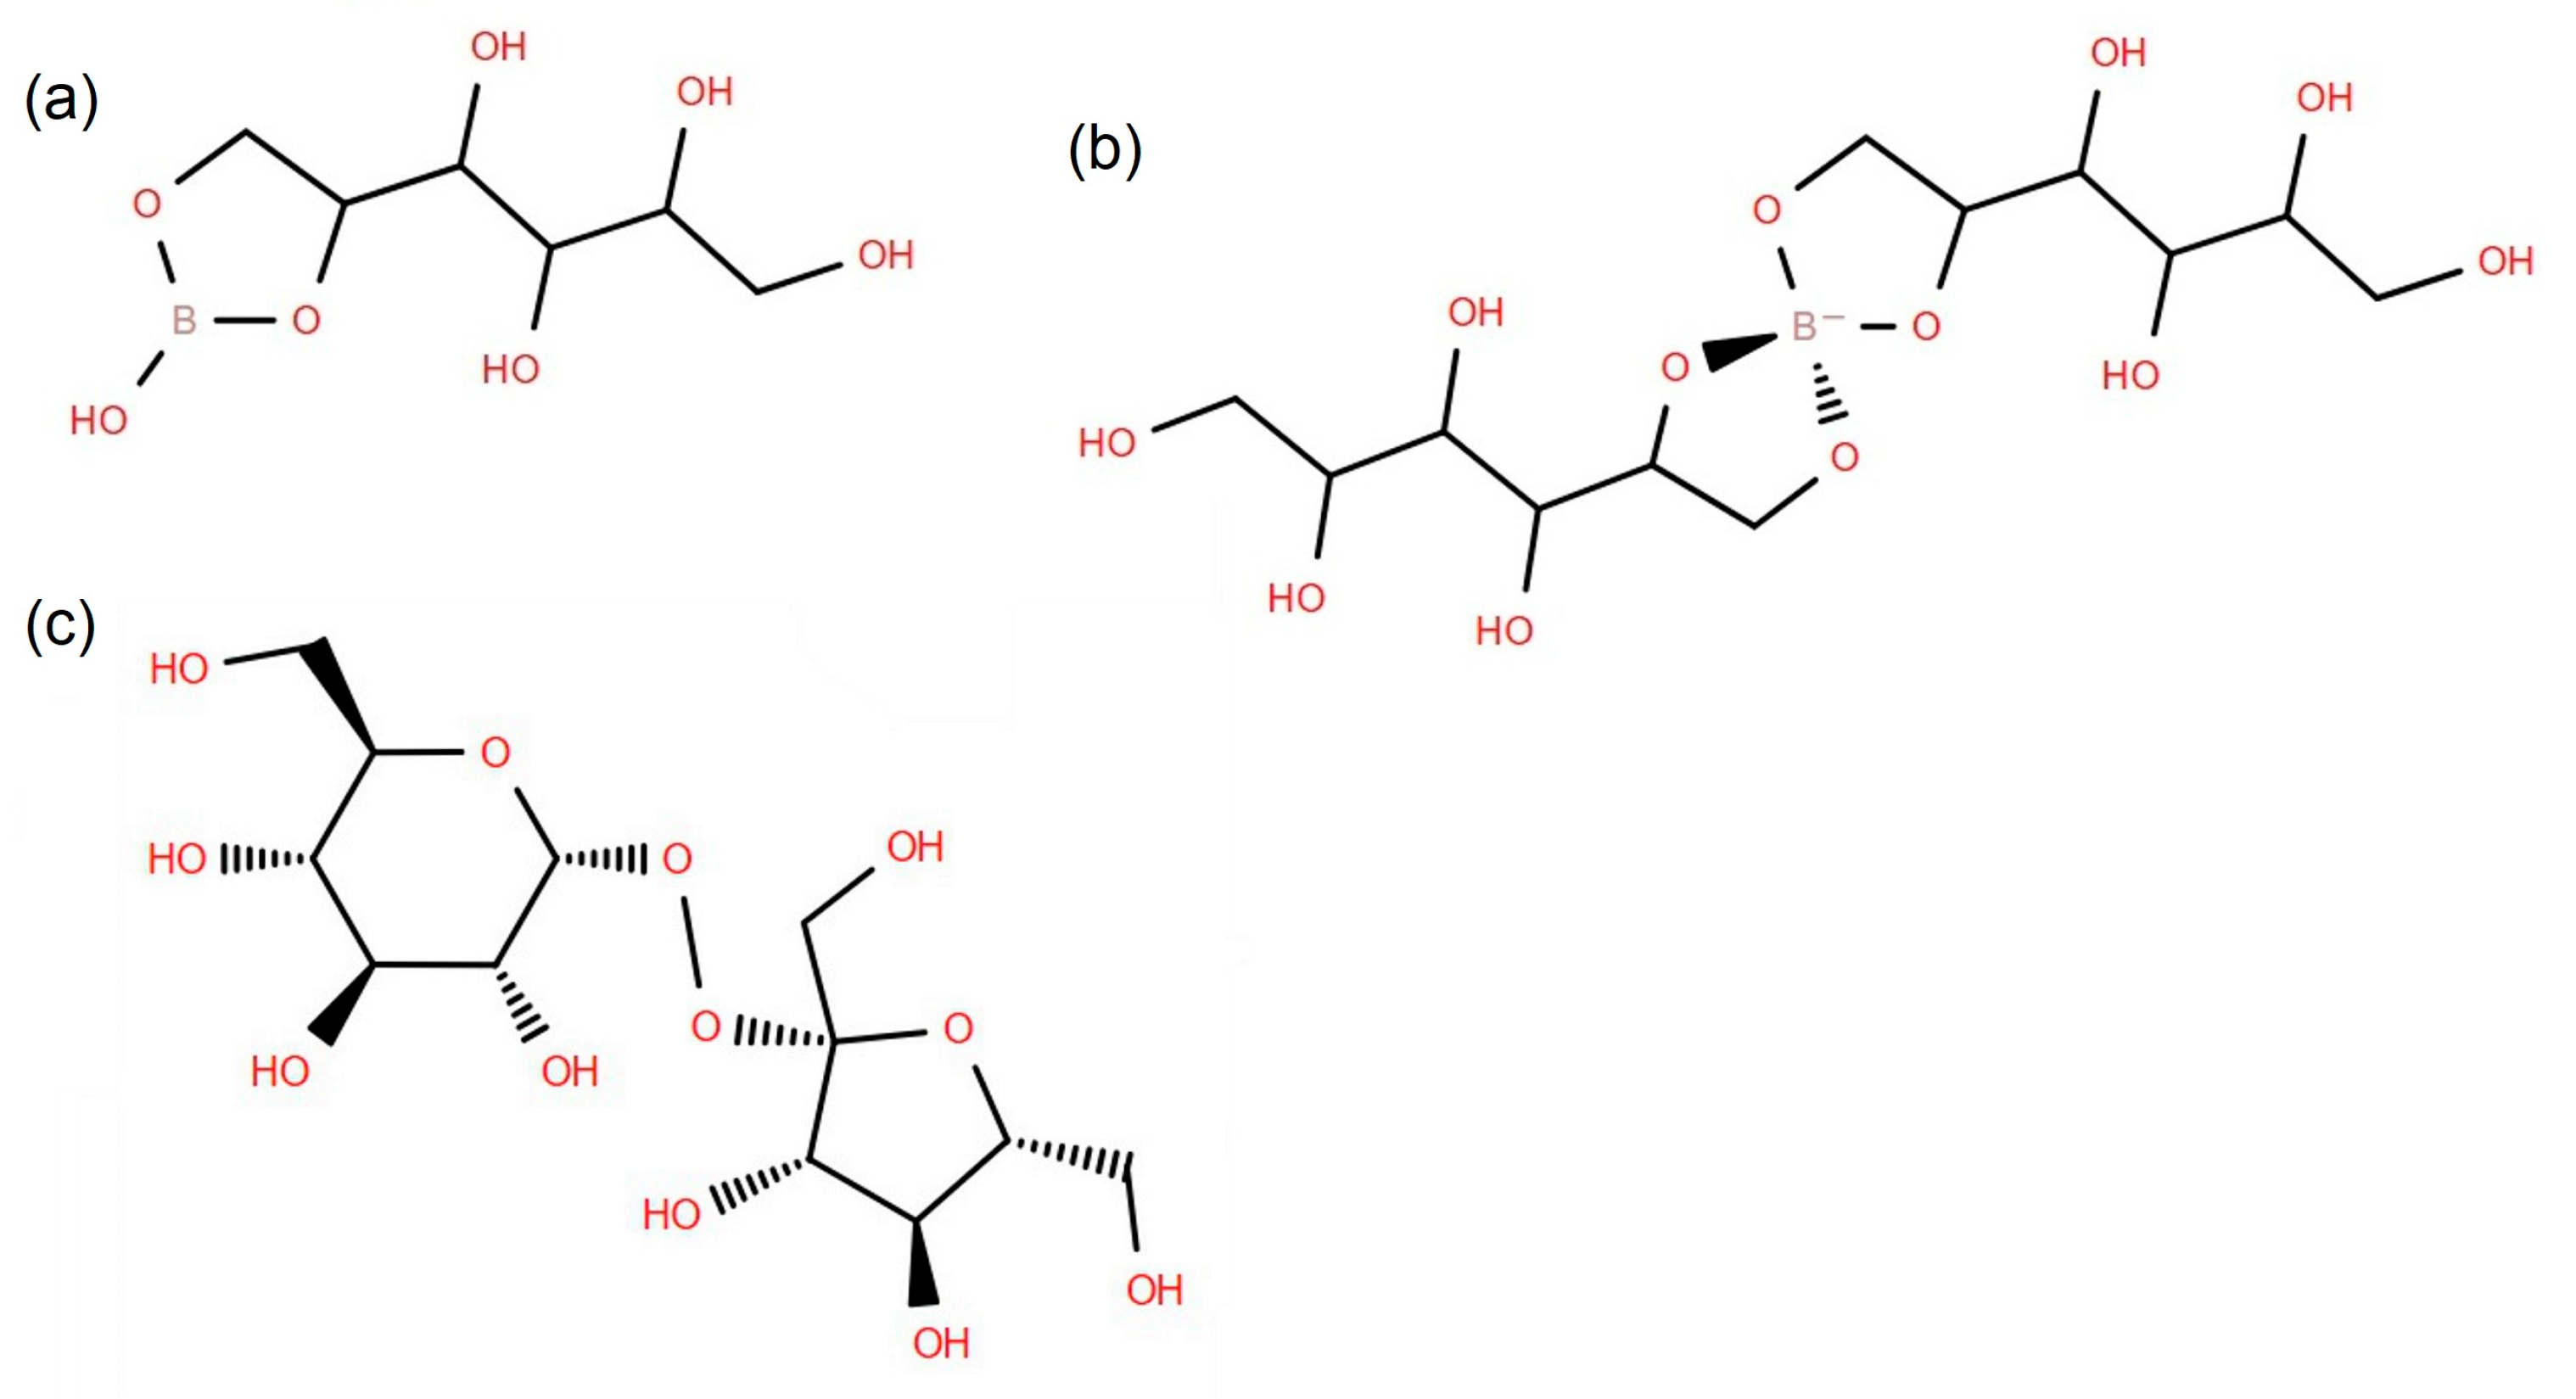
A common feature of plant compounds to which B binds is the presence of hydroxyl groups (–OH) on adjacent carbon atoms. These neighbor diols enable the formation of highly stable dioxoborolane rings when B binds as a monoester, or spiro-bis (dioxoborolane) structures when it binds as a diester (Figure 5). From leaves, some B redistribution to other plant tissues via the phloem may occur [56,57], although the efficiency of this process seems to be species-dependent [52,58,59]. In fact, while root permeability and xylem transport for B is relatively widespread throughout plants, phloem translocation appears to be restricted to certain species that produce glycitols (sugar alcohols), which are polyols such as sorbitol, mannitol, galactitol, dulcitol, etc. [58,60,61,62].
Research has shown that glycitol-producing species, such as peach, apple, pear or olive, form esters between boric acid and hydroxyl groups in adjacent carbon atoms along these polyols that facilitate phloem B transport [58,60]. In contrast, non-glycitol-producing species like citrus present lower phloem B transport capacity, even though boric acid can also bind to sucrose, which is the most abundant disaccharide in citrus phloem [63]. However, the lower B-bonding capacity of sucrose may be due to the formation of two halfesters instead of one monoester, even though sucrose also presents hydroxyl groups in adjacent carbon atoms [56].
The high B-binding capacity of glycitols is attributable to the predominantly non-cyclic structures they adopt, which allow their hydroxyl substituents full rotational freedom around the C–C backbone of the molecules. As a result, adjacent hydroxyl groups can assume conformations in which the –O–C–C–O– atoms lie in a common plane, thereby fulfilling the requirements for B binding through the formation of dioxoborolane cycles (Figure 5). If in these five-membered heterocyclic rings the C–C–O angles are taken to be 107.8° as in ethanol [64], in addition to assuming average internuclear distances of 1.52, 1.42 and 1.36 Å for the C–C, C–O and B–O bonds [65,66], then the O–B–O angle is estimated to be 122.8° (Appendix A.2). The close match between this value and the trigonal angle of 120° characteristic of the sp2 hybridization of B valence atomic orbitals in boron–oxygen compounds suggests effective atomic-orbital overlap between B and O and, consequently, strong covalent bonding of B in the dioxoborolane cycle formed with glycitols.
In contrast, sucrose predominantly adopts closed-ring conformations in its glucose and fructose units, forming glucopyranose and fructofuranose, respectively (Figure 5). These cyclic structures exhibit trans orientations on all pairs of adjacent hydroxyl groups with lack of rotational freedom around the C–C bonds (Figure 5). As a consequence, the –O–C–C–O– atoms cannot achieve a coplanar arrangement. Indeed, if values of 64.3, 62.8 and 78.4° are assumed for the three relevant O–C–C–O torsion angles in sucrose [67], then the oxygen atoms are positioned at estimated distances of 2.77, 2.79 and 2.94 Å (Appendix A.1), which are 0.05, 0.07 and 0.22 Å longer than double the average B–O distance of 1.36 Å in boron–oxygen compounds, i.e., 2.72 Å [66], and therefore incompatible with effective overlap of the sp2 atomic orbitals from B with, simultaneously, the two sp3 atomic orbitals from the O atoms. Therefore, in sucrose, the stereoelectronic requirements for the formation of dioxoborolane rings are not met. As a result, sucrose cannot bind B in compounds of comparable stability to those formed by B with, e.g., rhamnogalacturonan II in cell walls, anthocyanins in vacuoles and glycitols in phloem. Consequently, sucrose cannot take B from rhamnogalacturonan II or anthocyanins and cannot function as a B transporter as effectively as glycitols.
In plants, glycitols are synthesized in leaves by reduction in the corresponding monosaccharides, then are translocated through the phloem, and frequently reoxidized again to the monosaccharides in sink organs, a reduction–oxidation cycle that requires ATP, NADH, and NADPH [68,69]. Therefore, the glycitol metabolism is energetically costly, and its evolutionary development suggests that glycitols must confer significant adaptive advantages to the plant. Among these, enhanced tolerance to abiotic stresses, such as drought, salinity, and extreme temperatures, seems key [68,69].
Notably, glycitols stand out as transport carbohydrates in trees of the Rosaceae family, particularly within the genera Malus (apple), Pyrus (pear), and Prunus (peach, plum, apricot, etc.) [70]. The Rosaceae family is widely distributed across the warm temperate and subtropical regions of the Northern Hemisphere, with a major center of diversification in central China [71,72]. The pronounced seasonal contrasts in temperature and rainfall that characterize these regions, now and presumably during most of the Neogene–Quaternary, may have favored the evolution and maintenance of the glycitols’ biosyntheses in the Rosaceae family as adaptive metabolites to the Northern mid-latitude climate features.
By contrast, the primary radiation center of citrus lies in Southeast Asia [73], a region characterized now and presumably during most of the Neogene–Quaternary by warmer, wetter and more climatically stable conditions with lower seasonal variability in temperature and rainfall. Therefore, under such low-latitude climate conditions, glycitols do not seem able to confer selective advantages, potentially explaining their reduced prominence in citrus.
Therefore, because of the scarcity of glycitols in citrus phloem, B remains quite immobile in their foliage, resulting in preferential accumulation in leaves, with comparatively smaller proportions retained in roots and stems [52,59,74]. The findings in this work are consistent with this characteristic B distribution pattern in citrus, as evidenced by: (1) significantly higher B concentrations in leaves than in other organs, and (2) stem B levels that do not exhibit any dose–response relationship (Figure 3).
Rootstocks may modulate citrus tolerance to B toxicity through two main mechanisms: (i) variations in the cell wall and plasma membrane permeability to B; and (ii) differences in the secretion of root exudates featuring hydroxyl groups in adjacent carbon atoms and, therefore, as capable as the aforementioned glycitols to bind B, thereby keeping the element within large molecules, likely charged similarly to those with spiro-bis(dioxoborolane) ring systems (Figure 5), to which plasma membranes are quite impermeable [62]. Differences in active B transport capacity by root cells may also influence B uptake. However, the variations in active B transport capacity are expected to play a role only if B is deficient, but not if it is excessive.
In this work, two rootstocks with contrasting a priori tolerance to B were compared: CC (B-sensitive) and FA5 (B-tolerant). These genotypes have previously been shown to differ in their capacity to accumulate B with lower concentrations in FA5 compared to CC under transpiration conditions similar to those in the present study [38]. Remarkably, however, both rootstocks displayed comparable B accumulation in the present study. Despite this similarity in B accumulation in plant material, the FA5 rootstock showed higher biomass production than CC under the B stress imposed by irrigating with 2–5 mg B L−1, underscoring its superior vegetative development under elevated B conditions. The decline in biomass of CC in response to increasing B in irrigation water is consistent with previous findings [23,38], which reported reduced biomass production at higher water B concentrations for this rootstock. Additionally, the higher biomass accumulation exhibited by FA5 aligns with previous observations by Simon-Grao et al. [23], who also documented better vegetative growth of FA5 at high B concentrations. Accordingly, the higher tolerance of FA5 with regard to CC can be attributed to higher tissue tolerance, not adsorption.
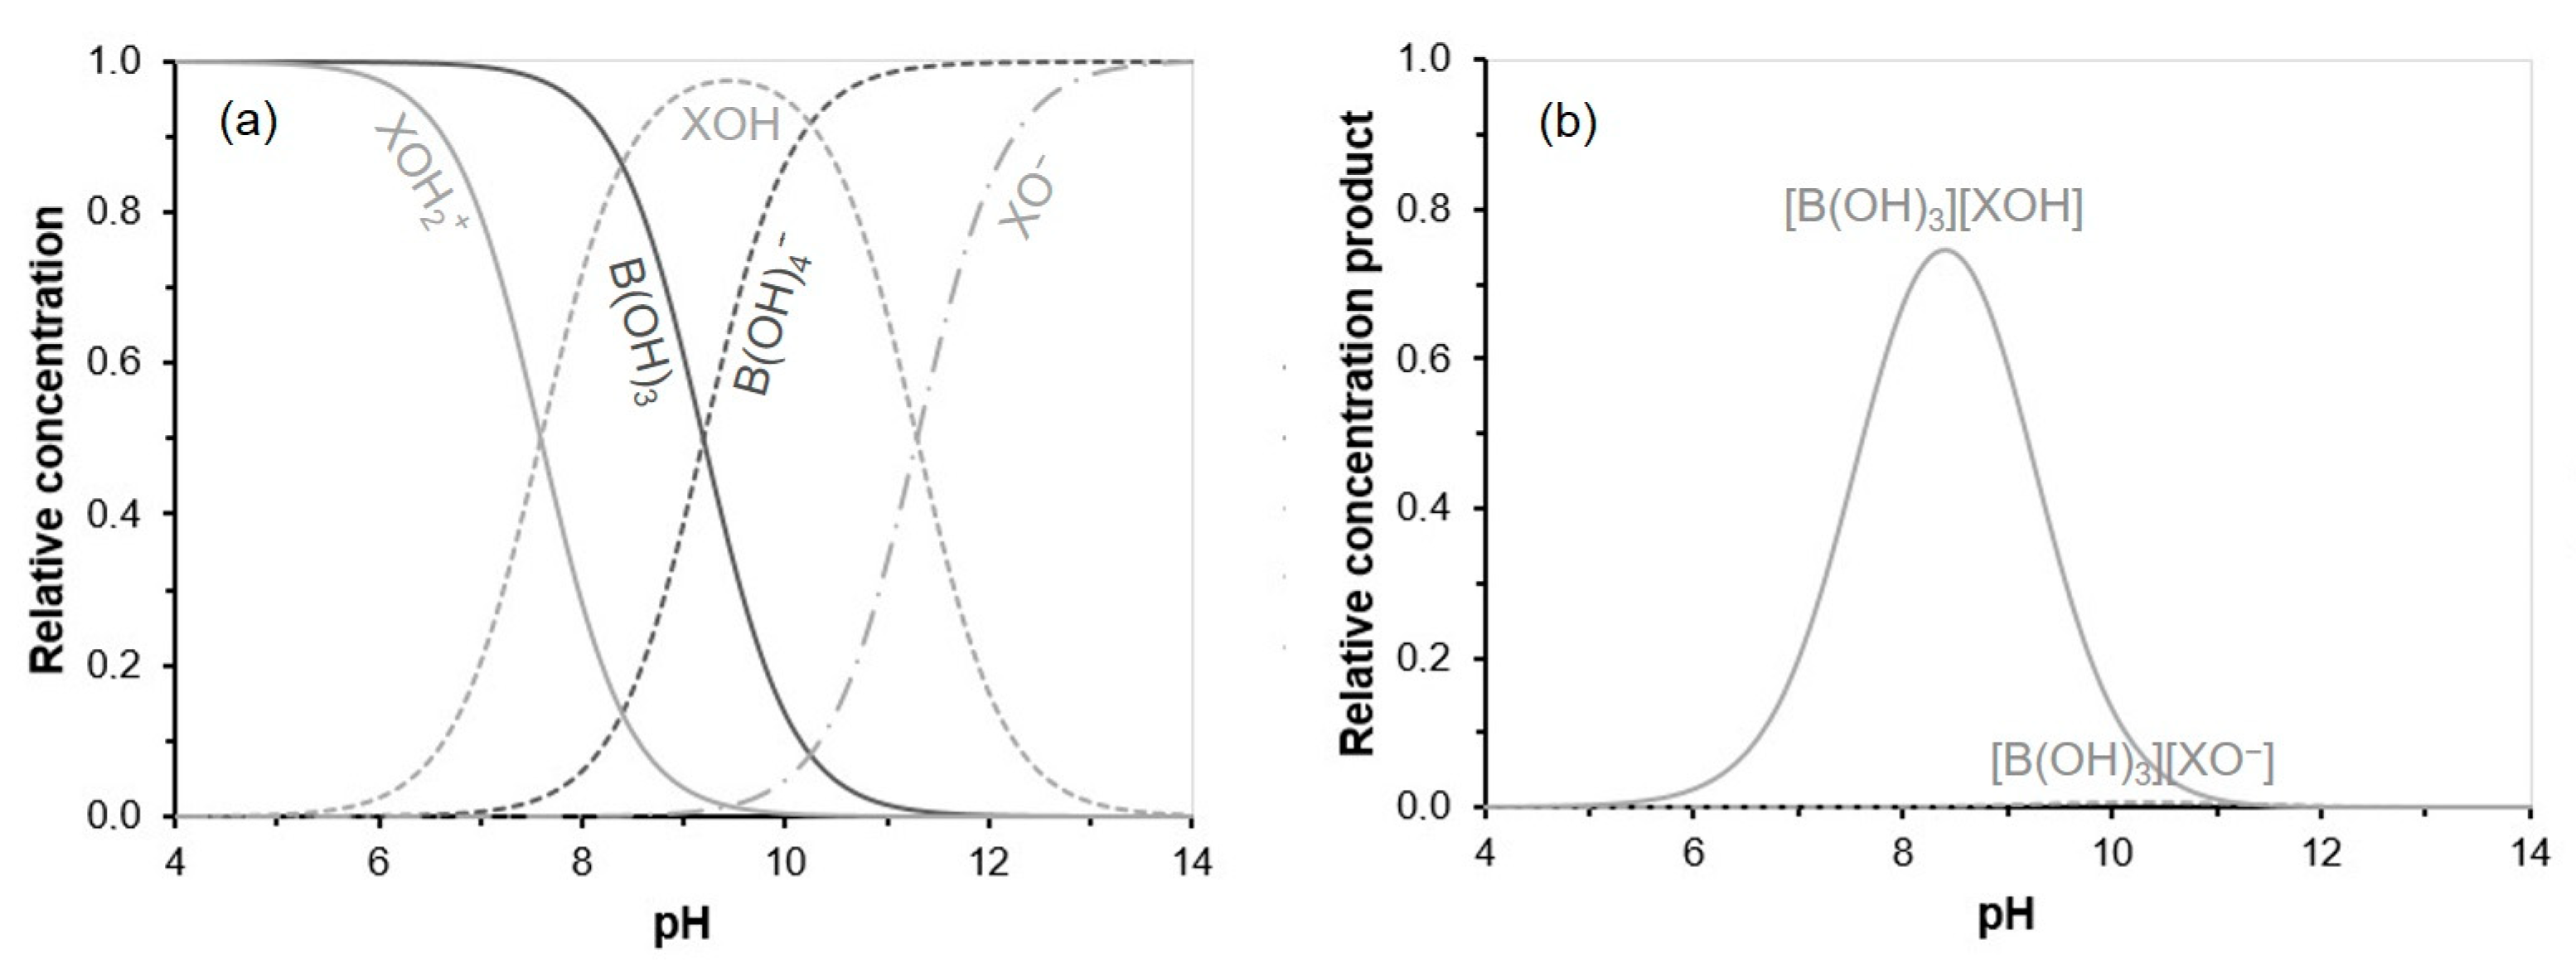
Evaluating the relation between soluble and adsorbed B found in the soil, the particularly high adsorbed/soluble ratios we observed may reflect the enhanced B binding capacity of carbonate-rich soils, as shown by Goldberg et al. [15]. This behavior arises because B adsorption involves reactions between surface functional groups such as X–OH and X–O where X = Si, Al, Fe, etc., which act as Lewis bases, and the soluble species B(OH)3, which behaves as a Lewis acid. The concentrations of these reactive species are strongly pH-dependent, as predicted by neglecting activity effects (Figure 6). As a result, the pH that maximizes the combined concentration products of B(OH)3 with X–OH and X–O is expected to correspond to maximum B adsorption (Figure 6). This optimal pH for B adsorption is close to that characteristic of calcareous soils.
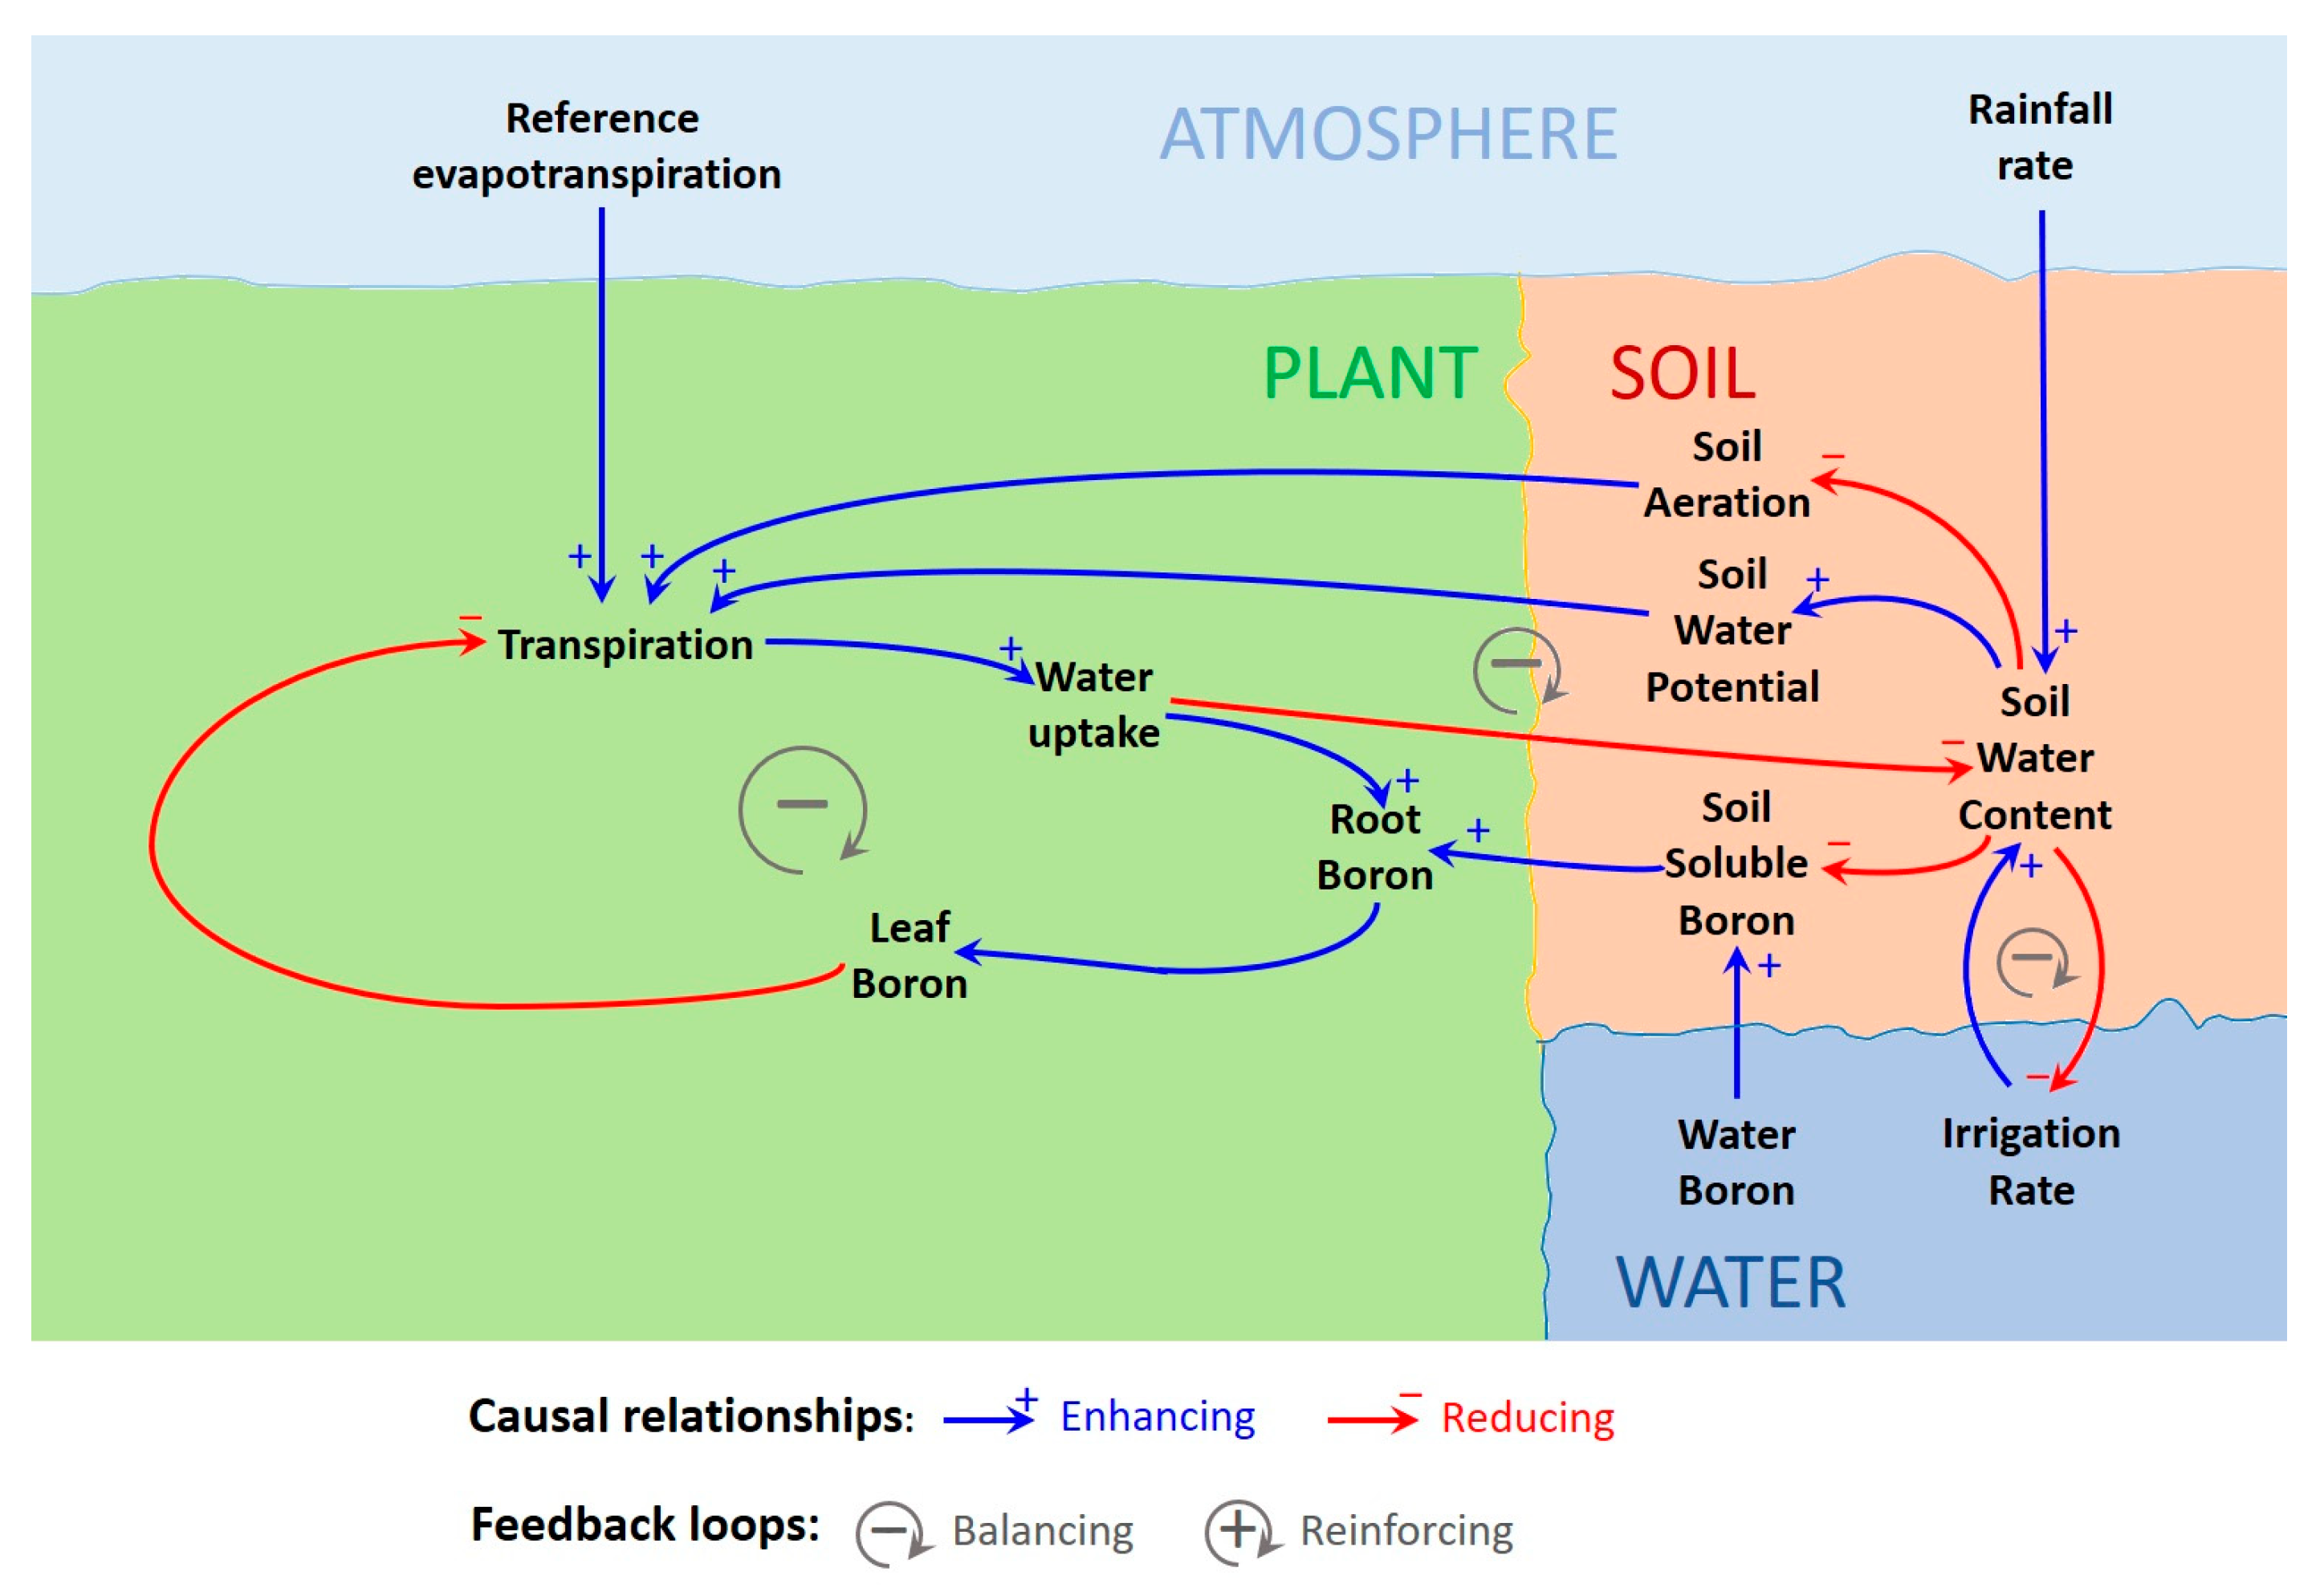
The nonlinear plant B uptake response observed in this study, characterized by a gradual diminishing increase, which flattens to a plateau at high soluble B concentrations in soil (>3 mg L−1), suggests the operation of regulatory mechanisms that limit excessive B uptake and accumulation. One plausible contributing mechanism would be as simple as the abscission of leaves with the highest B loads. Indeed, the treatments receiving the highest B rates exhibited markedly greater levels of defoliation, supporting this interpretation. However, defoliation is the last effect of B phytotoxicity in a sequence that starts with other effects that diminish plant transpiration, such as stomatal closing [75], as represented in Figure 7. In this hypothesized causal-loop diagram, leaf B accumulation reduces transpiration by inducing stomatal closure; water uptake correspondingly decreases, leading to reduced B uptake which, in turn, limits further leaf B accumulation (Figure 7). This mechanism constitutes a negative feedback loop within the soil–plant system, manifesting as the dampened response the diminishing-returns law so well captures.
The practical implications of the findings in this work are especially pertinent to Mediterranean citrus production, where the increasing reliance on desalinated seawater [33] and treated wastewater [75] has heightened concerns regarding B toxicity. The results of this study confirm that FA5 may be a suitable rootstock under such conditions, whereas CC continues to be appropriate for low-boron environments, consistent with previous recommendations [23,76]. Furthermore, the demonstrated rootstock-dependent differences in B response patterns, together with the soil-specific patterns of B availability, underscore the need for management strategies that integrate both plant genetic traits and local edaphic conditions.

5. Conclusions

The leaf was identified as the main organ for B accumulation in citrus, in contrast to the stem, which acts primarily as a conductive pathway, and the roots, which serve as the main site for B absorption. Both CC and FA5 displayed similar patterns of B uptake, transport and distribution to the scion. In particular, no evidence of B exclusion was detected because absorption likely occurs through passive transport in both rootstocks, and phloem redistribution may be very limited because of lack of sugar alcohols and low B-transport capacity of sucrose as mechanistically interpreted. Nevertheless, FA5 exhibited greater B tolerance than CC, as evidenced by its higher biomass at elevated B levels (2–5 mg L−1), which may support its suitability over CC for citrus propagation in regions with B-rich irrigation waters.
Robust relationships suggesting the law of diminishing returns were observed between the logarithm of B concentration in leaves and roots and the square root of soil soluble B. These relationships can be interpreted as reflecting a balancing feedback loop within the soil–plant system involving B, whereby B-induced stomatal closure likely reduces transpiration and, in turn, limits further B uptake. Accordingly, Mitscherlich-type functions were successfully fitted to predict leaf and root B buildup from soil soluble B.
The model presented here that connects citrus B uptake to soil B availability represents a novel contribution to B toxicity management in citrus production. It offers a final analytical link connecting irrigation water B concentration to plant B concentrations in which the other link would connect irrigation water B with soil soluble B concentration by simulating soil water flow and solute transport and soil B partitioning among soluble and adsorbed fractions.
This approach can be particularly valuable for the sustainable management of orchards irrigated with non-conventional and quality-degraded irrigation waters. However, before this seedling-based model can be implemented, it must be validated under open-field conditions with young and adult trees, and across a range of contrasting soil types, irrigation regimes and rootstocks. Under these conditions, leaching will play a greater role, and carry-over effects will emerge, enabling refinement of the model prior to its incorporation into decision-support tools for sustaining citrus production under non-conventional and deteriorating water quality conditions. Therefore, future research should assess the long-term impacts of sustained irrigation with B-rich waters under real open-field conditions, also studying the effects on citrus fruit quality and overall productivity.
Finally, the theoretical framework and mechanistic interpretations presented in this work advance understanding of B dynamics in citrus systems while highlighting key knowledge gaps. In this regard, future research should prioritize experimental testing of the mechanisms presented here to elucidate how plant B tolerance develops, with particular emphasis on FA5’s superior performance as a citrus rootstock.

Author Contributions

Conceptualization, J.G.P.-P., J.M.d.P. and F.V.; methodology, J.G.P.-P. and F.V.; formal analysis, J.M.d.P. and F.V.; investigation, E.P., M.T. and J.M.d.P.; Validation J.M.d.P., resources, J.G.P.-P.; data curation J.M.d.P., E.P. and F.V.; writing—original draft preparation, J.M.d.P.; writing—review and editing, F.V.; visualization, F.V. and J.M.d.P.; supervision, J.G.P.-P.; project administration, J.G.P.-P. All authors have read and agreed to the published version of the manuscript.

Funding

This research was funded through the project DESALICitrus (PID2019-104893RR-I00) by MCIN/AEI/10.13039/501100011033 and, as appropriate, by the ERDF project “A way of making Europe”, the European Union, under the “European Union Next Generation EU/PRTR” project, the Sostesabio project (IVIA-GVA 52203A), and the pre-doctoral contract of M.T. from the Generalitat Valenciana (ACIF-2021/413).

Data Availability Statement

The dataset used in this study is available upon request from the corresponding author.

Conflicts of Interest

The authors declare no conflicts of interest.

Abbreviations

The following abbreviations are used in this manuscript:
FA5Forner-Alcaide 5 rootstock
CCCitrange Carrizo rootstock
SOMSoil organic matter

Appendix A

Appendix A.1. Estimation of the Oxygen-Oxygen Interatomic Distance in Diols

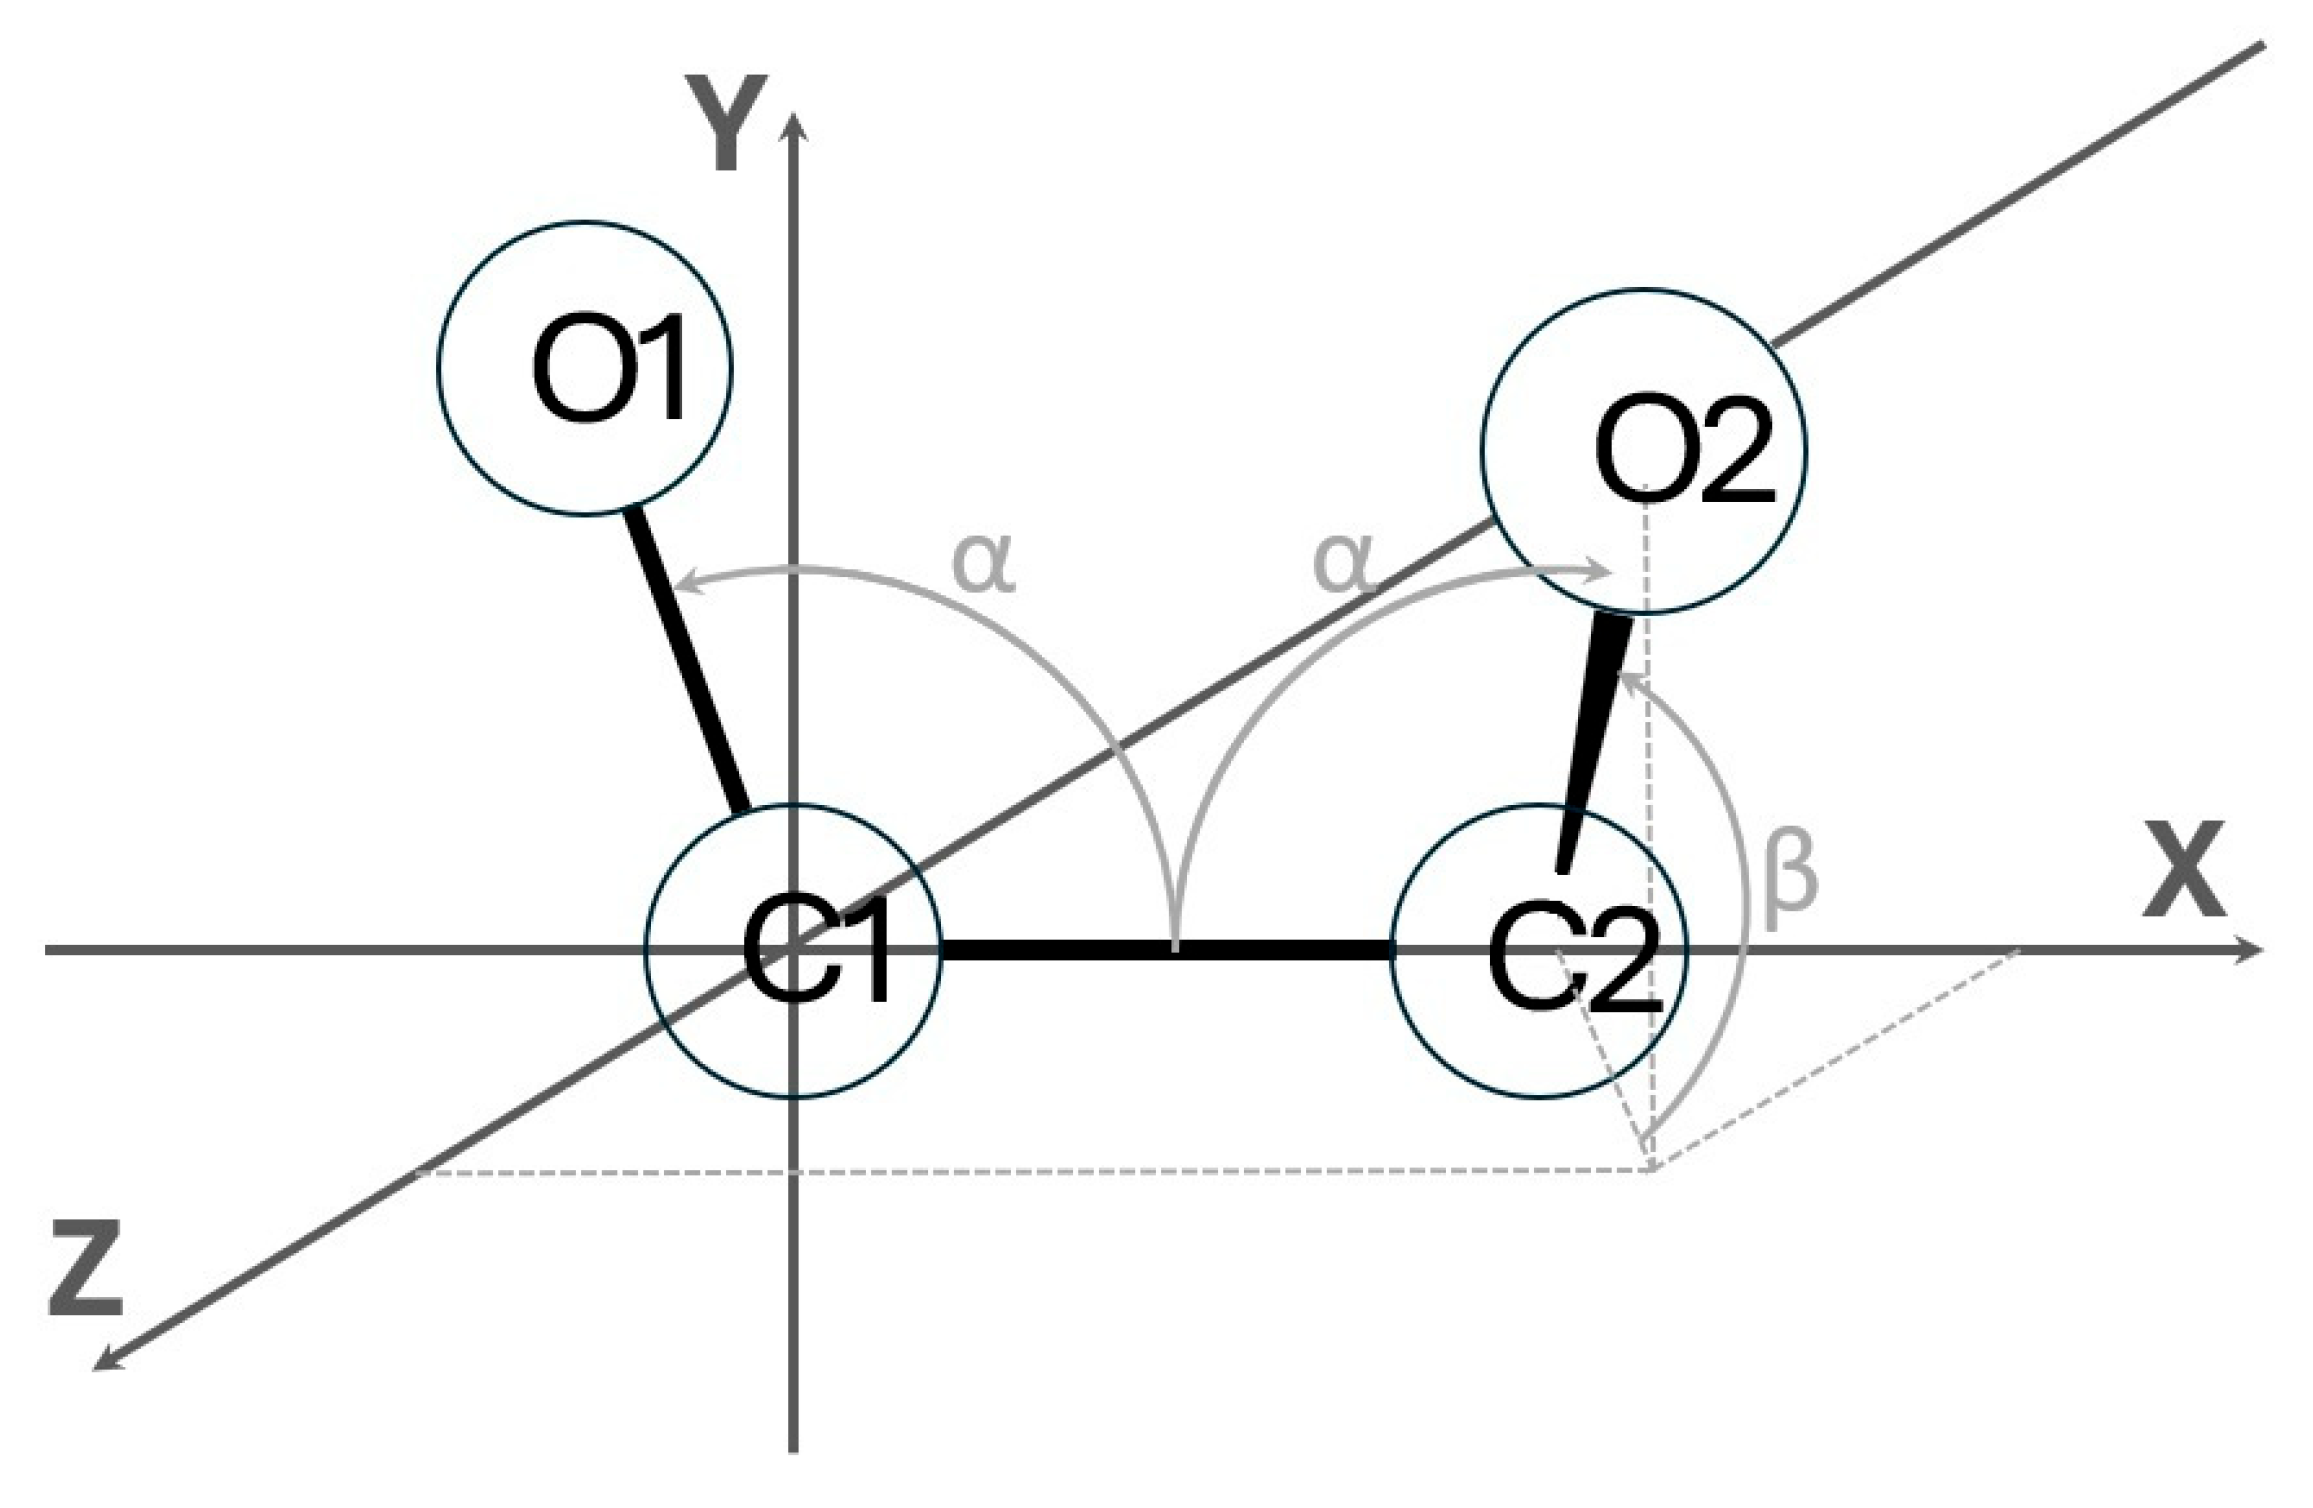
In a rectangular three-dimensional space, diols can be described by placing the first carbon atom (C1) at the origin and the second carbon atom (C2) along the X-axis at a distance equal to a C–C bond length (Figure A1). The first oxygen atom (O1) is then positioned in the XY-plane, such that the C1–O1 bond forms an angle α with the C1–C2 bond (Figure A1). Finally, the second oxygen atom (O2) can be placed in the first octant, with the C2–O2 bond forming an angle α with the C1–C2 bond and an angle β with the XZ-plane (Figure A1).
Figure A1. Three-dimensional representation of the O–C–C–O atomic framework of a diol, with the defining bond α and β angles indicated by grey solid arrows and the projections of the O2 atom on the XZ plane and over the X and Z axes indicated by gray dotted lines. Regarding this, note that the O1–C1–C2 atoms lie in the XY-plane, whereas the O2 atom is projected forward into the first octant.
Agronomy 16 00418 g0a1
According to the description, the following coordinates can be given for the atoms of the diol framework, where for brevity a and b denote the C–O and C–C bond lengths, respectively (a = dC–O, b = dC–C):
O1: [a cos α, a sin α, 0]
C1: [0, 0, 0]
C2: [b, 0, 0]
O2: [ba cos α, a sin α sin β, a sin α cos β]
The distance between O1 and O2 is defined as
dO1–O2 = ((xO2xO1)2 + (yO2yO1)2 + (zO2 − zO1)2)1/2
and substituting the coordinates from Equations (A1) and (A4) into Equation (A5) yields, after rearranging, the following explicit expression for the O1–O2 distance as a function of the bond lengths and angles in diols:
dO1–O2 = [(b − 2a cos α)2 + 2 (a sin α)2 (1 − sin β)]1/2
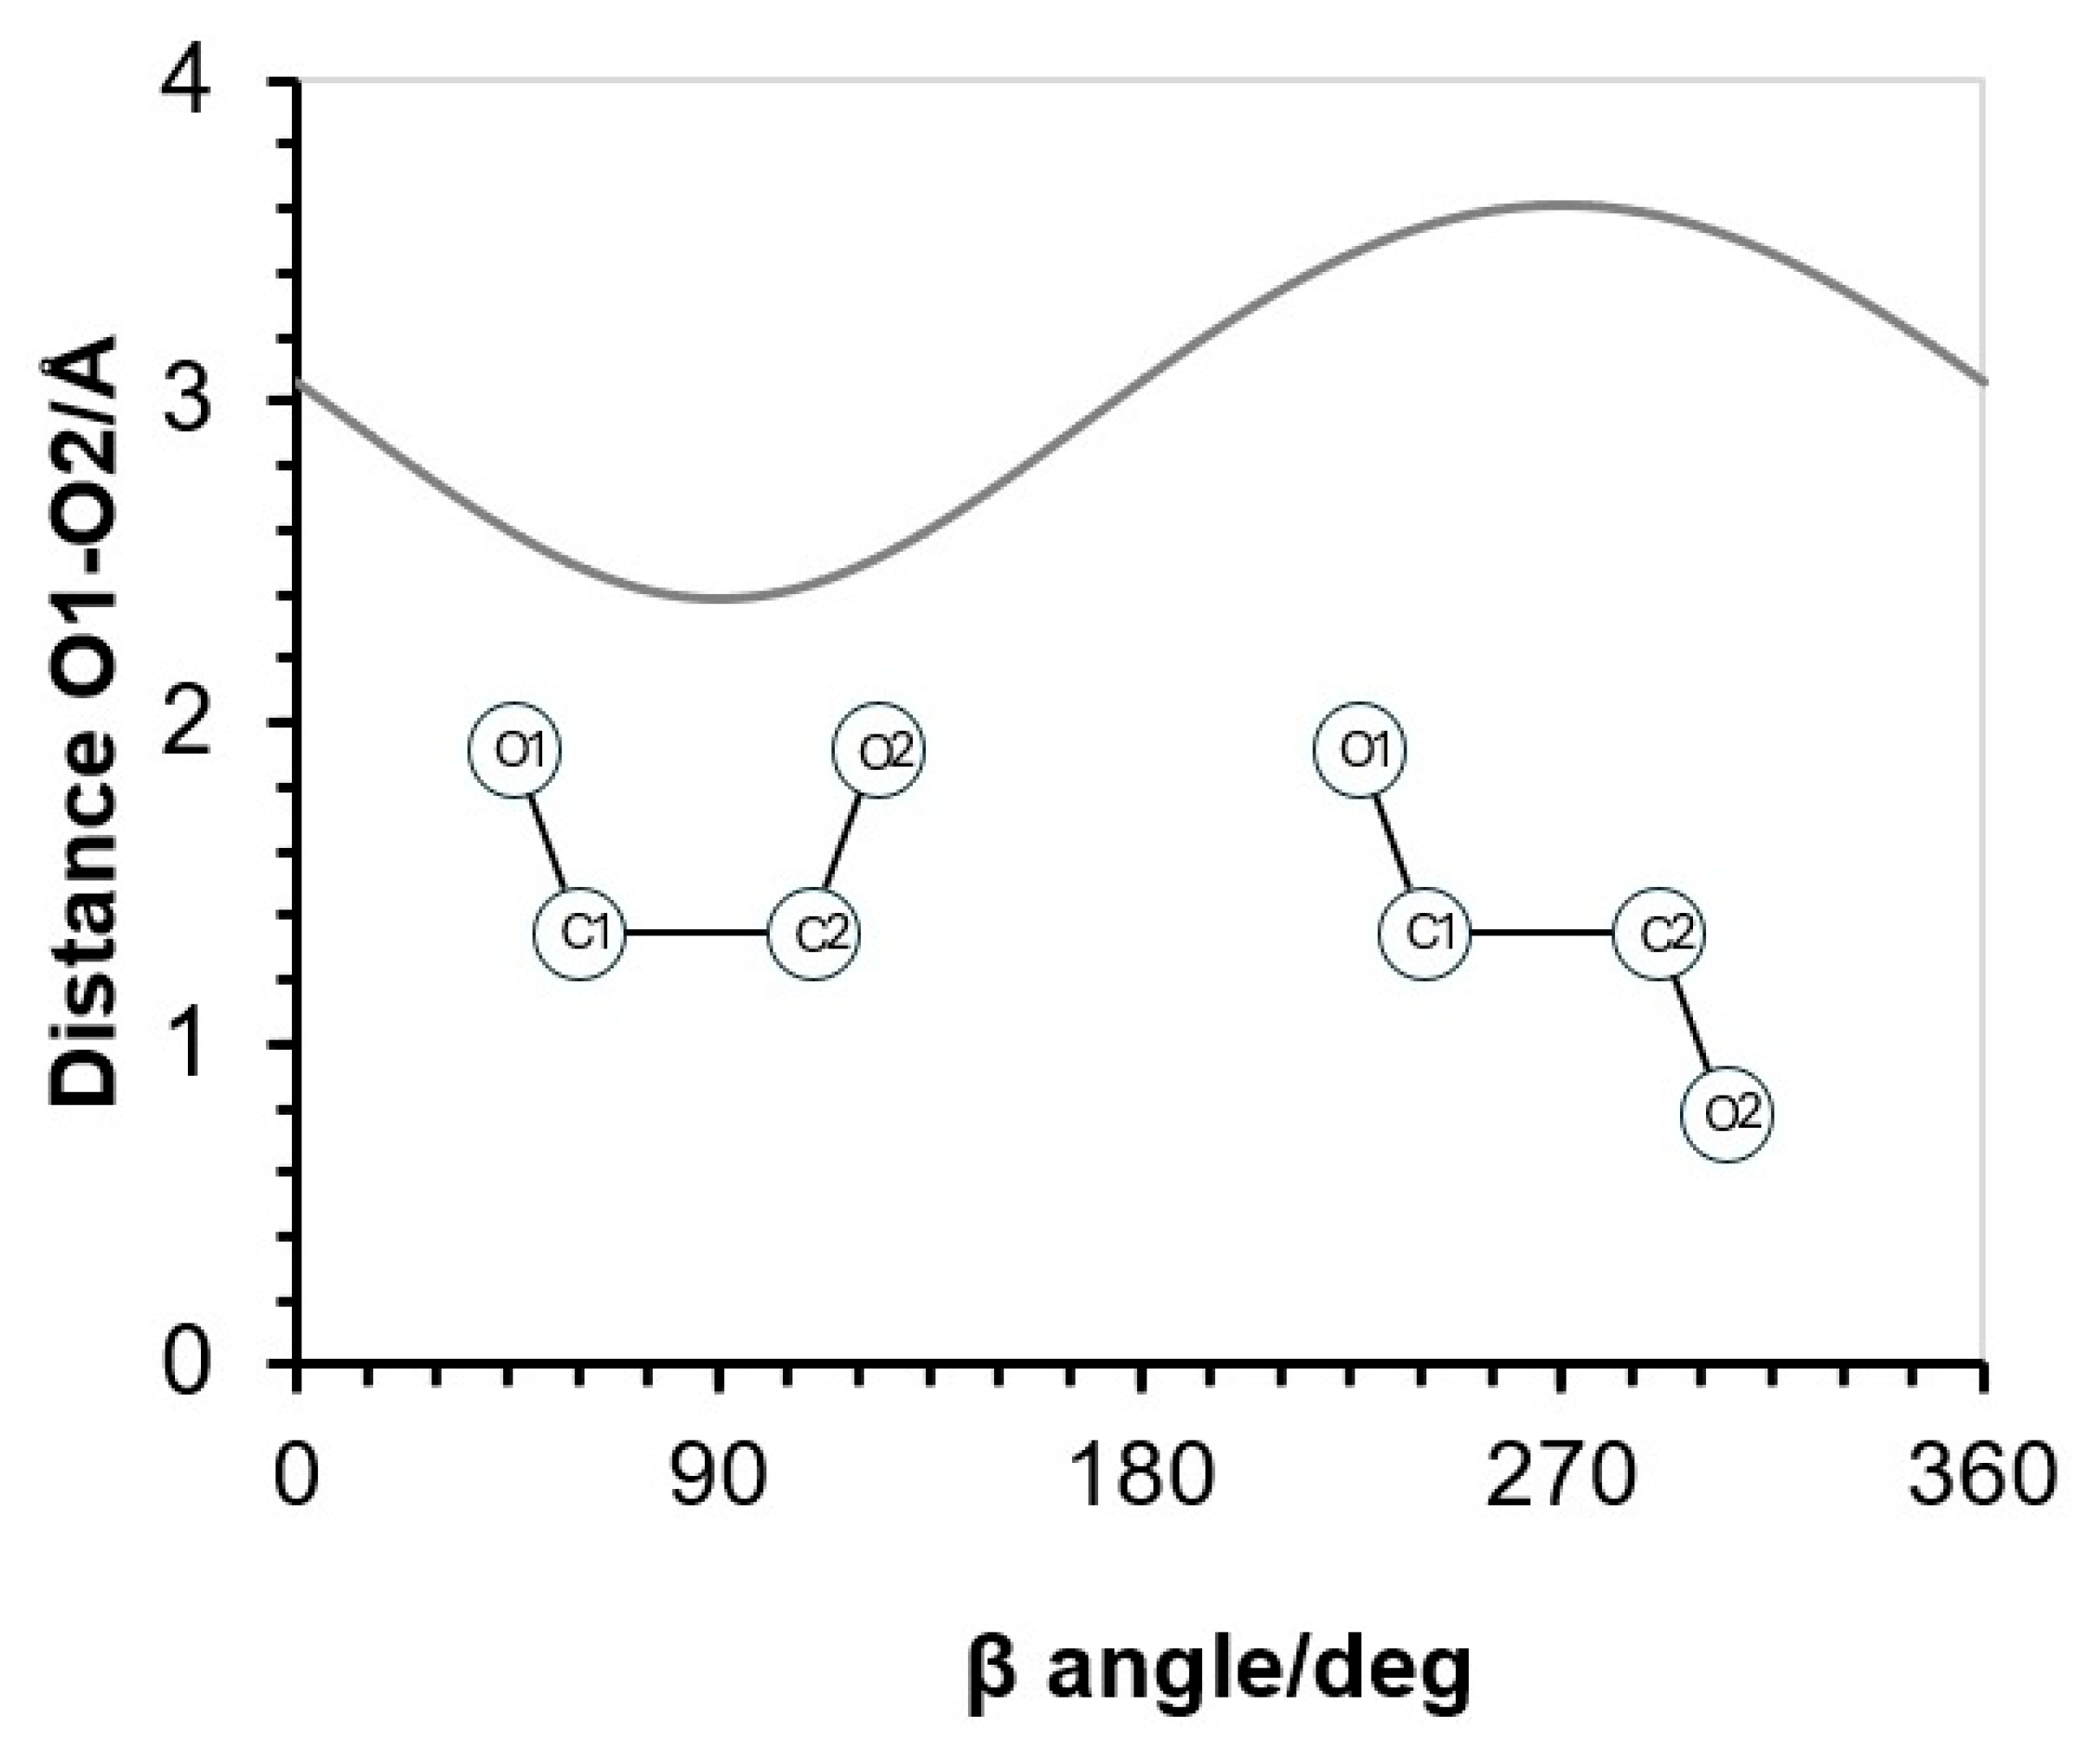
If the C–C–O bond angle (α) is fixed at 107.8°, as in ethanol [60], and lengths of 1.52 Å and 1.42 Å are assumed for the C–C (b) and C–O (a) bonds, respectively [61], the variation in the O1–O2 distance (dO1–O2) as a function of β can be evaluated (Figure A2). The resulting curve exhibits a minimum of 2.39 Å at β = 90° and a maximum of 3.61 Å at β = 270°, each corresponding to one of the configurations in which the four atoms of the diol are coplanar, as shown in Figure A2.
Figure A2. Change in the O1–O2 distance in diols as a function of the β angle, as described by Equation (A6).
Agronomy 16 00418 g0a2

Appendix A.2. Estimation of the Oxygen-Boron-Oxygen Angle in Dioxoborolane Rings

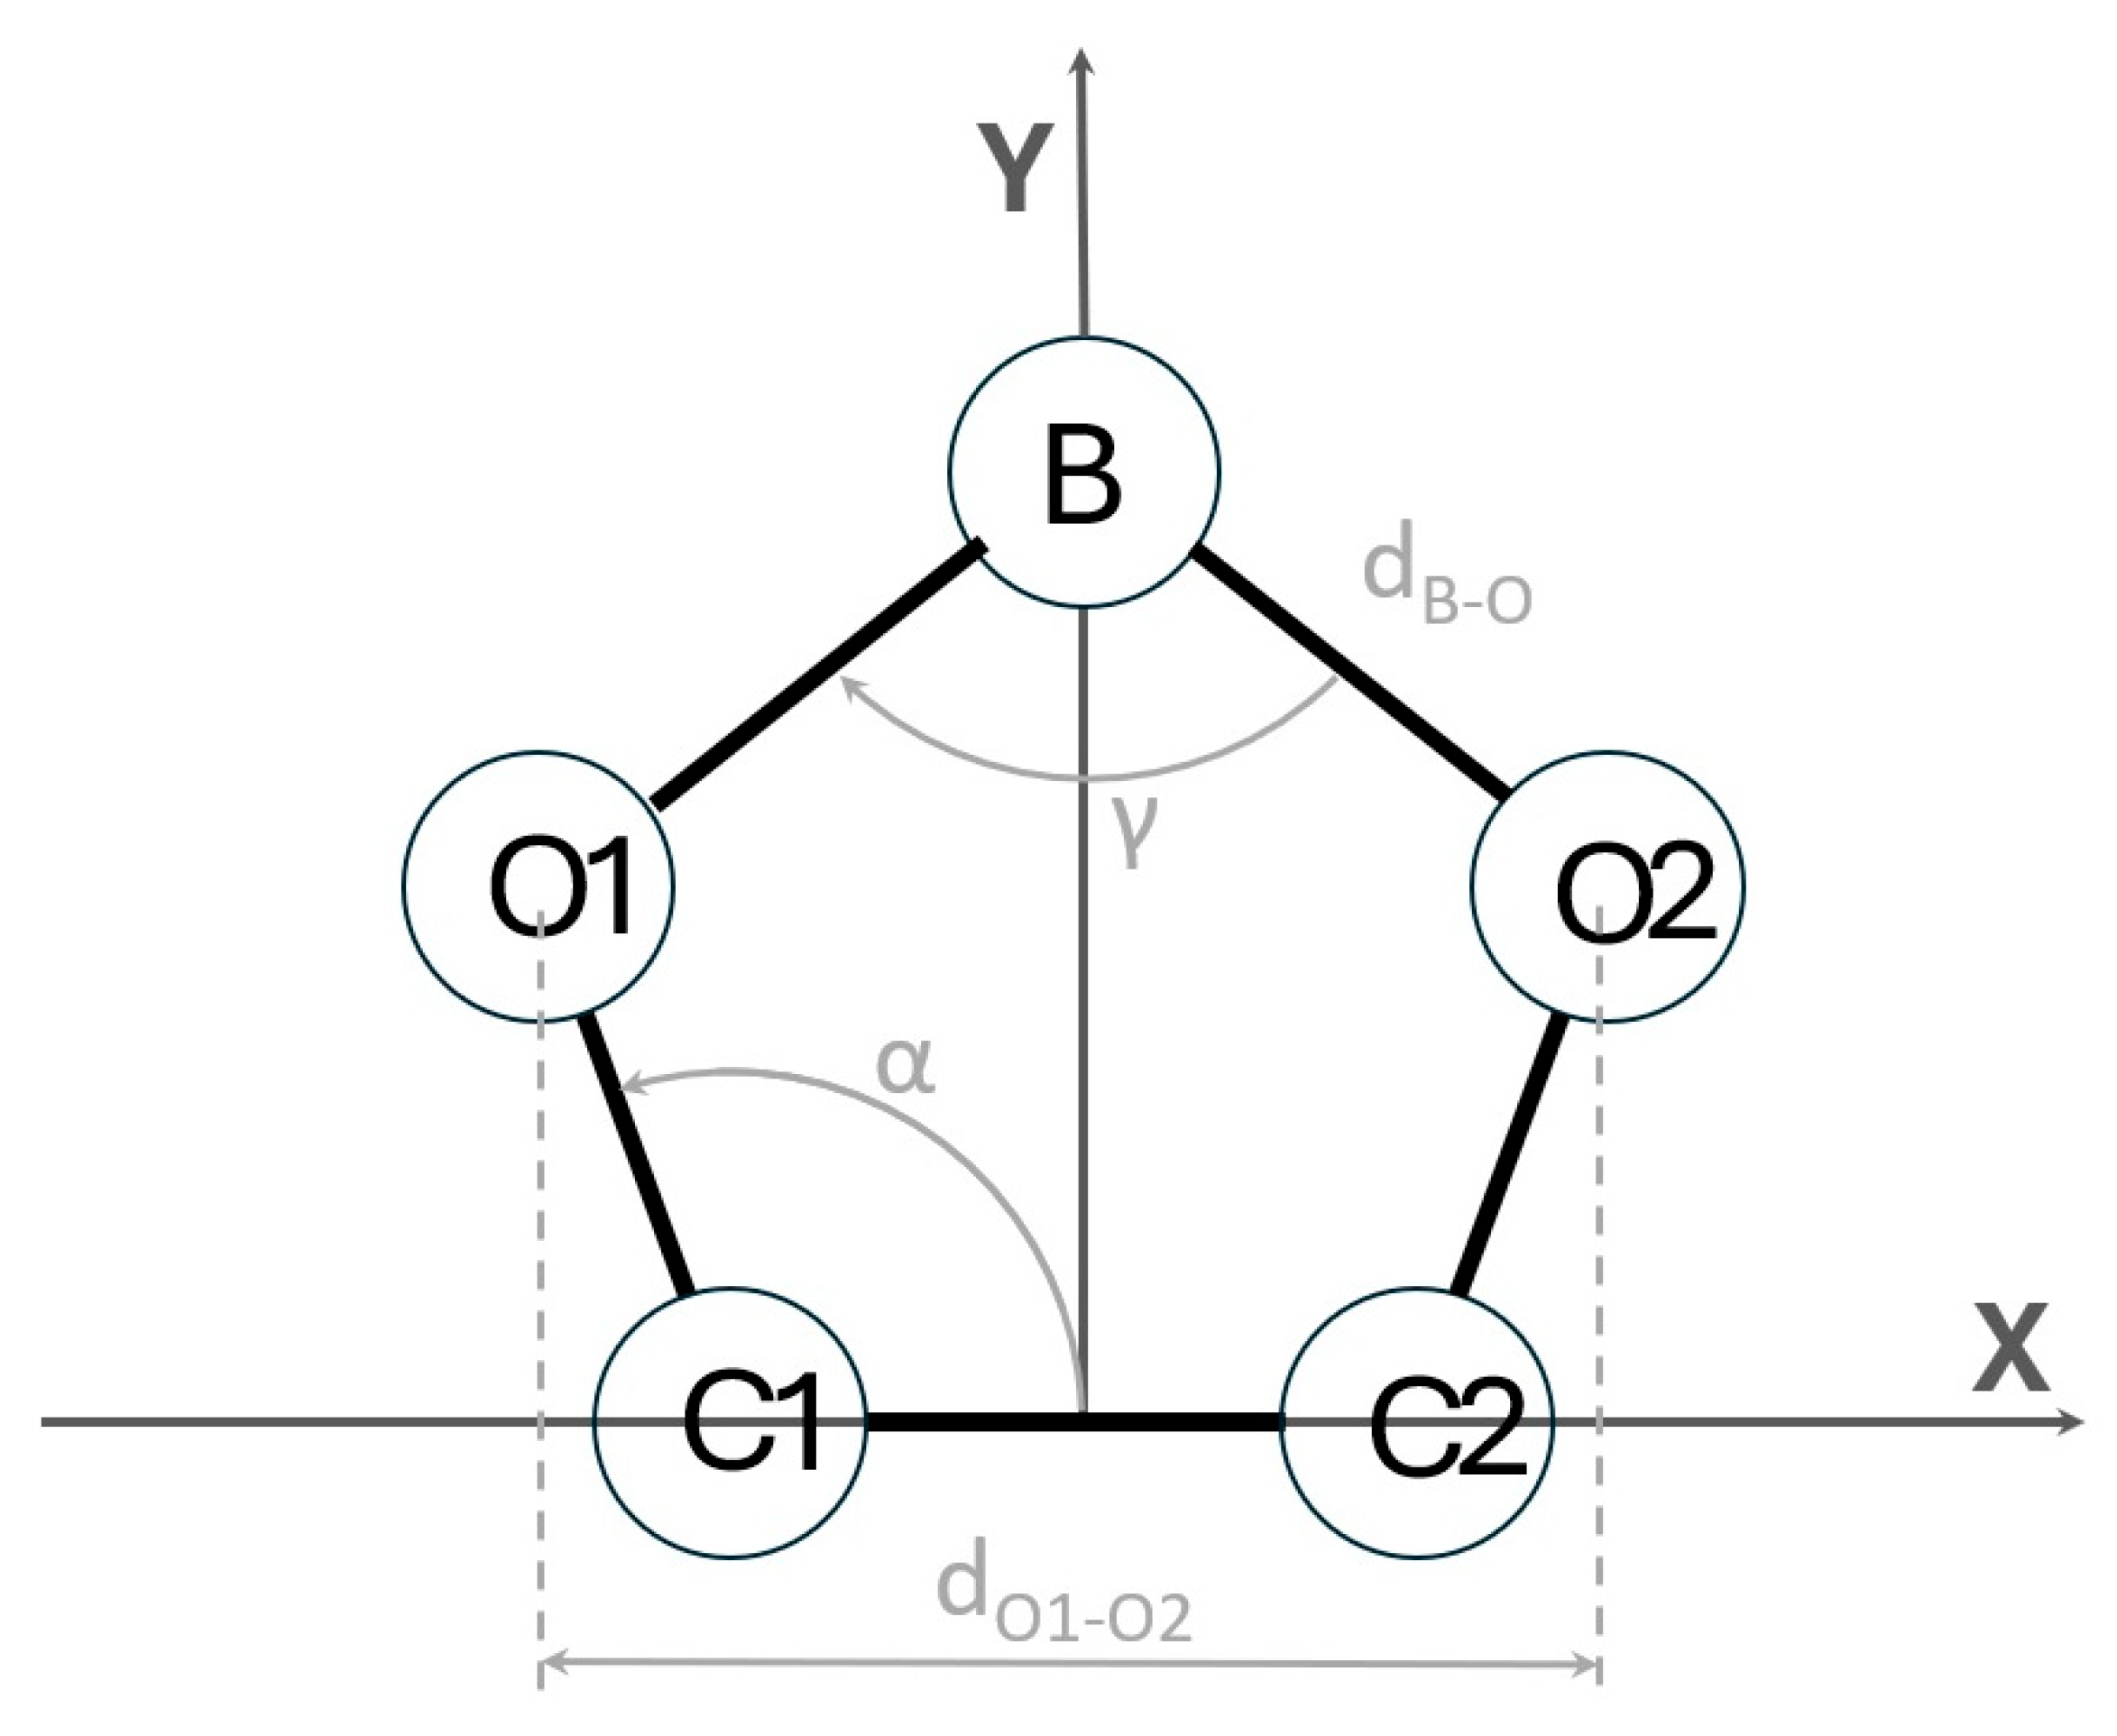
Upon formation of a dioxoborolane ring, the five atoms O–C–C–O–B– can be assumed to be coplanar in the configuration that minimizes the oxygen–oxygen interatomic distance, which features a β angle of 90° (Figure A3). Inspection of Figure A3 allows the derivation of the following geometric relationship, from which the O–B–O bond angle (γ) can be estimated as a function of the O1–O2 distance and the B–O bond length (dB–O):
sin γ 2 = d O 1 O 2 2 d B O
Figure A3. Schematic representation of a dioxoborolane ring, illustrating a hypothesized coplanar arrangement of the five constituent atoms.
Agronomy 16 00418 g0a3
Replacing dO1–O2 by the value previously calculated (2.39 Å) and dB–O by 1.36 Å [62], and angle of γ = 122.8° is obtained for the ester O–B–O bond in the dioxoborolane ring.

References

  1. García-Sánchez, F.; Simón-Grao, S.; Martínez-Nicolás, J.J.; Alfosea-Simón, M.; Liu, C.; Chatzissavvidis, C.; Pérez-Pérez, J.G.; Cámara-Zapata, J.M. Multiple stresses occurring with boron toxicity and deficiency in plants. J. Hazard. Mater. 2020, 397, 122713. [Google Scholar] [CrossRef] [Scilit]
  2. Brdar-Jokanović, M. Boron toxicity and deficiency in agricultural plants. Int. J. Mol. Sci. 2020, 21, 1424. [Google Scholar] [CrossRef] [Scilit]
  3. Li, S.; Yan, L.; Venuste, M.; Xu, F.; Shi, L.; White, P.J.; Wang, X.; Ding, G. A critical review of plant adaptation to environmental boron stress: Uptake, utilization, and interplay with other abiotic and biotic factors. Chemosphere 2023, 338, 139474. [Google Scholar] [CrossRef] [Scilit]
  4. Breure, M.S.; Van Eynde, E.; Njoroge, S.; Chikowo, R.; Comans, R.N.J.; Hoffland, E. Boron availability and fertilizer response of maize in soils from sub-Saharan Africa. J. Plant Nutr. Soil. Sci. 2024, 1–13. [Google Scholar] [CrossRef] [Scilit]
  5. Chen, W.P.; Chang, A.C.; Page, A.L. Deficiencies and Toxicities of Trace Elements. In Agricultural Salinity Assessment and Management, 2nd ed.; Wesley, W., Kenneth, W., Tanji, K., Eds.; ASCE Manuals and Reports on Engineering Practice: Reston, VA, USA, 2012; pp. 207–233. [Google Scholar]
  6. Ayers, R.S.; Westcot, D.W. Water quality for agriculture. In FAO Irrigation and Drainage Paper 29 Rev. 1; Food and Agriculture Organization of the United Nations: Rome, Italy, 1985. [Google Scholar]
  7. Maas, E.V.; Grattan, S.R. Crop Yields as Affected by Salinity. In Agricultural Drainage; Skaggs, R.W., van Schilfgaarde, J., Eds.; Agronomy Monograph Madison; American Society of Agronomy; Crop Science Society of America; Soil Science Society of America: Madison, WI, USA, 1999; Volume 38, pp. 55–108. [Google Scholar]
  8. Yermiyahu, U.; Keren, R.; Chen, Y. Effect of composted organic matter on boron uptake by plants. Soil. Sci. Soc. Am. J. 2001, 65, 1436–1441. [Google Scholar] [CrossRef] [Scilit]
  9. Rékási, M.; Ragályi, P.; Füzy, A.; Uzinger, N.; Dobosy, P.; Záray, G.; Szűcs-Vásárhelyi, N.; Makó, A.; Takács, T. Effect of the boron concentration in irrigation water on the elemental composition of edible parts of tomato, green bean, potato, and cabbage grown on soils with different textures. Front. Plant Sci. 2021, 12, 658892. [Google Scholar] [CrossRef] [Scilit]
  10. Keren, R.; Bingham, F.T.; Rhoades, J.D. Plant uptake of boron as affected by boron distribution between liquid and solid phases in soil. Soil. Sci. Soc. Am. J. 1985, 49, 297–302. [Google Scholar] [CrossRef] [Scilit]
  11. Camacho-Cristóbal, J.J.; Rexach, J.; González-Fontes, A. Boron in Plants: Deficiency and Toxicity. J. Integr. Plant Biol. 2008, 50, 1247–1255. [Google Scholar] [CrossRef] [Scilit]
  12. Reid, R. Understanding the boron transport network in plants. Plant Soil. 2014, 385, 1–13. [Google Scholar] [CrossRef] [Scilit]
  13. Zhao, S.; Huq, M.E.; Fahad, S.; Kamran, M.; Riaz, M. Boron toxicity in plants: Understanding mechanisms and developing coping strategies; a review. Plant Cell Rep. 2024, 43, 238. [Google Scholar] [CrossRef] [Scilit] [PubMed]
  14. Goldberg, S. Reactions of boron with soils. Plant Soil. 1997, 193, 35–48. [Google Scholar] [CrossRef] [Scilit]
  15. Goldberg, S.; Lesch, S.M.; Suarez, D.L. Predicting boron adsorption by soils using soil chemical parameters in the constant capacitance model. Soil. Sci. Soc. Am. J. 2000, 64, 1356–1363. [Google Scholar] [CrossRef] [Scilit]
  16. Suarez, D.L.; Wood, J.D.; Taber, P.E. Adsorption and desorption of boron in column studies as related to pH: Results and model predictions. Vadose Zone J. 2012, 11, vzj2011.0073. [Google Scholar] [CrossRef] [Scilit]
  17. Bolaños, L.; Lukaszewski, K.; Bonilla, I.; Blevins, D. Why boron? Plant Physiol. Biochem. 2004, 42, 907–912. [Google Scholar] [CrossRef] [Scilit]
  18. Landi, M.; Margaritopoulou, T.; Papadakis, I.E.; Araniti, F. Boron toxicity in higher plants: An update. Planta 2019, 250, 1011–1032. [Google Scholar] [CrossRef] [Scilit]
  19. Matoh, T.; Kawaguchi, S.; Kobayashi, M. Ubiquity of a borate-rhamnogalacturonan II complex in the cell walls of higher plants. Plant Cell Physiol. 1996, 37, 636–640. [Google Scholar] [CrossRef] [Scilit]
  20. Voxeur, A.; Fry, S.C. Glycosylinositol phosphorylceramides from Rosa cell cultures are boron-bridged in the plasma membrane and form complexes with rhamnogalacturonan II. Plant J. 2014, 79, 139–149. [Google Scholar] [CrossRef] [Scilit]
  21. Chormova, D.; Messenger, D.J.; Fry, S.C. Rhamnogalacturonan-II cross-linking of plant pectins via boron bridges occurs during polysaccharide synthesis and/or secretion. Plant Signal. Behav. 2014, 9, e28169. [Google Scholar] [CrossRef] [Scilit]
  22. Reid, R.J.; Hayes, J.E.; Post, A.; Stangoulis, J.C.R.; Graham, R.D. A critical analysis of the causes of boron toxicity in plants. Plant Cells Environ. 2004, 27, 1405–1414. [Google Scholar] [CrossRef] [Scilit]
  23. Simón-Grao, S.; Nieves, M.; Cámara-Zapata, J.M.; Martínez-Nicolás, J.J.; Rivero, R.M.; Fernández-Zapata, J.C.; García-Sánchez, F. The Forner Alcaide nº 5 citrus genotype shows a different physiological response to the excess of boron in the irrigation water in relation to its two genotype progenitors. Sci. Hortic. 2019, 245, 19–28. [Google Scholar] [CrossRef] [Scilit]
  24. Navarro, J.M.; Antolinos, V.; Robles, J.M.; Botía, P. Citrus Irrigation With Desalinated Seawater Under a Climate Change Scenario. Front. Plant Sci. 2022, 13, 909083. [Google Scholar] [CrossRef] [Scilit] [PubMed]
  25. Yang, W.; Yang, H.; Ling, L.; Chun, C.; Peng, L. Tolerance and Physiological Responses of Citrus Rootstock Cultivars to Boron Toxicity. Horticulturae 2023, 9, 44. [Google Scholar] [CrossRef] [Scilit]
  26. Ben-Gal, A.; Shani, U. Yield, transpiration and growth of tomatoes under combined excess boron and salinity stress. Plant Soil. 2002, 247, 211–221. [Google Scholar] [CrossRef] [Scilit]
  27. Edelstein, M.; Ben-Hur, M.; Cohen, R.; Burger, Y.; Ravina, I. Boron and salinity effects on grafted and non-grafted melon plants. Plant Soil. 2005, 269, 273–284. [Google Scholar] [CrossRef] [Scilit]
  28. Bar-Tal, A.; Yermiyahu, U.; Keinan, M.; Faingold, I.; Ben-Gal, A. Boron deficiency and toxicity in young persimmon (Diospyros kaki L.). J. Hortic. Sci. Biotechnol. 2008, 83, 469–473. [Google Scholar] [CrossRef] [Scilit]
  29. Shah, A.; Wu, X.; Ullah, A.; Fahad, S.; Muhammad, R.; Yan, L.; Jiang, C. Deficiency and toxicity of boron: Alterations in growth, oxidative damage and uptake by citrange orange plants. Ecotoxicol. Environ. Saf. 2017, 145, 575–582. [Google Scholar] [CrossRef] [Scilit]
  30. Mattos, D.; Hippler, F.W.R.; Boaretto, R.M.; Stuchi, E.S.; Quaggio, J.A. Soil boron fertilization: The role of nutrient sources and rootstocks in citrus production. J. Integr. Agric. 2017, 16, 1609–1616. [Google Scholar] [CrossRef] [Scilit]
  31. Nable, R.O.; Bañuelos, G.S.; Paull, J.G. Boron toxicity. Plant Soil. 1997, 193, 181–198. [Google Scholar] [CrossRef] [Scilit]
  32. Suarez, D.L. Irrigation water quality assessments. In Agricultural Salinity Assessment and Management; Wallender, W.W., Tanji, K.K., Eds.; American Society of Civil Engineers: Reston, VA, USA, 2012; pp. 343–370. [Google Scholar]
  33. Martínez-Alvarez, V.; Martin-Gorri, B.; Soto-García, M. Seawater desalination for crop irrigation—A review of current experiences and revealed key issues. Desalination 2016, 381, 58–70. [Google Scholar] [CrossRef] [Scilit]
  34. European Commission. Water Reuse: New EU Rules to Improve Access to Safe Irrigation. 26 June 2023. Directorate-General for Environment. Available online: https://environment.ec.europa.eu/news/water-reuse-new-eu-rules-improve-access-safe-irrigation-2023-06-26_en (accessed on 12 January 2026).
  35. Mesquita, G.L.; Zambrosi, F.C.B.; Tanaka, F.A.O.; Boaretto, R.M.; Quaggio, J.A.; Ribeiro, R.V.; Mattos, D., Jr. Anatomical and physiological responses of Citrus trees to varying boron availability are dependent on rootstock. Front. Plant Sci. 2016, 7, 224. [Google Scholar] [CrossRef] [Scilit]
  36. Simón-Grao, S.; Nieves, M.; Martínez-Nicolás, J.J.; Cámara-Zapata, J.M.; Alfose-Simón, M.; García-Sánchez, F. Response of three citrus genotypes used as rootstocks grown under boron excess conditions. Ecotoxicol. Environ. Saf. 2018, 159, 10–19. [Google Scholar] [CrossRef] [Scilit]
  37. Wu, X.; Lu, X.; Riaz, M.; Yan, L.; Jiang, C. Boron deficiency and toxicity altered the subcellular structure and cell wall composition architecture in two citrus rootstocks. Sci. Hortic. 2018, 238, 147–154. [Google Scholar] [CrossRef] [Scilit]
  38. Aparicio-Durán, L.; Gmitter, F.G., Jr.; Arjona-López, J.M.; Grosser, J.W.; Calero-Velázquez, R.; Hervalejo, Á.; Arenas-Arenas, F.J. Evaluation of Three New Citrus Rootstocks under Boron Toxicity Conditions. Agronomy 2021, 11, 2490. [Google Scholar] [CrossRef] [Scilit]
  39. Navarro-Gochicoa, M.T.; Aparicio-Durán, L.; Delfín, A.; Ceacero, C.J.; Herrera-Rodríguez, M.B.; Arenas-Arenas, F.J.; Camacho-Cristóbal, J.J.; González-Fontes, A.; Rexach, J. Characterization of citrus rootstock under conditions of boron toxicity. Agronomy 2024, 14, 2741. [Google Scholar] [CrossRef] [Scilit]
  40. Bowman, K.D.; Joubert, J. Citrus Rootstocks. In The Genus Citrus; Talon, M., Caruso, M., Gmitter, F.G., Eds.; Elsevier: Cambridge, MA, USA, 2020; pp. 105–128. [Google Scholar] [CrossRef] [Scilit]
  41. Forner, J.B.; Forner-Giner, M.A.; Alcaide, A. Forner-Alcaide 5 and Forner-Alcaide 13: Two New Citrus Rootstocks Released in Spain. Hortscience 2003, 38, 629–630. [Google Scholar] [CrossRef] [Scilit]
  42. Seminara, S.; Bennici, S.; Di Guardo, M.; Caruso, M.; Gentile, A.; La Malfa, S.; Distefano, G. Sweet Orange: Evolution, Characterization, Varieties, and Breeding Perspectives. Agriculture 2023, 13, 264. [Google Scholar] [CrossRef] [Scilit]
  43. ISO 11885:1996; Water Quality—Determination of Selected Elements by Inductively Coupled Plasma Optical Emission Spectrometry (ICP-OES). International Organization for Standardization: Geneva, Switzerland, 1996.
  44. Miller, R.O. Microwave digestion of plant tissue in a closed vessel. In Handbook of Reference Methods for Plant Analysis; Kalra, Y.P., Ed.; CRC Press: Boca Raton, FL, USA, 1998; pp. 69–73. [Google Scholar]
  45. Hair, J.F.; Hult, G.T.M.; Ringle, C.M.; Sarstedt, M. A Primer on Partial Least Squares Structural Equation Modeling (PLS-SEM), 3rd ed.; SAGE Publications: Thousand Oaks, CA, USA, 2022. [Google Scholar]
  46. Lix, L.M.; Keselman, J.C.; Keselman, H.J. Consequences of assumption violations revisited: A quantitative review of alternatives to the one-way analysis of variance F test. Rev. Educ. Res. 1996, 66, 579–619. [Google Scholar] [CrossRef] [Scilit] [PubMed]
  47. Duncan’s Multiple Range Test. In Encyclopedia of Statistical Sciences; Wiley: Hoboken, NJ, USA, 2004. [CrossRef] [Scilit]
  48. Lasdon, L.S.; Waren, A.D.; Jain, A.; Ratner, M. Design and testing of a generalized reduced gradient code for nonlinear programming. ACM Trans. Math. Softw. 1978, 4, 34–50. [Google Scholar] [CrossRef] [Scilit]
  49. Boaretto, R.M.; Quaggio, J.A.; Filho, F.A.; Giné, M.F.; Boaretto, A.E. Absorption and Mobility of Boron in Young Citrus Plants. Commun. Soil. Sci. Plant Anal. 2008, 39, 2501–2514. [Google Scholar] [CrossRef] [Scilit]
  50. Liu, G.D.; Wang, R.D.; Wu, L.S.; Peng, S.A.; Wang, Y.H.; Jiang, C.C. Boron distribution and mobility in navel orange grafted on citrange and trifoliate orange. Plant Soil. 2012, 360, 123–133. [Google Scholar] [CrossRef] [Scilit]
  51. Papadakis, I.E.; Dimassi, K.N.; Therios, I.N. Response of two citrus genotypes to six boron concentrations: Concentration and distribution of nutrients, total absorption, and nutrient use efficiency. Aust. J. Agric. Res. 2003, 54, 571–580. [Google Scholar] [CrossRef] [Scilit]
  52. Quiñones, A.; Martínez-Alcántara, B.; Font, A.; Forner-Giner, M.A.; Legaz, F.; Primo-Millo, E.; Iglesias, D.J. Allometric models for estimating Carbon fixation in citrus trees. Agron. J. 2013, 105, 1355–1366. [Google Scholar] [CrossRef] [Scilit]
  53. Navarro-Pérez, V.; Simón, I.; Cámara-Zapata, J.M.; Muñoz-Acero, J.; Alfosea-Simón, M.; Garcia-Sánchez, F.; Simón-Grao, S. Effects of high boron concentration in irrigation water on the relative tolerance and metabolic responses of different citrus varieties: Lemon, orange and mandarin. Sci. Hortic. 2024, 338, 113660. [Google Scholar] [CrossRef] [Scilit]
  54. Hu, H.; Penn, S.G.; Lebrilla, C.B.; Brown, P.H. Isolation and characterization of soluble boron complexes in higher plants: The mechanism of phloem mobility of boron. Plant Physiol. 1997, 113, 649–655. [Google Scholar] [CrossRef] [Scilit] [PubMed]
  55. Du, W.; Pan, Z.Y.; Hussain, S.B.; Han, Z.-X.; Peng, S.-A.; Liu, Y.-Z. Foliar Supplied Boron Can Be Transported to Roots as a Boron-Sucrose Complex via Phloem in Citrus Trees. Front. Plant Sci. 2020, 11, 250. [Google Scholar] [CrossRef] [Scilit]
  56. Du, W.; Hussain, S.B.; Jin, L.-F.; Liu, X.; Li, R.-N.; Han, Z.-X.; Liu, Y.-Z.; Pan, Z.-Y.; Peng, S.A. Characteristics of boron distribution in the ‘Newhall’ navel orange plant with two root systems. Plant Physiol. Biochem. 2021, 167, 42–48. [Google Scholar] [CrossRef] [Scilit]
  57. Brown, P.H.; Shelp, B.J. Boron mobility in plants. Plant Soil. 1997, 193, 85–101. [Google Scholar] [CrossRef] [Scilit]
  58. Papadakis, I.E.; Dimassi, K.N.; Bosabalidis, A.M.; Therios, I.N.; Patakas, A.; Giannakoula, A. Boron toxicity in ‘Clementine’ mandarin plants grafted on two rootstocks. Plant Sci. 2004, 166, 539–547. [Google Scholar] [CrossRef] [Scilit]
  59. Brown, P.H.; Hu, H. Phloem mobility of boron is species dependent: Evidence for phloem mobility in sorbitol-rich species. Ann. Bot. 1996, 77, 497–506. [Google Scholar] [CrossRef] [Scilit]
  60. Hu, H.; Brown, P.H. The mechanism of phloem mobility of boron. In Plant Nutrition for Sustainable Food Production and Environment; Ando, T., Fujita, K., Mae, T., Matsumoto, H., Mori, S., Sekiya, J., Eds.; Developments in Plant and Soil Sciences; Springer: Dordrecht, The Netherlands, 1997; Volume 78, pp. 153–156. [Google Scholar] [CrossRef] [Scilit]
  61. Hu, H.; Brown, P.H. Absorption of boron by plant roots. Plant Soil. 1997, 193, 49–58. [Google Scholar] [CrossRef] [Scilit]
  62. Hijaz, F.; Killiny, N. Collection and chemical composition of phloem sap from Citrus sinensis L. Osbeck (sweet orange). PLoS ONE 2014, 9, e101830. [Google Scholar] [CrossRef] [Scilit]
  63. Lide, D.R. (Ed.) CRC Handbook of Chemistry and Physics, 82nd ed.; CRC Press: Boca Raton, FL, USA, 2001. [Google Scholar]
  64. Brown, G.M.; Levy, H.A. Sucrose: Precise determination of crystal and molecular structure by neutron diffraction. Science 1963, 141, 921–923. [Google Scholar] [CrossRef] [Scilit]
  65. Coulson, C.A.; Dingle, T.W. The B-O bond lengths in boron oxygen compounds. Acta Crystalographica B 1968, 24, 153–155. [Google Scholar] [CrossRef] [Scilit]
  66. Pérez, S. The structure of sucrose in the crystal and in solution. In Sucrose: Properties and Applications; Mathlouthi, M., Reiser, P., Eds.; Blackie Academic & Professional: London, UK, 1995; pp. 11–32. [Google Scholar]
  67. Moing, A. Sugar alcohols as carbohydrate reserves in some higher plants. Dev. Crop Sci. 2000, 26, 337–358. [Google Scholar] [CrossRef] [Scilit]
  68. Edmond, V.D.V.; Hong, Z.; Nelson, A.S. Sugar alcohols in plants: Implications for enhancing tree seedlings drought tolerance and production strategies. BMC Plant Biol. 2025, 25, 891. [Google Scholar] [CrossRef] [Scilit] [PubMed]
  69. Dominguez, P.G.; Niittylä, T. Mobile forms of carbon in trees: Metabolism and transport. Tree Physiol. 2022, 42, 458–487. [Google Scholar] [CrossRef] [Scilit]
  70. Te-Tsun, Y. Origin and evolution of rosaceae. J. Syst. Evol. 1984, 22, 431–444. [Google Scholar]
  71. Huang, T.R.; Chen, J.-H.; Hummer, K.E.; Alice, L.A.; Wang, W.-H.; He, Y.; Yu, S.-X.; Yang, M.-F.; Chai, T.-Y.; Zhu, X.-Y.; et al. Phylogeny of Rubus (Rosaceae): Integrating molecular and morphological evidence into an infrageneric revision. Taxon 2023, 72, 278–306. [Google Scholar] [CrossRef] [Scilit]
  72. Wu, G.A.; Terol, J.; Ibanez, V.; López-García, A.; Pérez-Román, E.; Borredá, C.; Domingo, C.; Tadeo, F.R.; Carbonell-Caballero, J.; Alonso, R.; et al. Genomics of the origin and evolution of Citrus. Nature 2018, 554, 311–316. [Google Scholar] [CrossRef] [Scilit]
  73. Zhou, G.F.; Peng, S.A.; Liu, Y.Z.; Wei, Q.J.; Han, J.; Islam, M.Z. The physiological and nutritional responses of seven different citrus rootstock seedlings to boron deficiency. Trees 2014, 28, 295–307. [Google Scholar] [CrossRef] [Scilit]
  74. Cañon, P.; Aquea, F.; Rodriguez-Hoces, A.; Arce-Johnson, P. Functional characterization of Citrus macrophylla BOR1 as a boron transporter. Physiol. Plant. 2013, 149, 329–339. [Google Scholar] [CrossRef] [Scilit] [PubMed]
  75. Pedrero, F.; Kalavrouziotis, I.; Alarcón, J.J.; Koukoulakis, P.; Asanoc, T. Use of treated municipal wastewater in irrigated agriculture—Review of some practices in Spain and Greece. Agric. Water Manag. 2010, 97, 1233–1241. [Google Scholar] [CrossRef] [Scilit]
  76. Forner-Giner, M.A.; Rodriguez-Gamir, J.; Martinez-Alcantara, B.; Quiñones, A.; Iglesias, D.J.; Primo-Millo, E.; Forner, J. Performance of Navel orange trees grafted onto two new dwarfing rootstocks (Forner-Alcaide 517 and Forner-Alcaide 418). Sci. Hortic. 2014, 179, 376–387. [Google Scholar] [CrossRef] [Scilit]
Figure 1. Soil soluble boron (a) and soil adsorbed boron (b) at trial end as function of irrigation water boron and soil texture, along with the corresponding 95% confidence intervals for the mean.
Agronomy 16 00418 g001
Figure 2. Relationship between soil soluble and adsorbed boron at trial end considering the different irrigation water boron concentrations.
Agronomy 16 00418 g002
Figure 3. Boron uptake by leaves and roots during the experimental time for the three boron concentrations in the irrigation water, along with the corresponding 95% confidence intervals for the mean. To the right, details of boron uptake by stems at the end of the experiment (336 days).
Agronomy 16 00418 g003
Figure 4. Scatter plots of foliar B versus soil soluble B (a), root B versus soil soluble B (b), foliar B versus soil adsorbed B (c), root B versus soil adsorbed B (d), foliar B versus soil total B (e), and root B versus soil total B (f), with Mitscherlich functions fitted to the experimental data in each panel.
Agronomy 16 00418 g004
Figure 5. Monoester of boric acid with a glycitol, specifically mannitol, showing formation of a single dioxoborolane ring (a); diester of boric acid with two glycitols showing formation of a negatively charged spiro-bis(dioxoborolane) ring system (b); and sucrose, illustrating the trans orientation of all adjacent diols, which precludes formation of dioxoborolane rings (c). All drawings made with FreeChemDraw online chemical structure editor. https://freechemdraw.com/en/ (accessed on 12 January 2026).
Agronomy 16 00418 g005
Figure 6. Effects of pH variation when activity effects are neglected on the relative concentrations of soluble B species (B(OH)3 and B(OH)4) regarding total B and of surface functional groups (X–OH2+, X–OH, and X–O) regarding total X (a), and the corresponding relative concentration products [B(OH)3][X–OH] and [B(OH)3][X–O] (b).
Agronomy 16 00418 g006
Figure 7. Hypothesized causal-loop diagram showing the relationships and feedbacks among the principal elements of the soil–plant system involved in boron (B) dynamics. The negative feedback loop on the left may dampen plant B uptake, thereby resulting in a Mitscherlich-type relationship between leaf B concentration and soil soluble B.
Agronomy 16 00418 g007
Table 1. Main characteristics of the soils in the trial: SOM, soil organic matter; CCE, calcium carbonate equivalent; B sol, soluble boron; B ads, adsorbed boron.
SoilSand ClaySOMCCEpHB sol B ads
% mg L−1mg kg−1
Clay loam20300.3287.90.120.02
Sandy loam57160.4178.00.080.01
Table 2. Average characteristics of the tap water that was used to make the irrigation water: Alk, alkalinity.
Na+Ca2+Mg2+ClNO3SO42−Alk.EC25pH
mg L−1meq L−1µS cm−1
17259264031522777.25
Table 3. Descriptive statistics for both measured and Box–Cox-transformed boron concentrations in the different compartments of the soil–plant system.
VariableUnitNMeanStd. Dev.KurtosisSkewnessMin.Max.
PlantLeaf(mg kg−1)123268.72307.772.131.6824.961312.86
Root13066.7866.2560.306.556.97688.85
Stem4826.099.870.520.8912.3954.91
Log LeafLog
(mg kg−1)
1232.140.49−1.220.211.403.08
Log Root1301.710.310.130.060.842.84
Log Stem481.390.16−0.620.111.091.74
SoilSolution(mg L−1)1291.742.341.801.590.0110.15
Adsorbed(mg kg−1)1294.673.670.750.960.0817.16
SQRT solutionSqrt
(mg L−1)
1291.010.85−0.580.750.103.19
SQRT adsorbedSqrt
(mg kg−1)
1291.950.90−0.56−0.050.274.14
Log SolutionLog
(mg L−1)
129−0.400.92−1.09−0.29−2.001.01
Log AdsorbedLog
(mg kg−1)
1290.460.551.41−1.34−1.121.23
Table 4. Descriptive statistics for both the measured and Box–Cox transformed dry biomass of each plant organ at trial end.
VariableNUnitMeanSDKurtosisSkewnessMinimumMaximum
Leaf biomass45 32.459.05−0.250.44515.753
Roots biomass 48 44.2218.753.131.56518.8113.5
Stem biomass 48(g plant−1)43.8311.731.210.88420.679.1
Total biomass (TDB) 45 120.2234.861.411.08860.2224.6
Log leaf45 1.4940.123−0.31−0.2011.21.72
Log root48Log
(g plant−1)
1.6130.1660.300.3571.272.05
Log stem48 1.6270.1130.430.0231.311.9
Log TDB45 2.0630.1190.330.2331.782.35
Table 5. p-values of the four-way analyses of variance of the B concentration in the different compartments of the soil–plant system and of the dry plant biomass as a function of the factors: boron concentration in the irrigation water (Boron), soil texture (Soil), rootstock and date. Italics indicates higher than 95% significance.
FactorLogarithm to Base Ten of Plant B Concentration in…Square Root of Soil B Concentration as…Logarithm to Base Ten of Dry Biomass in…
LeavesRootsStemsSoluble AdsorbedLeavesRootsStemsTotal
Boron<0.001<0.0010.291<0.001<0.0010.0060.4460.5990.161
Soil<0.0010.1930.8690.675<0.0010.6220.8400.9190.740
Rootstock0.3760.9420.1570.7840.0500.3660.0020.0210.007
Date<0.001<0.001 <0.001<0.001
Boron × soil0.8530.6570.0450.3820.1390.8560.8960.4900.751
Boron × rootstock0.2680.7260.0150.2190.2530.0990.6390.2100.240
Boron × date<0.001<0.001 <0.001<0.001
Soil × rootstock0.4990.6990.6150.2690.8980.7430.2260.2650.321
Soil × date0.0060.122 0.0430.012
Rootstock × date<0.0010.271 0.2940.447
Table 6. Comparison of total dry biomass per plant at trial end between the two rootstocks at the three water boron concentrations.
RootstockWater Boron (mg L−1)Total Dry Biomass (g plant−1)Std. Dev.Log (Total Dry Biomass)Std. Dev. p-Value
Carrizo0.11111.1837.172.030.120.82
FA50.11112.1019.392.040.08
Carrizo2110.7517.212.040.060.012
FA52154.1439.542.170.10
Carrizo596.1023.091.970.100.026
FA55133.7339.412.110.11
Table 7. Parameters of the Mitscherlich functions (Equation (1)) fitted to the relationships between the decimal logarithm of leaf and root B concentrations (y) and the square root of soil B fractions (x), along with the total sum of squares (TSS), the model sum of squares (SSM), and the coefficient of determination (R2 = SSM/TSS). All parameters are expressed as the 95% confidence interval for the mean.
Plant OrganSoil B Fractionabx0R2
LeafSoluble3.1 ± 0.40.6 ± 0.20.9 ± 0.30.81 ± 0.04
RootSoluble2.2 ± 0.10.7 ± 0.21.0 ± 0.30.79 ± 0.06
LeafAdsorbed 0.06 ± 0.112.7 ± 1.10.60 ± 0.08
RootAdsorbed 0.20 ± 0.182.5 ± 1.50.62 ± 0.09
LeafTotal5 ± 40.14 ± 0.102.7 ± 1.20.72 ± 0.07
RootTotal2.6 ± 0.60.22 ± 0.122.7 ± 1.10.73 ± 0.08
Disclaimer/Publisher’s Note: The statements, opinions and data contained in all publications are solely those of the individual author(s) and contributor(s) and not of MDPI and/or the editor(s). MDPI and/or the editor(s) disclaim responsibility for any injury to people or property resulting from any ideas, methods, instructions or products referred to in the content.