Abstract
Chloro-organophosphate ester (Cl-OPE) accumulation in soil and aquatic environments, and their potential hazard to crops, has attracted widespread attention. However, little is known about the potential adverse effects of Cl-OPEs on plants. Green onions are a specialty vegetable worldwide, and the heavy application of pesticides during their growth period has led to increasingly severe soil contamination in cultivation areas. We evaluated the toxic effects of Cl-OPEs on green onions and examined their toxicity mechanism. After 20 days of treatment, physiological parameters were measured across five biological replicates per treatment. Results indicated that as Cl-OPE concentrations increased, green onion leaf malondialdehyde (MDA) content and reactive oxygen species (ROS) levels rose significantly. Concurrently, the activities of the antioxidant enzymes superoxide dismutase (SOD), peroxidase (POD) and catalase (CAT) were significantly enhanced. However, leaf chlorophyll content and net photosynthetic rate (Pn) decreased significantly, indicating that Cl-OPE-induced oxidative stress inhibited photosynthesis. Meanwhile, the nutrient content of green onions gradually decreased as the concentration of Cl-OPEs increased. In conclusion, Cl-OPEs can damage chloroplasts by promoting ROS accumulation, which results in the yellowing of green onion leaves. The resulting decrease in Pn reduced the plant’s ability to assimilate nutrients.
1. Introduction
Organophosphate esters (OPEs) are a new type of flame retardant that has replaced the original brominated flame retardants. In recent years, their production and use has increased rapidly [1]. With the widespread use of products containing OPEs, they are inevitably released into the soil and have been widely detected in the environment [2,3,4,5,6,7,8,9]. Studies have shown that OPEs are widespread in the environment, potentially toxic, and have received significant attention [10]. All kinds of water sources and pollutants containing OPEs converge in the soil. Plants can absorb OPEs from the soil, which are then transferred through the food chain to animals and humans, causing adverse effects such as neurotoxicity and developmental abnormalities. Due to bio-accumulation and food chain transfer mechanisms, the safety of vegetable consumption faces significant risks [11,12].
Chlorinated organic phosphate esters (Cl-OPEs) are a major class of OPEs widely used in paints and plastics. The most common Cl-OPEs include Tris (2-chloroethyl) phosphate (TCEP), Tris (chlorisopropyl) phosphate (TCPP) and Tri (1,3-dichloropropyl) phosphate (TDCPP). These Cl-OPEs account for 55% of total OPE consumption and are emerging pollutants widely present in the natural environment (surface water, groundwater, sediment, soil, etc.) [13]. The detection rate and concentration of Cl-OPEs are generally higher than those of non-chlorinated OPEs [14]. It has been demonstrated that OPEs can accumulate in both animals and plants [12,15]. Some researchers have found that OPEs can inhibit rice seed germination and growth [16]. After organic pollutants are absorbed from the soil solution by plant roots, some of them enter the neocolonial sheath via the sarcoplasmic pathway and are then transported through the xylem to the upper part of the plant [17]. The presence of TCPP in strawberry fruit further suggests that it could be transported through the phloem. This indicates that Cl-OPEs are able to move to the edible parts of the plant, thereby increasing the health risk [18].
Green onions are widely cultivated worldwide as a specialty vegetable. They serve not only as a seasoning but also find extensive applications in pharmaceuticals, food products, and daily chemical goods [19]. Green onions are often grown in the same soil year after year. In recent years, Cl-OPEs have been detected as emerging pollutants, widely present in surface water, groundwater, sediments, and soil. Therefore, the potential toxicity of Cl-OPEs to green onions has become a significant concern. Photosynthesis is a vital biological process for plant life, and net photosynthetic rate (Pn) represents the essential pathway for plants to assimilate nutrients. Antioxidant capacity reflects a plant’s adaptability and stress resistance to environmental challenges. This study used the ‘Yuanzang’ variety of green onion as the experimental material to analyze the effects of three chlorinated organophosphorus compounds (TCEP, TCPP and TDCPP) at different concentrations on leaf pigment content, as well as their regulatory roles in growth and photosynthetic energy absorption. Meanwhile, the effect of Cl-OPEs on oxidative stress in green onions was explored by measuring antioxidant enzyme activities and investigating the mechanism by which Cl-OPEs inhibit photosynthesis in green onions. These findings provide theoretical support for the potential hazards of Cl-OPEs to plants, as well as providing a foundation for understanding how green onions respond to Cl-OPE toxicity.
2. Materials and Methods
2.1. Cl-OPEs Preparation
Solutions of TCEP (purity 98%), TCPP (purity 98%) and TDCPP (purity, 96%) were purchased from Sigma-Aldrich (St. Louis, MO, USA). Stock solutions were prepared in methanol at a concentration of 1000 mg/mL, and then diluted to achieve final concentrations of 0, 0.01, 0.1, 1 and 10 μmol/L using Hoagland nutrient solution. All Cl-OPE solutions were freshly prepared and stored at room temperature under light-protected conditions at all times (valid for one month).
2.2. Plant Material and Culture Conditions
The experiment was conducted in 2022 in the artificial climate chamber at Shandong Agricultural University. We used the “Yuanzang” variety of green onion, supplied by Taishan Seed Technology Co., Ltd., Tai’an, China. The seeds were washed and cultivated in 72-well cavity trays containing a substrate of grass charcoal, perlite and vermiculite in a ratio of 6:3:1. After sowing, the seedlings were watered with pure 1/2 Hoagland nutrient solution every three days. When the plant height reached approximately 15 cm, the seedlings were transplanted into seedling pots filled with coconut coir (one seedling per pot; pot dimensions: 7 cm long × 7 cm wide × 10 cm high). After 3 days of cultivation, the seedling pots were transferred to black plastic containers (dimensions: 45 cm long × 30 cm wide × 20 cm high). A total of 20 seedlings were planted per container, with 5 plastic containers per treatment. The plants were placed in an incubation chamber with light intensity controlled at (500 ± 5) μmol/(m2·s) (Huizhou Kedao Technology Co., Ltd., Huizhou, China), a photoperiod of 12 h light/12 h dark/d, a temperature of (25 ± 2) °C during the day/(20 ± 2) °C at night, a relative humidity of (65 ± 5)% and Cl-OPEs diluted with Hoagland nutrient solution at concentrations of 0 (CK), 0.01, 0.1, 1 and 10 μmol/L, with the solution being changed every three days for 20 days. All tests were conducted on five randomly selected seedlings from five biological replicates, with a total of five seedlings chosen.
2.3. Measurement of Morphological and Physiological Characteristics
After 20 days of treatment, five green onion plants were randomly selected for sampling. Their plant height, pseudostem height and pseudostem diameter were then measured using a straightedge and vernier caliper. The fresh weights of the leaves and pseudostems were weighed separately using a scale. The leaf photosynthetic pigment content was determined using the 80% acetone extraction method. A total of 0.2 g of fresh leaves was placed in a 20 mL test tube. A total of 5 mL of anhydrous ethanol and 5 mL of 80% acetone were added. The mixture was then incubated in the dark for 24 h. Measurements were performed using a Shimadzu UV-1200 spectrophotometer (Aoyi Instruments Shanghai Co., Ltd., Shanghai, China). Carotenoids were determined at 470 nm (OD470), chlorophyll a (Chl a) at 663 nm (OD663) and chlorophyll b (Chl b) at 645 nm (OD645) [20,21]. Leaf pigment content in the leaves was calculated using the following equations:
where V is the total volume of anhydrous ethanol and acetone extract (mL), and W is the FW (g) of the sample.
2.4. Measurement of Photosynthetic Parameters
Five green onion plants were randomly selected from each treatment concentration. Photosynthetic parameters of the second functional leaf were measured using a photosynthesis analyzer (LI-6800, Li-COR Biosciences, Lincoln, NE, USA). These parameters mainly included the net photosynthetic rate (Pn), the inter-cellular CO2 concentration (Ci), the transpiration rate (E) and the stomatal conductance (Gs). Following the method described by Riches et al. (2020) [22], the temperature was set to 25 °C, the light intensity to 500 μmol/(m2·s), the CO2 concentration to 400 µmol·mol−1, the chamber flow to 500 µmol·s−1 and the chamber overpressure to 0.1 kPa. The fan speed was set to 10,000 rpm, and the relative humidity to 50%. The measurement chamber size was 6 cm2. Recordings were made when the Pn reached a steady state (after approximately 5 min). Parameters were maintained consistently across all treatments.
2.5. Measurement of Chlorophyll Fluorescence
The chlorophyll fluorescence parameters of green onion leaves were measured following the method described by Liu et al. (2021) [23], which is detailed below. After 20 days of treatment, five green onion plants treated with different concentrations were randomly selected. After 30 min of dark acclimation, the chlorophyll fluorescence parameters of the functional leaves were measured using a MINI-IMAGING-PAM chlorophyll fluorescence imaging system (Heinz Walz GmbH, Effeltrich, Germany). This involved first applying saturating pulsed light (3000 μmol/m2/s for 300 ms). The measured indexes included maximum photochemical efficiency (Fv/Fm), actual photochemical efficiency (ΦPSII), PSII regulated energy dissipation quantum yield Y (NPQ) and PSII unregulated energy dissipation quantum yield of photosynthetic system II (PSII) under dark acclimatization Y (NO) [24]. The calculation equations are as follows:
where the photochemical quenching coefficient (qL) responds to the degree of opening of the PSII reaction center, which was calculated as follows:
2.6. Measurement of Antioxidant Capacity
After 20 days of treatment, the functional leaves of five green onion plants treated with different concentrations were randomly selected to determine their antioxidant capacity. To determine the malondialdehyde (MDA) content, weigh 1.0 g of fresh leaves and add 4 mL of a 20% trichloroacetic acid solution containing 0.5% thiopental. Grind the mixture thoroughly and centrifuge it. Heat the supernatant at 95 °C for 30 min and then cool it rapidly in an ice bath. Centrifuge the sample at 10,000× g for 10 min. Measure the absorbance of the supernatant at 532 nm. Subtract the non-specific absorbance value at 600 nm from this reading. Calculate the MDA concentration using an extinction coefficient of 155 mM−1·cm−1 [25].
The O2−·content was determined by hydroxylamine oxidation [26]. The hydrogen peroxide (H2O2) content was determined by the method described by Patterson et al. (1984) [27]. Antioxidant-related enzymes superoxide dismutase (SOD), peroxidase (POD) and catalase (CAT) were determined according to the method described by Gong et al. (2014) [28].
2.7. Measurement of Nutrients
The content of ascorbic acid (AsA) was determined by molybdenum blue colorimetry [29]. The specific method was as follows: 2.0 g of fresh sample was accurately weighed, ground into homogenate with 5.0 mL oxalic acid EDTA solution, and transferred into a 25 mL capacity bottle; the mortar and hammer were rinsed with extraction medium 2–3 times; and the flushing solution was combined in a 25 mL capacity bottle and the volume was fixed. After a part of the homogenate was centrifuged for 3000× g for 10 min at 4 °C, the supernatant of 1.0 mL was put into a clean 25 mL glass test tube, followed by adding 4.0 mL of oxalic acid EDTA solution, 0.5 mL of metaphosphoric acid solution, 1.0 mL of 0.5% H2SO4 solution and 2.0 mL of 5% ammonium molybdate solution, shaking, holding for 15 min in a water bath at 30 °C, diluting the solution to the 25 mL scale with distilled water, mixing the solution, colorimetry at a 723 nm wavelength, and recording absorbance. The content of AsA was calculated.
The determination of soluble sugar content was carried out according to the method described by Lin et al. (2013) [30] and slightly modified. A total of 0.3 g of fresh sample was accurately weighed and put it into a 20 mL glass tube with plug. A total of 10 mL of distillate was added and then it was sealed in a boiling water bath for 30 min. The procedure was repeated twice. It was then filtered and the volume was placed in a 50 mL capacity bottle as the solution to be tested. The 1 mL solution was absorbed, and then 1 mL distilled water and 4 mL anthrone reagent were added in turn and shaken well. The absorbance value was determined, and the content of soluble sugar in 620 nm was calculated.
According to the method described by Li et al. (2021b) [31], the content of organic acids was determined by capillary electrophoresis (PA800 PLUS, Beckman Coulter, Inc., Brea, CA, USA). First, 1.00 g fresh samples were accurately weighed, and then ground in an ice bath with 8 mL deionized water. Then, the supernatant was properly diluted to prepare the solution to be tested by centrifugation at 4 °C with 10,000× g for 15 min. The solution was filtered through a 0.22 μm membrane filter. The sample solution was injected into the special injection tube of the capillary electrophoresis instrument and injected at 254 nm and 200 nm for 3 s and 18 s, respectively. The voltages were −8.1 kV and −9 kV.
2.8. Statistical Analyses
All treatments were performed as random samples. The data presented show the mean ± standard deviation of the experiment. Statistical analyses were performed using one-way ANOVA in GraphPad Prism statistical software (version 10.1.0), followed by post hoc comparisons using Dunnett’s multiple comparisons test. Principal component analysis (PCA) used R software (version 4.4.0). Finally, the data were plotted as graphs in Excel 2016.
3. Results
3.1. Effect of Cl-OPE Concentration on Green Onion Morphology and Phenotype
As shown in Table 1, green onions cultivated in nutrient solutions with different Cl-OPE concentrations exhibited significant differences in plant height, pseudostem diameter and leaf fresh weight. However, differences in leaf number, pseudostem height and pseudostem fresh weight were not significant (Figure 1A). Both pseudostem diameter and leaf fresh weight showed a decreasing trend as solution concentration increased. Surprisingly, plant height and pseudostem height reached their maximum values at the 0.01 μmol/L concentration. Compared to the control group and treatments at 0.1, 1 and 10 μmol/L, pseudostem diameter increased by 7.53%, 9.60%, 13.91% and 16.08%, respectively.

Table 1.
Effect of Cl-OPEs concentration on green onion morphology and phenotype (mean ± S.D. n = 5).
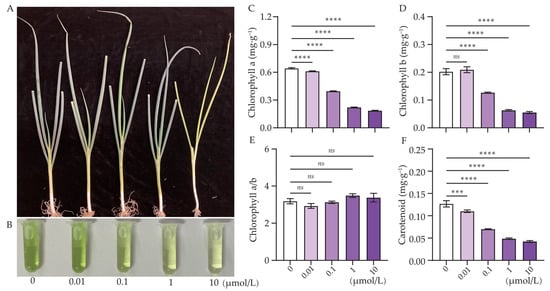
Figure 1.
Effect of Cl-OPE concentration on green onion growth and leaf pigment content. (A) Growth characteristics of green onion seedlings. (B) Leaf pigment content of green onion seedlings. (C) Chlorophyll a. (D) Chlorophyll b. (E) Chlorophyll a/b. (F) Carotenoid. Values are means ± standard deviation (S.D.). One-way ANOVA was applied to check the significant differences between the five groups. ns, not significant.. *** p < 0.001. **** p < 0.0001.
In our study, we could clearly observe that the green onion leaves gradually showed signs of yellowing as the concentration of Cl-OPEs increased (Figure 1A,B). Assessing the chlorophyll and carotenoid content of the leaves revealed that chlorophyll content decreased substantially with increasing Cl-OPE concentration. Compared to the 0 μmol/L treatment, the chl a content decreased by 10.29%, 44.12%, 66.18% and 72.06% at 0.01, 0.1, 1 and 10 μmol/L treatment, respectively (Figure 1C,D). The chlorophyll a/b ratio did not differ significantly among treatment groups (Figure 1E). The carotenoid content also decreased significantly with increasing Cl-OPEs concentrations. Compared to the control group, the carotenoid content decreased by 8.33%, 41.67%, 58.33% and 66.67% in the 0.01, 0.1, 1 and 10 μmol/L treatments groups, respectively (Figure 1F).
3.2. Effect of Cl-OPEs Concentration on Green Onion Leaf Photosynthesis
Following statistical analysis, it was found that the Pn, E and Gs of green onion leaves treated with a Cl-OPE concentration of 0.01 μmol/L were significantly higher than those of the other treatments, while Ci was significantly lower (Figure 2A–D). Compared to the 0.01 μmol/L treatment, Pn decreased by 9.30%, 18.78%, 26.98% and 38.10% at 0, 0.1, 1 and 10 μmol/L, respectively (Figure 2A). This is not consistent with the trend of leaf pigment content in each treatment. This indicates that low concentrations of Cl-OPEs enhance green onion photosynthesis, whereas high concentrations reduce photosynthetic pigment content in green onion leaves, thereby decreasing plant photosynthetic efficiency.
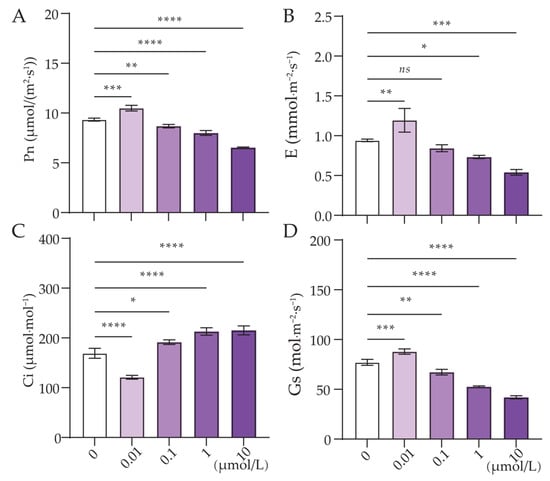
Figure 2.
Effect of Cl-OPE concentration on green onion leaf photosynthesis. (A) Photosynthetic rate (Pn). (B) Transpiration rate (E). (C) Intercellular CO2 concentration (Ci). (D) Stomatal conductance (Gs). Values are means ± standard deviation (S.D.). One-way ANOVA was applied to check the significant differences between the five groups. ns, not significant. * p < 0.05. ** p < 0.01. *** p < 0.001. **** p < 0.0001.
3.3. Effect of Cl-OPE Concentration on Green Onion Leaf Chlorophyll Fluorescence
In this study, significant differences in leaf chlorophyll fluorescence were observed across different Cl-OPE concentration treatments. The Fv/Fm values of green onion seedlings treated with 0 and 0.01 μmol/L concentrations were significantly higher than those in the high-concentration Cl-OPEs treatment group, indicating varying degrees of damage to the photosynthetic apparatus in green onion leaves subjected to high-concentration chlorinated organophosphorus pesticide exposure. The ΦPSII trend was consistent with the Fv/Fm observations. NPQ levels in green onion leaves treated with high-concentration Cl-OPEs significantly increased (Table 2, Figure 3). These results indicated that high concentrations of Cl-OPEs enhance heat dissipation capacity, while low concentrations of Cl-OPEs increase the activity of the PSII reaction center.
Table 2.
Effect of Cl-OPE concentration on green onion leaf chlorophyll fluorescence (mean ± S.D. n = 5).
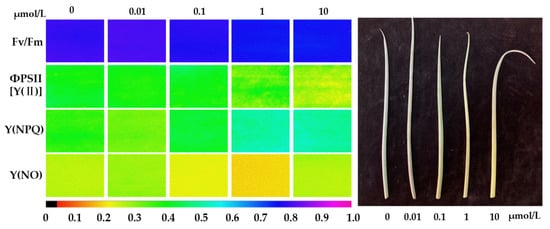
Figure 3.
Chlorophyll fluorescence imaging of green onion leaves under different treatments. Chlorophyll fluorescence imaging provided a better visualization of the differences between the treatments. The color scale at the bottom of the image displays relative values for each parameter, ranging from zero (black) to one (purple). The specific values were shown in Table 2.
3.4. Effect of Cl-OPE Concentration on Green Onion Leaf Antioxidative Capacity
In order to assess the oxidative damage of different concentrations of Cl-OPEs on green onion leaves, ROS and MDA levels have been examined. The results showed that ROS levels in green onion leaves increased significantly with increasing concentrations of Cl-OPEs (Figure 4A–C). When the concentration of Cl-OPEs was increased to 10 μmol/L, the MDA content of green onion leaves was four times higher than that of the control group (Figure 4A).
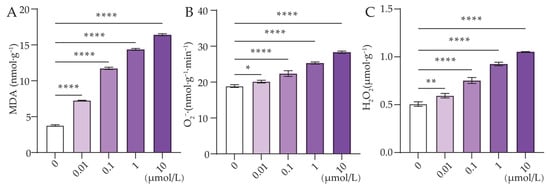
Figure 4.
Effect of Cl-OPE concentration on green onion leaf MDA, O2−‧ and H2O2 content. (A) Malondialdehyde (MDA). (B) Superoxide anion (O2−‧). (C) Hydrogen peroxide (H2O2). Values are means ± standard deviation (S.D.). One-way ANOVA was applied to check the significant differences between the five groups. ns, not significant. * p < 0.05. ** p < 0.01. **** p < 0.0001.
Different concentrations of Cl-OPEs significantly affected the changes in antioxidant enzyme activities, a result consistent with the changes in ROS and MDA contents. The SOD activities in green onion leaves were increased by 12.66% and 48.75% compared with the control when the concentrations of Cl-OPEs were 0.1 and 10 μmol/L, respectively (Figure 5A). Similarly, POD and CAT activity in green onion leaves was also concentration-dependent, both increasing with increasing concentrations of Cl-OPEs (Figure 5B,C).
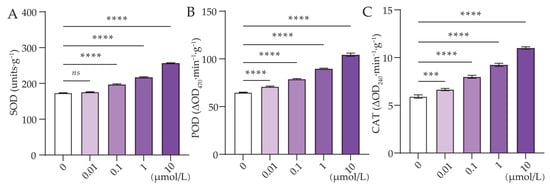
Figure 5.
Effect of Cl-OPE concentration on green onion leaf antioxidant enzymes. (A) Superoxide dismutase (SOD). (B) Peroxidase (POD). (C) Catalase (CAT). Values are means ± standard deviation (S.D.). One-way ANOVA was applied to check the significant differences between the five groups. ns, not significant. *** p < 0.001, **** p < 0.0001.
3.5. Effect of Cl-OPEs Concentration on Green Onion Nutrients
There were significant differences in AsA content and soluble sugar content among different treatments (Figure 6). It is evident that the AsA content in green onion pseudostems and leaves tends to balance. As the concentration of Cl-OPEs increases, the AsA content in green onion significantly decreases, possibly due to the high concentration of Cl-OPEs affecting vitamin synthesis in plants (Figure 6A). However, under the 0.01 μmol/L concentration treatment, the soluble sugar content significantly increased, which may be due to the low concentration of P element promoting sugar synthesis (Figure 6B).
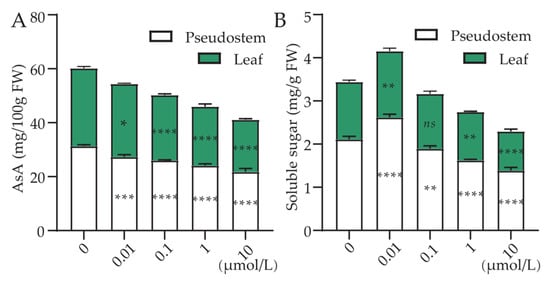
Figure 6.
Effect of Cl-OPE concentration on the content of (A) ascorbic acid and (B) soluble sugar in different organs of green onion. Values are means ± standard deviation (S.D.). One-way ANOVA was applied to check the significant differences between the five groups. ns, not significant. * p < 0.05. ** p < 0.01. *** p < 0.001. **** p < 0.0001.
The concentration of Cl-OPEs was also found to significantly affect the content of organic acids in green onions (Figure 7). Compared with the control (CK), we found that the oxalic acid content in green onion leaves treated with 0.01, 0.1, 1 and 10 μmol/L decreased significantly by 5.84%, 25.35% and 42.34%, respectively (Figure 7A). For succinic acid and citric acid, all treatments except 0.01 μmol/L decreased significantly with increasing Cl-OPEs concentration (Figure 7B,C). The same trend was observed in the leaves of the pseudostem.
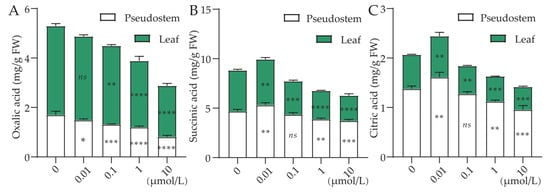
Figure 7.
Effect of Cl-OPEs concentration on the content of (A) oxalic acid, (B) succinic acid and (C) citric acid in different organs of green onion. Values are means ± standard deviation (S.D.). One-way ANOVA was applied to check the significant differences between the five groups. ns, not significant. * p < 0.05. ** p < 0.01. *** p < 0.001. **** p < 0.0001.
3.6. Relationships Between Studied Traits
Principal component analysis (PCA) evaluated variations in measured parameter values, reflecting the greatest variability within the input data (measured parameters). Figure 8 shows the principal component analysis of onion experimental parameter variability under different treatment conditions. All five treatments formed distinct clusters located in separate regions of the coordinate system. PCA analysis confirmed that varying Cl-OPE concentrations altered correlations among test variables. In plants subjected to low-concentration Cl-OPE treatments, novel correlations emerged between net Pn and soluble sugars, as well as succinic acid and citric acid. However, under high-concentration Cl-OPE solution treatments, antioxidant substances and antioxidant enzyme activities showed negative correlations on both PCA1 and PCA2, indicating plant stress (Figure 8).
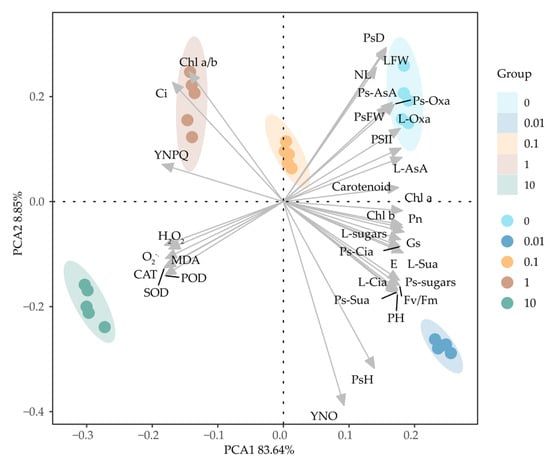
Figure 8.
Principal component analysis (PCA) plot of physiological parameters in green onions under different Cl-OPE concentrations. Different colors represent distinct treatment conditions. NL: number of leaves, PH: plant height, PsH: pseudostem height, PsD: pseudostem diameter, LFW: leaf FW, PsFW: pseudostem FW, Ps-AsA: pseudostem ascorbic acid, L-AsA: leaf ascorbic acid, Ps-sugars: pseudostem soluble sugar, L-sugars: leaf soluble sugar, Ps-Oxa: pseudostem oxalic acid, L-Oxa: leaf oxalic acid, Ps-Sua: pseudostem succinic acid, L-Sua: leaf succinic acid, Ps-Cia: pseudostems citric acid, and L-Cia: leaf citric acid.
4. Discussion
It had been demonstrated that Cl-OPEs are transported through the phloem of plant stems and leaves, eventually accumulating in plant roots and fruits and affecting plant photosynthesis [32,33]. Green onion leaves showed yellowing after exposure to high concentrations of Cl-OPEs, and leaf pigmentation was significantly reduced after exposure to Cl-OPEs at concentrations exceeding 0.01 μmol/L. However, chlorophyll content increased in 0.01 μmol/L Cl-OPEs, suggested that low concentrations of Cl-OPEs may contribute to chlorophyll synthesis [34]. This may also explain the increase in the photosynthetic rate of green onion treated with low concentrations of Cl-OPEs.
Chlorophylls and carotenoids are important photosynthetic pigments in plants, playing a key role in electron transfer reactions in PS I and PS II [35]. Changes in chlorophyll concentration are commonly used as an indicator of the photosynthetic state of plants and their response to environmental stresses [36]. In our study, chlorophyll content decreased as the concentration of organophosphate increased, which may be due to Cl-OPEs inducing excessive ROS production in green onion seedlings, leading to oxidative stress and consequently decreasing photosynthetic pigment content [37]. Photosynthesis is an important process by which green plants convert inorganic matter into organic matter. Studies have shown that exposure to environmental pollutants impairs or alters photosynthesis and inhibits plant growth [38,39]. This may be because OPEs could bind to non-specific lipid transfer proteins (nsLTPs) [40], which were taken up by plant roots and then transported long distances through the phloem and xylem leading to their accumulation in leaves and affecting green onion growth [41,42].
Fv/Fm is the maximum/maximal photochemical efficiency of PSII in the dark. This parameter varied minimally under non-stress conditions and was not affected by species and growth conditions, whereas it decreased significantly under stress conditions. ΦPSII (YII) reflects the actual light energy conversion efficiency of leaves under light. Chlorophyll fluorescence analysis could be used to evaluate photosynthesis in plants in the field [43] and to identify short- and long-term stress and damage to the photosynthetic apparatus, as well as recovery after stress is removed [44]. Recently, the effects of potential contaminants on many plants have been monitored using pulse amplitude modulation (PAM) fluorometry [23,45,46,47]. Non-photochemical quenching (NPQ) indicates the dissipation of excess excitation energy in the form of heat and is a regulatory mechanism evolved by photosynthetic organisms to balance light-dependent processes and metabolic utilization of photosynthetic products [48]. As the concentration of Cl-OPE increased, the Fv/Fm and ΦPSII values of green onion leaves decreased significantly, while the Y (NPQ) value gradually increased. Changes in chlorophyll fluorescence under different treatments indicated that green onions were sensitive to Cl-OPEs (Figure 3). This may be due to elevated pollutant concentrations impairing the utilization efficiency of ATP and NADPH, resulting in an imbalance with available excitation energy. This disruption affects cellular energy metabolism and the supply of reducing power, ultimately interfering with normal physiological functions [49].
Rapid production of ROS is an important marker for the activation of plant defense systems, including substances such as superoxide anion (O2−·) and hydrogen peroxide (H2O2). Excessive ROS can lead to membrane damage and the production of high levels of malondialdehyde (MDA), resulting in severe damage to plant cell membranes [50]. It has been demonstrated that carotenoids can react with superoxide anions produced by oxidized chlorophyll trimers, resulting in the formation of oxidized carotenoids and reducing carotenoid levels [51]. In our study, exposure of green onions to Cl-OPEs resulted in a significant decrease in carotenoid content, probably because Cl-OPEs induce oxidative stress, which inhibits photosynthesis and ultimately leads to decreased plant growth (Figure 1A).
The antioxidant enzyme system in plants plays a crucial role in scavenging excess reactive oxygen species (ROS) to ensure normal plant metabolism and growth; SOD first converts the ROS produced in the primary cells into peroxides or hydrogen peroxide (H2O2), and the produced peroxides as well as H2O2 are then metabolized into water and oxygen by antioxidant enzymes such as POD [52]. Therefore, the increase in antioxidant enzyme concentration in green onion is a response to eliminate the excessive accumulation of ROS due to external stresses. Together, the above results demonstrate the effect of Cl-OPEs on oxidative stress in green onions. The increase in ROS in green onion activated the increase in antioxidant enzyme activity in green onion. According to previous studies, Cl-OPEs may be similarly toxic to microalgae [53].
To date, no researchers had reported the effect of Cl-OPE on plant nutrition. In this study, we found that the contents of AsA and soluble sugar content decreased significantly with increasing Cl-OPE concentration, consistent with the photosynthetic rate trend. This indicated that a high concentration of Cl-OPEs may inhibit the formation of photosynthates, affecting the transport of carbohydrates and the metabolic pathway and thus reducing the quality of green onions [54,55]. The influence of Cl-OPE concentration on organic acid content remains unclear. However, the genetic and environmental control of organic acid metabolism and accumulation was significant, as it played a crucial role in pH regulation and sensory characteristics in plants [56].
Principal component analysis (PCA) was employed to identify the variation structure among measured parameters and reduce the number of variables requiring detailed analysis. Parameters exhibiting distinct correlations across different treatments were selected as candidates for detailed temporal process studies [57]. In our study, all five treatments formed distinct clusters located in separate regions of the coordinate system. Based on PCA analysis, this study suggests that physiological parameters of different treatment samples can be represented by ΦPSII or jointly by Y (NO) and pseudostem diameter.
5. Conclusions
This study investigated the detrimental effects of Cl-OPE induced oxidative stress on photosynthesis and nutrient accumulation in green onion seedlings. Green onion exhibited dose-dependent toxic effects when exposed to Cl-OPEs (Figure 1A). High concentrations inhibit green onion growth and damage chloroplasts by increasing the accumulation of reactive oxygen substances (MDA and ROS). This reduces leaf pigment content and subsequently suppresses photosynthetic rates. The decline in photochemical activity during Cl-OPE treatment is probably caused by changes in photosystem electron transport processes, which are closely related to the concentration of intracellular ROS (Figure 9). Concurrently, reduced photosynthetic efficiency diminished the plant’s capacity to convert light energy into chemical energy, thereby lowering carbohydrate synthesis rates and resulting in decreased nutrient content in the green onions. Future research will focus on the molecular toxicity mechanism of Cl-OPEs in green onions and identify the specific sites where they inhibit the photosynthetic electron transport chain.
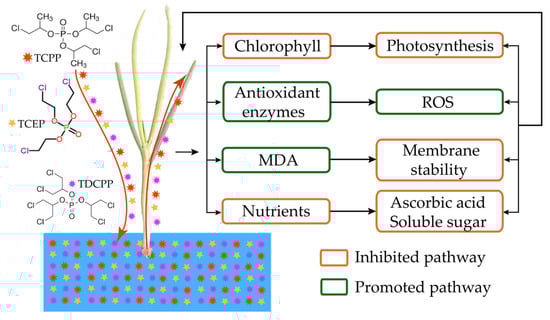
Figure 9.
The possible model for high organophosphate content inhibiting green onion seedling growth.
Author Contributions
S.G. designed the experiment and wrote the manuscript. Y.G. (Yuwei Guo) conducted experiments. N.L. validated experiments. Y.W. reviewed and revised the manuscript. T.L. reviewed and edited the manuscript. Y.G. (Yuanyuan Guo) analyzed the data. K.X. reviewed and edited the manuscript. All authors have read and agreed to the published version of the manuscript.
Funding
This research was funded by Natural Science Foundation of Yangzhou Science and Technology Program (YZ2024181), Jiangsu Provincial Basic Research Program of Higher Education (23KJB210017), Basic Research Program of Jiangsu (BK20250894).
Data Availability Statement
The original contributions presented in this study are included in the article. Further inquiries can be directed to the corresponding authors.
Conflicts of Interest
The authors declare no conflicts of interest.
References
- Cheng, Y.; Zheng, X.; Hu, C.; Luo, Q.; Liu, X.; Liu, S.; He, P.; Chang, K.; Yang, F.; Ding, Y. A review of organophosphorus esters in soil: Pollution status, migration, risks, and transformation. Curr. Opin. Environ. Sci. Health 2025, 44, 100599. [Google Scholar] [CrossRef]
- Tian, Y.X.; Chen, H.Y.; Ma, J.; Liu, Q.Y.; Qu, Y.J.; Zhao, W.H. A critical review on sources and environmental behavior of organophosphorus flame retardants in the soil: Current knowledge and future perspectives. J. Hazard. Mater. 2023, 452, 131161. [Google Scholar] [CrossRef] [PubMed]
- Lian, M.; Lin, C.; Wu, T.; Xin, M.; Gu, X.; Lu, S.; Cao, Y.; Wang, B.; Ouyang, W.; Liu, X.; et al. Occurrence, spatiotemporal distribution, and ecological risks of organophosphate esters in the water of the Yellow River to the Laizhou Bay, Bohai Sea. Sci. Total Environ. 2021, 787, 147528. [Google Scholar] [CrossRef] [PubMed]
- Tang, J.; Sun, J.; Ke, Z.; Yin, H.; Yang, L.; Yen, H.; Li, X.; Xu, Y. Organophosphate esters in surface soils from a heavily urbanized region of Eastern China: Occurrence, distribution, and ecological risk assessment. Environ. Pollut. 2021, 291, 118200. [Google Scholar] [CrossRef]
- Gong, X.; Zhang, W.; Zhang, S.; Wang, Y.; Zhang, X.; Lu, Y.; Sun, H.; Wang, L. Organophosphite Antioxidants in Mulch Films Are Important Sources of Organophosphate Pollutants in Farmlands. Environ. Sci. Technol. 2021, 55, 7398–7406. [Google Scholar] [CrossRef]
- Ali, N.; Eqani, S.; Ismail, I.M.I.; Malarvannan, G.; Kadi, M.W.; Albar, H.M.S.; Rehan, M.; Covaci, A. Brominated and organophosphate flame retardants in indoor dust of Jeddah, Kingdom of Saudi Arabia: Implications for human exposure. Sci. Total Environ. 2016, 569–570, 269–277. [Google Scholar] [CrossRef]
- Cao, D.; Guo, J.; Wang, Y.; Li, Z.; Liang, K.; Corcoran, M.B.; Hosseini, S.; Bonina, S.M.; Rockne, K.J.; Sturchio, N.C.; et al. Organophosphate Esters in Sediment of the Great Lakes. Environ. Sci. Technol. 2017, 51, 1441–1449. [Google Scholar] [CrossRef]
- Cui, K.; Wen, J.; Zeng, F.; Li, S.; Zhou, X.; Zeng, Z. Occurrence and distribution of organophosphate esters in urban soils of the subtropical city, Guangzhou, China. Chemosphere 2017, 175, 514–520. [Google Scholar] [CrossRef]
- Lee, S.; Jeong, W.; Kannan, K.; Moon, H.B. Occurrence and exposure assessment of organophosphate flame retardants (OPFRs) through the consumption of drinking water in Korea. Water Res. 2016, 103, 182–188. [Google Scholar] [CrossRef]
- Guo, Y.; Liang, C.; Zeng, M.-X.; Wei, G.-L.; Zeng, L.-X.; Liu, L.-Y.; Zeng, E.Y. An overview of organophosphate esters and their metabolites in humans: Analytical methods, occurrence, and biomonitoring. Sci. Total Environ. 2022, 848, 157669. [Google Scholar] [CrossRef]
- Wan, W.; Zhang, S.; Huang, H.; Wu, T. Occurrence and distribution of organophosphorus esters in soils and wheat plants in a plastic waste treatment area in China. Environ. Pollut. 2016, 214, 349–353. [Google Scholar] [CrossRef] [PubMed]
- Fan, Y.; Zeng, Y.; Huang, Y.-Q.; Guan, Y.-F.; Sun, Y.-X.; Chen, S.-J.; Mai, B.-X. Accumulation and translocation of traditional and novel organophosphate esters and phthalic acid esters in plants during the whole life cycle. Chemosphere 2022, 307, 135670. [Google Scholar] [CrossRef] [PubMed]
- Li, D.; Zhong, Y.; Zhu, X.; Wang, H.; Yang, W.; Deng, Y.; Huang, W.; Peng, P. Reductive degradation of chlorinated organophosphate esters by nanoscale zerovalent iron/cetyltrimethylammonium bromide composites: Reactivity, mechanism and new pathways. Water Res. 2021, 188, 116447. [Google Scholar] [CrossRef] [PubMed]
- Campone, L.; Piccinelli, A.L.; Östman, C.; Rastrelli, L. Determination of organophosphorous flame retardants in fish tissues by matrix solid-phase dispersion and gas chromatography. Anal. Bioanal. Chem. 2010, 397, 799–806. [Google Scholar] [CrossRef]
- Wang, X.; Zhong, W.; Xiao, B.; Liu, Q.; Yang, L.; Covaci, A.; Zhu, L. Bioavailability and biomagnification of organophosphate esters in the food web of Taihu Lake, China: Impacts of chemical properties and metabolism. Environ. Int. 2019, 125, 25–32. [Google Scholar] [CrossRef]
- Jiang, X.; Xie, H.; Chang, X. Effects of halogenated flame retardants and cadmium on the germination and seedling growth of rice. J. Agro-Environ. Sci. 2020, 39, 1460–1469. [Google Scholar]
- Su, Y.H.; Liu, T.; Liang, Y.C. Transport via xylem of trichloroethylene in wheat, corn, and tomato seedlings. J. Hazard. Mater. 2010, 182, 472–476. [Google Scholar] [CrossRef]
- Hyland, K.C.; Blaine, A.C.; Dickenson, E.R.; Higgins, C.P. Accumulation of contaminants of emerging concern in food crops-part 1: Edible strawberries and lettuce grown in reclaimed water. Environ. Toxicol. Chem. 2015, 34, 2213–2221. [Google Scholar] [CrossRef]
- Gao, S.; Kong, Y.; Lv, Y.; Cao, B.; Chen, Z.; Xu, K. Effect of different LED light quality combination on the content of vitamin C, soluble sugar, organic acids, amino acids, antioxidant capacity and mineral elements in green onion (Allium fistulosum L.). Food Res. Int. 2022, 156, 111329. [Google Scholar] [CrossRef]
- Holm, G. Chlorophyll Mutations in Barley. Acta Agric. Scand. 1954, 4, 457–471. [Google Scholar] [CrossRef]
- Yang, X.; Xu, H.; Shao, L.; Li, T.; Wang, Y.; Wang, R. Response of photosynthetic capacity of tomato leaves to different LED light wavelength. Environ. Exp. Bot. 2018, 150, 161–171. [Google Scholar] [CrossRef]
- Riches, M.; Lee, D.; Farmer, D.K. Simultaneous leaf-level measurement of trace gas emissions and photosynthesis with a portable photosynthesis system. Atmos. Meas. Tech. 2020, 13, 4123–4139. [Google Scholar] [CrossRef]
- Liu, X.; Lv, Y.; Gao, S.; Xu, K. Ofloxacin induces etiolation in Welsh onion leaves. Chemosphere 2021, 267, 128918. [Google Scholar] [CrossRef] [PubMed]
- Kramer, D.M.; Johnson, G.; Kiirats, O.; Edwards, G.E. New Fluorescence Parameters for the Determination of QA Redox State and Excitation Energy Fluxes. Photosynthesis Res. 2004, 79, 209–218. [Google Scholar] [CrossRef] [PubMed]
- Heath, R.L.; Packer, L. Photoperoxidation in isolated chloroplasts: I. Kinetics and stoichiometry of fatty acid peroxidation. Arch. Biochem. Biophys. 1968, 125, 189–198. [Google Scholar] [CrossRef]
- Xia, X.; Wang, Y.; Zhou, Y.; Tao, Y.; Mao, W.; Shi, K.; Asami, T.; Chen, Z.; Yu, J. Reactive Oxygen Species Are Involved in Brassinosteroid-Induced Stress Tolerance in Cucumber. Plant Physiol. 2009, 150, 801–814. [Google Scholar] [CrossRef]
- Patterson, B.D.; MacRae, E.A.; Ferguson, I.B. Estimation of hydrogen peroxide in plant extracts using titanium (IV). Anal. Biochem. 1984, 139, 487–492. [Google Scholar] [CrossRef]
- Gong, B.; Miao, L.; Kong, W.; Bai, J.G.; Wang, X.; Wei, M.; Shi, Q. Nitric oxide, as a downstream signal, plays vital role in auxin induced cucumber tolerance to sodic alkaline stress. Plant Physiol. Biochem. 2014, 83, 258–266. [Google Scholar] [CrossRef]
- Yang, L.; Mai, Z.; Zhu, L.; Zhang, L. Comparison and Optimization of Determination Methods of Vitamin C Content in Fruits and Vegetables. J. Anhui Agric. Sci. 2018, 46, 232–236. [Google Scholar] [CrossRef]
- Lin, K.-H.; Huang, M.-Y.; Huang, W.-D.; Hsu, M.-H.; Yang, Z.-W.; Yang, C.-M. The effects of red, blue, and white light-emitting diodes on the growth, development, and edible quality of hydroponically grown lettuce (Lactuca sativa L. var. capitata). Sci. Hortic. 2013, 150, 86–91. [Google Scholar] [CrossRef]
- Li, N.; Zhang, Z.; Gao, S.; Lv, Y.; Chen, Z.; Cao, B.; Xu, K. Different responses of two Chinese cabbage (Brassica rapa L. ssp. pekinensis) cultivars in photosynthetic characteristics and chloroplast ultrastructure to salt and alkali stress. Planta 2021, 254, 102. [Google Scholar] [CrossRef] [PubMed]
- Qin, Z.; Liu, L.-Y.; Stubbings, W.A.; Wang, S. Analysis and subcellular distribution of organophosphate esters (OPEs) in rice tissues. Environ. Sci. Pollut. Res. 2023, 30, 74021–74030. [Google Scholar] [CrossRef] [PubMed]
- Li, X.; Yao, Y.; Chen, H.; Zhang, Q.; Li, C.; Zhao, L.; Guo, S.; Cheng, Z.; Wang, Y.; Wang, L.; et al. Identification of Novel Organophosphate Esters in Hydroponic Lettuces (Lactuca sativa L.): Biotransformation and Acropetal Translocation. Environ. Sci. Technol. 2022, 56, 10699–10709. [Google Scholar] [CrossRef] [PubMed]
- Malhotra, H.; Vandana Sharma, S.; Pandey, R. Phosphorus Nutrition: Plant Growth in Response to Deficiency and Excess. In Plant Nutrients and Abiotic Stress Tolerance; Hasanuzzaman, M., Fujita, M., Oku, H., Nahar, K., Hawrylak-Nowak, B., Eds.; Springer: Singapore, 2018; pp. 171–190. [Google Scholar] [CrossRef]
- Shen, Y.; Li, J.; Gu, R.; Yue, L.; Zhan, X.; Xing, B. Phenanthrene-triggered Chlorosis is caused by elevated Chlorophyll degradation and leaf moisture. Environ. Pollut. 2017, 220, 1311–1321. [Google Scholar] [CrossRef]
- Pattanayak, G.K.; Tripathy, B.C. Overexpression of protochlorophyllide oxidoreductase C regulates oxidative stress in Arabidopsis. PLoS ONE 2011, 6, e26532. [Google Scholar] [CrossRef]
- Zhang, K.M.; Shen, Y.; Zhou, X.Q.; Fang, Y.M.; Liu, Y.; Ma, L.Q. Photosynthetic electron-transfer reactions in the gametophyte of Pteris multifida reveal the presence of allelopathic interference from the invasive plant species Bidens pilosa. J. Photochem. Photobiol. B 2016, 158, 81–88. [Google Scholar] [CrossRef]
- Zeb, B.S.; Hayat, M.T.; Zeb, T.; Khan, F.Y.; Abbasi, H.Z.; Nawaz, I.; Ebadi, A. Uptake of Organic Pollutants and the Effects on Plants. In Sustainable Plant Nutrition under Contaminated Environments; Mahmood, Q., Ed.; Springer International Publishing: Berlin/Heidelberg, Germany, 2022; pp. 209–234. [Google Scholar] [CrossRef]
- Zhang, Y.; Zhang, H.; Sun, X.; Wang, L.; Du, N.; Tao, Y.; Sun, G.; Erinle, K.O.; Wang, P.; Zhou, C.; et al. Effect of dimethyl phthalate (DMP) on germination, antioxidant system, and chloroplast ultrastructure in Cucumis sativus L. Environ. Sci. Pollut. Res. Int. 2016, 23, 1183–1192. [Google Scholar] [CrossRef]
- Wang, W.; Wang, H.; Ren, X.; Zhang, W.; Li, Q. Organophosphate esters uptake, translocation and accumulation in rice (Oryza sativa L.): Impacts of lipid transporters and chemical properties. Environ. Sci. Process. Impacts 2024, 26, 1171–1183. [Google Scholar] [CrossRef]
- Zhang, H.; Chen, J.; Ni, Y.; Zhang, Q.; Zhao, L. Uptake by roots and translocation to shoots of polychlorinated dibenzo-p-dioxins and dibenzofurans in typical crop plants. Chemosphere 2009, 76, 740–746. [Google Scholar] [CrossRef]
- Liu, Q.; He, Q.; Yi, X.; Zhang, J.; Gao, H.; Liu, X. Uptake, accumulation and translocation mechanisms of organophosphate esters in cucumber (Cucumis sativus) following foliar exposure. Sci. Total Environ. 2024, 912, 169462. [Google Scholar] [CrossRef]
- Schreiber, U.; Bilger, W.; Neubauer, C. Chlorophyll fluorescence as a nonintrusive indicator for rapid assessment of in vivo photosynthesis. In Ecophysiology of Photosynthesis; Springer: Berlin/Heidelberg, Germany, 1995; pp. 49–70. [Google Scholar]
- Lichtenthaler, H.K. In Vivo Chlorophyll Fluorescence as a Tool for Stress Detection in Plants; Springer: Dordrecht, The Netherlands, 1988; pp. 129–142. [Google Scholar]
- Lv, Y.; Li, Y.; Liu, X.; Xu, K. The tolerance mechanism and accumulation characteristics of Phragmites australis to sulfamethoxazole and ofloxacin. Chemosphere 2020, 253, 126695. [Google Scholar] [CrossRef] [PubMed]
- Lv, Y.; Li, Y.; Liu, X.; Xu, K. Effect of soil sulfamethoxazole on strawberry (Fragaria ananassa): Growth, health risks and silicon mitigation. Environ. Pollut. 2021, 286, 117321. [Google Scholar] [CrossRef]
- Lv, Y.; Xu, J.; Xu, K.; Liu, X.; Guo, X.; Lu, S.; Xi, B. Accumulation characteristics and biological response of ginger to sulfamethoxazole and ofloxacin. Environ. Pollut. 2020, 262, 114203. [Google Scholar] [CrossRef] [PubMed]
- Li, K.; Geng, Y.; Lin, B.; Xi, Z. Molecular mechanisms underlying mitochondrial damage, endoplasmic reticulum stress, and oxidative stress induced by environmental pollutants. Toxicol. Res. 2023, 12, 1014–1023. [Google Scholar] [CrossRef] [PubMed]
- Li, Z.; Wakao, S.; Fischer, B.B.; Niyogi, K.K. Sensing and responding to excess light. Annu. Rev. Plant Biol. 2009, 60, 239–260. [Google Scholar] [CrossRef]
- Maryam, K.; Abolghasem, J. Challenges on Determination of Malondialdehyde in Plant Samples. Arch. Crop Sci. 2020, 4, 64–66. [Google Scholar] [CrossRef]
- You, J.; Chan, Z. ROS regulation during abiotic stress responses in crop plants. Front. Plant Sci. 2015, 6, 1092. [Google Scholar] [CrossRef]
- Jia, M.; Wang, Y.; Teng, M.; Wang, D.; Yan, J.; Miao, J.; Zhou, Z.; Zhu, W. Toxicity and metabolomics study of isocarbophos in adult zebrafish (Danio rerio). Ecotoxicol. Environ. Saf. 2018, 163, 1–6. [Google Scholar] [CrossRef]
- Wang, L.; Huang, X.; Laserna, A.K.C.; Li, S.F.Y. Metabolomics reveals that tris(1,3-dichloro-2-propyl) phosphate (TDCPP) causes disruption of membrane lipids in microalga Scenedesmus obliquus. Sci. Total Environ. 2020, 708, 134498. [Google Scholar] [CrossRef]
- Atkin, O.K.; Millar, A.H.; Gardeström, P.; Day, D.A. Photosynthesis, Carbohydrate Metabolism and Respiration in Leaves of Higher Plants. In Photosynthesis: Physiology and Metabolism; Leegood, R.C., Sharkey, T.D., von Caemmerer, S., Eds.; Springer: Dordrecht, The Netherlands, 2000; pp. 153–175. [Google Scholar] [CrossRef]
- Wu, B.; Zhu, L.; Le, X.C. Metabolomics analysis of TiO2 nanoparticles induced toxicological effects on rice (Oryza sativa L.). Environ. Pollut. 2017, 230, 302–310. [Google Scholar] [CrossRef]
- Vallarino, J.G.; Osorio, S. Organic Acids. In Postharvest Physiology and Biochemistry of Fruits and Vegetables; Elsevier: Amsterdam, The Netherlands, 2019; pp. 207–224. [Google Scholar] [CrossRef]
- Jurczyk, B.; Rapacz, M.; Pociecha, E.; Kościelniak, J. Changes in carbohydrates triggered by low temperature waterlogging modify photosynthetic acclimation to cold in Festuca pratensis. Environ. Exp. Bot. 2016, 122, 60–67. [Google Scholar] [CrossRef]
Disclaimer/Publisher’s Note: The statements, opinions and data contained in all publications are solely those of the individual author(s) and contributor(s) and not of MDPI and/or the editor(s). MDPI and/or the editor(s) disclaim responsibility for any injury to people or property resulting from any ideas, methods, instructions or products referred to in the content. |
© 2025 by the authors. Licensee MDPI, Basel, Switzerland. This article is an open access article distributed under the terms and conditions of the Creative Commons Attribution (CC BY) license.