Article

Effects of Biochar on the Temporal Dynamics and Vertical Distribution of Iron and Phosphorus Under Soil Submergence

Department of Agricultural Chemistry, National Taiwan University, Taipei 106319, Taiwan
*
Author to whom correspondence should be addressed.
Current address: School of Environment and Natural Resources, Ohio State University, Columbus, OH 43210, USA.
Agronomy 2025, 15(6), 1394; https://doi.org/10.3390/agronomy15061394
Submission received: 25 April 2025 / Revised: 25 May 2025 / Accepted: 4 June 2025 / Published: 5 June 2025
(This article belongs to the Section Soil and Plant Nutrition)

Abstract

:
Biochar is considered a promising amendment for improving phosphorus (P) availability in agricultural soils; however, its effects on the chemical transformation and long-term immobilization of P in submerged soils across soil depth and over time remain unclear. This study conducted a 98-day column incubation experiment to investigate the effects of rice straw biochar (RSB) on the spatial and temporal dynamics of iron (Fe) and P under soil submergence. Soils with and without biochar addition were mixed with water homogeneously and then added into each PVC column with an additional standing water layer above the soil surface. The results revealed a two-stage shift in soil redox potential (Eh), with more rapid changes observed at deeper depths. RSB addition accelerated the decline in Eh and increased the soil pH. The rise in pH by submergence and biochar addition promoted the release of soluble and exchangeable P from soil to pore water during incubation. Ca-associated P precipitation and re-adsorption resulted in relatively low phosphate concentrations in pore water. RSB addition increased P availability in the early stage by releasing soluble and exchangeable P and promoting phosphate desorption through pH elevation, which increased the negative surface charge of soil constituents, thereby reducing their affinity for phosphate and enhancing its release into the pore water. However, prolonged submergence led to the transformation of soluble and exchangeable P into more stable Ca-P precipitates, limiting long-term P availability. These findings provide new insights into the temporal and spatial dynamics of P in submerged soils and highlight the short-term benefits and long-term limitations of biochar for sustaining P availability in paddy rice systems.

1. Introduction

Phosphorus (P) is a primary macronutrient for crop production, yet only a small portion of P fertilizer applied to soils is available for plant uptake due to the strong retention of P by soils. To cope with soil P retention and meet crop P demand, approximately 25 million tons of P from phosphate rock are applied as fertilizers each year to agricultural lands, and 2–3 million tons are applied to rice cultivation systems [1]. Excessive application of P fertilizer has led to the over-accumulation of P in farmland soils, which is referred to as “legacy P” [2]. Soil P accumulation could further increase the risk of P loss through to nearby watersheds, which deteriorates water quality and reduces aquatic production [3]. These one-way routes of P from phosphate rock to the environment are accelerating the depletion of global phosphate reserves [4]. Hence, it is crucial to develop methods to enhance P utilization efficiency in farmlands to conserve the finite phosphate rock resources for achieving agricultural and environmental sustainability.
Rice paddies represent the most extensive human-made submerged soil system globally, potentially playing a significant role in P utilization. During submergence, the replacement of air in soil pores by water leads to oxygen depletion, subsequently prompting a transition from aerobic to anaerobic microbial processes and initiating various redox reactions, particularly Fe reduction [5,6]. The formation of Fe phases, such as carbonate green rust ([FeII6−xFeIIIx(OH)12]x+(CO32−)0.5x·yH2O) and vivianite (Fe3(PO4)2·8H2O), serves as a major phosphorus removal mechanism in anaerobic environments [7,8]. After harvest, when paddy fields are drained, the soils revert to oxic conditions, and reduced species are re-oxidized. This redox transition can result in P dynamics through interaction with the Fe redox cycle [9,10,11]. Inorganic P is often immobilized via sorption to Fe(III) hydroxides or precipitation as Fe(III)-phosphates, particularly in acidic soils [12,13]. Under reducing conditions, Fe(III) phosphate species undergo reductive dissolution, releasing Fe(II) and phosphate into the soil pore water [14,15,16]. The mobilized phosphate may then diffuse to regions with lower P concentration and be re-adsorbed by soil particles or form precipitates such as vivianite (a hydrated Fe(II)-phosphate mineral) [17,18,19]. Conversely, when Fe(II) is re-oxidized to Fe(III) during drying periods, phosphate is removed from the pore water via sorption onto Fe(III) hydroxides and precipitation with Fe(III) [20,21].
In addition to temporal redox fluctuation during rice cultivation, vertical redox stratification develops due to depth-dependent changes in microbial and chemical processes [6,22]. Soil redox potential decreases with depth, resulting in the dominance of Fe(III) and Fe(II) in pore water within the oxic and anoxic zones, respectively [23]. In deeper, strongly reducing layers where sulfate reduction occurs, Fe(II) may precipitate with sulfide to form pyrite (FeS) [9]. These redox-driven reactions result in vertical variations of Fe(III)/Fe(II) in pore water, which further drive Fe diffusion across oxic–anoxic interfaces [6,23,24]. For instance, the upward diffusion of Fe(II) from the anoxic zone to the oxic zone leads to its re-oxidization and subsequent Fe(III)-hydroxide precipitation [24]. Although vertical changes in Fe redox chemistry are likely to affect P solubility, the corresponding vertical distribution and speciation of P in paddy soils remain poorly characterized.
In paddy fields, biochar, derived from rice straw burning or intentionally applied as a soil amendment, could recycle P from crop residues, thereby closing the one-way P route in paddy systems and potentially reducing the need for P fertilization. Biochar application has been shown to increase soil P availability and improve rice growth [25,26]. Biochar exhibits a multifaceted role in regulating P availability through direct and indirect mechanisms. Indirectly, biochar could alter soil physicochemical properties such as liming effects [27,28,29]. The liming effect of biochar is particularly beneficial in acidic soils, where P availability is typically low [30,31]. For instance, rice–straw biochar (RSB) has been reported to increase available P for rice uptake by raising soil pH and promoting P desorption [25,32]. Directly, biochar can influence P availability by sorbing phosphate or interacting with metal cations such as Fe3+, Al3+, and Ca2+ to influence P retention [25,28,29]. In a study, in paddy soil, biochar was found to decrease P solubility by enhancing Fe-P formation [8] whereas an opposite effect on P solubility was attributed to Fe reduction [19]. These contrasting outcomes highlight the complex role of biochar in influencing soil P solubility via concurrent processes. To disentangle these opposing effects, detailed information on P speciation is essential. Moreover, the influence of biochar on the temporal evolution and vertical distribution of P species in submerged soils, especially in relation to Fe redox cycling, remains poorly understood.
This study aimed to investigate the temporal dynamics and vertical distribution of P and their coupling with Fe dynamics in submerged paddy soil columns, with and without biochar amendment. Specifically, biochar addition was hypothesized to accelerate Fe redox processes through enhanced microbial activity and electron donation, leading to more rapid P transformation over time and depth. A soil column incubation experiment was conducted to monitor changes in pore water chemistry over time. Soil P fractionation was analyzed using a sequential extraction method. This work explored how redox processes and biochar amendments regulate P dynamics in paddy soils, offering essential information for enhancing P use efficiency and sustaining rice productivity.

2. Materials and Methods

2.1. Preparation and Characterization of Soil and Biochar

The soil used in this study was collected from the surface (0–20 cm depth) of an Oxisol (Typic Kandiudox) located at Taoyuan City, Taiwan (24.93 °N, 121.21 °E). The soil had a pH of 5.5 and a soil texture of ‘clay’, with 19% sand, 17% silt, and 64% clay. Prior to use, the soil was air-dried and ground to pass through a 10-mesh screen.
Rice straw (Oryza sativa L. cv. Taiken 9) was oven-dried at 50 °C for 2 h and pyrolyzed at 600 °C for 1 h in a muffle furnace to produce RSB. The biochar was ground, passed through a 100-mesh sieve, and stored for subsequent use. While this particle size may have been finer than in typical field applications, it facilitates consistent distribution in the soil columns and minimizes variation due to particle size. This approach enhances experimental reproducibility while allowing the investigation of biochar–soil interactions.
The pH of the soil and biochar samples was measured with a solid-to-water ratio of 1:1 using a pH meter (C3010 Multiparameter Analyzer, Consort bvba, Turnhout, Belgium) equipped with a combined glass electrode. Carbon, hydrogen, oxygen, nitrogen, and sulfur contents in the biochar were determined with an elemental analyzer (FLASH 2000 CHNS/O Analyzer, Thermo Fisher Scientific Inc., Waltham, MA, USA). The pseudo-contents of Al, Ca, Fe, Mg, Mn, and P were determined using inductively coupled plasma atomic emission spectrometry (ICP-AES; Optima 8000, PerkinElmer Inc., Waltham, MA, USA) following microwave digestion with aqua regia. Free and amorphous Al, Fe, and Mn oxides in the soil sample were extracted using the citrate–bicarbonate–dithionite method and the ammonium–oxalate method, respectively, and analyzed with ICP-AES [33]. All the analyses were conducted in triplicate.

2.2. Soil Column Incubation Experiment

The column incubation experiment was performed with two treatments: soil with biochar (PB) and without biochar (CK). For the PB treatment, 240 g of soil was mixed with 12 g of biochar and 150 mL of 0.5 g L−1 glucose solution to accelerate soil reduction [34]. The CK treatment was prepared similarly, without the biochar. All the soil slurries were loaded into PVC columns (6 cm in diameter and 30 cm in height) and then 30 mL of de-ionized water was added to each column to establish a standing water layer above the soil surface. A total of 30 columns were prepared for each treatment. Three platinum electrodes were inserted into each column at 3, 9, and 15 cm from the soil surface, and an Ag/AgCl reference electrode was placed at the soil surface. Soil redox potentials (Eh) were monitored every 24 h for the first 30 days and subsequently every 3 days until the end of the 98-day incubation period.
During incubation, three columns were randomly selected from each treatment on Days 0, 7, 14, 21, 28, 42, 56, 70, 84, and 98, immediately frozen at −20 °C, and then sectioned into 3 cm intervals using a precision bench-top cutting machine (CL50, Sunway Scientific Corp., Taipei, Taiwan). The sections containing the ice of standing water were discarded. Each soil section was transferred to a 250 mL centrifuge tube, flushed with nitrogen gas for 5 min, and sealed with a cap. After the soil sections were thawed completely, they were centrifuged at 11,500 rpm (CR21GII High-Speed Refrigerated Centrifuge, Hitachi Koki Co., Ltd., Tokyo, Japan) for 10 min to collect the supernatants and residual solids. The supernatants were passed through 0.45 µm PTFE syringe filters to collect the filtrates for the analyses of pH and the concentrations of Fe(II) and phosphate. Solid residues in the centrifuge tubes were freeze-dried (FD12-D Freeze Dryer, Kingmech Co., Ltd., Taichung, Taiwan), passed through a 100-mesh sieve, and used for sequential P extraction.

2.3. Chemical Analyses of Soil Pore Water

Soil solution pH was measured using a pH analyzer (C3010 Multiparameter Analyzer, Consort bvba, Turnhout, Belgium) with a combined glass electrode. Fe(II) concentration was determined by mixing 2 mL of soil solution with 0.4 mL of 10% (w/w) hydroxylammonium chloride, 0.8 mL of 5 M ammonium acetate, and 0.4 mL of 1,10-phenanthroline. After a 10 min reaction, absorbance was measured at 510 nm using a UV-VIS spectrophotometer (Specord 50 Plus, Analytik Jena GmbH+Co. KG, Jena, Germany). Phosphate concentration was analyzed using the molybdenum blue colorimetric method, with absorbance measured at 660 nm on the same spectrophotometer using a 5 cm path-length cuvette [35].

2.4. Sequential Extraction for Soil P Fractionation

Soil P fractionation analysis followed the Hedley sequential extraction method [36]. In each 40 mL centrifuge tube, 0.2 g of soil was sequentially extracted using 30 mL each of de-ionized water, 0.5 M NaHCO3 solution, 0.1 M NaOH solution, and 1 M HCl solution with shaking at 150 rpm for 16 h. After each extraction step, the samples were centrifuged at 18,500 rpm for 10 min and the supernatants were filtered through a 0.45 µm syringe filter to collect the filtrates. The filtrates were analyzed for phosphate concentration using the molybdenum blue method [35]. This sequential fractionation classified soil P into Water-P (soluble), NaHCO3-P (exchangeable), NaOH-P (Fe/Al-bound), and HCl-P (Ca-bound) fractions. Soluble and exchangeable P fractions are readily available pools for plant uptake (i.e., labile P) while Fe/Al-bound and Ca-bound P fractions are less available for plant uptake.

2.5. Statistical Analysis

Statistical analyses were performed using the OriginPro 2021 software (OriginLab Corp., Northampton, MA, USA). Treatment effects were evaluated using one-way analysis of variance (ANOVA), and means were compared using Tukey’s post hoc test at a significance level of p < 0.05.

3. Results

3.1. Characteristics of Soil and Biochar

The chemical compositions of the soil and RSB are presented in Table 1. The pseudo-total P contents of the soil and RSB were 0.49 and 3.41 g kg−1, respectively. For the PB treatment, the soil was amended with RSB at a biochar-to-soil ratio of 1:20. Accordingly, the weighted-average P content of the mixture was calculated to be 0.63 g kg−1, of which RSB contributed 0.14 g kg−1, accounting for approximately 22% of the total.
Among the major cations, the soil exhibited high pseudo-total contents of Al (67.1 g kg−1) and Fe (40.9 g kg−1), with lower levels of Ca (0.87 g kg−1) and Mg (2.23 g kg−1), consistent with the characteristics of Oxisols. In contrast to the soil, RSB was enriched in Ca (9.86 g kg−1) and Mg (3.72 g kg−1), with considerably lower contents of Al (0.76 g kg−1) and Fe (0.44 g kg−1). The elemental compositions of the original rice straw and RSB are shown in Table 2. The pyrolysis process increased the C content from 39.4% in rice straw to 56.6% in RSB, accompanied by a substantial loss of O and H.
The contents of free (Fed and Ald) and amorphous (Feo and Alo) oxides in the soil were 30.65 and 5.87 g kg−1 and 3.16 and 1.46 g kg−1, respectively (Table 1). The high Fed/Feo and Ald/Alo ratios were indicative of well-weathered Oxisol characteristics. In contrast, the contents of free and amorphous Fe and Al oxides in RSB were one to two orders of magnitude lower than those in the soil (Table 1). Thus, their contributions to the total oxide content in the PB treatment were considered negligible.

3.2. Temporal Dynamics of Soil Redox Potential at Different Depths

Figure 1a illustrates the changes in redox potential (Eh) at different depths in the CK and PB treatments during incubation. The initial Eh values in the CK treatment were +320 (CK3), +226 (CK9), and +208 mV (CK15) while those in the PB treatment were slightly lower due to biochar addition: +312 (PB3), +214 (PB9), and +195 mV (PB15). In both treatments, Eh decreased with an increasing soil depth.
During incubation, soil Eh exhibited a two-stage transition from oxic to anoxic conditions in both treatments (Figure 1a). In the case of CK3, Eh declined from +320 to +117 mV from Day 0 to Day 7 and then fluctuated slightly between +123 and +109 mV until Day 22. A sharp rapid followed, reaching −147 mV by Day 30 and then stabilizing between −147 and −164 mV for the remainder of the incubation period. Comparatively, Eh in CK15 exhibited more dramatic changes during incubation. Eh dropped from +208 to +180 mV by Day 3, then gradually to +8 mV by Day 9. A rapid reduction occurred between Day 9 and Day 11, with Eh reaching −147 mV; afterward, Eh remained stable between −150 and −164 mV. CK9 exhibited an intermediate trend: Eh decreased gradually from +226 to +79 mV by Day 15, followed by a sharp decline between Days 15 and 17, and then stabilized at values close to those of CK3 and CK15.
The PB treatment exhibited similar two-stage redox transitions but with lower Eh values and a more pronounced and rapid shift compared to the CK treatment (Figure 1a). At the same depths, the onset of rapid reduction occurred earlier in the PB than in the CK treatment: Day 22–27 (PB3), Day 11–13 (PB9), and Day 3–7 (PB15). The Eh values in the final stage in the PB columns were −262 to −265 mV, lower than those in the CK treatment (Figure 1a). Overall, biochar addition markedly accelerated redox transition and lower Eh values throughout the incubation period (p < 0.05).

3.3. Temporal Dynamics of Pore-Water pH at Different Depths

The initial pH values of the CK treatment increased with depth, ranging from 5.8 (CK0–3) to 6.5 (CK12–15). In the PB treatment, initial pH values ranged from 7.5 (PB0–3) to 8.4 (PB12–15) (Figure 1b). These depth-dependent pH patterns in both treatments were associated with corresponding changes in soil redox potential. The significantly elevated pH values observed in the PB treatment compared to the CK counterparts were attributed to the alkalinity of RSB (Figure 1b).
Over the first 28 days of incubation, soil pH at all depths in both treatments gradually increased and reached a plateau (Figure 1b). The increase was more pronounced in the CK treatment than in the PB treatment. After 98 days, the final pH values ranged from 6.8 to 7.5 in the CK columns and from 8.5 to 8.9 in the PB columns, reflecting the persistent effect of biochar addition on soil pH (Figure 1b).

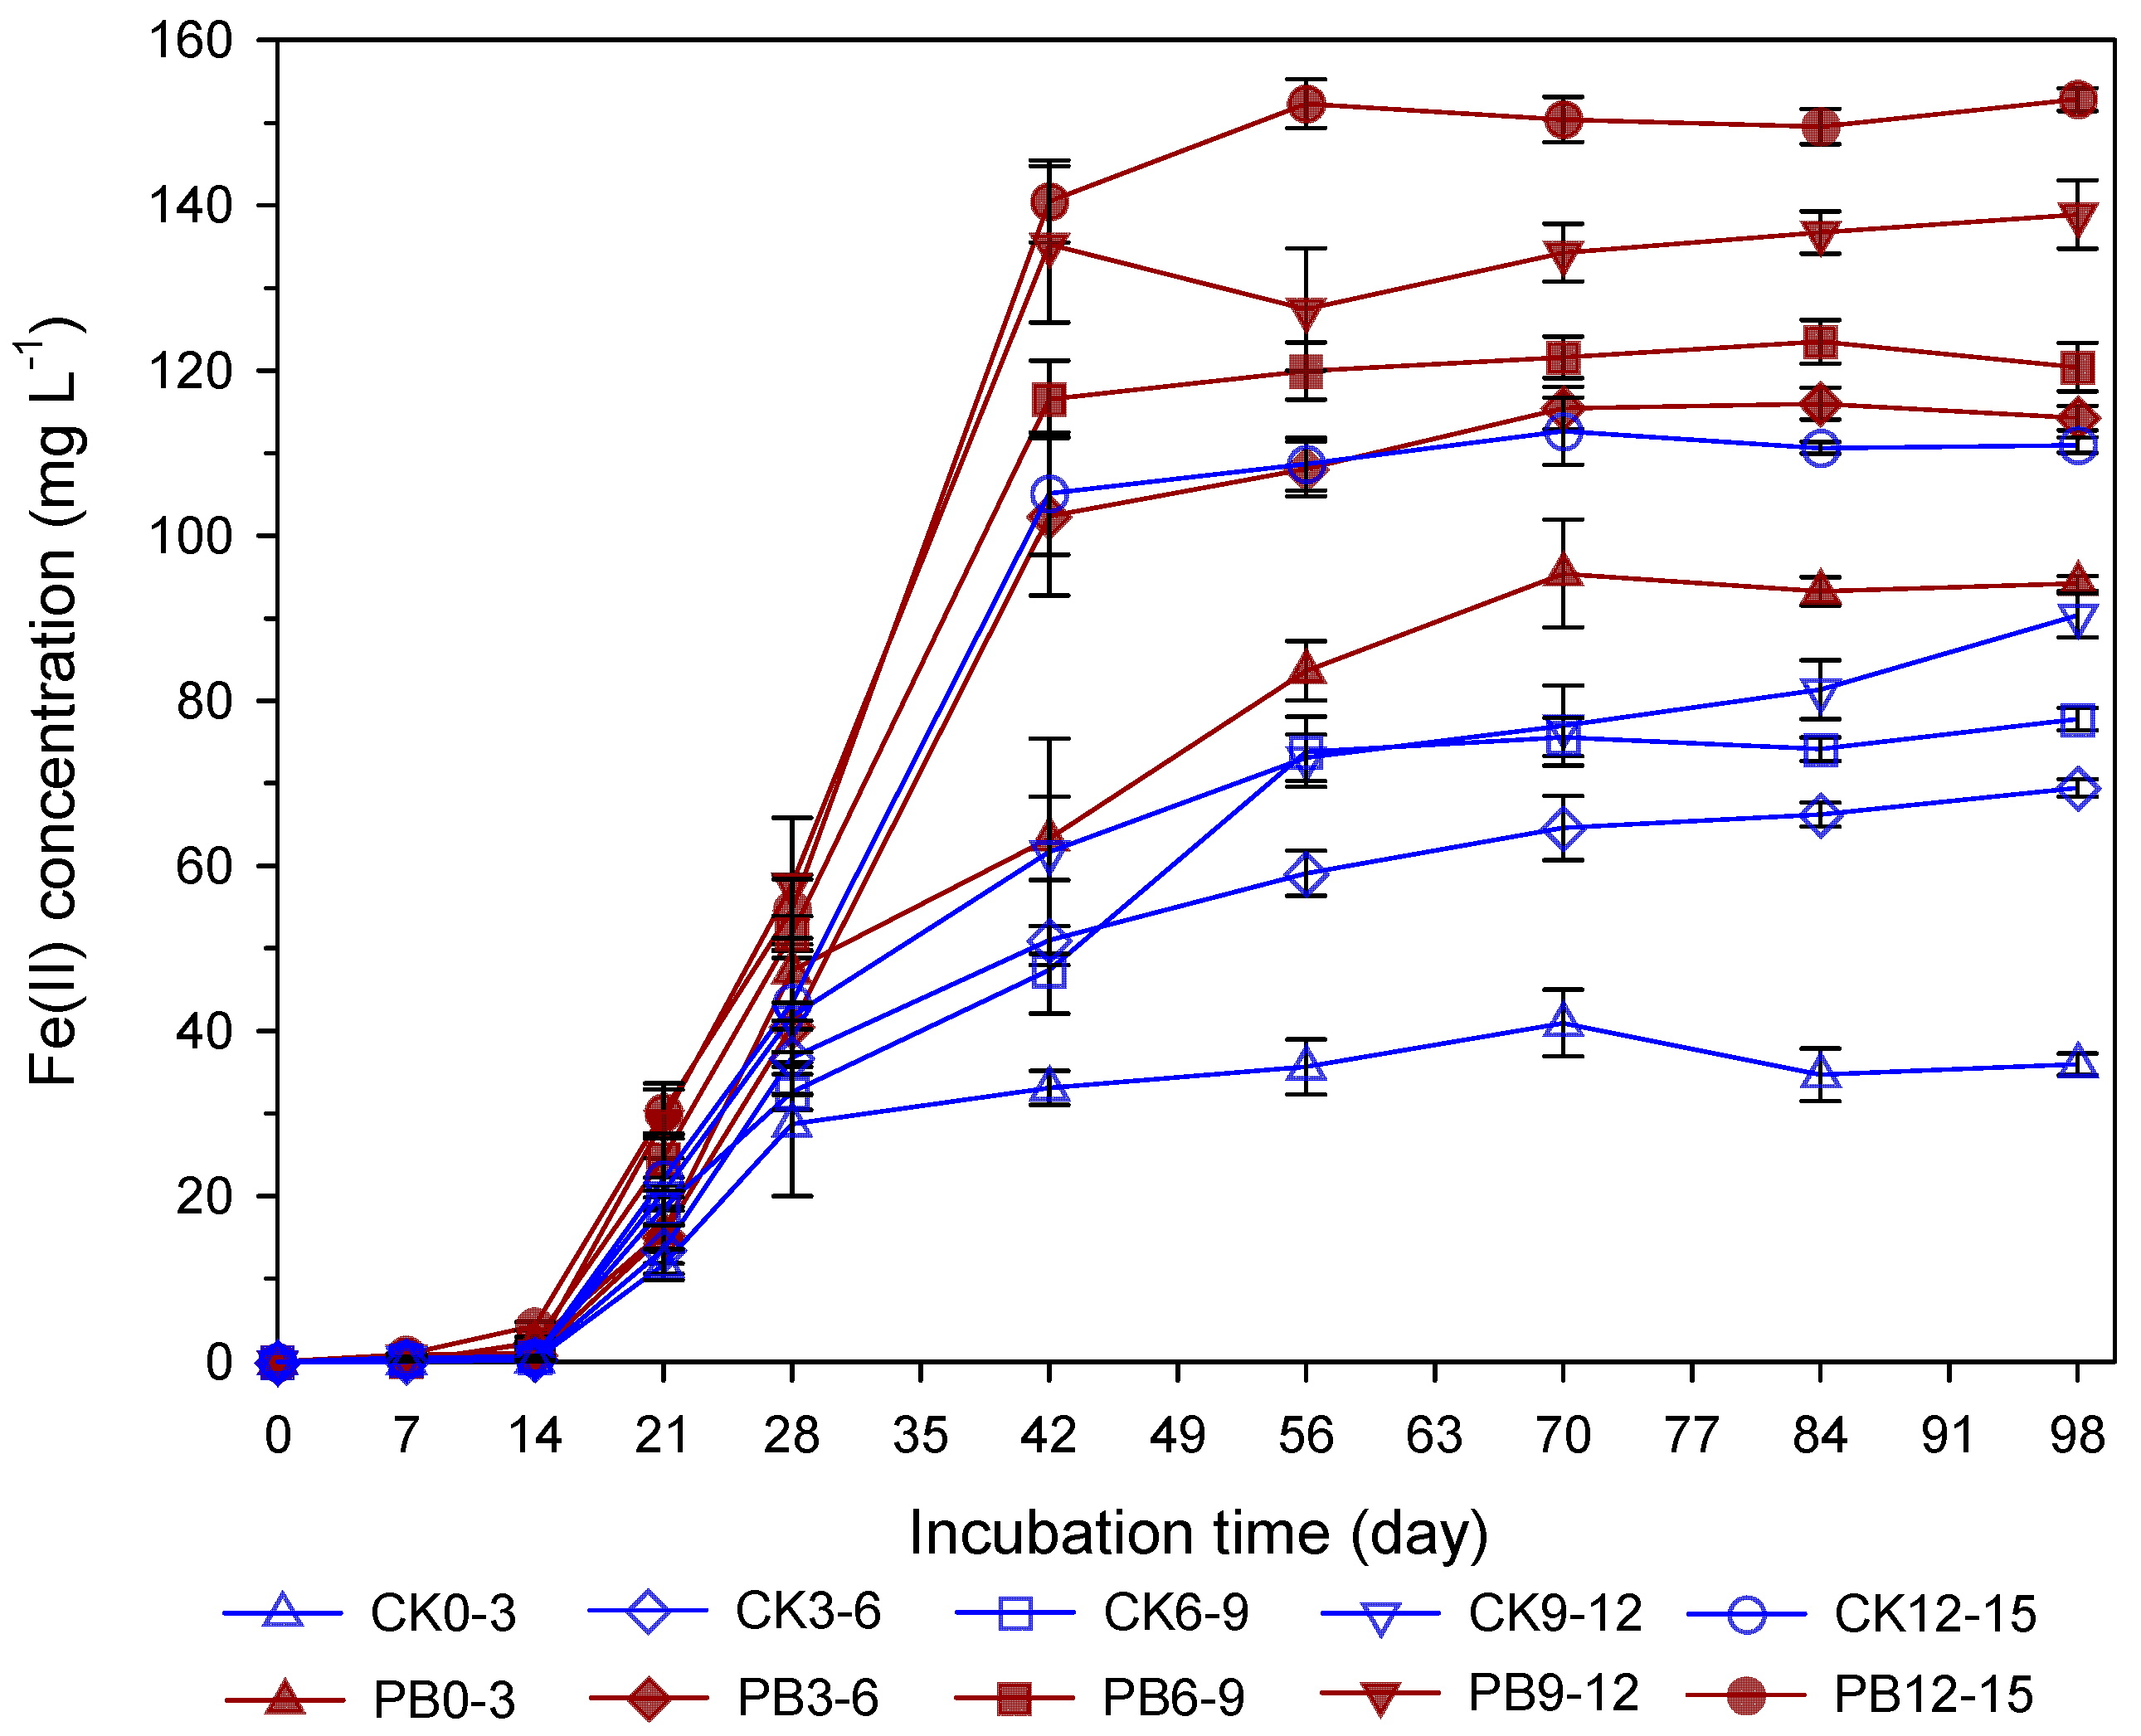
3.4. Temporal Dynamics of Pore-Water Fe(II) Concentration at Different Depths

Figure 2 shows the temporal changes in Fe(II) concentrations in pore-water samples collected at various depths from the CK and PB treatments. Following submergence, both treatments exhibited similar trends in Fe(II) concentration changes, though the magnitude varied with soil depth and biochar addition. Overall, Fe(II) concentrations increased gradually during the first 14 days, followed by a sharp rise between Day 14 and Day 42. Thereafter, the concentrations reached a plateau and remained relatively stable until the end of the incubation. On Day 98, the Fe(II) concentrations were 36.0, 69.4, 77.8, 90.4, and 111.0 mg L−1 for CK0–3, CK3–6, CK6–9, CK9–12, and CK12–15, respectively. In comparison, the corresponding Fe(II) concentrations in the PB treatment were 94.2, 114.3, 1220.4, 138.9, and 152.8 mg L−1 (Figure 2). In both treatments, Fe(II) concentrations increased with depth and were significantly higher in the PB treatment than in the CK treatment (p < 0.05).
Notably, the sharp increases in Fe(II) concentration from Day 14 to Day 42 were more pronounced at greater depths in both treatments (Figure 2). The enhancement of Fe(III) reduction in the PB treatment indicates that biochar addition not only accelerated the onset of Fe(III) reduction but also increased the extent of Fe(II) released to pore water, particularly in deeper soil layers.

3.5. Temporal Dynamics of Pore-Water Phosphate Concentration at Different Depths

Phosphate concentrations in pore-water samples collected from different depths in the CK and PB treatments generally increased with the incubation time and reached a plateau around Day 70 (Figure 3). However, the concentrations remained within a narrow range of 0.053–0.074 mg L−1. As a result, differences among depths within the same treatment were not always statistically significant at individual time points, likely due to variability among replicates and the analytical resolution of the measurement method. Nevertheless, phosphate concentrations in the PB treatment were consistently higher than those in the CK treatment across all depths and time points. For instance, on Day 98, phosphate concentrations at PB0–3 and PB12–15 were 0.064 and 0.074 mg L−1, respectively, compared to 0.060 and 0.053 mg L−1 in the corresponding CK samples. These results indicate that biochar addition significantly enhanced phosphate availability in the pore water (p < 0.05), with the effect observed across all soil depths.

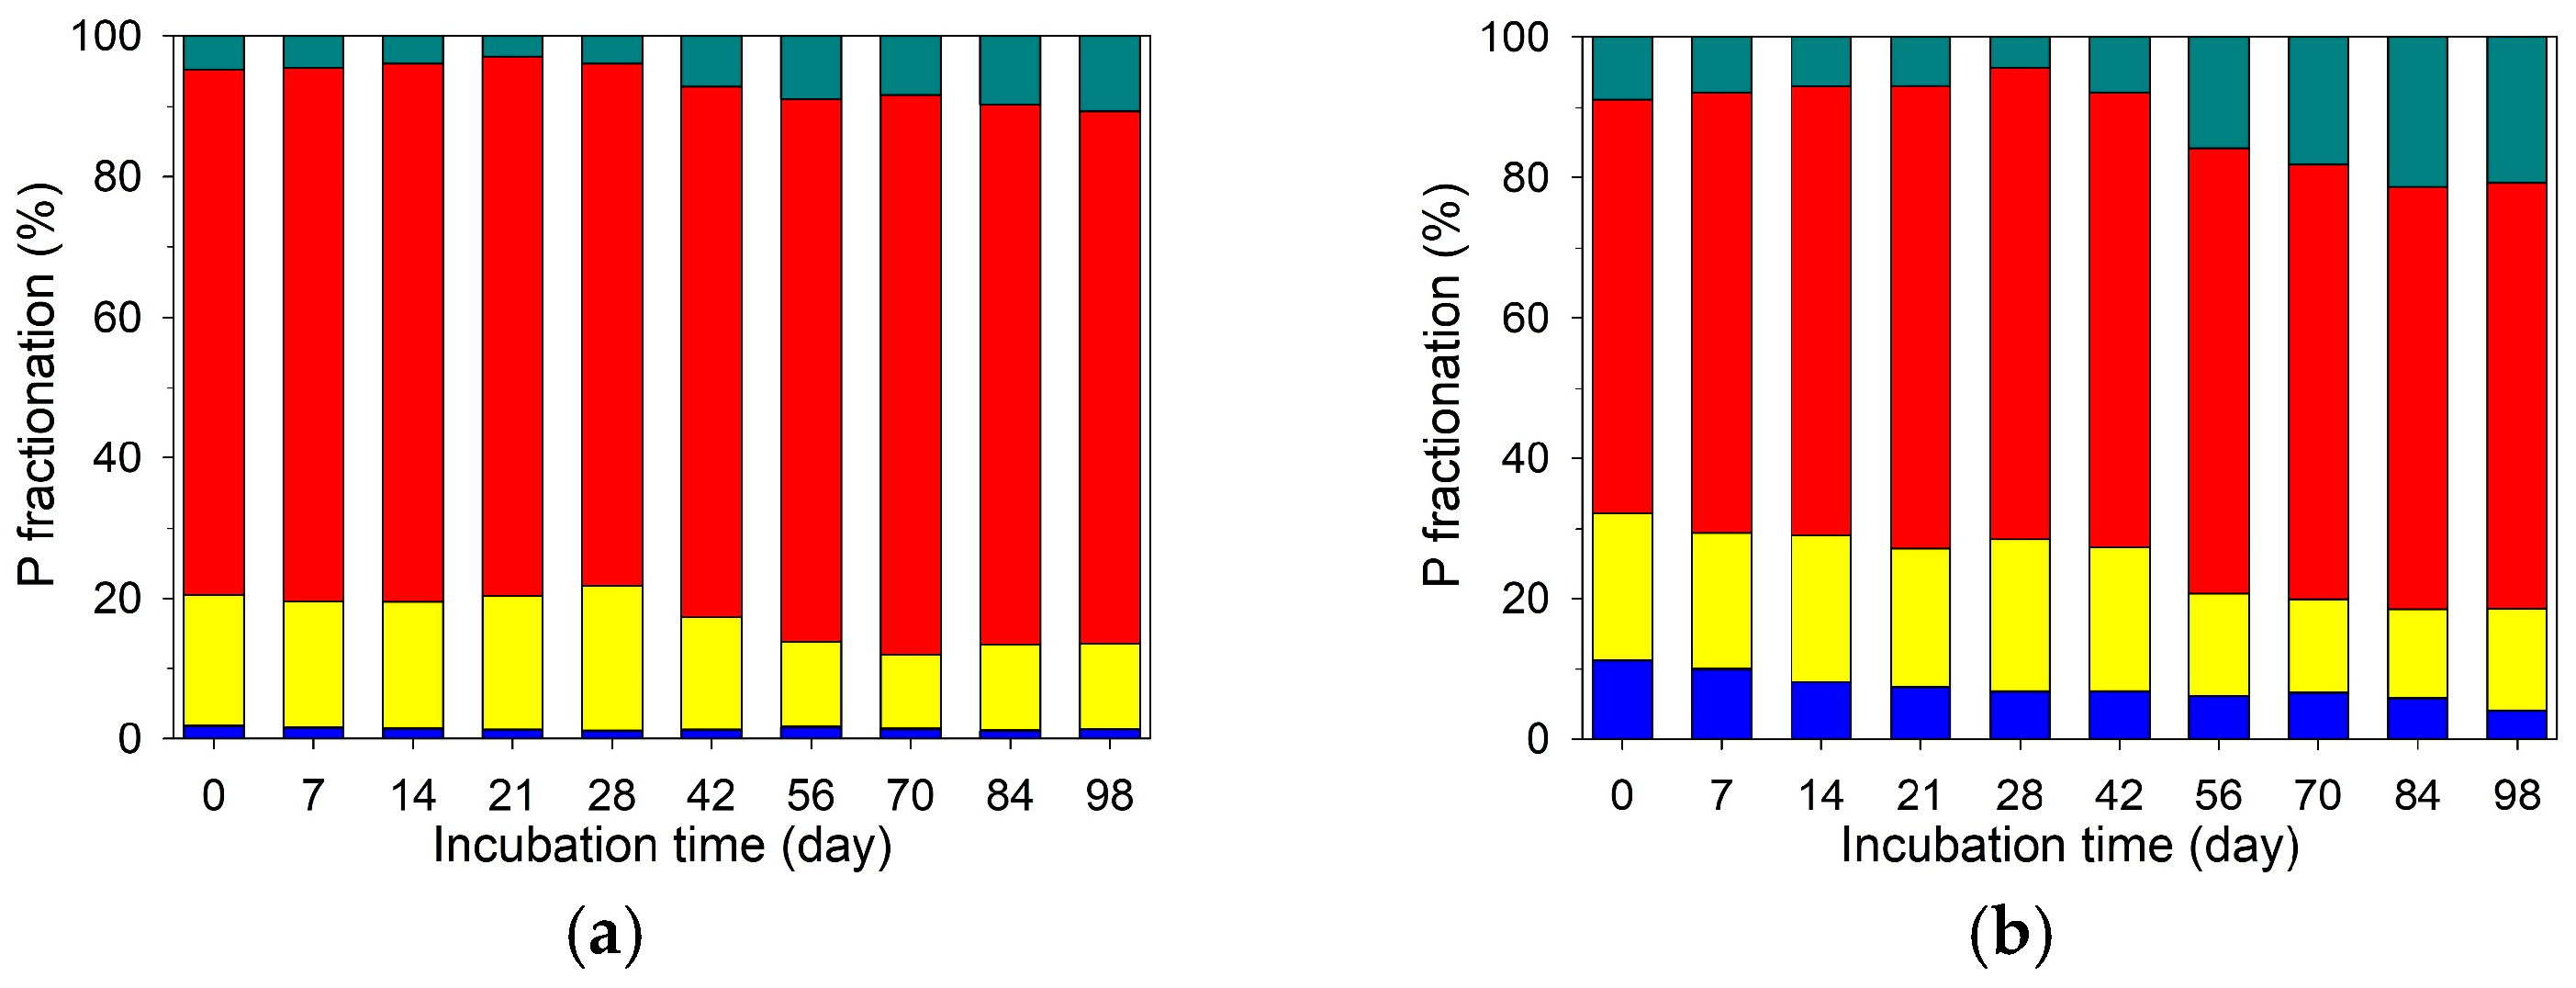
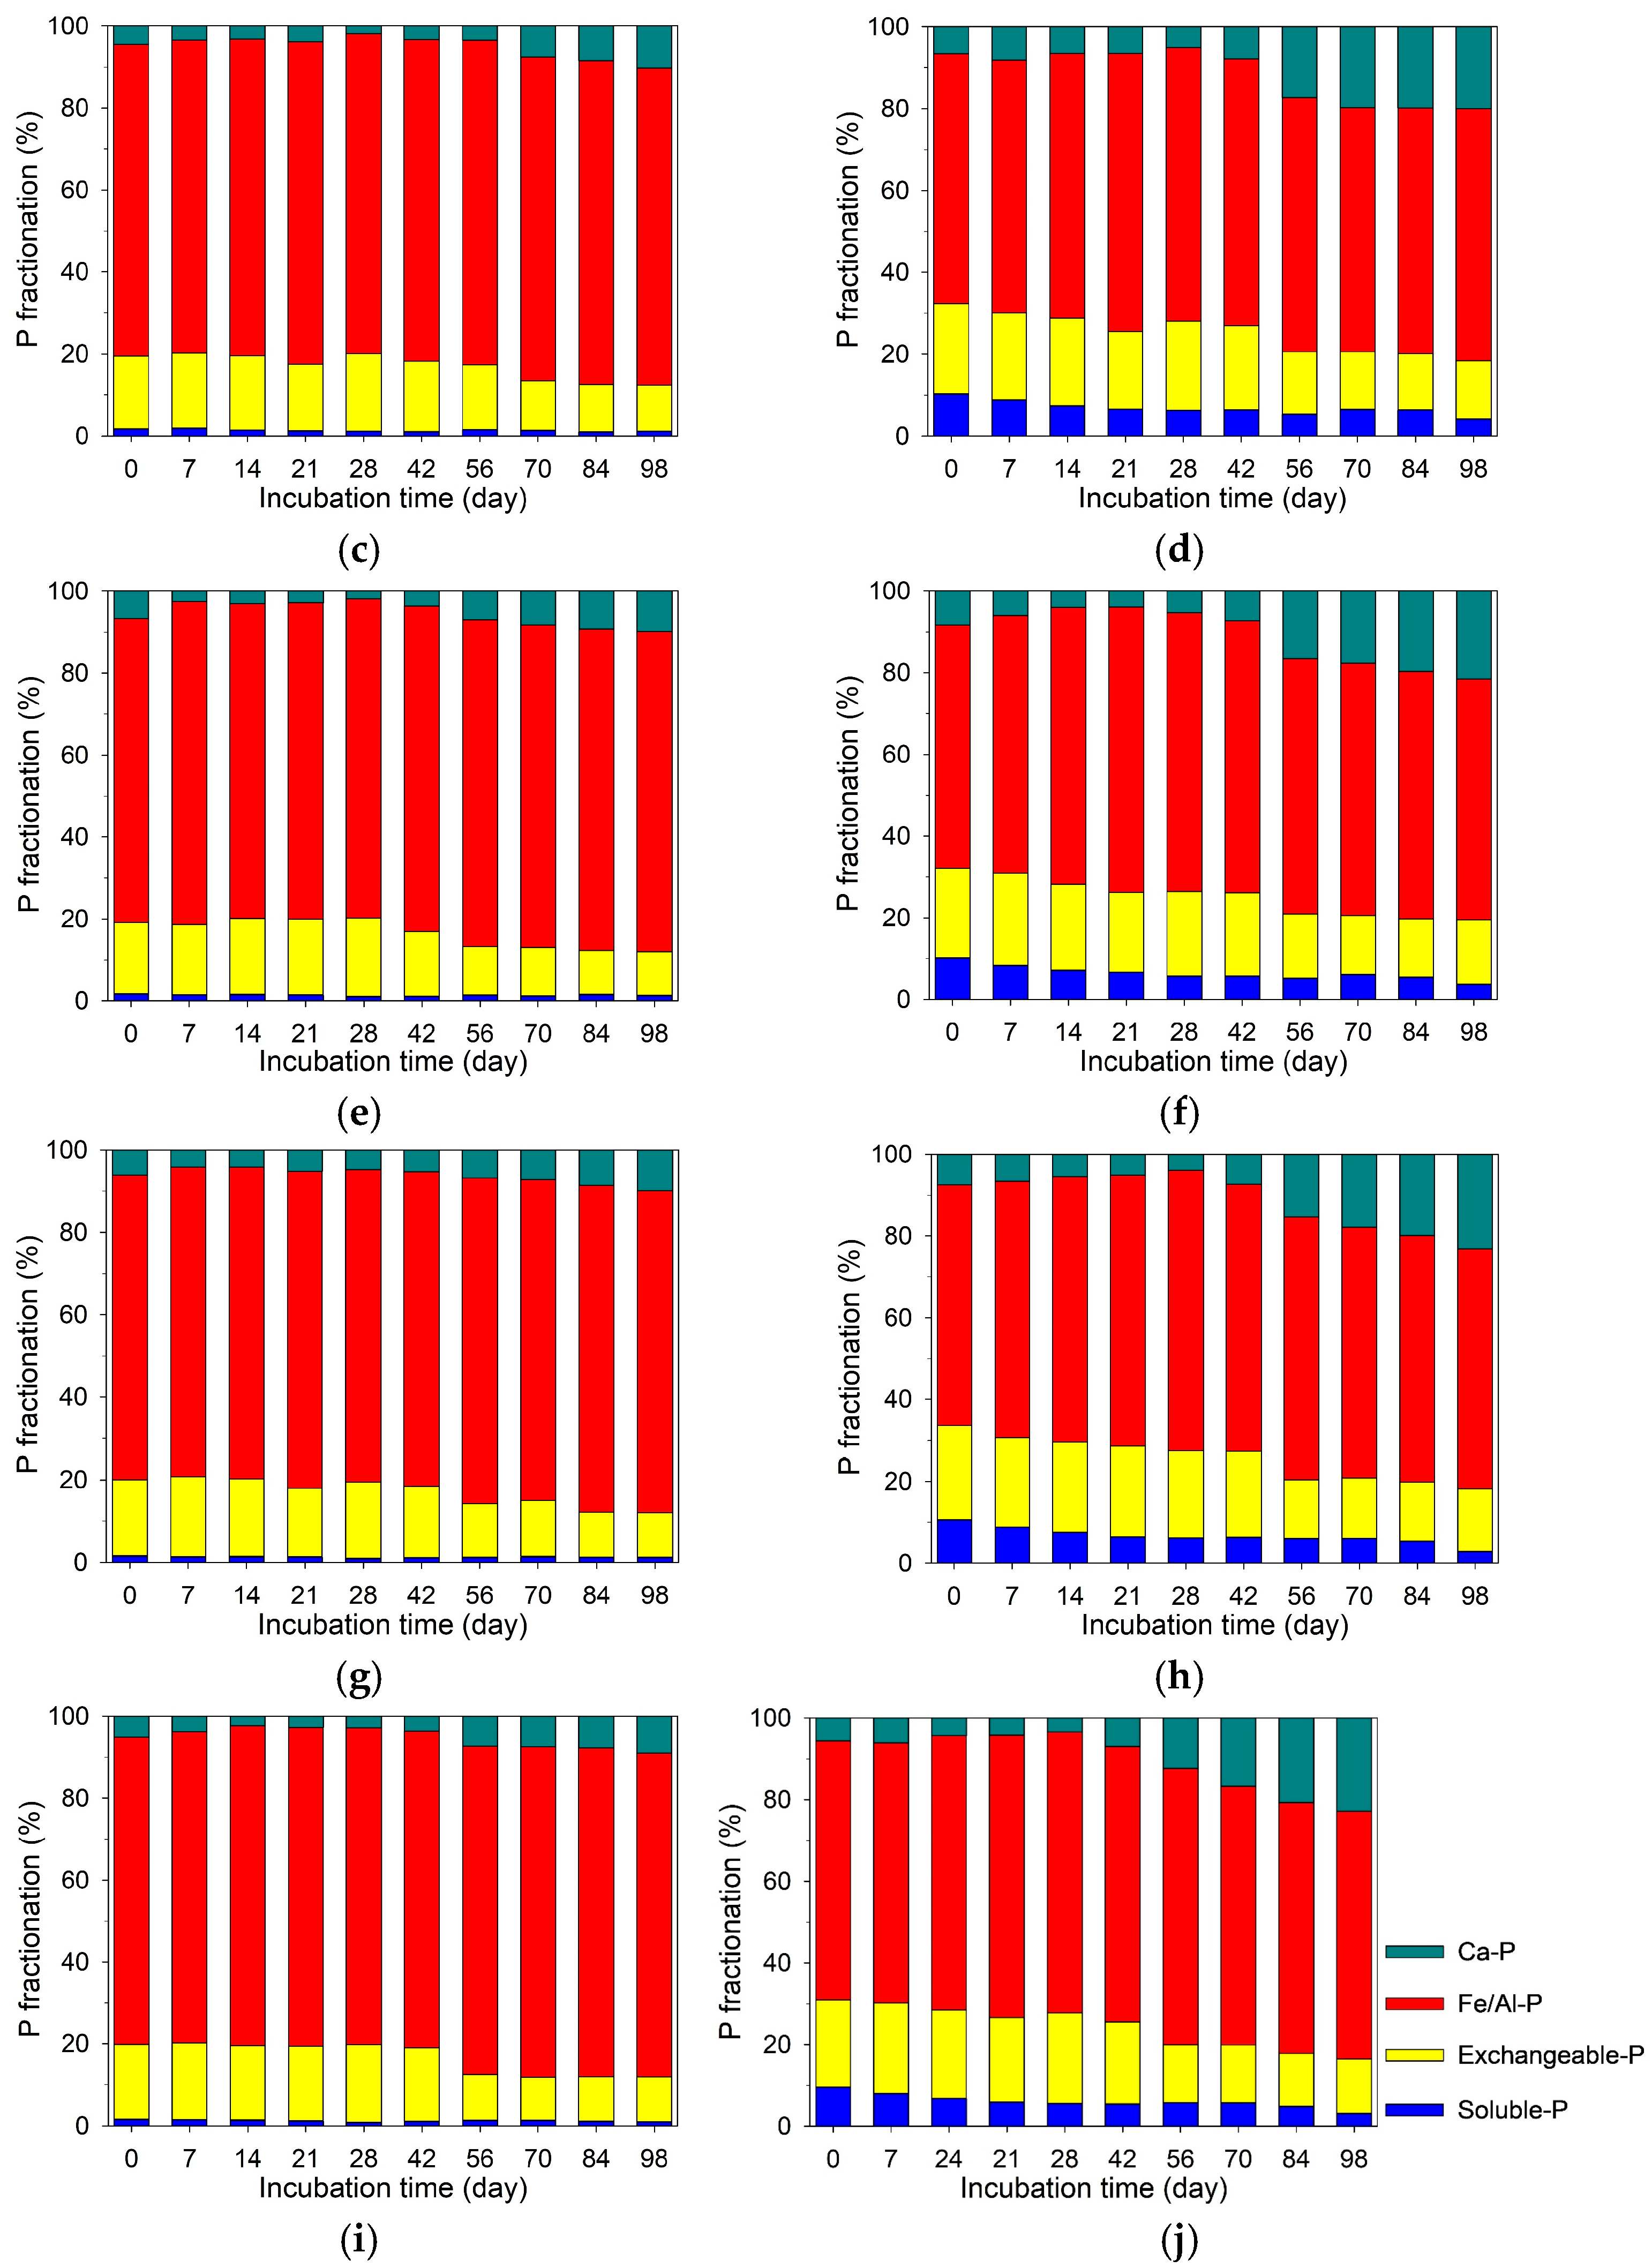
3.6. Temporal Variations in Soil P Fractionation at Different Depths

Table 3 presents the P fractionation of the original soil and RSB. In the soil, the most predominant P fraction was Fe/Al-bound P (183.4 mg kg−1; 75%), followed by exchangeable P (43.8 mg kg−1; 18%), Ca-bound P (12.3 mg kg−1; 5%), and soluble P (4.4 mg kg−1; 2%) (Table 3 and Figure 4). Comparatively, the P fractions in RSB were predominantly soluble P (1233 mg kg−1; 41%), exchangeable P (1054 mg kg−1; 35%), and Ca-bound P (694.6 mg kg−1; 23%) while Fe/Al-bound P was only 1% (22.8 mg kg−1) (Table 3). Accordingly, in the PB treatment, biochar addition contributed primarily to the soluble P, exchangeable P, and Ca-bound P fractions while its contribution to the Fe/Al-bound P fraction was negligible. Thus, the Fe/Al-bound P fraction in the PB treatment was primarily contributed by the original soil. In both treatments, Fe/Al-bound P and exchangeable P were the dominant P fractions, with biochar addition significantly increasing the proportions of soluble and Ca-bound P (Figure 4).
Across all depths within each treatment, no statistically significant differences (p < 0.05) were observed for any P fraction. This was attributed to the analytical sensitivity of the sequential extraction method. Therefore, the temporal trends of P fractions described below reflect general depth-averaged behavior.
In the CK treatment, the proportion of soluble P remained low (<2%) throughout incubation, with minimal temporal variation (Figure 4a–e). In contrast, the PB treatment exhibited a gradual decrease in soluble P from 10–11% on Day 0 to 3–4% on Day 98 (Figure 4f–j). The exchangeable P fraction decreased over time in both treatments, with a more pronounced decline in the PB treatment. Specifically, exchangeable P declined from 17–19% to 11–12% in the CK treatment and from 21–23% to 13–16% in the PB treatment. The most notable decrease occurred between Days 42 and 56 in both treatments. The Ca-bound P fraction in both treatments insignificantly varied from Day 0 to Day 42, markedly increased between Days 42 and 56, and remained stable after Day 56 to the end of the incubation period. For Fe/Al-bound P, the CK treatment exhibited minimal temporal change overall, except for the CK9–12 and CK12–15 depths, where the proportion increased from 74–75% on Day 0 to 79–80% on Day 98. In contrast, the PB treatment showed more dynamic changes. For instance, the Fe/Al-bound P fraction in PB0–3 increased from 59% on Day 0 to 67% on Day 28, then declined to 65% on Day 42, and further to 60% on Day 98.

4. Discussion

4.1. Effects of Biochar on Temporal Dynamics of Soil pH and Eh at Different Depths During Soil Submergence

Figure 1 illustrates the temporal dynamics of soil redox potential (Eh) and pH at various depths under submerged conditions. Upon submergence, Eh in the surface layers of both treatments rapidly declined from the initial values of +320 mV (CK3) and +312 mV (PB3) to below 200 mV within 7 days (Figure 1a), primarily due to oxygen depletion caused by microbial respiration [5,6]. This decline in Eh occurred even more rapidly in deeper soil layers, likely due to the enhanced transition of microbial activity from aerobic to anaerobic respiration (Figure 1a). As anaerobic conditions prevailed over incubation time, reductive processes progressively occurred [5,6]. Consequently, soil Eh decreased to approximately −150 mV in the CK treatment and −260 mV in the PB treatment. Accordingly, the rate and extent of soil reduction were greater at deeper depths in both CK and PB treatments due to enhanced microbial activities. These redox shifts were accompanied by a gradual increase in soil pH in both treatments, attributed to proton consumption during reduction reactions, such as the reduction of Fe(III), Mn(IV) and nitrate [5,6]. As soil depth increased, more pronounced soil reduction rates led to a faster increase in soil pH.
The addition of RSB significantly altered soil pH and Eh dynamics in the PB treatment compared to the CK treatment (Figure 1). Biochar is known to exert a liming effect due to its alkalinity, which is derived from its content of base cations such as Ca and Mg [37]. In this study, the RSB used was produced at 600 °C and contained high levels of Ca (9.86 g kg1) and Mg (3.72 g kg1), contributing to a consistently higher soil pH in the PB treatment compared to the CK treatment (Figure 1b). In terms of redox potential, the initial Eh values in the PB treatment (i.e., PB3, PB9, PB15) were significantly lower than the CK counterparts, indicating that RSB addition enhanced the reduction intensity in submerged soils (Figure 1a). Biochar could act as a dynamic modulator of redox conditions in submerged soils by influencing the balance of microbial and chemical redox reactions [38]. This is supported by the results shown in Figure 2, where RSB addition enhanced soil Fe reduction, leading to higher rates of Fe(II) release to pore water. Such enhancement was consistent with previous findings that attributed enhanced Fe reduction by biochar to the dissolved organic carbon in biochar, acting as an electron donor and shuttle and responsible for the reducing capacity of biochar [39,40].

4.2. Effects of Biochar on Temporal Dynamics of Fe at Different Depths During Soil Submergence

In submerged soil, the reduction of Fe(III) to Fe(II) was the crucial reaction in the Fe cycle and had a significant influence on the transformation and distribution of P species in soils [9,10,16]. Because Fe(III) is more abundant than other potential electron acceptors, it serves as a major electron acceptor under anaerobic conditions [5,6]. A rapid increase in Fe(II) concentrations began around Day 14 (Figure 2). In both treatments, Fe(II) concentrations increased with soil depth, corresponding to the progressive decline in soil Eh with soil depth. Meanwhile, Fe(II) concentrations in the PB treatment at each depth and time point were consistently higher than in the CK counterparts (Figure 2). This indicated that RSB enhanced Fe reduction during incubation. Under anaerobic conditions, biochar can act as an electron donor and shuttle between microorganisms and Fe(III) complexes, thereby promoting the reduction of Fe(III) [39,40]. In addition, the higher pH levels induced by biochar amendment may further promote Fe reduction as Fe-reducing microorganisms tend to be more active at higher pHs [41,42].
It is noteworthy that the amount of Fe(III) reduced to Fe(II) and released into pore water remained substantially lower than the total Fe(III) present as Fe oxides. As shown in Table 1, the contents of Fed and Feo in the soil were 30.65 and 3.16 g kg−1, respectively. The total water volume in each column was 180 mL. The highest Fe(II) concentration in pore water in both treatments was 153 mg L−1, observed in the PB12-15 sample on Day 98 (Figure 2). Assuming this Fe(II) originated from the reductive dissolution of Fe(III) oxides, the equivalent amount of Fe(III) reduced and released into pore water was estimated to be 0.115 g kg−1, which was one to two orders of magnitude lower than Feo and Fed. Although a portion of Fe(II) might have been re-adsorbed by soil constituents during incubation, soil Fe oxides were far from completely dissolved on Day 98 since the Fe(II) concentrations varied in different samples, and the systems likely did not reach a steady state or equilibrium condition. Given that soil Fe oxides exist in various phases with differing reactivities, their reduction kinetics could vary significantly [43,44]. Less stable Fe oxides are reduced first, which explains the rapid increase in Fe(II) concentrations between Days 14 and 42 (Figure 2). In contrast, more crystalline or resistant Fe oxides are reduced at much slower rates over prolonged incubation [44]. Thus, the small variation in Fe(II) concentrations from Days 42 to 98 may be attributed to this slow, continued reduction of more stable Fe(III) phases (Figure 2), even after the Eh value reached approximately constant at −150 mV in the CK treatment and −260 mV in the PB treatment (Figure 1a). Moreover, this may also explain why Fe(II) concentrations in pore water were higher in deeper soils and with biochar addition despite similar Eh values in each treatment in the final stage of incubation. Since the slow reduction of Fe oxides continued, the rate and extent of Fe reduction increased with soil depths and RSB addition before reaching complete dissolution of Fe oxides or leveling off at a constant value indicative of an equilibrium or steady-state condition.

4.3. Effects of Biochar on Temporal Dynamics of P at Different Depths During Soil Submergence

Phosphate concentrations in pore water increased gradually during submergence in both CK and PB treatments (Figure 3). While this trend is commonly attributed to the reductive dissolution of Fe(III)-bound P [14,15,16], our results suggest otherwise. Although Fe/Al-bound P was the most dominant fraction in the soils and susceptible to reductive conditions, it remained largely unchanged throughout the incubation period (Figure 4), indicating limited contribution from Fe-bound P to the pore water P pool. Instead, the primary sources of released phosphate appeared to be the soluble and exchangeable P fractions. In both treatments, the most notable change was the decrease in exchangeable P (NaHCO3-extracted P), dropping from 17–19% to 11–12% in the CK treatment and from 21–23% to 13–16% in the PB treatment (Figure 4). Meanwhile, in the PB treatment, the soluble P, solely contributed by RSB, decreased from 10–11% to 3–4%. These changes in soil P fractionation suggest that P release to pore water was primarily due to desorption from biochar and soil surfaces. When soil pH was low at the earlier incubation stage, phosphate adsorption on Al/Fe oxides may have occurred to restrict phosphate concentration in pore water [12,13,45]. The desorption was enhanced by rising soil pH due to submergence in both treatment and RSB addition in the PB treatment (Figure 1b). As soil pH increases, negative surface charges on RSB and soil increase, consequently enhancing the desorption of phosphate anions, i.e., H2PO4 and HPO42− [12,46].
Despite these changes, the actual quantities of released P in pore water were small relative to the total soil P (Table 1). For example, on Day 98, mean P concentrations in pore water in the CK and PB treatments were 0.058 and 0.065 mg L−1, respectively, corresponding to 0.044 and 0.049 mg kg−1 soil, less than 10−4 of the total soil P (Table 1). This suggests that the released P was the net outcome of desorption/dissolution and re-adsorption/re-precipitation. After incubation, Ca-bound P increased in both treatments (Figure 4), indicating that this fraction may act as a major sink for released P. Meanwhile, Fe oxides remained largely intact under prolonged submergence, serving as potential sites to re-adsorb phosphate released into pore water [12,13]. Although sequential P fractionation did not directly identify Fe phosphate minerals (e.g., strengite FeIIIPO4·2H2O or vivianite FeII3(PO4)2·8H2O), their occurrences in the systems could not be completely ruled out. These immobilization reactions may have resulted in small quantities of P being released into pore water, consequently leading to insignificant variations along soil depth.
RSB addition contributed directly to phosphate availability through its intrinsic contents of soluble and exchangeable P (Table 3), especially in the early incubation stage (Figure 4). Furthermore, biochar addition also raised pH to a more alkaline level throughout the incubation process (Figure 1b), leading to higher levels of released phosphate in pore water in the PB treatment compared to the CK treatment (Figure 1b) [25,32]. However, this elevated soil pH (Figure 1b), along with the high Ca content in RSB (Table 1), also favored the formation of Ca-bound P (Figure 4). Phosphate reacted with Ca2+ to form insoluble Ca-P minerals, ultimately reducing P availability [28,29]. This was corroborated by the decreases in soluble and exchangeable P fractions and the increase in the Ca-bound P fraction in both treatments after submergence incubation (Figure 4).
Additionally, the low phosphate concentrations (0.053–0.074 mg L−1) in pore water are particularly noteworthy given that critical solution P concentrations for optimal plant growth typically range from 0.2 to 0.3 mg L1 in acidic soils (Figure 4). This suggests that while biochar addition increases phosphate availability, the absolute concentrations in soil pore water remained below agronomically optimal levels. The limited magnitude of increase may be attributed to strong P fixation mechanisms still operating in the acidic soil system, even under reducing conditions. Also, it is worth noting that these solution P concentrations represent only the immediately available phosphate pool and may not fully reflect the dynamic equilibrium between solid and solution phases that maintains P supply to plants over longer periods.

5. Conclusions

This study systematically examined the effects of RSB on soil redox processes and P dynamics at different soil depths under submergence. The concentrations of Fe(II) and P in pore water, pH, and Eh varied with soil depth and time. In the early stages, RSB enhanced P availability by releasing labile forms of P (soluble and exchangeable P) and elevating soil pH, promoting phosphate desorption from soil and biochar surfaces. The rise in pH was driven by soil submergence, as well as by the liming effects and accelerated reduction reactions induced by RSB. Despite enhanced initial availability, prolonged incubation caused the transformation of labile P into Ca-bound P, a process further enhanced by RSB addition under elevated pH. Re-adsorption and precipitation reactions likely resulted in the relatively low concentrations of P in pore water below agronomically optimal levels. The 98-day incubation period was sufficient to mimic flooded rice-growing conditions (~3 months), during which biochar improved P availability primarily in the early phase. Thus, while RSB serves as an effective amendment for alleviating P deficiency in acidic soils, its long-term benefit is constrained by the formation of stable, less-available P forms. The sustainable management of soil P in biochar-amended systems may, therefore, require complementary strategies to maintain P availability throughout the rice-growing season.
Based on the findings, a multifaceted approach for practical P management in biochar-amended paddy systems was recommended. Farmers may consider split applications of biochar, with an initial application before flooding and a potential mid-season supplement to maintain P availability. Additionally, the co-application of biochar with conventional P fertilizers at reduced rates, timed with key rice growth stages, may offer a more sustainable and efficient approach. In acidic soils, the initial rate of biochar application could be optimized based on soil pH, with in-season monitoring of soil P status to guide adaptive management. These recommendations aim to maximize the early-stage benefits of biochar while addressing its long-term limitations in P availability management. Field validation or longer-term mesocosm studies are needed to confirm these trends under real-world conditions.

Author Contributions

Conceptualization, Y.-R.L.; methodology, Y.-R.L.; formal analysis, Y.-R.L.; investigation, Y.-R.L.; resources, S.-L.W.; data curation, S.-L.W.; writing—original draft preparation, Y.-R.L.; writing—review and editing, S.-L.W.; visualization, Y.-R.L.; supervision, S.-L.W.; project administration, S.-L.W.; funding acquisition, S.-L.W. All authors have read and agreed to the published version of the manuscript.

Funding

The work was financially supported by the National Science and Technology Council of Taiwan (Grant No: 108-2813-C-002-174-B and 112-2313-B-002-030-MY3).

Data Availability Statement

The original contributions presented in the study are included in the article. Further inquiries can be directed to the corresponding author.

Acknowledgments

The authors are grateful to Hsiu-Yen Chang and Emily Karen Kin for their assistance with the experiments.

Conflicts of Interest

The authors declare no conflicts of interest.

References

  1. Luo, X.; Elrys, A.S.; Zhang, L.; Ibrahim, M.M.; Liu, Y.; Fu, S.; Yan, J.; Ye, Q.; Wen, D.; Hou, E. The global fate of inorganic phosphorus fertilizers added to terrestrial ecosystems. One Earth 2024, 7, 1402–1413. [Google Scholar] [CrossRef]
  2. Doydora, S.; Gatiboni, L.; Grieger, K.; Hesterberg, D.; Jones, J.L.; McLamore, E.S.; Peters, R.; Sozzani, R.; Van den Broeck, L.; Duckworth, O.W. Accessing legacy phosphorus in soils. Soil Syst. 2020, 4, 74. [Google Scholar] [CrossRef]
  3. Yuan, Z.; Jiang, S.; Sheng, H.; Liu, X.; Hua, H.; Liu, X.; Zhang, Y. Human perturbation of the global phosphorus cycle: Changes and consequences. Environ. Sci. Technol. 2018, 52, 2438–2450. [Google Scholar] [CrossRef] [PubMed]
  4. Brownlie, W.J.; Sutton, M.A.; Reay, D.S.; Heal, K.V.; Hermann, L.; Kabbe, C.; Spears, B.M. Global actions for a sustainable phosphorus future. Nat. Food 2021, 2, 71–74. [Google Scholar] [CrossRef]
  5. Kögel-Knabner, I.; Amelung, W.; Cao, Z.; Fiedler, S.; Frenzel, P.; Jahn, R.; Kalbitz, K.; Kölbl, A.; Schloter, M. Biogeochemistry of paddy soils. Geoderma 2010, 157, 1–14. [Google Scholar] [CrossRef]
  6. Zhang, Z.; Furman, A. Soil redox dynamics under dynamic hydrologic regimes—A review. Sci. Total Environ. 2021, 763, 143026. [Google Scholar] [CrossRef]
  7. Kukkadapu, R.K.; Zachara, J.M.; Fredrickson, J.K.; Kennedy, D.W. Biotransformation of two-line silica-ferrihydrite by a dissimilatory Fe (III)-reducing bacterium: Formation of carbonate green rust in the presence of phosphate. Geochim. Cosmochim. Acta 2004, 68, 2799–2814. [Google Scholar] [CrossRef]
  8. Jia, R.; Qu, Z.; You, P.; Qu, D. Effect of biochar on photosynthetic microorganism growth and iron cycling in paddy soil under different phosphate levels. Sci. Total Environ. 2018, 612, 223–230. [Google Scholar] [CrossRef]
  9. Li, Y.C.; Yu, S.; Strong, J.; Wang, H.L. Are the biogeochemical cycles of carbon, nitrogen, sulfur, and phosphorus driven by the “Fe-III-Fe-II redox wheel” in dynamic redox environments? J. Soils Sediments 2012, 12, 683–693. [Google Scholar] [CrossRef]
  10. Wang, C.; Thielemann, L.; Dippold, M.A.; Guggenberger, G.; Kuzyakov, Y.; Banfield, C.C.; Ge, T.; Guenther, S.; Bork, P.; Horn, M.A.; et al. Can the reductive dissolution of ferric iron in paddy soils compensate phosphorus limitation of rice plants and microorganisms? Soil Biol. Biochem. 2022, 168, 108653. [Google Scholar] [CrossRef]
  11. Schulz, K.; Wisawapipat, W.; Barmettler, K.; Grigg, A.R.C.; Kubeneck, L.J.; Notini, L.; ThomasArrigo, L.K.; Kretzschmar, R. Iron Oxyhydroxide Transformation in a Flooded Rice Paddy Field and the Effect of Adsorbed Phosphate. Environ. Sci. Technol. 2024, 58, 10601–10610. [Google Scholar] [CrossRef] [PubMed]
  12. Gérard, F. Clay minerals, iron/aluminum oxides, and their contribution to phosphate sorption in soils—A myth revisited. Geoderma 2016, 262, 213–226. [Google Scholar] [CrossRef]
  13. Koch, M.; Kruse, J.; Eichler-Löbermann, B.; Zimmer, D.; Willbold, S.; Leinweber, P.; Siebers, N. Phosphorus stocks and speciation in soil profiles of a long-term fertilizer experiment: Evidence from sequential fractionation, P K-edge XANES, and 31P NMR spectroscopy. Geoderma 2018, 316, 115–126. [Google Scholar] [CrossRef]
  14. Willett, I. The reductive dissolution of phosphated ferrihydrite and strengite. Soil Res. 1985, 23, 237–244. [Google Scholar] [CrossRef]
  15. Scalenghe, R.; Edwards, A.C.; Ajmone Marsan, F.; Barberis, E. The effect of reducing conditions on the solubility of phosphorus in a diverse range of European agricultural soils. Eur. J. Soil Sci. 2002, 53, 439–447. [Google Scholar] [CrossRef]
  16. Martinengo, S.; Schiavon, M.; Santoro, V.; Said-Pullicino, D.; Romani, M.; Miniotti, E.F.; Celi, L.; Martin, M. Assessing phosphorus availability in paddy soils: The importance of integrating soil tests and plant responses. Biol. Fertil. Soils 2023, 59, 391–405. [Google Scholar] [CrossRef]
  17. Nanzyo, M.; Onodera, H.; Hasegawa, E.; Ito, K.; Kanno, H. Formation and dissolution of vivianite in paddy field soil. Soil Sci. Soc. Am. J. 2013, 77, 1452–1459. [Google Scholar] [CrossRef]
  18. Arai, Y.; Sparks, D.L. Phosphate Reaction Dynamics in Soils and Soil Components: A Multiscale Approach. Adv. Agron. 2007, 94, 135–179. [Google Scholar]
  19. Wisawapipat, W.; Charoensri, K.; Runglerttrakoolchai, J. Solid-phase speciation and solubility of phosphorus in an acid sulfate paddy soil during soil reduction and reoxidation as affected by oil palm ash and biochar. J. Agric. Food Chem. 2017, 65, 704–710. [Google Scholar] [CrossRef]
  20. Santoro, V.; Martin, M.; Persson, P.; Lerda, C.; Said-Pullicino, D.; Magnacca, G.; Celi, L. Inorganic and organic P retention by coprecipitation during ferrous iron oxidation. Geoderma 2019, 348, 168–180. [Google Scholar] [CrossRef]
  21. Heiberg, L.; Pedersen, T.V.; Jensen, H.S.; Kjaergaard, C.; Hansen, H.C.B. A Comparative study of phosphate sorption in lowland soils under oxic and anoxic conditions. J. Environ. Qual. 2010, 39, 734–743. [Google Scholar] [CrossRef] [PubMed]
  22. Liesack, W.; Schnell, S.; Revsbech, P. Microbiology of flooded rice paddies. FEMS Microbiol. Rev. 2000, 24, 625–645. [Google Scholar] [CrossRef] [PubMed]
  23. Ratering, S.; Schnell, S. Localization of iron-reducing activity in paddy soil by profile studies. Biogeochemistry 2000, 48, 341–365. [Google Scholar] [CrossRef]
  24. Qi, Y.H.; Cheng, W.; Nan, X.Y.; Yang, F.; Li, J.; Li, D.C.; Lundstrom, C.C.; Yu, H.M.; Zhang, G.L.; Huang, F. Iron stable isotopes in bulk soil and sequential extracted fractions trace Fe redox cycling in paddy soils. J. Agric. Food Chem. 2020, 68, 8143–8150. [Google Scholar] [CrossRef]
  25. Xu, M.; Gao, P.; Yang, Z.; Su, L.; Yang, G.; Zhang, X.; Ma, J.; Peng, H.; Xiao, Y. Biochar impacts on phosphorus cycling in rice ecosystem. Chemosphere 2019, 225, 311–319. [Google Scholar] [CrossRef]
  26. Bagheri Novair, S.; Cheraghi, M.; Faramarzi, F.; Asgari Lajayer, B.; Senapathi, V.; Astatkie, T.; Price, G.W. Reviewing the role of biochar in paddy soils: An agricultural and environmental perspective. Ecotoxicol. Environ. Saf. 2023, 263, 115228. [Google Scholar] [CrossRef]
  27. Zhang, L.; Chang, L.; Liu, H.; de Jesús Puy Alquiza, M.; Li, Y. Biochar application to soils can regulate soil phosphorus availability: A review. Biochar 2025, 7, 13. [Google Scholar] [CrossRef]
  28. Shi, Y.; Yu, Y.; Chang, E.; Wang, R.; Hong, Z.; Cui, J.; Zhang, F.; Jiang, J.; Xu, R. Effect of biochar incorporation on phosphorus supplementation and availability in soil: A review. J. Soils Sediments 2023, 23, 672–686. [Google Scholar] [CrossRef]
  29. Yang, L.; Wu, Y.; Wang, Y.; An, W.; Jin, J.; Sun, K.; Wang, X. Effects of biochar addition on the abundance, speciation, availability, and leaching loss of soil phosphorus. Sci. Total Environ. 2021, 758, 143657. [Google Scholar] [CrossRef]
  30. Chintala, R.; Mollinedo, J.; Schumacher, T.E.; Malo, D.D.; Julson, J.L. Effect of biochar on chemical properties of acidic soil. Arch. Agron. Soil Sci. 2014, 60, 393–404. [Google Scholar] [CrossRef]
  31. Haynes, R.J. Effects of liming on phosphate availability in acid soils. Plant Soil 1982, 68, 289–308. [Google Scholar] [CrossRef]
  32. Zhang, Y.; Chen, H.; Xiang, J.; Xiong, J.; Wang, Y.; Wang, Z.; Zhang, Y. Effect of rice-straw biochar application on the acquisition of rhizosphere phosphorus in acidified paddy soil. Agronomy 2022, 12, 1556. [Google Scholar] [CrossRef]
  33. Jackson, M.L.; Lim, C.H.; Zelazny, L.W. Oxides, hydroxides, and aluminosilicates. In Methods of Soil Analysis. Part 1. Physical and Mineralogical Methods, 2nd ed.; Klute, A., Ed.; Soil Science Society of America: Madison, WI, USA, 1986; pp. 101–150. [Google Scholar]
  34. Lovley, D.R.; Phillips, E.J.P. Requirement for a microbial consortium to completely oxidize glucose in Fe(III)-reducing Sediments. Appl. Environ. Microbiol. 1989, 55, 3234–3236. [Google Scholar] [CrossRef] [PubMed]
  35. Nagul, E.A.; McKelvie, I.D.; Worsfold, P.; Kolev, S.D. The molybdenum blue reaction for the determination of orthophosphate revisited: Opening the black box. Anal. Chim. Acta 2015, 890, 60–82. [Google Scholar] [CrossRef]
  36. Hedley, M.J.; Stewart, J.W.B.; Chauhan, B.S. Changes in inorganic and organic soil phosphorus fractions induced by cultivation practices and by laboratory incubations. Soil Sci. Soc. Am. J. 1982, 46, 970–976. [Google Scholar] [CrossRef]
  37. Bolan, N.; Sarmah, A.K.; Bordoloi, S.; Bolan, S.; Padhye, L.P.; Van Zwieten, L.; Sooriyakumar, P.; Khan, B.A.; Ahmad, M.; Solaiman, Z.M.; et al. Soil acidification and the liming potential of biochar. Environ. Pollut. 2023, 317, 120632. [Google Scholar] [CrossRef]
  38. Joseph, S.; Husson, O.; Graber, E.R.; Van Zwieten, L.; Taherymoosavi, S.; Thomas, T.; Nielsen, S.; Ye, J.; Pan, G.; Chia, C.; et al. The electrochemical properties of biochars and how they affect soil redox properties and processes. Agronomy 2015, 5, 322–340. [Google Scholar] [CrossRef]
  39. Graber, E.; Tsechansky, L.; Lew, B.; Cohen, E. Reducing capacity of water extracts of biochars and their solubilization of soil Mn and Fe. Eur. J. Soil Sci. 2014, 65, 162–172. [Google Scholar] [CrossRef]
  40. Jia, R.; Li, L.; Qu, D.; Mi, N. Enhanced iron(III) reduction following amendment of paddy soils with biochar and glucose modified biochar. Environ. Sci. Pollut. Res. 2018, 25, 91–103. [Google Scholar] [CrossRef]
  41. Jia, R.; Fan, F.; Li, L.; Qu, D. Temporal response of bacterial community associated Fe(III) reduction to initial pH shift of paddy soils. Agronomy 2022, 12, 1304. [Google Scholar] [CrossRef]
  42. Jia, R.; Li, L.-N.; Qu, D. pH shift-mediated dehydrogenation and hydrogen production are responsible for microbial iron(III) reduction in submerged paddy soils. J. Soils Sediments 2015, 15, 1178–1190. [Google Scholar] [CrossRef]
  43. Munch, J.C.; Hillebrand, T.; Ottow, J.C.G. Transformations in the Feo/Fed ratio of pedogenic iron oxides affected by iron-reducing bacteria. Can. J. Soil Sci. 1978, 58, 475–486. [Google Scholar] [CrossRef]
  44. Brennan, E.W.; Lindsay, W.L. Reduction and oxidation effect on the solubility and transformation of iron oxides. Soil Sci. Soc. Am. J. 1998, 62, 930–937. [Google Scholar] [CrossRef]
  45. Chen, A.; Arai, Y. A review of the reactivity of phosphatase controlled by clays and clay minerals: Implications for understanding phosphorus mineralization in soils. Clay. Clay Miner. 2023, 71, 119–142. [Google Scholar] [CrossRef]
  46. Barrow, N.J. The effects of pH on phosphate uptake from the soil. Plant Soil 2017, 410, 401–410. [Google Scholar] [CrossRef]
Figure 1. Temporal dynamics of (a) Eh and (b) pH at different soil depths in treatments without (CK) and with (PB) rice–straw biochar. The numbers in the legend (e.g., CK6 and CK3–6) indicate the soil depth (6 cm) for Eh measurements and the depth interval (3–6 cm) for pH measurements, respectively.
Agronomy 15 01394 g001
Figure 2. Temporal dynamics of pore-water Fe(II) concentration at different soil depth intervals in the treatments without (CK) and with (PB) rice–straw biochar. Data represent the means of three replicates, and error bars indicate standard deviations. The numbers in the legend indicate the soil depth intervals.
Agronomy 15 01394 g002
Figure 3. Temporal dynamics of pore-water phosphate concentration at different soil depth intervals in the treatments without (CK) and with (PB) rice–straw biochar. Data represent the means of three replicates, and error bars indicate standard deviations. The numbers in the legend indicate the soil depth intervals.
Agronomy 15 01394 g003
Figure 4. Temporal dynamics of soil phosphate fractionation at different soil depths in the treatments without (CK; left panel) and with (PB; right panel) rice–straw biochar. The soil depth intervals were 0–3 cm (a,b), 3–6 cm (c,d), 6–9 cm (e,f), 9–12 cm (g,h), and 12–15 cm (i,j).
Agronomy 15 01394 g004aAgronomy 15 01394 g004b
Table 1. Chemical compositions of soil and rice–straw biochar.
Chemical CompositionSoilBiochar
Pseudo-total content (g kg−1)
P0.49 ± 0.013.41 ± 0.16
Al67.1 ± 1.80.76 ± 0.03
Fe40.9 ± 1.00.44 ± 0.04
Ca0.87 ± 0.029.86 ± 0.60
Mg2.23 ± 0.053.72 ± 0.16
Free oxide 1 (g kg−1)
Fed30.65 ± 0.950.32 ± 0.15
Ald5.87 ± 0.170.17 ± 0.01
Amorphous oxide 2 (g kg−1)
Feo3.16 ± 0.330.27 ± 0.02
Alo1.46 ± 0.010.08 ± 0.01
1 Dithionite–citrate–bicarbonate extractable Fe and Al. 2 Oxalate extractable Fe and Al.
Table 2. The contents of carbon, hydrogen, oxygen, nitrogen, and sulfur in rice straw and rice–straw biochar.
MaterialElement (%)
CHONS
Rice straw39.45.839.10.90.1
Rice–straw biochar56.61.95.81.20.3
Table 3. Phosphorus fractionation of soil and rice–straw biochar.
P Fraction (mg kg−1)SoilBiochar
Water-P (soluble P)4.4 ± 0.61233 ± 12
NaHCO3-P (exchangeable P)43.8 ± 1.21054 ± 24
NaOH-P (Fe/Al-bound P)183.4 ± 2.522.8 ± 1.2
HCl-P (Ca-bound P)12.3 ± 3.2694.6 ± 6.5
Disclaimer/Publisher’s Note: The statements, opinions and data contained in all publications are solely those of the individual author(s) and contributor(s) and not of MDPI and/or the editor(s). MDPI and/or the editor(s) disclaim responsibility for any injury to people or property resulting from any ideas, methods, instructions or products referred to in the content.

