Article

Changes in Soil Microbiome Composition and Tomato Plant’s Physiological Response to Water Deficit and Excess

1
Department of Food and Drug, University of Parma, Parco Area delle Scienze 49/A, 43124 Parma, Italy
2
Insitute of BioEconomy, CNR, Via Madonna del Piano 10, Sesto Fiorentino, 50019 Firenze, Italy
3
Economics and Management Department, University of Parma, Via J.F. Kennedy 6, 43125 Parma, Italy
*
Author to whom correspondence should be addressed.
These authors contributed equally to this work.
Agronomy 2025, 15(4), 915; https://doi.org/10.3390/agronomy15040915
Submission received: 17 March 2025 / Revised: 3 April 2025 / Accepted: 5 April 2025 / Published: 8 April 2025

Abstract

:
Water stress is a major limiting factor in agriculture, particularly in the Mediterranean region, where climate change exacerbates drought conditions. Soil microbiome composition plays a crucial role in plant resilience to environmental stressors, particularly water scarcity and excess. This study examines the impact of different irrigation regimes (optimal, severe deficit, and excess) on tomato soil microbiome composition and plant physiology in a Mediterranean context. Metataxonomic profiling revealed significant shifts in microbial community structure: Proteobacteria dominated under optimal irrigation (WO), Acidobacteria under water deficit (WD), and Actinobacteria under both water deficit and excess (WE). Functional analysis indicated irrigation-induced alterations in microbial metabolic pathways, influencing nutrient cycling. Soil respiration varied, peaking in the WE condition. Plant physiological responses, including gas exchange and Proline content, were significantly affected by water stress. An inverse correlation was observed between microbial diversity and chlorophyll content, suggesting a link between plant stress responses and soil microbial composition. This study underscores for the first time the intricate relationship between water availability and microbial community dynamics, emphasizing the importance of microbiome-driven soil and plant resilience, thus showing this be a key factor in agricultural sustainability under changing climatic conditions.

1. Introduction

Agriculture and food systems have faced a big challenge in recent years. Climate change is becoming the greatest danger to the sustainability of global agriculture, increasing the need for irrigation as evaporation and transpiration have increased due to global warming across most of the planet [1]. These characteristics, together with less rainfall, constitute a significant threat to future food security and contribute to environmental stress [2]. One of the regions experiencing the consequences of climate change is the Mediterranean region, identified as a hotspot because warming here is approximately 20% faster than the global average [3]. Among the abiotic factors, drought seriously affects agricultural productivity each year. In 2019, the World Wildlife Fund (WWF’) reported that an average of 55 million people globally are affected by drought each year [4].
Reduced transpiration and photosynthetic rates, osmotic adjustments, the inhibition of root and shoot growth, excess formation of reactive oxygen species (ROS), alteration in stress signaling pathways, and senescence are just a few of the physiological and morphological changes that plants undergo [5]. On the other hand, drought’s effects on the soil microbial community are less known. Soil represents an ecosystem that supports many functions, including plant productivity, carbon storage, and nutrient cycling. The main players in these functions are the microorganisms that inhabit this environment, which are so numerous and diverse that soil is considered the ecosystem with the most diverse microbiota composition on Earth. Plant health and yields are influenced by the microbes that live in the region known as the rhizosphere as they play an important role in soil fertility [6]. Several microbial processes can promote plant growth under drought conditions, such as changes in phytohormone content, production of osmolytes, volatile organic compounds, and exopolysaccharides (EPSs) [2]. However, not all microorganisms can cope with stress, and therefore drought conditions can also affect the soil microbial community by making it unstable. In this case, changes may occur to the composition of the microbiome or the interactions between the different microorganisms within [7].
Understanding the changes in the composition, ecology, and activities of microbial communities in the rhizosphere can help to assess their impact on plant development under stress conditions.
Tomato (Solanum lycopersicum L.), ranking as the most-produced vegetable in the world in 2022 with 186 million tons [8], is one of the most important horticultural crops in the world and one of the most water demanding [9]. Seasonal tomato water requirements, however, which have so far been almost totally supplied with irrigation due to the gap between high evapotranspiration and low precipitation, might no longer be met because of water shortages [9,10]. Dry winters and springs, and the drought that characterizes the Mediterranean region, have affected tomato cultivation rates, and a recent model forecast has predicted more than a 5% production decrease in about 30 years [11]. Therefore, deficit irrigation strategies have been recently applied to tomato cultivation, aiming to save water without affecting fruit production and quality, and have resulted in unchanged physiological traits, e.g., Soil Plant Analysis Development (SPAD), chlorophyll fluorescence, stomatal conductance, and fruit yields [12,13,14,15] in the Mediterranean area.
Nonetheless, with climate changes, together with water stress, the Mediterranean area could be increasingly impacted also by heavy rainfall events, which can lead to periods of water excess in crop fields [16]. In tomatoes, it was observed that a high water supply induced stomatal closure, accelerated fruit maturation, and significantly reduced internal fruit firmness [17]. Nonetheless, there is a lack of studies on tomato’s physiological response to water excess.
The effects of water stress on the tomato soil microbiome have been likewise studied, describing drought as a major driver of the alpha and beta diversity of the tomato rhizosphere and rhizoplane, depending on its timing [18]. The alpha diversity has also been ascribed to tomato variety, distinguishing between drought-tolerant (TRz) and -susceptible (SRz) rhizospheres, with the former having taxa of fungi and bacteria known for their beneficial properties in plants [19]. Similarly, a different degree of diversity of the rhizosphere microbiota, as well as eco-physiological traits, has been observed in two tomato genotypes in response to mild water stress conditions in a Mediterranean scenario [20].
Although numerous studies have individually examined changes in the soil microbiome, physiology, and production of tomatoes under water stress conditions, the correlation between these aspects remains poorly understood. Moreover, the evaluation of water excess, together with water deficit, of the tomato rhizosphere in field, has never been studied. To address this research gap, the present study examines rhizosphere microbiomes, together with agronomical and physiological plant parameters, under different water regimes.
In this study, an integrated approach to investigate the response of the soil microbial community to two stress irrigation regimes in open-field tomato cultivation has been used to: i) determine the physiological and biochemical changes in tomato leaves due to water stress; ii) identify differences in the microbial communities in the rhizosphere; and iii) evaluate the presence of a correlation between rhizosphere composition and plant physiology and production.

2. Materials and Methods

2.1. Experimental Design

This study was carried out on a tomato open field at Azienda Agraria Sperimentale Stuard located in Parma, Italy (60 m a.s.l., 44° 48′29.888″ N 10° 16′ 29.074″ E), on silty loam soil whose chemical and physical properties are reported in Table 1. On 1 June 2023, tomato plants (Solanum lycopersicum L. cv. Heinz 1301) at the four-leaf stage were transplanted and arranged along three rows at a distance of 0.5 m and with a 0.23 m distance between the plants within the row. Throughout the growing season, 118.8, 90, and 180 units ha−1 of N, P, and K, respectively, were delivered. The experiment was designed to apply three different irrigation regimes on three experimental rows, each one consisting of 39 plants arranged in three blocks spaced apart by five buffer plants. Buffer rows were placed between the experimental ones to avoid water leakage. Irrigation was managed using Irriframe, a regional irrigation advisory service that, considering multiple factors, such as weather, soil, and underground data, aims at providing crop-specific irrigation regimes [21]. Based on the Irriframe indications, an optimal water condition (WO) was set, which served as a basis for establishing water stress conditions, including both water deficit (WD) and water excess (WE). The water stress trail was continuously conducted from the blossoming phase to tomato harvest, using identical irrigation schedules (time and frequency) but varying irrigation volume. Specifically, at the end of the trial, the total volume of water distributed by irrigation was 2402, 3245, and 1170 m3 ha−1, respectively, in WO, WE, and WD plants.

2.2. Physiological Analyses

The plant physiology was evaluated by on-field measurements about 80 days after transplanting (DAT), when the fruits were at the light-red ripeness degree, corresponding to the 88 tomato growth code in the BBCH scale. All the physiological measurements were performed between 10 a.m. and 3 p.m. on the third, fully expanded and sun-exposed leaf.

2.2.1. Leaf Gas Exchange

The leaf gas exchange was measured using a CIRAS-4 portable photosynthesis system (PP Systems, Amersbury, MA, USA). Measurements were carried out with the following instrument settings: CO2r: 400 µmol mol−1, H2Or: 70%, PARi: 2500 µmol m−2 s−1, flow: 300 cc min−1, and leaf area: 4.50 cm2. The gas exchange measures under investigation were stomatal conductance (gs), transpiration (E), and sub-stomatal CO2 concentration (Ci). Leaf gas exchange measurements were replicated twice per block.

2.2.2. Chlorophyll Fluorescence

Chlorophyll fluorescence measurements were performed using a Plant Efficiency Analyzer, Handy PEA (Hansatech Instruments, King’s Lynn, UK). After 30 min of dark-adaption using a leaf clip (Hansatech Instrument, King’s Lynn, UK), leaves were exposed to a saturating light pulse using the following instrument settings: pre-illumination: 0.1 s, illumination: 1 s, number of flashes: 1, and intensity: 2500 μmol m−2s−1. The chlorophyll fluorescence was replicated twice per block (six measurements for each water condition). The overall parameters are reported in the Supplementary Materials and previously described from the physiological point of view by Strasser et al. [22].

2.2.3. Leaf Color Determination

A portable tristimulus colorimeter (Minolta Chroma Meter CR-400 model, Minolta, Osaka, Japan) was employed for the color measurement on one leaf per plant per block. The results are expressed in the Lab* color dimension (ISO/CIE 11664-4:2019).

2.3. Leaf Anatomical Structure

The tomato leaves samples were collected and placed in an FAA solution (formalin: acetic acid 60%; ethanol solution 2:1:17 v/v) [23]. Subsequently, the samples were dehydrated by immersing them in solutions with increasing concentrations of alcohols. The inclusion was made in a methacrylate resin (Technovit 7100, Heraeus Kulzer & Co., Wehrheim, Germany), and through the use of the microtome (Leitz, Wetzlar, Germany) the blocks obtained were cut creating transversal sections with a thickness of 3 µm. The sections were stained with a solution of toluidine blue (TBO) and PAS—Amido Black [23]. The sections were observed with a Leica DM 4000 optical microscope (Leica Imaging Systems Ltd., Wetzlar, Germany) equipped with a Leica DC 100 digital camera. The image analysis was performed using LAS X Leica software (ver. 5.3.0). For each water condition, six replicates were analyzed.

2.4. Leaf Biochemical Characterization

2.4.1. Chlorophyll and Carotenoids Content

The pigments’ extraction and quantification were carried out according to the method described by Rodolfi et al. [24]. Briefly, leaf samples (100 mg) were homogenized with a tissue homogenizer ultraturrax using 10 mL of 80% acetone (v/v) and centrifuged at 5000× g for 10 min at 4 °C. Extracts were analyzed for the chlorophyll a, b and Carotenoids using a Cary 60 UV-Vis Spectrophotometer (Agilent, Santa Clara, CA, USA). Pigments were quantified as described by Dere et al. [25]. For each water condition, three replicates were analyzed.

2.4.2. Total Polyphenol Content and DPPH Assay

The extraction of polyphenols from tomato leaves was performed as described by Schiavon et al. [26], with slight modifications. Briefly, samples of leaves (30 mg DW) were extracted using 1.5 mL of a methanol/water (1:1, v/v) solution in an ultrasonic bath for 15 min and centrifuged at 3600× g for 10 min. The supernatant was transferred in a tube and the solid matter was re-extracted twice using a further 2.5 mL of solvent. The total polyphenol content was determined using the Folin–Ciocalteu reagent, as described by Singleton and Rossi [27], and gallic acid for the calibration curve. The methanolic extract (40 µL) was mixed with distilled water (210 µL) and the Folin–Ciocalteu reagent (100 µL) and, after 5 min of incubation, a 7.5% sodium carbonate solution (1 mL) was added followed by a 5 min reaction time. Then, the mixture was diluted with distilled water (800 µL), stirred, and, after 30 min of dark incubation at 40 °C, the absorbance was measured at 765 nm using a Cary 60 UV-Vis Spectrophotometer (Agilent, Santa Clara, CA, USA). The same method was applied to the standard solution of gallic acid. The results are shown in mg GAE/g dw (GAE = Gallic Acid Equivalent). The DPPH (1,1-Diphenyl-2-picrylhydrazyl) free radical scavenging capacity of the methanolic extracts was evaluated spectrophotometrically. Samples (200 µL) were added to a DPPH solution (2 mL; 0.2 mM) and distilled water (2.6 mL) and, after a 30 min dark incubation, the absorbance was measured at 517 nm. The antioxidant activity was calculated using a Trolox (6-Hydroxy-2,5,7,8-tetramethylchroman-2-carboxylic acid; 2 mM) calibration curve and the results are expressed as mmol TEAC/g dw (TEAC = Trolox Equivalents Antioxidant Capacity). For each water condition, three replicates were analyzed.

2.4.3. Proline Extraction and Quantification

Proline was extracted and quantified as described in Potestio et al. [28], without any modification. In brief, 80 mg of frozen sample was homogenized with ethanol 95% (v/v), then heated at 55 °C for 20 min. One mL of the reaction mixture (containing 1% (w/v) Ninhydrin), described in detail in Potestio et al. [28], was added to 250 μL of supernatant. The reaction occurred at 95 °C for 20 min in the dark. The samples (200 μL) were transferred into a flat-bottom 96-well microplate, and the Proline concentration was quantified by detecting the absorbance at 520 nm (Multiskan SkyHigh, Thermo Fisher Scientific Inc., Waltham, MA, USA). Data are expressed as µmol/g of fresh weight (FW). For each water condition, three replicates were analyzed.

2.4.4. Lipid Peroxidation (TBARS Assay)

Lipid peroxidation was evaluated following the Thiobarbituric acid reactive substances (TBARS) method [29], prior to sample extraction described by Marchioni et al. [30]. Malondialdehyde (MDA) concentration was determined at 532 nm, following the formulas’ reported readings at 440 and 660, which were also required to remove interferences [29]. TBARS content was expressed as nanomoles of MDA equivalents (MDAes) per gram of fresh weight. The samples were analyzed in triplicate.

2.5. Fruit Yield and Size

Tomato harvesting was conducted on the 12th and 13th of September when the ripe fruit rate was about 95%. For each experimental row, fruits were hand-picked and classified into marketable (healthy, red, and ripe fruits) and non-marketable (blossom end rot, rotten, and green fruits). Both the marketable and non-marketable fractions were weighed separately to assess plant fruit yields (kg plant−1 fw -fresh weight). The total fruit yield was calculated as the sum of the marketable and non-marketable yields. For each irrigation regime, the tomato size (g) was calculated as the average weight of 100 tomatoes.

2.6. Microbiological Analyses

2.6.1. Community-Level Physiological Profiling (CLPP)

At the end of the harvest, 20 g of soil was collected from 3 plants of each treatment to make a bulk. The soil adhering to the rhizosphere was carefully collected by gently shaking it to remove soil that did not adhere. One sample of soil without plant (SWP) was collected at the beginning of the experiment to study the impact of treatments. These samples were analyzed using the Biolog system with Biolog EcoPlate™ (Biolog Inc., Hayward, CA, USA). This system permits the study of the microbial community and microbial ecology. In each EcoPlate, 31 of the most useful carbon sources were present, in triplicate. Five grams of samples were diluted (1:10) with a Ringer solution (VWR, Lutterworth, UK), and shaken at room temperature (22 °C) for 30 min at 200 rpm. After 20 min of settling, the supernatant was diluted again two times. A total of 100 μL of the third dilution was inoculated per well into EcoPlates (Biolog Inc., Hayward, CA, USA) in triplicates and incubated at 30 °C. The plates were analyzed by the Microplate Reader (dual-wavelength data: OD590) at T0 and after 24, 48, and 72 h to observe the dynamic utilization of different carbon sources from microbes for different carbon sources. For the kinetic comparative analysis, we took the lecture measurement performed after 48 h as we observed the maximum change signal development at this point. For the data analysis, we took into consideration the AWCD (Average Well Color Development) index as a parameter that enabled us to capture the integral fingerprinting of carbon sources used [31]. The value of the AWCD index was calculated according to the following equation:
AWCD = (C − R)/n
where C is the OD value of each well with a carbon source, R is the OD value of the control well (water), n is the number of wells with carbon sources, and the value of n is 31.

2.6.2. DNA Extraction

Total DNA extraction was performed using the Maxwell RSC PureFood GMO and Authentication Kit using the automated extractor Maxwell® Rapid Sample Concentrator (Promega Corporation, Madison, WI, USA), with slight modifications for the soil sample. The diluted soil sample, previously prepared for Biolog analysis (Section 2.6.1), was used as starting material for the extraction. A total of 2.5 mL of the sample was taken and centrifuged at 10,000 rpm for 10 min at 4 °C, then the supernatant was removed, and the pellet was re-suspended with 1 mL of CTAB buffer and placed into a bead-beating tube (Lysing Matrix E, MP Biomedicals, Santa Ana, CA, USA). Subsequently, the manufacturer’s protocol for DNA extraction was followed. The concentration and purity of the extracted nucleic acids were determined by Nanodrop (NanoDrop™ 2000, Thermo Fisher Scientific, Waltham, MA, USA).

2.6.3. Metataxonomic Profiling of the Bacterial Community of Soil

Bacterial composition was evaluated after the transplant (first week of July) and after fruit harvest (second week of September) for each water condition. The V3-V4 region of the 16S rRNA gene was amplified and sequenced using established primers and PCR conditions [32]. Libraries and sequencing were performed by Novogene Co., Ltd. (Cambridge, UK), on an Illumina Novaseq 6000 platform (Illumina Co., Ltd., Cambrdge, UK), to generate 250 bp paired-end fragments. FastQC (https://www.bioinformatics.babraham.ac.uk/projects/fastqc/ accessed on 25 January 2025) assessed the raw read quality, while Prinseq was applied for quality filtering (http://prinseq.sourceforge.net/ accessed on 1 February 2025), removing reads under 400 bp and trimming bases with a Phred quality cutoff of 20. FLASH [33] was used for paired-end read joining, followed by analysis with QIIME 2 (v. 2022.11) software [34]. Amplicon sequence variants (ASVs) were clustered at 99% similarity using a feature classifier, and representative sequences were assigned a taxonomy via a Naïve Bayes classifier trained on the latest Silva database (v. 138) [35,36,37].

2.7. Soil Respiration

Soil respiration was measured with an infrared gas analyzer (CIRAS-4, PP System, Amesbury, MA, USA) equipped with a continuously flowing closed chamber (SRC-2, PP System, Amesbury, MA, USA). During the measurement period, the chamber (area of 77.6 cm2 and volume of 1171 cm3) was inserted 3 cm deep into the soil. Three measurements were taken for each irrigation condition directly on the day of the tomato harvest (end of the vegetative–productive cycle, second week of September). The measurement with the equipment at each sampling point took 120 s, which is a sufficient time to obtain reliable estimates of soil respiration [38].

2.8. Statistical Analysis

Agronomic data (fruit yield and weight, physiological measurements, and chemical analyses) were analyzed for mean and standard error (n = 3). The normal distribution of the data and the homogeneity of variance were verified through the Shapiro–Wilk test and Levene test, respectively. Then, the data were subjected to a one-way analysis of variance (ANOVA) and a post hoc Tukey’s HSD test at p ≤ 0.05 to identify significant differences between water regimes. The statistical analyses were conducted with Rstudio (version 4.3.2) using the packages rstatix [39], to check the normality and homoschedasticity of the data, and Car and Emmeans [40,41] for the analysis of variance and post hoc tests. Charts were generated with the ggplot2 packages [42].
The BIOM file resulting from QIIME2 as well as the phylogenetic tree were imported in R (version 4.2.2) and subsequent analyses were performed using packages Phyloseq (v. 1.42.0), Vegan (v. 2.6-4), and DEseq2 (v 1.38.3). The Phyloseq package was used for data visualization.
Ordination was performed on compositional tables normalized to the median value, using the PCoA method and Bray–Curtis distance.
Phenotypic raw data from the CLPP analysis were elaborated with Rstudio (R version 4.3.1, Package “pheatmap” version 1.0.12) for the statistical analysis and data visualization of assays, using the default algorithms for clustering. To reduce the noise levels, all absorbance values of carbon source utilization were referred against the negative control well (A1) and, subsequently, all divided by the respective AWCD values. Negative values were set to 0. Normalized data were used for statistical analysis.
To calculate the correlation between the Biolog results and taxonomic data, the compositional data were converted into presence/absence values, and the Mantel test (Vegan package, v. 2.6.4) was used to assess correlations between microbial composition (Bray–Curtis distance) and metabolic profiles, via the Spearman’s rank correlation. Statistical significance was determined through 23 permutations. For visualization, a correlation heatmap was generated (Pheatmap package, v. 1.0.12). Spearman correlation coefficients were computed between OTU abundance and metabolic activity. Hierarchical clustering was applied to both rows and columns.
Due to the heterogeneous number of replicates between agronomic and microbiology analyses, in order to allow a multivariate data analysis, value imputations were applied using the package “missMDA” [43] in the R v4.4.1 environment [44].
The imputed dataset, having 12 replicates for agronomic (n = 20), phenotype (n = 35), and taxonomic (n = 15) parameters, was analyzed for the variables’ correlation and principal component analysis (PCA). Pearson coefficients for variables’ correlation were calculated using the R v4.4.1 package “stats”. The variables of major interest were selected and plotted using the R package “GGally” [45]. The PCA was calculated using the package “FactoMineR” [46] and then plotted using “factoextra” [47].

3. Results and Discussions

3.1. Physiological Measurements

As shown in Figure 1, all the leaf gas exchange parameters are impacted by irrigation; the gas conductance significantly decreases (p = 0.011) under water restrictions, whereas both the transpiration rate (E) (p = 0.001) and the sub-stomatal CO2 concentration (Ci) (p = 0.006) show their maximum values in WE condition.
It is well-established that stomatal closure is a primary response to drought, leading to reduced leaf transpiration and water loss. However, this reduction in stomatal aperture also limits CO2 leaf uptake, which in turn limits photosynthesis [48]. Our findings under water deficit (WD) irrigation revealed a substantial decrease in the stomatal conductance (gs) and a slight, but not significant, reduction in the leaf transpiration (E), consistent with the earlier research conducted in Mediterranean climates. For instance, Giuliani and colleagues [9] tested various irrigation methods and limited water supplies and reported reduced gas conductance with deficit irrigation practices. Patanè et al. [49] evaluated different irrigation regimes by monitoring the gs and E variations throughout the growing season and found the lowest rates in dried soils. Regarding the impact of water excess on leaf gas exchange parameters, our findings do not show significant decreases in gas conductance, consistent with the results reported by Fiebig and Dodd [50] in their study on over-irrigation. Similarly, water excess did not negatively influence transpiration either, which is consistent with the findings by Ashraf and Arfan [51].
In this study, the effects of water stress conditions on the photosynthetic apparatus were evaluated by changes in the chlorophyll a fluorescence using the model of Strasser (Figure S1: Supplementary Materials) [22]. In accordance with the previous literature describing the photosystem II (PSII) sensitive to environmental conditions [52], differences between WD and WO samples were observed in several areas, as shown in the spider plots of selected OJIP parameters (Figure S1B, Supplementary Materials). WD conditions reflected in the increase in the Vj and Vi parameters, related to the J and I steps in the OJIP curve. In accordance with Mihaljević et al. [53], showing similar patterns in two cherry cultivars under drought stress, the increase in the Vj reflects impaired electron transport on the PSII acceptor side, potentially due to an accumulation of reduced plastoquinone A (QA) in reaction centers. Conversely, the Vi rise corresponds to a higher proportion of plastoquinone B (QB) non-reducing centers, which disrupt electron transport from QA to QB. Furthermore, WD led to the reduction in both the area, representing the pool size of electron acceptors in PSII [54], suggesting a limited electron transport chain capacity [55], and the RC/ABS ratio (representing absorption flux per active reaction center (RC)); for the calculation see [56]. Conversely, the ABS/RC parameter (absorption flux per reactive center) increased due to a water shortage, as in the other studies [57,58]. Such an increase in the ABS/RC ratio, which is consistent with the previous literature, reporting the inactivation of PSII reactive centers as a typical reaction under water stress conditions [59,60], likely results from the reduced active RCs or QA-reducing centers, rather than from an expansion of the antenna complex supplying excitation energy to active RCs, suggested as the two possible explanations [56,58]. Enhanced energy fluxes from Rc inactivation have been documented in various drought stressed plants [61]; for instance, Sillo and colleagues [20] reported the increase in the DI0/RC parameter in the leaves of two tomato genotypes grown under water deficit conditions, highlighting an increase in energy dissipation in the PSII because of the RCs’ inactivation. In line with the results discussed thus far, WD led to the reduction in the performance index calculated on the absorption basis (PIabs), which combines information on the number of RCs, efficiency of energy trapping, and electron transport from PSII to the plastoquinone pool [62]. Notably, differences were also observed in the total performance index (PItot) that, unlike PIabs, incorporates PSI-related events, making it a more sensitive and reliable indicator of photosynthetic impairments under stress conditions [57,58]. By contrast, no negative effects of water excess on the “chlorophyll a” fluorescence were noted in this study, in agreement with Kolton et al.’s [63], which, depending on the tomato accession, did not report damage in waterlogging conditions.
The effect of two water stress conditions was also assessed on the leaf color with significant differences in the L* values (p = 0.031) between WD and WE samples, as well as in the leaf greenness, related to the a* coordinate (p = 3.09 × 10⁻⁶) (Figure S2, Supplementary Materials). Portable tristimulus colorimeters have been widely applied to assess leaf color in several crops and have shown good correlations with chlorophyll and carotenoid levels, demonstrating their effectiveness as a non-destructive and rapid tool for estimating pigment content [64,65].

3.2. Leaf Anatomical Structure

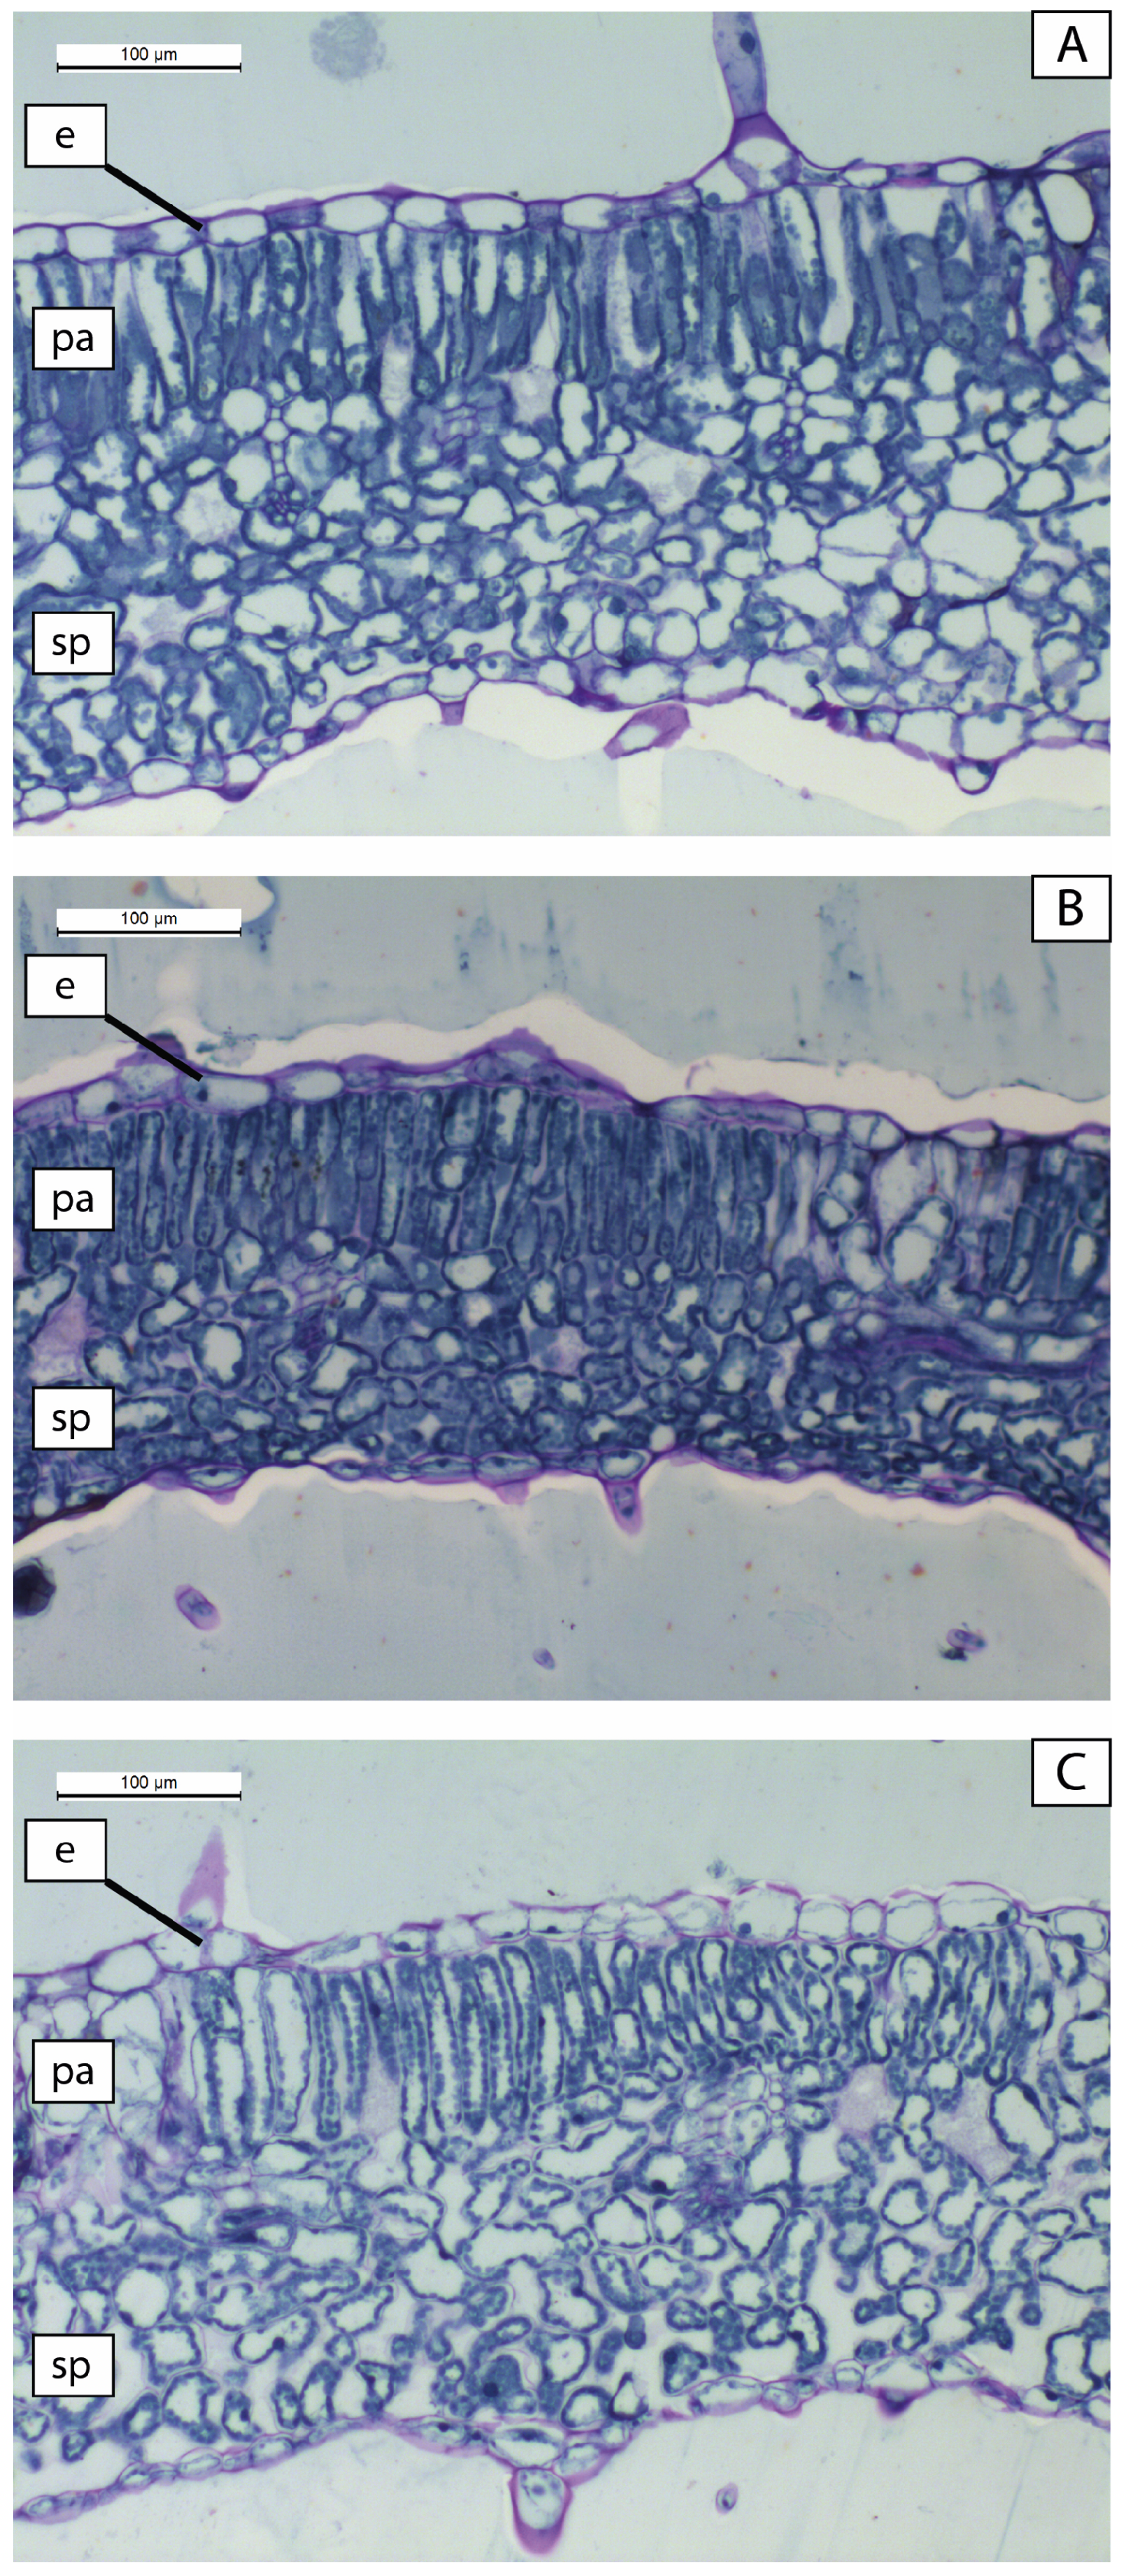
Tomato leaves change their anatomical structure after a period of water stress (either excess or deficiency). In particular, the upper epidermal cells were larger under stress conditions (WD and WE) than under the optimum condition (WO) (Table 2). WO resulted on average in a 35.41% smaller area of epidermal cells than in the other two conditions (p = 0.012).
The foliar mesophyll also undergoes significant changes (Table 2); the leaves of plants irrigated with a correct water supply (WO) have less palisade tissue (27.72%) than the leaves of plants grown with an excess (WE) or deficit (WD) of irrigation water (Table 2, Figure 2).
Consequently, differences were also observed in the spongy tissue, which was more abundant in the WO and less abundant in the WE condition (Table 2, Figure 2). These modifications are considered an adaptive strategy to water stress [66]. In tomato leaf, Scippa et al. [67] observed, after drought stress, a reduction in the thickness of both the palisade and spongy tissues. In our experiment (Figure 2), a relative decrease in palisade tissue thickness was observed. However, when considering the percentage of palisade tissue relative to the mesophyll, it can be observed that the lowest percentage of palisade tissue occurs in WO, whereas WD and WE experimental conditions showed significantly higher percentages (Table 2). This finding is consistent with the observations of Hasanagić et al. [68]; indeed, after 28 days of stress, the authors measured a higher palisade-to-spongy tissue ratio, indicating that the percentage of spongy tissue had decreased compared to the control.

3.3. Leaf Biochemical Characterization

As summarized in Table 3, irrigation had a significant impact on chlorophyll a (p = 10−4) and b (p = 0.002), with higher values found in WE leaves than in WO and WD leaves.
A similar trend was noted for the Carotenoids content, which was also significantly impacted (p = 0.011). Pigment reduction in tomato plants under water stress conditions aligns with the literature [68,69]. Sanchez-Rodriguez et al. [70], working with grafted tomato plants with different stress tolerances, found halved chlorophyll and Carotenoids contents in water stressed plants compared to well-watered plants. Similarly, Aghaie et al. [71] tested moderate and severe drought conditions on several tomato cultivars that all underwent pigment decline, which was different depending on the variety. These results agree with Obadi and colleagues [72], who tested three deficit irrigation levels and observed a gradual and significant pigment decrease.
The TPC was significantly increased by water restrictions (p = 0.003), with those in a WD being 58.28% higher than in WE condition (Table 4).
The same growth pattern was noted for the antioxidant activity (p = 0.008) being 53.60% higher in WD leaves compared to WO leaves. When plants are subjected to abiotic stresses, including both water excess and deficiency, the production of reactive oxygen species (ROS), which are normally present at low concentrations as by-products of several pathways, increases [73]. This rapid growth in ROS production, known as an “oxidative burst,” disrupts the equilibrium between ROS synthesis and scavenging, and, due to their high reactivity and toxicity, ROS damages nucleic acids, oxidizes proteins, and induces lipid peroxidation (LPO) [74,75]. For instance, under drought conditions, ROS accumulation is often linked to the reduced activity of the Calvin–Benson cycle during photosynthesis. This limitation results in increased superoxide production on the acceptor side of PSI, consistent with previously observed PItot reductions under WD conditions [76]. The stress-induced ROS accumulation can be contrasted by both enzymatic antioxidant systems and non-enzymatic low-molecular metabolites, among which phenolics that, having multiple hydroxyl groups in their structure, exhibit antioxidant activities [75,77,78]. Increased phenol contents and antioxidant activities in tomatoes under water stress conditions have been described by several authors [79,80,81,82]. Rigano et al. [80] evaluated the effects of two reduced water regimes on two tomato genotypes and found, for both of them, significantly higher phenol levels in stressed plants than in the fully irrigated plants. Similarly, Tahi and colleagues [81] compared two different deficit irrigation techniques (both using 50% ETc), and, after 11 days of stress, found for PRD and RDI, respectively, 180% and 228% increases. Increased phenolic and flavonoid levels, as well as antioxidant activity, depending on the tomato variety, were also described by Sanchez-Rodriguez et al. [82]. Differences in the growth of the non-enzymatic antioxidant activity in tomato leaves under drought conditions were confirmed by Moles et al. [79]. Another common induced response of plants experiencing a water deficit is the increase in the synthesis and accumulation of osmolytes, among which Proline is evident [83,84]. Proline, regarded as a multi-functional amino acid, plays an essential role in several stress-tolerance mechanisms, such as the control of cellular osmotic balance, ion homeostasis, and the activation of enzymatic, as well as non-enzymatic antioxidant systems [84,85,86]. In this study, the Proline content significantly increased under both the water stress conditions (p = 0.004), rising by 70.71% in WD and by 79.57% in WE condition compared to WO. Similar Proline upward trends following water restrictions have been widely reported in the literature, also highlighting varietal differences [87,88,89]. Proline accumulation under drought conditions serves multiple functions beyond osmotic adjustment. It contributes to stabilizing protein structure, scavenging free radicals, and recycling NADPH + H+ via its synthesis from glutamate [90]. Additionally, Proline may also provide protection from photoinhibition by restoring the pool of the terminal electron acceptor of the photosynthetic electron transport chain [91], a mechanism likely active in WD samples, given the previously observed reduced PIabs and PItot. Water excess, as well as water deficiency, has been proven to be a cause of Proline increase in several crops [92,93]. Yin et al. [94] evaluated the effect of waterlogging on six tomato cultivars and found significant rises in both susceptible and tolerant Proline cultivars. These results align with the findings by Liu et al. [95]. Along with Proline, Malonyldialdehyde (MDA) was herein estimated to evaluate the degree of lipid peroxidation that usually occurs under stress conditions because of ROS over-production. Our results show slight, but non-significant, higher MDA contents in WD and WE leaves compared to WO, suggesting that, despite the water stress conditions, there is no lipid peroxidation. This finding may be reasonably explained by the increased polyphenol content found in WD samples, acting as low-molecular-weight antioxidants in the plant non-enzymatic antioxidant system. Conversely, the stress condition in WE plants, as demonstrated by the increased Proline content, might have been contrasted by antioxidant enzymes taking part in the plant’s defense, resulting in an unaltered MDA content [96].

3.4. Fruit Yield and Size

As shown in Figure 3A, irrigation significantly affects the total fruit yield (p = 9 × 10⁻⁴) and its fractions. Notably, WD conditions resulted in a 48.99% marketable yield reduction (p = 9 × 10⁻⁴), while conversely causing a substantial increase of 34.35% in BER tomatoes (p = 0.007). WE irrigation led to a significant rise in the green yield (p = 0.007) being 285.29% and 235.90% higher than in WO and WD plants, respectively. As expected, irrigation significantly influences fruit size (p = 0.013), with tomatoes grown under WD conditions found to be 22.40% smaller than those grown under optimal irrigation conditions (Figure 3B).
The observed reductions in marketable yield and fruit size due to deficit irrigation are consistent with the previous studies conducted in the Mediterranean region [97,98,99]. Additionally, WD led to an increase in the yield of blossom end rot (BER), a physiological disorder caused by calcium deficiency resulting from soil water deficits [100].
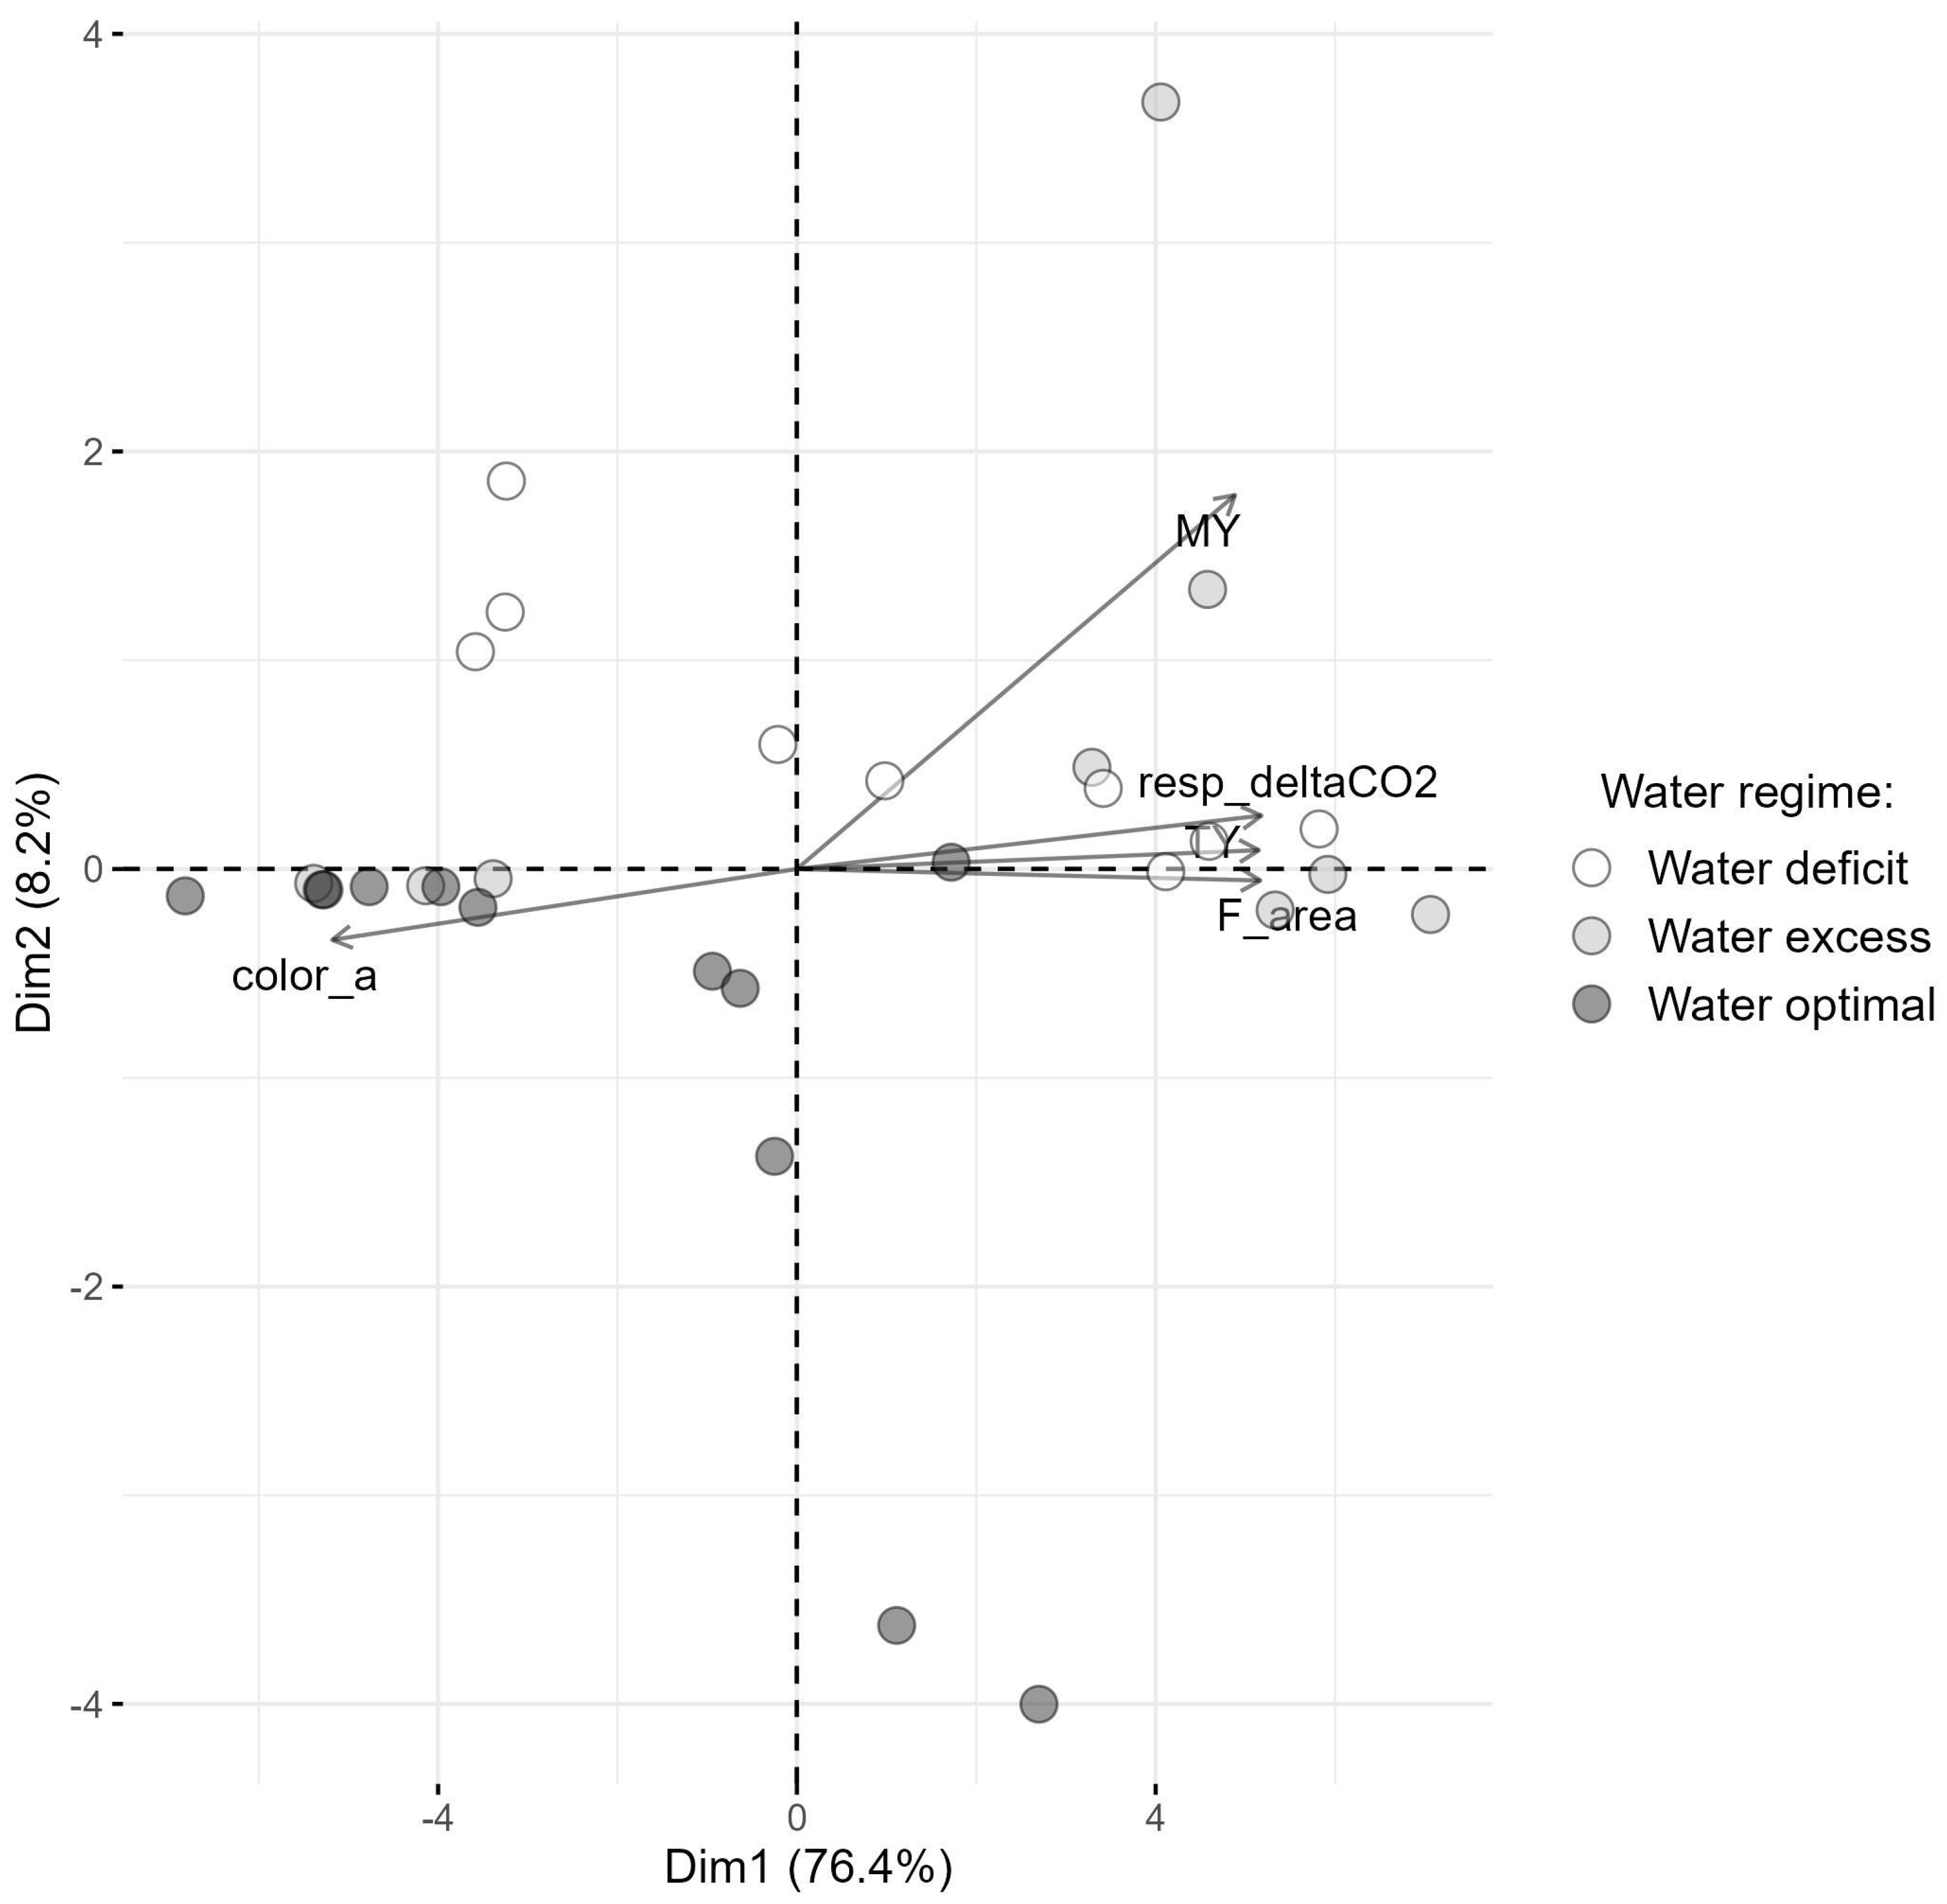
According to the PCA analysis, agronomical variables related to both physiological and chemical aspects, and fruit yield, were reduced to two principal components, explaining 84.6% of the total variability. In more detail, the first component (PC1) accounts for 76.4% and the second component for 8.2% of the total variability (Figure 4).
In the biplot, the five most significant variables contributing to the overall variability are the a* color parameter, the marketable and total fruit yields, the soil respiration, and the area parameter related to chlorophyll a fluorescence that, as previously observed, were all significantly affected by the irrigation treatment. In addition, a separation between WO samples and those under water stress conditions was found on PC1, suggesting both physiological and biochemical changes in response to water stress conditions.

3.5. Soil Rhizosphere: Composition Diversity

DNA extracted from soil samples was subjected to NGS amplicon sequencing of the 16S rRNA region. After processing and quality filtering, 361,515 raw reads were obtained, with a median of 83,809 reads per sample. The sequencing approach revealed to be adequate to capture the microbial diversity in the samples, as shown by the alpha rarefaction curves (Figure S3). Species richness (Chao1) and diversity (Simpson) indices were calculated after the normalization step, and are presented in Table S1, Supplementary Materials.
Alpha diversity metrics (Figure 5) indicate that species richness is the lowest in the initial soil sample (SWP) (1358 ± 4 observed species), increasing with irrigation. The highest richness was observed in the WO sample (3178 ± 7 observed species), followed by WD (2931 ± 6) and WE (2766 ± 7) samples.
Similarly, Simpson’s diversity index showed lower diversity in the initial soil sample, with higher and comparable diversity across all irrigated samples. These results contrast with the findings of Gaete et al. [19], who observed higher bacterial diversity in plant-free soils than in rhizosphere microbiomes. However, the presence of plants is known to influence the soil microbial community, particularly through root exudates, which serve as an energy source and contribute to biomass production by soil microorganisms [101]. The greater richness discovered in WO than in WD irrigation scenarios agrees with what was reported by Hernandez et al. [7]. According to these authors, in fact, high-stress environments, compared to the low one, lead to microbial communities with less species richness and with lower modularity, meaning species are more interconnected. As a result, disturbances affecting one group are more likely to spread to others, decreasing microbiome stability.
The taxonomy assignment identified a total of 42 phyla, of which 26 had a cumulative abundance >0.5%. The most abundant phyla are Proteobacteria, Acidobacteria, and Actinobacteriota (Figure 6).
Proteobacteria dominate the starting soil microbiota (SWP) (48.6%), but decrease in abundance following irrigation, with the lowest relative abundance in the WD sample (19.9%) and the highest in the WO sample (34.3%). Proteobacteria are a group of Gram-negative bacteria commonly found in soil, playing a crucial role in carbon, nitrogen, and sulfur cycling [102]. Differently from Ling et al. [103], we found a higher concentration of Proteobacteria in SWP. Acidobacteriota was most prevalent in the WO sample (33.7%), followed by WD (31.7%) and WE (26.6%) samples, with the lowest abundance in the initial soil (24.1%). Acidobacteria, occupying a significant fraction of the soil microbial community, are difficult to study due to their uncultivability. Due to their widespread presence in the soil, Acidobacteria are believed to play key roles in essential ecological processes. Their ability to degrade complex organic compounds, to produce exopolysaccharides, to produce the phytohormone Indole-3-acetic acid (IAA), and siderophores contribute to plant growth promotion [104]. Moreover, Acidobacteria are the major taxa driving soil respiration. Starke et al. [6] suggest a positive correlation between Acidobacteria activity and irrigation, indicating that this phylum may respond to water availability. In our study, consistent with Fan et al. [105], we observed in the WD samples a high presence of members of this group, which are considered to be composed by drought-tolerant bacteria.
The third abundant phylum is Actinobacteria. They constitute one of the main soil populations and they participate in the transformation of soil components into organic components. They produce secondary metabolites, which can be exploited for the production of antibiotics and disease suppression, but also promote plant growth through direct or indirect phytostimulation [106]. This phylum is more abundant in the two stressed samples (WD and WE), and this is in accordance with Simmons et al. [107], who reported that the degree of drought was correlated with Actinobacter enrichment levels. Interestingly, it is observed that also the phylum of Crenarcheota is present at a high level only in the soil subjected to stress (WE and WD). This is in accordance with Muktar et al. [108], who reported a relevant presence of bacterial phylum Crenarchaeota, as well as Actinobacteria, in the rhizosphere of plants growing in extreme environments.
At the class level, 25 taxa had a relative abundance >0.5% (Figure 6B). Comparing the start samples with the ones cultivated with tomato, it can be noticed that the differences are mostly related to the dominance of the microbial taxa within the samples, with the group of Gammaproteobacteria varying the most between the start (SWP) and cultivated samples. Indeed, within Proteobacteria, Gammaproteobacteria was more abundant in SWP (31.2%) but declined in irrigated samples (7.6% in WD; 12.7% in WO). Alphaproteobacteria was the most abundant in the WO sample (21.6%) and least in the WD sample (12.3%). On the other hand, the Acidobacteria phylum was represented mainly by Vicinamibacteria, ranging from 20% (WE) to 23.9% (WD).
At the order level (Figure 6C), the observed difference between SWP and the irrigated sample is driven by the increased abundance in the Xanthomonadales taxa, which is the prevalent representative of Gammaproteobacteria in this ecosystem. Xanthomonadales, initially abundant (25.5%), declined after tomato cultivation (4% in WE; ~2.8% in WD and WO). Conversely, Burkholderiales, belonging to Betaproteobacteria, were more prevalent in WE and WO samples (5.1% and 7.2%, respectively) than in WD and SWP samples (~3%). Within Alphaproteobacteria, Sphingomonadales was the most abundant order, ranging from 7.4% (WD) to 13.7% (WO). In line with the previously reported results at the class level, Vicinamibacterales was the most represented in soil after cultivation, ranging from 23.3% (WD) to 19.6% (WE). The known drought resistance of this group probably explains its highest abundance in a WD [109]. Other orders, including Rhizobiales, Tistrellales, Reyranellales, and Caulobacterales, are detailed in Supplementary Table S2.
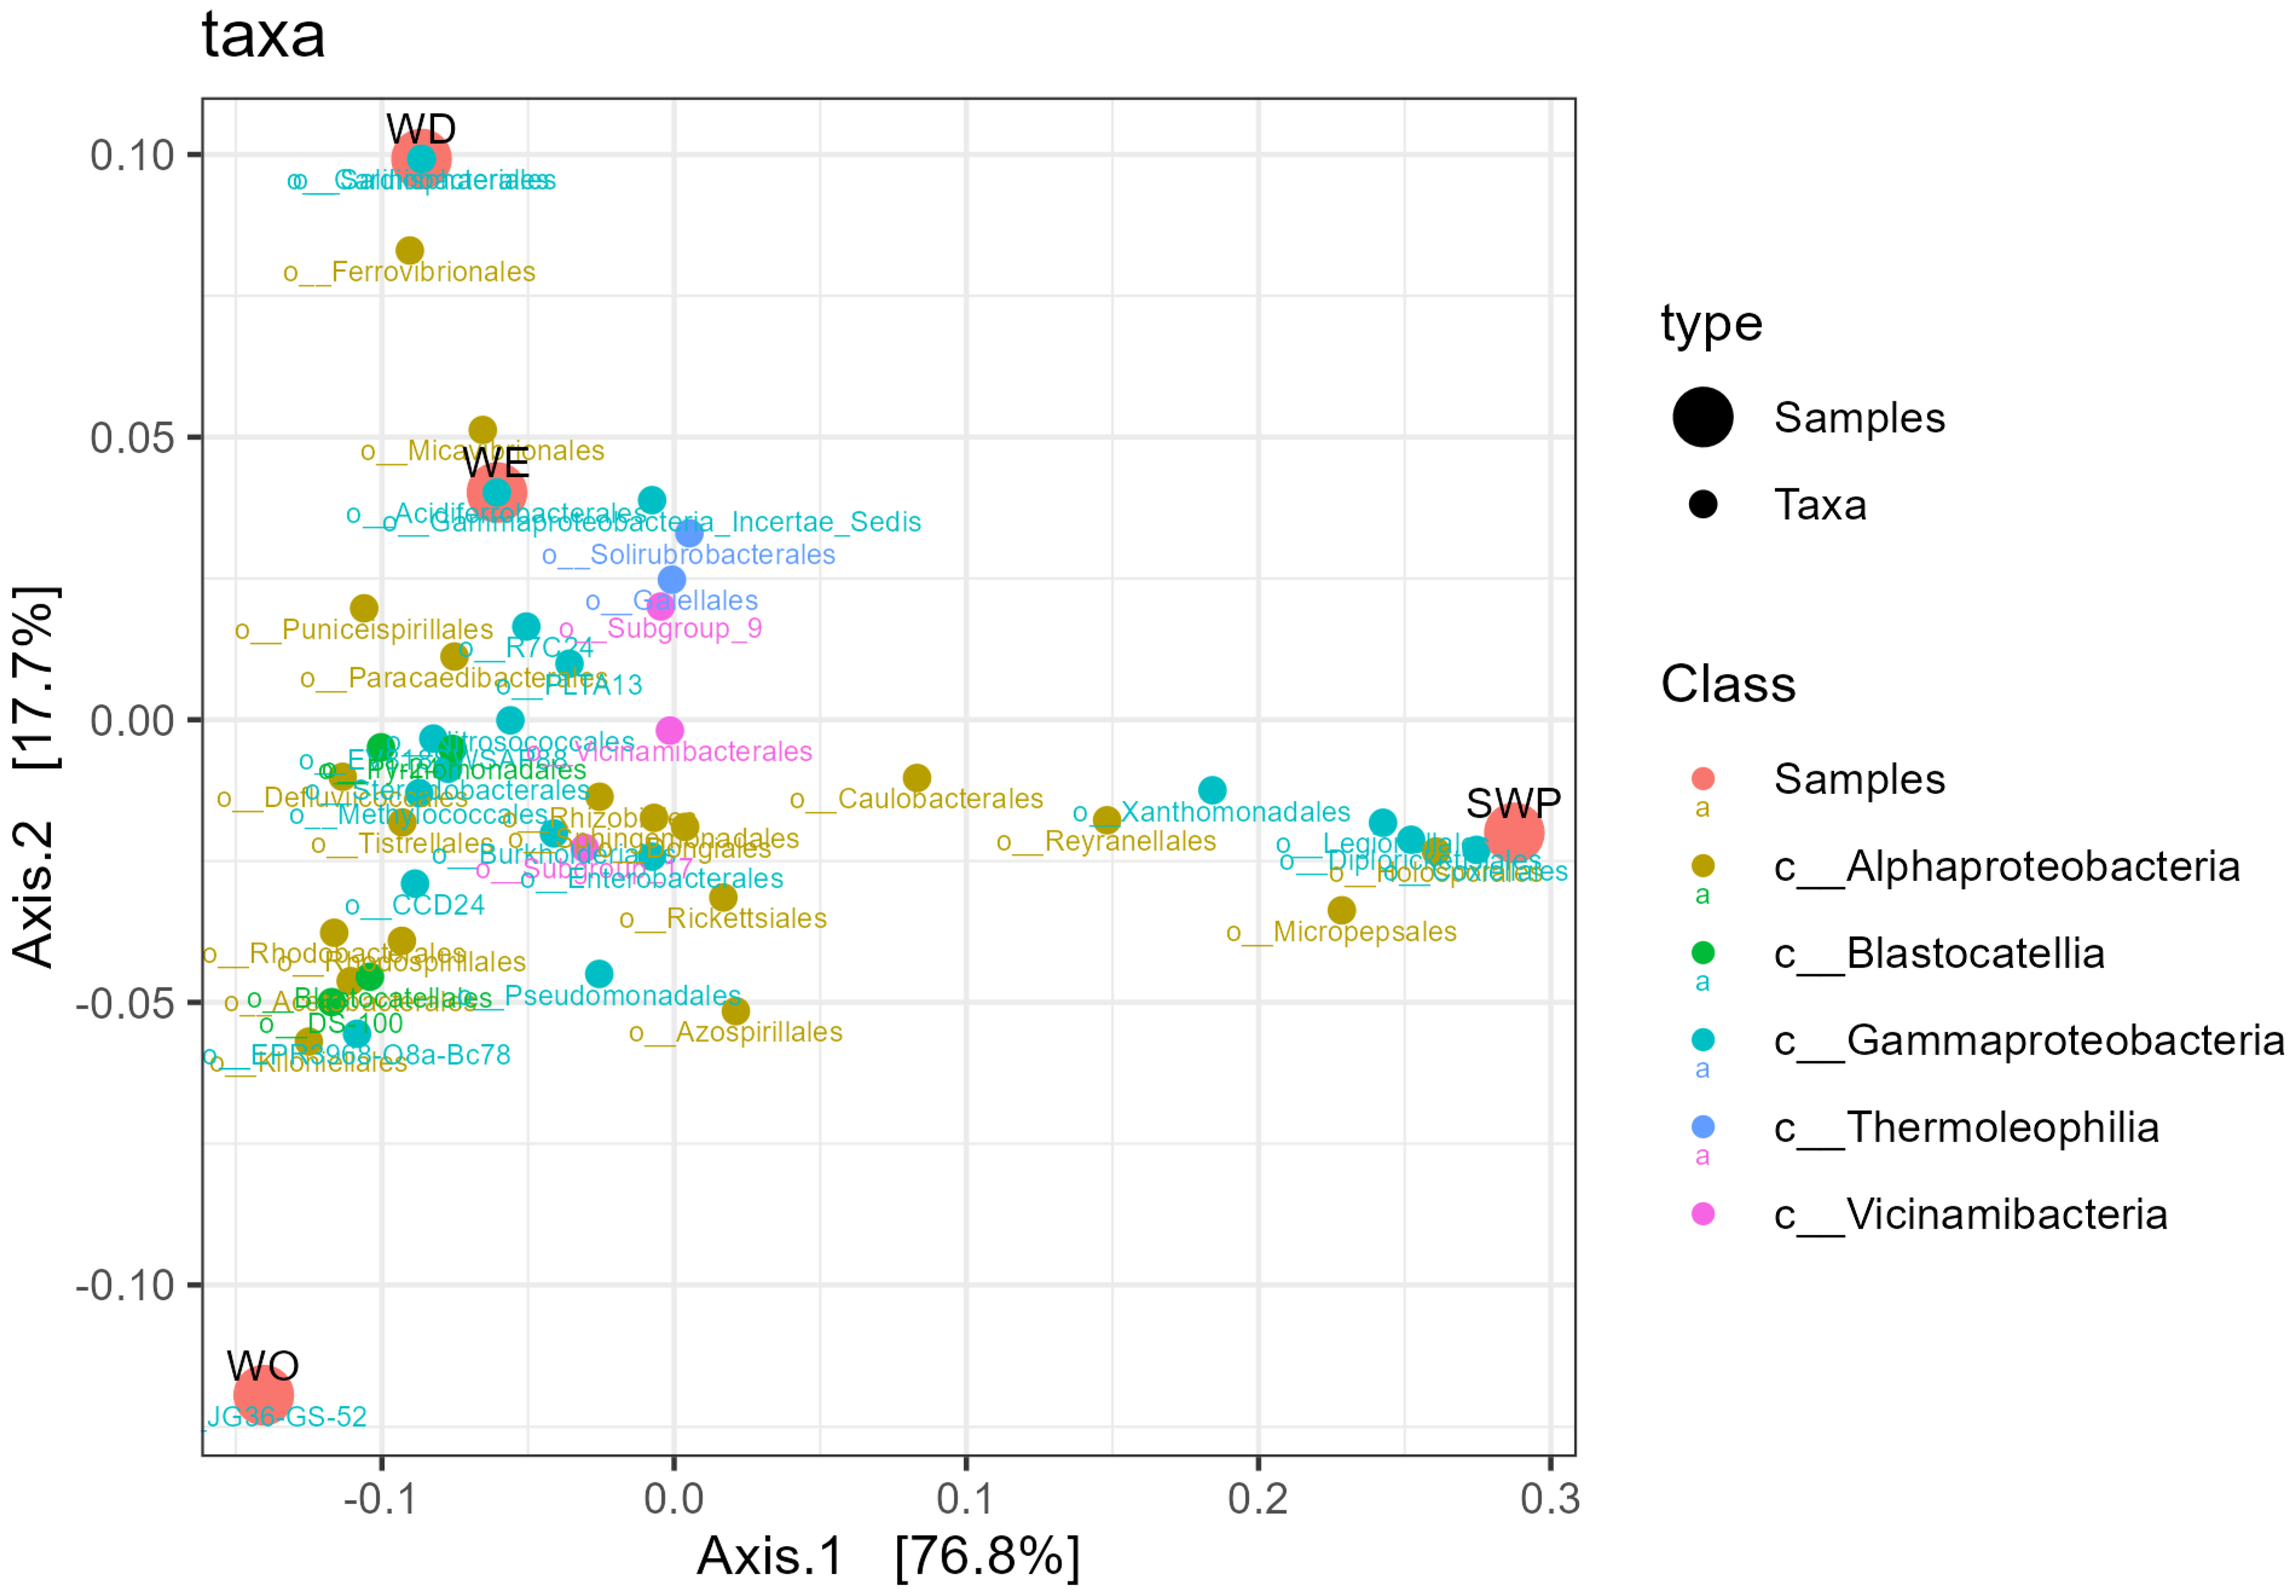
The principal coordinate analysis (PCoA) based on beta diversity metrics reveals distinct clustering patterns of microbial taxa and samples (Figure 7).
Axis 1 explains 76.8% of the variation, while Axis 2 accounts for 17.7%, indicating that the primary source of variability is captured along the first dimension, separating the cultivated samples, on the left part of the graph, from the starting soil sample, on the right part of the graph. Alphaproteobacteria and Gammaproteobacteria are distributed within all samples, although specific orders seem to be more correlated with specific experimental conditions. Notably, Xanthomonadales tends to drive the clustering of the SWP sample, together with other orders of the Alphaproteobacteria class, suggesting a shared response to environmental gradients. Other orders, such as the Vicinamibacteriales, are shared among the samples, and tend to cluster at the center of the biplot.

3.6. Soil Microbial Functionality

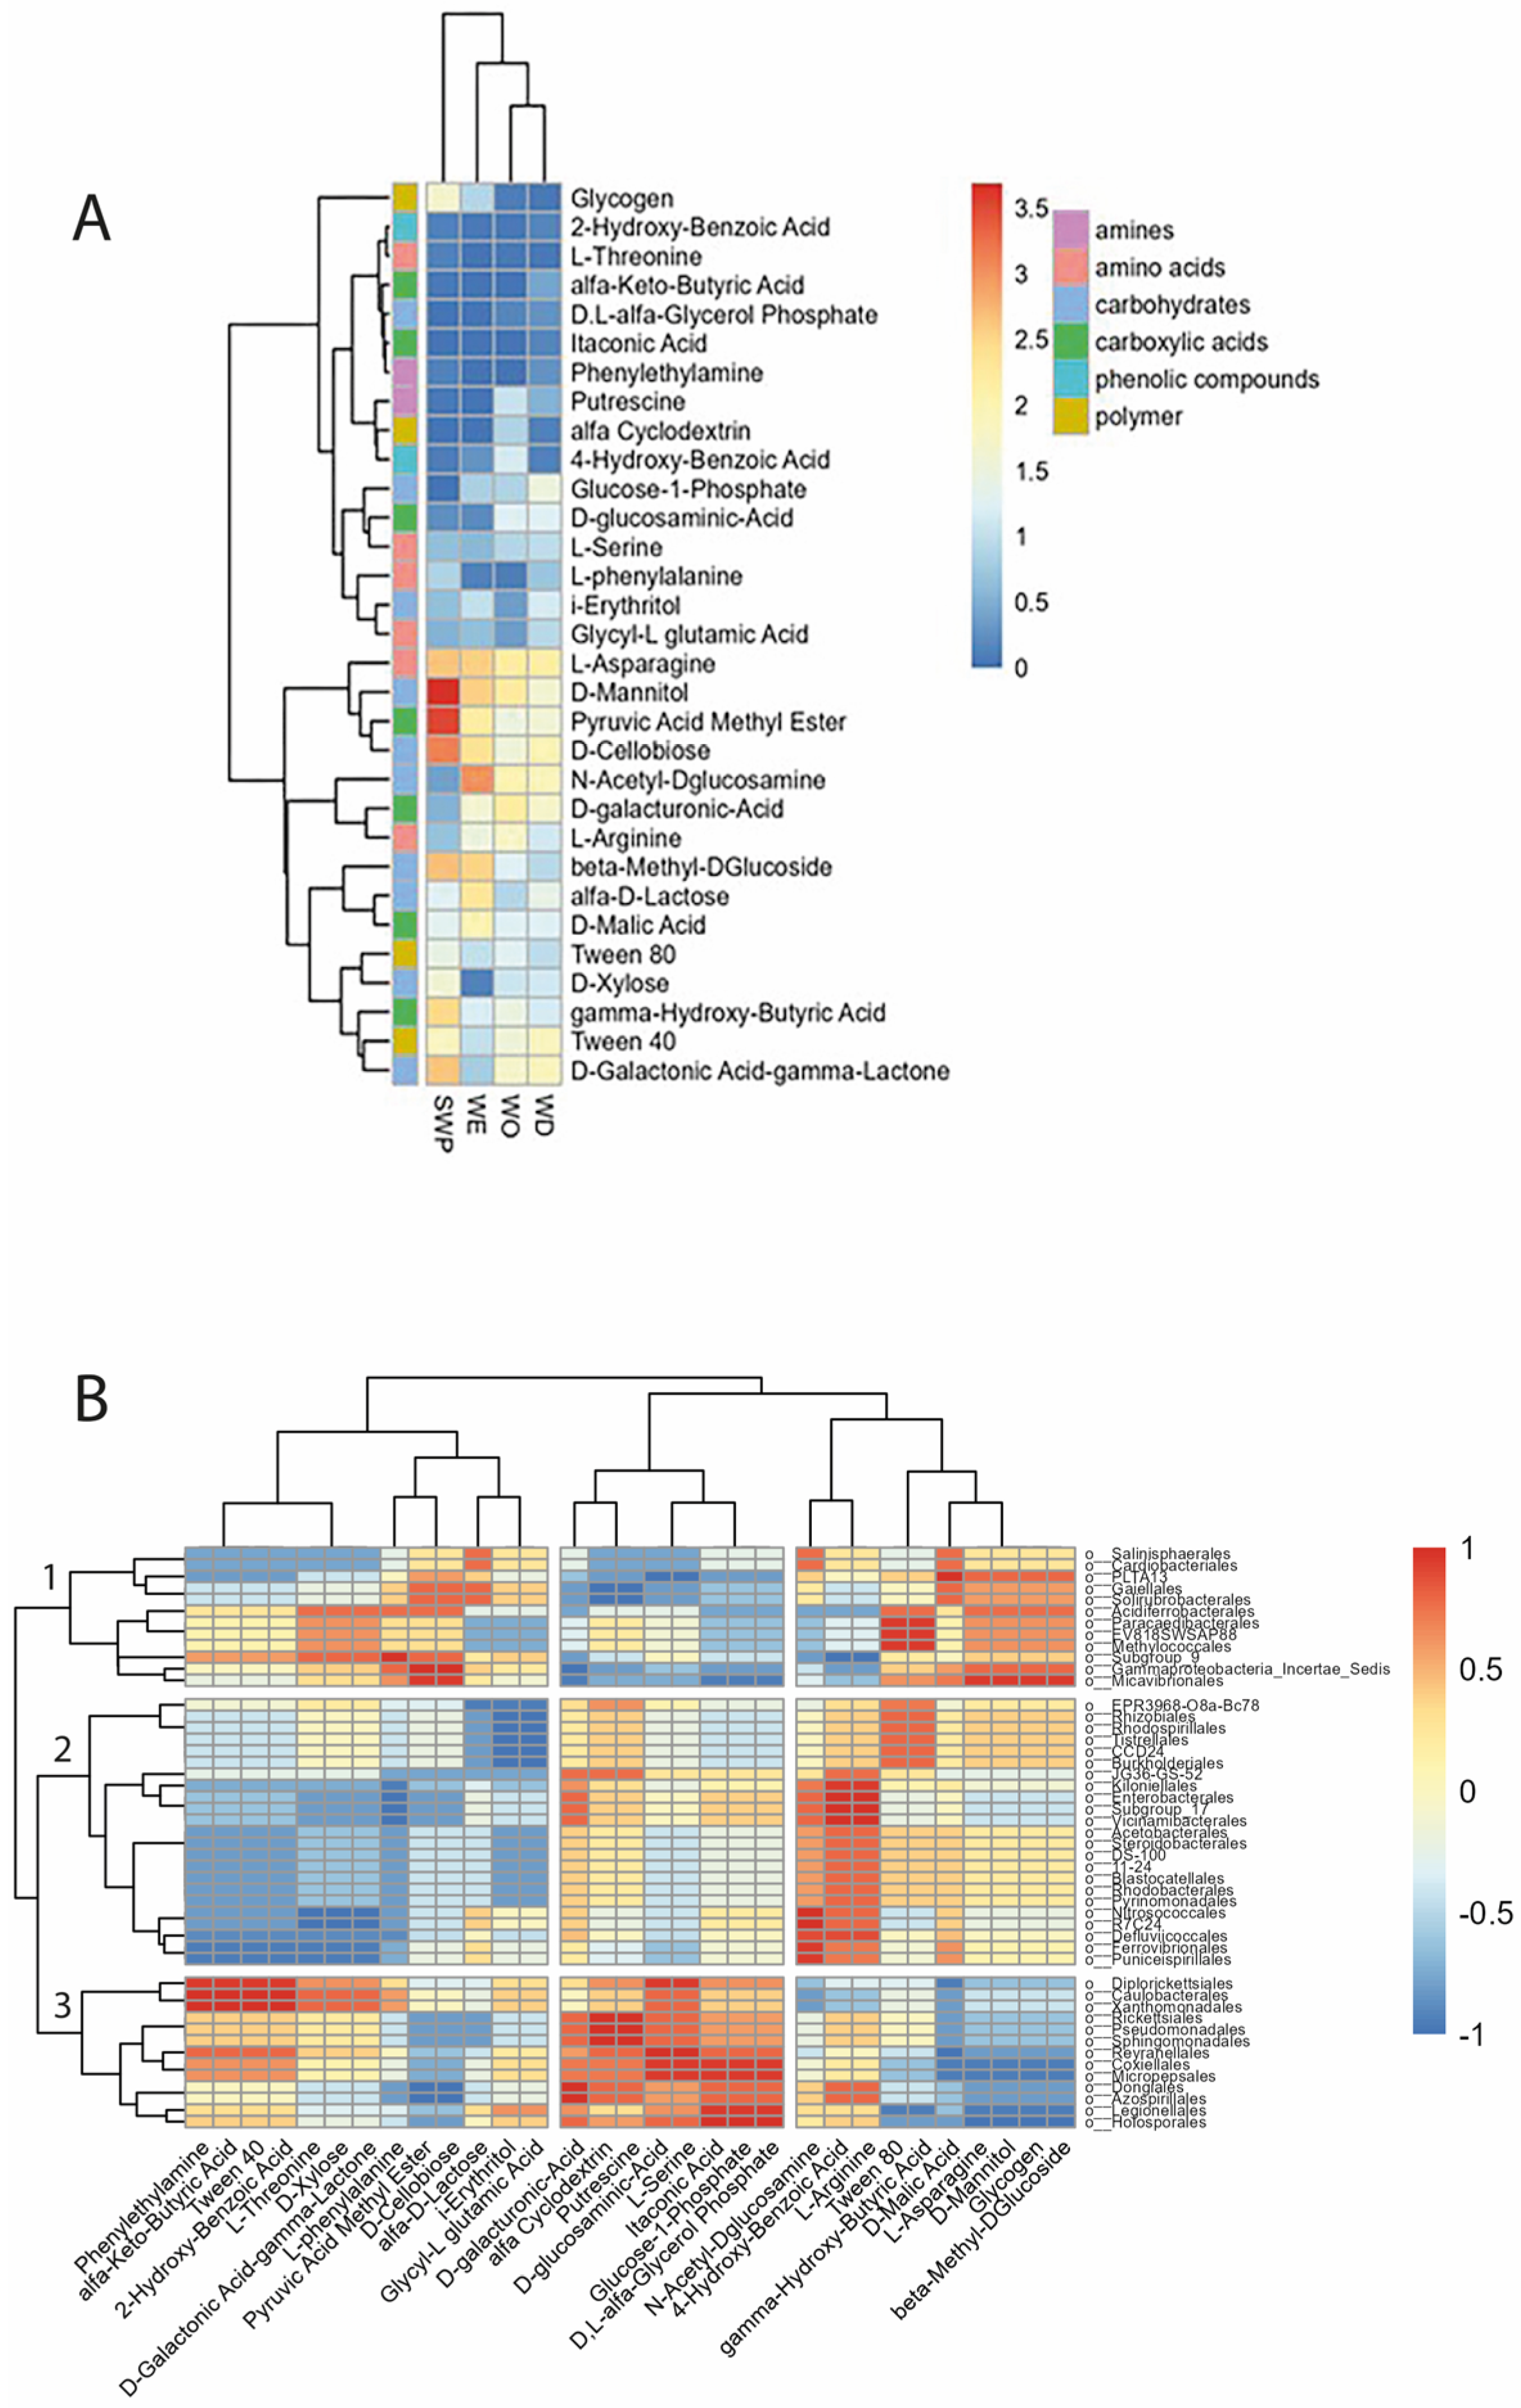
The study of the microbial functionality of an ecosystem provides us an initial insight into the effects of drought from the perspective of microbial biodiversity. A heatmap was generated (Figure 8) displaying the correlation existing between taxonomic composition (A), soil sample (B), and AWCD data, resulting from the EcoPlates results.
To highlight the existing correlations between microbiota functionality and composition, heatmaps were drawn at different taxonomic levels. At the phylum level, clear differences in terms of metabolite utilization appear among the Proteobacteria, Acidobacteriota, and a third cluster that groups Actinobacteriota with functionally similar groups of Gemmatimonadota and Chloroflexi (Figure S4, Supplementary Materials). At the class level, clustering appears similar, and taxa distribution supports the high metabolic capabilities of Gammaproteobacteria and Alphaproteobacteria (Figure S5, Supplementary Materials). The SWP sample, which represents the soil subjected to climatic open-field conditions and without plant, differs from the others in its greater ability to metabolize compounds such as D-Mannitol, Pyruvic acid, Methyl ester, and Glycogen (Figure 8A). This ability appears to be due to the greater presence of microorganisms of the order Gammaprotobacteria (Figure 8B). After the irrigation treatment, on the other hand, the samples differ from SWP in their ability to metabolize different sources, such as N-Acetyl D-Glucosamine and D-Galacturonic acid. In this case, these samples present a higher concentration of bacteria of the order Pyrinomodales. To better understand the different metabolic activities in different samples, the clustering analysis reveals distinct associations between specific microbial orders and substrate utilization patterns, highlighting the potential functional roles of bacterial taxa in soil carbon cycling. Taxa such as Rhizobiales and Vicinamibacterales are located on cluster 2 and are positively associated (red shading) with saccharides, like N-Acetyl_D-Glucosamine, 4-Hydroxy-Benzoic-acid, or aminoacids L-Arginine and L-Asparagines, in agreement with their definition of copiotroph microorganisms [6].
The clustering pattern also indicates functional divergence among different Proteobacteria classes. Xanthomonadales, which are more abundant in the starting soil, exhibit a high correlation with aromatic and organic acid compounds, such as Phenylethylamine, 2-Hydroxy-Benzoic acid, and alpha Ketobutyric acid. In contrast, Pseudomonadales and Sphingomonadales, both Alphaproteobacteria, show a stronger association with substrates like putrescine and L-Serine, supporting their role in nitrogen cycling. Finally, the Burkholderiales and Rhizobiales orders show a strong correlation with Tween 80 and Gamma-Hydroxybutyric acid, indicating its potential role in lipid metabolism and secondary carbon utilization.
Bacterial community composition is linked to soil metabolic potential, and modifications in the irrigation pattern can lead to changes in the composition and functionality of the soil microbial community [6]. However, the functional redundancy existing within a complex ecosystem, such as soil microbiome, reflected in the correlations between metabolic and compositional data (Figure 8), could compensate for these variations.

3.7. Soil Respiration

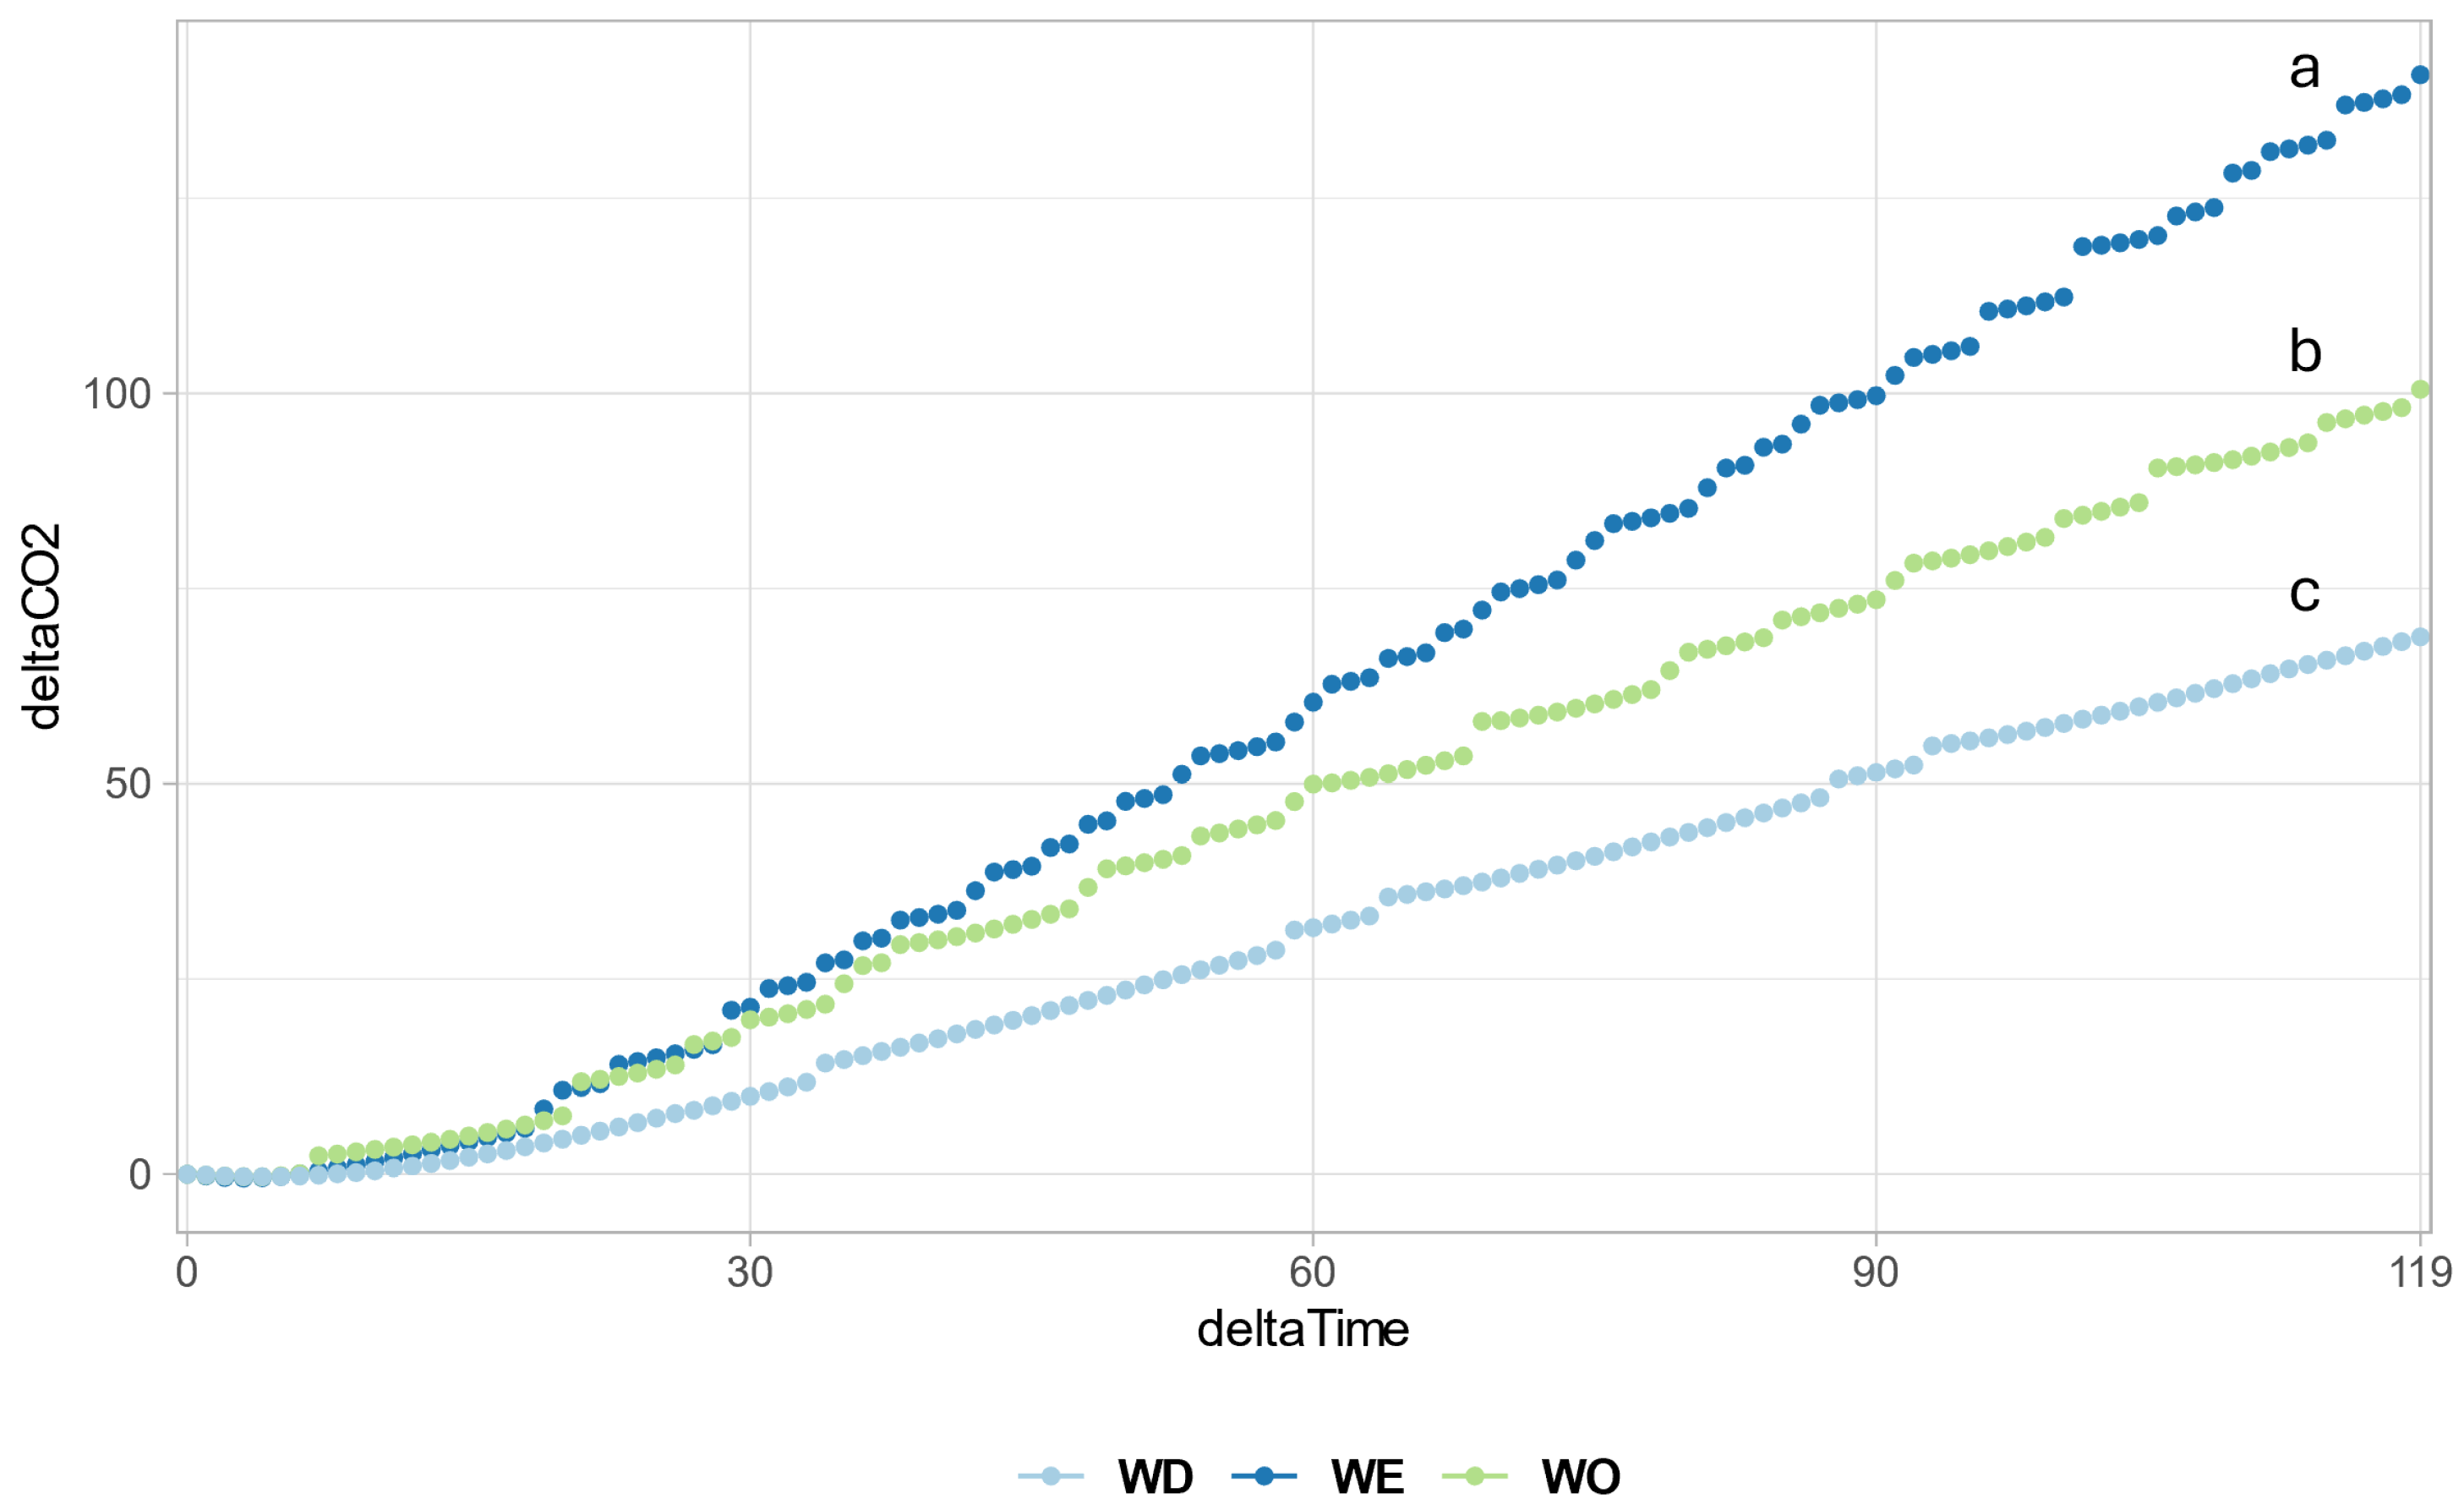
The primary causes of CO2 flux from soil are related to soil microorganisms’ activities. Soil respiration occurs primarily due to the combination of soil organic matter decomposition by microorganisms and the effect of plant root residues together with the decomposition activity of microorganisms on soil organic matter [110]. For this reason, the quantification of soil respiration plays a fundamental role in soil microbiome determination. From the results obtained with an infrared gas analyzer (CIRAS-4, PP System), it was possible to observe interesting respiration differences between soils from different irrigation regimes. In detail, as clearly shown in Figure 9, significant differences in soil respiration can be observed in response to irrigation (p = 3.99 × 10⁻⁴), with values for plants under WE irrigation being 40.06% and 104.58% higher than under WO and WD conditions, respectively.
Chen et al. [111] demonstrated that copiotrophs (such as Bacteroidetes, Alphaproteobacteria, and Gammaproteobacteria) and oligotrophs (such as Actinobacteria, Acidobacteria, and Deltaproteobacteria) had specific ecological functional roles in using C for respiration. In more detail, the fast-growing copiotrophs had higher C use efficiency but lower respiration rates compared to slow-growing oligotrophs. Thus, a decrease in the abundances of Alphaproteobacteria and an increase in Acidobacteria may contribute to the decrease in respiration. In the samples analyzed in this study, the relative abundance of Acidobacteria remains stable throughout the irrigation regimes, however the concentration of Alphaproteobacteria is higher in the WO sample, where a higher respiration trend was measured.

3.8. Correlation Between Rhizosphere Composition and Plant Physiology and Production

The evaluation of the presence of a correlation between rhizosphere composition and the plant characters is fundamental to determine the potential effect of soil microbiome composition on plant health (through physiological measurements) and yield. The correlation between the microbiological features (Simpson index and AWCD), and the main agronomic parameters is reported in Figure 10. The reader can find the Pearson correlation coefficient of all the variables tested in the present study in Supplementary Table S1.
From the results, it is possible to observe an inverse correlation between the Simpson index and the area parameter related to the chlorophyll a fluorescence (Pearson coeff. = −0.74), suggesting that the electron acceptors in the reducing size of the PSII decrease as the microbial diversity of the rhizosphere increases. Similarly, the microbial diversity shows an inverse correlation with leaf chlorophyll a and b, with Pearson coefficients equal to −0.81 and −0.88, respectively. A strong positive correlation can be observed between the TPC and the Simpson index, indicating that reduced microbial diversity due to an increased water regime also leads to a lower TPC (Table 4).
Regarding the rhizosphere microbiota composition, increasing water regimes were positively correlated with the abundance of the following phyla: Myxococcota, Desulfobacterota, Methylomirabilota, Cyanobacteria, and Sumerlaeota (Pearson coeff ≥ 0.75). In contrast, the abundance of Verrucomicrobiota and Firmicutes phyla was inversely correlated to increasing water supplies (Pearson coeff ≤ −0.75).
Looking at the physiological properties of the plant, a strong positive correlation was observed between the water regime and chlorophyll a, fluorescence area, soil respiration, and fruit yields (marketable and total), while only the a* color parameter decreased with the increase in water regime in accordance with the chlorophyll content.
Overall, agronomic, physiological, and microbiological parameters explained the difference among the samples analyzed well. All the results processed with a principal component analysis (Figure S6) explain 89.2% of the total variance among the samples within the first two principal components (57.2% and 32%, respectively, in the first and the second components). In accordance with the PCA performed solely with agronomic parameters (Figure 4), most samples cluster in the biplot according to their different irrigation regimes, except for a few samples overlapping due to some similar characteristics. Microbiome composition and its physiologic characteristics are revealed to be the variables most affecting the clusters.

4. Conclusions

The results of this study highlight the complex interaction between irrigation levels, plant physiology, and soil microbial composition. Water stress significantly affects tomato plant performance, reducing the photosynthetic efficiency, altering biochemical parameters, and leading to physiological adaptations, such as increased Proline accumulation. These responses indicate a complex stress management mechanism in plants subjected to both water deficit and excess.
Regarding the soil microbiome, irrigation levels influence bacterial community structure, favoring copiotrophic taxa under increased water availability while oligotrophs become more dominant under water scarcity.
From this experiment, it was possible to observe modifications in the microbial composition, identifying the most abundant phyla under different water regimes. Proteobacteria were most prevalent in the WO condition, followed by WD and WE. In contrast, Acidobacteria were more abundant in the WD regime, confirming their resistance to water scarcity. The third most abundant phylum was Actinobacteria, which was more prevalent under stressed conditions (WD and WE).
Regarding microbial orders, soil analysis revealed that Alphaproteobacteria and Sphingomonadales were the most abundant. Vicinamibacteriales, known for their drought resistance, were more abundant in the WD regime.
Soil microbial functionality revealed interesting outcomes, showing how irrigation treatments influenced the metabolization of different nutrient sources. The analysis indicated a functional divergence among different microbiome classes.
The study of soil respiration under different irrigation regimes showed significant differences, with soil respiration values being highest in WE samples, followed by WO and WD.
The observed correlation between microbial diversity and chlorophyll fluorescence parameters suggests a potential role of the soil microbiome in modulating plant stress responses. Additionally, soil respiration patterns indicate that microbial metabolic activity is tightly linked to irrigation, further reinforcing the connection between water availability and soil biological functions. Understanding these microbial responses could inform sustainable irrigation strategies to mitigate the adverse effects of water stress on agricultural systems.
From an agronomic perspective, optimizing irrigation strategies is essential to balance plant productivity together with soil microbial stability. Deficit irrigation, while reducing water consumption, may lead to physiological stress and lower yields, whereas excessive watering alters microbial dynamics. The use of the water excess regime, which has never been studied, provided a more complete understanding of microbiome and plant responses to water stress. This study underscores the need for integrative approaches that consider both plant physiology and soil microbiology to develop sustainable agricultural practices in water-biased environments.

Supplementary Materials

The following supporting information can be downloaded at: https://www.mdpi.com/article/10.3390/agronomy15040915/s1, Figure S1: Chlorophyll a fluorescence using the JIP test in response to different water regimes. Figure S1A represents the chlorophyll fluorescence vs. time of exposure to saturating light; Figure S1B represents the spider plot of all the measured parameters. Green line (WO), red (WE), blue (WD); Figure S2: Leaf color in Lab* color dimension of leaves from different water regimes. L*: Lightness, a*: red+-green color coordinate, b*: yellow+-blue; Figure S3: Alpha rarefaction curves depicting species richness across samples at different sequencing depths. Rarefaction was performed using a maximum sampling depth of 57,000 reads per sample. Figure S4: Heatmap showing the Spearman correlation between bacterial taxonomic composition at the phylum level (y-axis) and soil metabolic activity, based on substrate utilization intensity (x-axis). Dendrograms indicate the hierarchical clustering of both taxa and substrate utilization patterns. Figure S5: Heatmap showing the Spearman correlation between bacterial taxonomic composition at the class level (y-axis) and soil metabolic activity, based on substrate utilization intensity (x-axis). Dendrograms indicate the hierarchical clustering of both taxa and substrate utilization patterns; Figure S6: Biplot relative to principal component analysis carried out on the agronomical, physiological, and microbiological parameters (taxonomic variables are aggregated at the phylum level). The ten most impacting variables are shown as vector arrows; Table S1: Matrix of Pearson correlation coefficient between agronomic and metataxonomic parameters (at phylum, class, and order levels); Table S2: Relative abundance of the ASVs showing a cumulative abundance of at least 0.5% in samples at the order level. The taxonomy of each taxon is reported. Data are reported as percentages. NA: not assigned.

Author Contributions

Conceptualization, T.G. and C.L.; methodology and validation, C.L., J.H.S., T.G., M.R., I.M., M.G. and A.L.; software, A.L. and L.B.; formal analysis and investigation, M.G., J.H.S., M.R., I.M., A.L. and D.B.; writing—original draft preparation, M.G., J.H.S., M.R., I.M., A.L., D.B. and L.B.; writing—review and editing, C.L. and T.G.; project administration, C.L. and T.G.; funding acquisition, C.L. and T.G. All authors have read and agreed to the published version of the manuscript.

Funding

This work was supported by the Agritech project—“National Research Centre for Agricultural Technologies”, project code CN00000022, funded under the National Recovery and Resilience Plan (NRRP), Mission 4 Component 2 Investment 1.4—Call for tender no. 3138 of 16/12/2021 of Italian Ministry of University and Research funded by the European Union—NextGenerationEU, Concession Decree no. 1032 of 17/06/2022 adopted by the Italian Ministry of University and Research (MUR).

Data Availability Statement

The original contributions presented in the study are included in the article; further inquiries can be directed to the corresponding authors.

Conflicts of Interest

The authors declare no conflicts of interest.

References

  1. Yuan, X.; Li, S.; Chen, J.; Yu, H.; Yang, T.; Wang, C.; Huang, S.; Chen, H.; Ao, X. Impacts of Global Climate Change on Agricultural Production: A Comprehensive Review. Agronomy 2024, 14, 1360. [Google Scholar] [CrossRef]
  2. Kour, D.; Yadav, A.N. Bacterial Mitigation of Drought Stress in Plants: Current Perspectives and Future Challenges. Curr. Microbiol. 2022, 79, 248. [Google Scholar] [CrossRef]
  3. Livi-Bacci, M. The Crowded Rims of the Mediterranean Sea. Rend. Lincei 2024, 35, 343–350. [Google Scholar] [CrossRef]
  4. Vatter, J.; Wagnitz, P.; Schmiester, J.; Hernandez, E. Drought Risk: The Global Thirst for Water in the Era of Climate Crisis; Hartwig, L., Ed.; WWF Germany: Berlin, Germany, 2019. [Google Scholar]
  5. Ahluwalia, O.; Singh, P.C.; Bhatia, R. A Review on Drought Stress in Plants: Implications, Mitigation and the Role of Plant Growth Promoting Rhizobacteria. Resour. Environ. Sustain. 2021, 5, 100032. [Google Scholar] [CrossRef]
  6. Starke, R.; Bastida, F.; Abadía, J.; García, C.; Nicolás, E.; Jehmlich, N. Ecological and Functional Adaptations to Water Management in a Semiarid Agroecosystem: A Soil Metaproteomics Approach. Sci. Rep. 2017, 7, 10221. [Google Scholar] [CrossRef]
  7. Hernandez, D.J.; David, A.S.; Menges, E.S.; Searcy, C.A.; Afkhami, M.E. Environmental Stress Destabilizes Microbial Networks. ISME J. 2021, 15, 1722–1734. [Google Scholar] [CrossRef]
  8. FAO. Agricultural Production Statistics Agricultural Production Statistics 2000–2020. In FAOSTAT Analytical Briefs, No. 79.; FAO: Rome, Italy, 2022. [Google Scholar]
  9. Giuliani, M.M.; Nardella, E.; Gagliardi, A.; Gatta, G. Deficit Irrigation and Partial Root-Zone Drying Techniques in Processing Tomato Cultivated under Mediterranean Climate Conditions. Sustainability 2017, 9, 2197. [Google Scholar] [CrossRef]
  10. Du, Y.D.; Niu, W.Q.; Gu, X.B.; Zhang, Q.; Cui, B.J. Water- and Nitrogen-Saving Potentials in Tomato Production: A Meta-Analysis. Agric. Water Manag. 2018, 210, 296–303. [Google Scholar] [CrossRef]
  11. Cammarano, D.; Jamshidi, S.; Hoogenboom, G.; Ruane, A.C.; Niyogi, D.; Ronga, D. Processing Tomato Production Is Expected to Decrease by 2050 Due to the Projected Increase in Temperature. Nat. Food 2022, 3, 437–444. [Google Scholar] [CrossRef]
  12. Nemeskéri, E.; Neményi, A.; Bocs, A.; Pék, Z.; Helyes, L. Physiological Factors and Their Relationship with the Productivity of Processing Tomato under Different Water Supplies. Water 2019, 11, 586. [Google Scholar] [CrossRef]
  13. Patanè, C.; Tringali, S.; Sortino, O. Effects of Deficit Irrigation on Biomass, Yield, Water Productivity and Fruit Quality of Processing Tomato under Semi-Arid Mediterranean Climate Conditions. Sci. Hortic. 2011, 129, 590–596. [Google Scholar] [CrossRef]
  14. Nangare, D.D.; Singh, Y.; Kumar, P.S.; Minhas, P.S. Growth, Fruit Yield and Quality of Tomato (Lycopersicon esculentum Mill.) as Affected by Deficit Irrigation Regulated on Phenological Basis. Agric. Water Manag. 2016, 171, 73–79. [Google Scholar] [CrossRef]
  15. Takács, S.; Pék, Z.; Csányi, D.; Daood, H.G.; Szuvandzsiev, P.; Palotás, G.; Helyes, L. Influence of Water Stress Levels on the Yield and Lycopene Content of Tomato. Water 2020, 12, 2165. [Google Scholar] [CrossRef]
  16. Tramblay, Y.; Somot, S. Future Evolution of Extreme Precipitation in the Mediterranean. Clim. Change 2018, 151, 289–302. [Google Scholar] [CrossRef]
  17. Karlen, D.L.; Sojka, R.E.; Robbins, M.L. Influence of Excess Soil-water and n Rates on Leaf Diffusive Resistance and Storage Quality of Tomato Fruit. Commun. Soil. Sci. Plant Anal. 1983, 14, 699–708. [Google Scholar] [CrossRef]
  18. He, D.; Gao, R.; Dong, H.; Liu, X.; Ren, L.; Wu, Q.; Yao, Q.; Zhu, H. Structure, Variation and Assembly Processes of Bacterial Communities in Different Root-Associated Niches of Tomato under Periodic Drought and Nitrogen Addition. Pedosphere 2024, 34, 892–904. [Google Scholar] [CrossRef]
  19. Gaete, A.; Pulgar, R.; Hodar, C.; Maldonado, J.; Pavez, L.; Zamorano, D.; Pastenes, C.; González, M.; Franck, N.; Mandakovic, D. Tomato Cultivars With Variable Tolerances to Water Deficit Differentially Modulate the Composition and Interaction Patterns of Their Rhizosphere Microbial Communities. Front. Plant Sci. 2021, 12, 688533. [Google Scholar] [CrossRef]
  20. Sillo, F.; Marino, G.; Franchi, E.; Haworth, M.; Zampieri, E.; Pietrini, I.; Fusini, D.; Mennone, C.; Centritto, M.; Balestrini, R. Impact of Irrigation Water Deficit on Two Tomato Genotypes Grown under Open Field Conditions: From the Root-Associated Microbiota to the Stress Responses. Ital. J. Agron. 2022, 17, 2130. [Google Scholar]
  21. Vurro, F.; Manfredi, R.; Bettelli, M.; Bocci, G.; Cologni, A.L.; Cornali, S.; Reggiani, R.; Marchetti, E.; Coppedè, N.; Caselli, S.; et al. In Vivo Sensing to Monitor Tomato Plants in Field Conditions and Optimize Crop Water Management. Precis. Agric. 2023, 24, 2479–2499. [Google Scholar] [CrossRef]
  22. Strasser, R.J.; Tsimilli-Michael, M.; Srivastava, A. Analysis of the Chlorophyll a Fluorescence Transient. In Chlorophyll a Fluorescence: A Signature of Photosynthesis; Springer Netherlands: Dordrecht, The Netherlands, 2004. [Google Scholar]
  23. Ruzin, S.E. Plant Microtechnique and Microscopy; Oxford University Press: New York, NY, USA, 1999; Volume 198. [Google Scholar]
  24. Rodolfi, M.; Barbanti, L.; Giordano, C.; Rinaldi, M.; Fabbri, A.; Pretti, L.; Casolari, R.; Beghé, D.; Petruccelli, R.; Ganino, T. The Effect of Different Organic Foliar Fertilization on Physiological and Chemical Characters in Hop (Humulus lupulus L., Cv Cascade) Leaves and Cones. Appl. Sci. 2021, 11, 6778. [Google Scholar] [CrossRef]
  25. Dere, Ş.; Güneş, T.; Sivaci, R. Spectrophotometric Determination of Chlorophyll-A, B and Total Caretenoid Contents of Some Algae Species Using Different Solvents. Turk. J. Bot. 1998, 22, 13–18. [Google Scholar]
  26. Schiavon, M.; Dall’Acqua, S.; Mietto, A.; Pilon-Smits, E.A.H.; Sambo, P.; Masi, A.; Malagoli, M. Selenium Fertilization Alters the Chemical Composition and Antioxidant Constituents of Tomato (Solanum lycopersicon L.). J. Agric. Food Chem. 2013, 61, 10542–10554. [Google Scholar] [CrossRef]
  27. Singleton, V.L.; Rossi, J.A. Colorimetry of Total Phenolics with Phosphomolybdic-Phosphotungstic Acid Reagents. Am. J. Enol. Vitic. 1965, 16, 144–158. [Google Scholar] [CrossRef]
  28. Potestio, S.; Giannelli, G.; Degola, F.; Vamerali, T.; Fragni, R.; Cocconi, E.; Sandei, L.; Visioli, G. Salt Stress Mitigation and Improvement in Fruit Nutritional Characteristics of Tomato Plants: New Opportunities from the Exploitation of a Halotorelant Agrobacterium Strain. Plant Stress. 2024, 13, 100558. [Google Scholar] [CrossRef]
  29. Hodges, D.M.; DeLong, J.M.; Forney, C.F.; Prange, R.K. Improving the Thiobarbituric Acid-Reactive-Substances Assay for Estimating Lipid Peroxidation in Plant Tissues Containing Anthocyanin and Other Interfering Compounds. Planta 1999, 207, 604–611. [Google Scholar] [CrossRef]
  30. Marchioni, I.; Pistelli, L.; Ferri, B.; Copetta, A.; Ruffoni, B.; Pistelli, L.; Najar, B. Phytonutritional Content and Aroma Profile Changes During Postharvest Storage of Edible Flowers. Front. Plant Sci. 2020, 11, 590968. [Google Scholar] [CrossRef]
  31. Tian, Q.; Wang, X.; Wang, D.; Wang, M.; Liao, C.; Yang, X.; Liu, F. Decoupled Linkage between Soil Carbon and Nitrogen Mineralization among Soil Depths in a Subtropical Mixed Forest. Soil. Biol. Biochem. 2017, 109, 135–144. [Google Scholar] [CrossRef]
  32. Takahashi, S.; Tomita, J.; Nishioka, K.; Hisada, T.; Nishijima, M. Development of a Prokaryotic Universal Primer for Simultaneous Analysis of Bacteria and Archaea Using Next-Generation Sequencing. PLoS ONE 2014, 9, e105592. [Google Scholar] [CrossRef]
  33. Magoč, T.; Salzberg, S.L. FLASH: Fast Length Adjustment of Short Reads to Improve Genome Assemblies. Bioinformatics 2011, 27, 2957–2963. [Google Scholar] [CrossRef]
  34. Caporaso, J.G.; Kuczynski, J.; Stombaugh, J.; Bittinger, K.; Bushman, F.D.; Costello, E.K.; Fierer, N.; Pẽa, A.G.; Goodrich, J.K.; Gordon, J.I.; et al. QIIME Allows Analysis of High-Throughput Community Sequencing Data. Nat. Methods 2010, 7, 335–336. [Google Scholar]
  35. Robeson, M.S.; O’Rourke, D.R.; Kaehler, B.D.; Ziemski, M.; Dillon, M.R.; Foster, J.T.; Bokulich, N.A. RESCRIPt: Reproducible Sequence Taxonomy Reference Database Management. PLoS Comput. Biol. 2021, 17, e1009581. [Google Scholar] [CrossRef] [PubMed]
  36. Bokulich, N.A.; Kaehler, B.D.; Rideout, J.R.; Dillon, M.; Bolyen, E.; Knight, R.; Huttley, G.A.; Gregory Caporaso, J. Optimizing Taxonomic Classification of Marker-Gene Amplicon Sequences with QIIME 2’s Q2-Feature-Classifier Plugin. Microbiome 2018, 6, 90. [Google Scholar] [CrossRef]
  37. Quast, C.; Pruesse, E.; Yilmaz, P.; Gerken, J.; Schweer, T.; Yarza, P.; Peplies, J.; Glöckner, F.O. The SILVA Ribosomal RNA Gene Database Project: Improved Data Processing and Web-Based Tools. Nucleic Acids Res. 2013, 41, D590–D596. [Google Scholar] [CrossRef] [PubMed]
  38. Yu, Y.; Zhao, C.; Zhao, Z.; Yu, B.; Zhou, T. Soil Respiration and the Contribution of Root Respiration of Cotton (Gossypium hirsutum L.) in Arid Region. Acta Ecol. Sin. 2015, 35, 17–21. [Google Scholar] [CrossRef]
  39. Kassambara, A. _rstatix: Pipe-Friendly Framework for Basic Statistical Tests_. R Package Version 0.7.2. 2023. Available online: https://CRAN.R-project.org/package=rstatix (accessed on 25 January 2025).
  40. Lenth, R. _emmeans: Estimated Marginal Means, aka Least-Squares Means_. R Package Version 1.11.0. 2023. Available online: https://CRAN.R-project.org/package=emmeans (accessed on 25 January 2025).
  41. Fox, J.; Weisberg, S. An R Companion to Applied Regression, 3rd ed.; Sage: Thousand Oaks CA, USA, 2019. [Google Scholar]
  42. Wickham, H. ggplot2: Elegant Graphics for Data Analysis; Springer: New York, NY, USA, 2016. [Google Scholar]
  43. Josse, J.; Husson, F. MissMDA: A Package for Handling Missing Values in Multivariate Data Analysis. J. Stat. Softw. 2016, 70, 1–31. [Google Scholar] [CrossRef]
  44. Team, R.C. R: A Language and Environment for Statistical Computing; R Foundation for Statistical Computing: Vienna, Austria, 2013. [Google Scholar]
  45. Schloerke, B.; Cook, D.; Larmarange, J.; Briatte, F.; Marbach, M.; Thoen, E.; Elberg, A.; Crowley, J. GGally: Extension to “Ggplot2”. R Package Version 2.2.1. Available online: https://ggobi.github.io/ggally/authors.html (accessed on 29 January 2025).
  46. Lê, S.; Josse, J.; Husson, F. FactoMineR: An R Package for Multivariate Analysis. J. Stat. Softw. 2008, 25, 1–18. [Google Scholar] [CrossRef]
  47. Kassambara, A.; Mundt, F. Factoextra: Extract and Visualize the Results of Multivariate Data Analyses. Available online: https://CRAN.R-project.org/package=factoextra (accessed on 29 January 2025).
  48. Chaves, M.M.; Pereira, J.S.; Maroco, J.; Rodrigues, M.L.; Ricardo, C.P.P.; Osório, M.L.; Carvalho, I.; Faria, T.; Pinheiro, C. How Plants Cope with Water Stress in the Field. Photosynthesis and Growth. Ann. Bot. 2002, 89, 907. [Google Scholar] [CrossRef]
  49. Patanè, C.; Corinzia, S.A.; Testa, G.; Scordia, D.; Cosentino, S.L. Physiological and Agronomic Responses of Processing Tomatoes to Deficit Irrigation at Critical Stages in a Semi-Arid Environment. Agronomy 2020, 10, 800. [Google Scholar] [CrossRef]
  50. Fiebig, A.; Dodd, I.C. Inhibition of Tomato Shoot Growth by Over-Irrigation Is Linked to Nitrogen Deficiency and Ethylene. Physiol. Plant 2016, 156, 70–83. [Google Scholar] [CrossRef]
  51. Ashraf, M.; Arfan, M. Gas Exchange Characteristics and Water Relations in Two Cultivars of Hibiscus Esculentus under Waterlogging. Biol. Plant 2005, 49, 459–462. [Google Scholar] [CrossRef]
  52. Panda, D.; Rao, D.N.; Sharma, S.G.; Strasser, R.J.; Sarkar, R.K. Submergence Effects on Rice Genotypes during Seedling Stage: Probing of Submergence Driven Changes of Photosystem 2 by Chlorophyll a Fluorescence Induction O-J-I-P Transients. Photosynthetica 2006, 44, 69–75. [Google Scholar] [CrossRef]
  53. Mihaljević, I.; Viljevac Vuletić, M.; Tomaš, V.; Horvat, D.; Zdunić, Z.; Vuković, D. Psii Photochemistry Responses to Drought Stress in Autochthonous and Modern Sweet Cherry Cultivars. Photosynthetica 2021, 59, 517–528. [Google Scholar] [CrossRef]
  54. Strasser, R.J.; Srivastava, A. Polyphasic Chlorophyll a Fluorescence Transient in Plants and Cyanobacteria. Photochem. Photobiol. 1995, 61, 32–42. [Google Scholar] [CrossRef]
  55. Kalaji, H.M.; Schansker, G.; Brestic, M.; Bussotti, F.; Calatayud, A.; Ferroni, L.; Goltsev, V.; Guidi, L.; Jajoo, A.; Li, P.; et al. Frequently Asked Questions about Chlorophyll Fluorescence, the Sequel. Photosynth. Res. 2017, 132, 13–66. [Google Scholar]
  56. Yusuf, M.A.; Kumar, D.; Rajwanshi, R.; Strasser, R.J.; Tsimilli-Michael, M.; Govindjee; Sarin, N.B. Overexpression of γ-Tocopherol Methyl Transferase Gene in Transgenic Brassica Juncea Plants Alleviates Abiotic Stress: Physiological and Chlorophyll a Fluorescence Measurements. Biochim. Biophys. Acta Bioenerg. 2010, 1797, 1428–1438. [Google Scholar] [CrossRef]
  57. Antunović Dunić, J.; Mlinarić, S.; Pavlović, I.; Lepeduš, H.; Salopek-Sondi, B. Comparative Analysis of Primary Photosynthetic Reactions Assessed by OJIP Kinetics in Three Brassica Crops after Drought and Recovery. Appl. Sci. 2023, 13, 3078. [Google Scholar] [CrossRef]
  58. Gomes, M.T.G.; da Luz, A.C.; dos Santos, M.R.; do Carmo Pimentel Batitucci, M.; Silva, D.M.; Falqueto, A.R. Drought Tolerance of Passion Fruit Plants Assessed by the OJIP Chlorophyll a Fluorescence Transient. Sci. Hortic. 2012, 142, 49–56. [Google Scholar] [CrossRef]
  59. Jedmowski, C.; Brüggemann, W. Imaging of Fast Chlorophyll Fluorescence Induction Curve (OJIP) Parameters, Applied in a Screening Study with Wild Barley (Hordeum Spontaneum) Genotypes under Heat Stress. J. Photochem. Photobiol. B 2015, 151, 153–160. [Google Scholar] [CrossRef]
  60. Sousaraei, N.; Mashayekhi, K.; Mousavizadeh, S.J.; Akbarpour, V.; Medina, J.; Aliniaeifard, S. Screening of Tomato Landraces for Drought Tolerance Based on Growth and Chlorophyll Fluorescence Analyses. Hortic. Environ. Biotechnol. 2021, 62, 521–535. [Google Scholar] [CrossRef]
  61. Meng, L.L.; Song, J.F.; Wen, J.; Zhang, J.; Wei, J.H. Effects of Drought Stress on Fluorescence Characteristics of Photosystem II in Leaves of Plectranthus Scutellarioides. Photosynthetica 2016, 54, 414–421. [Google Scholar] [CrossRef]
  62. Botyanszka, L.; Zivcak, M.; Chovancek, E.; Sytar, O.; Barek, V.; Hauptvogel, P.; Halabuk, A.; Brestic, M. Chlorophyll Fluorescence Kinetics May Be Useful to Identify Early Drought and Irrigation Effects on Photosynthetic Apparatus in Field-Grown Wheat. Agronomy 2020, 10, 1275. [Google Scholar] [CrossRef]
  63. Kołton, A.; Kȩska, K.; Czernicka, M. Selection of Tomato and Cucumber Accessions for Waterlogging Sensitivity Throughmorpho-Physiological Assessment at an Early Vegetative Stage. Agronomy 2020, 10, 1490. [Google Scholar] [CrossRef]
  64. Ihl, M.; Shene, C.; Scheuermann, E.; Bifani, V. Correlation for Pigment Content through Colour Determination Using Tristimulus Values in a Green Leafy Vegetable, Swiss Chard. J. Sci. Food Agric. 1994, 66, 527–531. [Google Scholar] [CrossRef]
  65. Madeira, A.C.; Ferreira, A.; De Varennes, A.; Vieira, M.I. SPAD Meter versus Tristimulus Colorimeter to Estimate Chlorophyll Content and Leaf Color in Sweet Pepper. Commun. Soil. Sci. Plant Anal. 2003, 34, 2461–2470. [Google Scholar] [CrossRef]
  66. Sam, O.; Jeréz, E.; Dell’Amico, J.; Ruiz-Sanchez, M.C. Water Stress Induced Changes in Anatomy of Tomato Leaf Epidermes. Biol. Plant 2000, 43, 275–277. [Google Scholar] [CrossRef]
  67. Scippa, G.S.; Di Michele, M.; Onelli, E.; Patrignani, G.; Chiatante, D.; Bray, E.A. The Histone-like Protein H1-S and the Response of Tomato Leaves to Water Deficit. J. Exp. Bot. 2004, 55, 99–109. [Google Scholar] [CrossRef]
  68. Hasanagić, D.; Koleška, I.; Kojić, D.; Vlaisavljević, S.; Janjić, N.; Kukavica, B. Long Term Drought Effects on Tomato Leaves: Anatomical, Gas Exchange and Antioxidant Modifications. Acta Physiol. Plant 2020, 42, 1–14. [Google Scholar] [CrossRef]
  69. Massimi, M. Tomato (Lycopersicon esculentum Mill.) Anatomical, Physiological, Biochemical and Production Responses to Drought Stress-A Mini-Review Essay. Int. J. Hortic. Sci. 2021, 27, 40–45. [Google Scholar] [CrossRef]
  70. Sánchez-Rodríguez, E.; Rubio-Wilhelmi, M.d.M.; Blasco, B.; Leyva, R.; Romero, L.; Ruiz, J.M. Antioxidant Response Resides in the Shoot in Reciprocal Grafts of Drought-Tolerant and Drought-Sensitive Cultivars in Tomato under Water Stress. Plant Sci. 2012, 188, 89–96. [Google Scholar] [CrossRef]
  71. Aghaie, P.; Hosseini Tafreshi, S.A.; Ebrahimi, M.A.; Haerinasab, M. Tolerance Evaluation and Clustering of Fourteen Tomato Cultivars Grown under Mild and Severe Drought Conditions. Sci. Hortic. 2018, 232, 1–12. [Google Scholar] [CrossRef]
  72. Obadi, A.; Alharbi, A.; Alomran, A.; Alghamdi, A.G.; Louki, I.; Alkhasha, A. Effect of Biochar Application on Morpho-Physiological Traits, Yield, and Water Use Efficiency of Tomato Crop under Water Quality and Drought Stress. Plants 2023, 12, 2355. [Google Scholar] [CrossRef] [PubMed]
  73. Choudhury, F.K.; Rivero, R.M.; Blumwald, E.; Mittler, R. Reactive Oxygen Species, Abiotic Stress and Stress Combination. Plant J. 2017, 90, 856–867. [Google Scholar] [CrossRef] [PubMed]
  74. Miller, G.; Suzuki, N.; Ciftci-Yilmaz, S.; Mittler, R. Reactive Oxygen Species Homeostasis and Signalling during Drought and Salinity Stresses. Plant Cell Environ. 2010, 33, 453–467. [Google Scholar] [CrossRef] [PubMed]
  75. Gill, S.S.; Tuteja, N. Reactive Oxygen Species and Antioxidant Machinery in Abiotic Stress Tolerance in Crop Plants. Plant Physiol. Biochem. 2010, 48, 909–930. [Google Scholar]
  76. Oukarroum, A.; Schansker, G.; Strasser, R.J. Drought Stress Effects on Photosystem i Content and Photosystem II Thermotolerance Analyzed Using Chl a Fluorescence Kinetics in Barley Varieties Differing in Their Drought Tolerance. Physiol. Plant 2009, 137, 188–199. [Google Scholar] [CrossRef]
  77. Vicente, O.; Boscaiu, M. Flavonoids: Antioxidant Compounds for Plant Defence... and for a Healthy Human Diet. Not. Bot. Horti Agrobot. Cluj. Napoca 2018, 46, 992. [Google Scholar] [CrossRef]
  78. Ashraf, M.A.; Iqbal, M.; Rasheed, R.; Hussain, I.; Riaz, M.; Arif, M.S. Environmental Stress and Secondary Metabolites in Plants: An Overview. Plant Metab. Regul. Under Environ. Stress 2018, 153–167. [Google Scholar] [CrossRef]
  79. Moles, T.M.; Mariotti, L.; De Pedro, L.F.; Guglielminetti, L.; Picciarelli, P.; Scartazza, A. Drought Induced Changes of Leaf-to-Root Relationships in Two Tomato Genotypes. Plant Physiol. Biochem. 2018, 128, 24–31. [Google Scholar] [CrossRef]
  80. Rigano, M.M.; Arena, C.; Di Matteo, A.; Sellitto, S.; Frusciante, L.; Barone, A. Eco-Physiological Response to Water Stress of Drought-Tolerant and Drought-Sensitive Tomato Genotypes. Plant Biosyst. 2016, 150, 682–691. [Google Scholar] [CrossRef]
  81. Tahi, H.; Wahbi, S.; El Modafar, C.; Aganchich, A.; Serraj, R. Changes in Antioxidant Activities and Phenol Content in Tomato Plants Subjected to Partial Root Drying and Regulated Deficit Irrigation. Plant Biosyst. 2008, 142, 550–562. [Google Scholar] [CrossRef]
  82. Sánchez-Rodríguez, E.; Rubio-Wilhelmi, M.; Cervilla, L.M.; Blasco, B.; Rios, J.J.; Rosales, M.A.; Romero, L.; Ruiz, J.M. Genotypic Differences in Some Physiological Parameters Symptomatic for Oxidative Stress under Moderate Drought in Tomato Plants. Plant Sci. 2010, 178, 30–40. [Google Scholar] [CrossRef]
  83. Taylor, C.B. Proline and Water Deficit: Ups, Downs, Ins, and Outs. Plant Cell 1996, 8, 1221. [Google Scholar] [CrossRef]
  84. Liang, X.; Zhang, L.; Natarajan, S.K.; Becker, D.F. Proline Mechanisms of Stress Survival. Antioxid. Redox Signal 2013, 19, 998–1011. [Google Scholar]
  85. Alvarez, M.E.; Savouré, A.; Szabados, L. Proline Metabolism as Regulatory Hub. Trends Plant Sci. 2022, 27, 39–55. [Google Scholar]
  86. Ghosh, U.K.; Islam, M.N.; Siddiqui, M.N.; Cao, X.; Khan, M.A.R. Proline, a Multifaceted Signalling Molecule in Plant Responses to Abiotic Stress: Understanding the Physiological Mechanisms. Plant Biol. 2022, 24, 227–239. [Google Scholar] [PubMed]
  87. Jureková, Z.; Németh-Molnár, K.; Paganová, V. Physiological Responses of Six Tomato (Lycopersicon esculentum Mill.) Cultivars to Water Stress. J. Hortic. For. 2011, 3, 294–300. [Google Scholar]
  88. Patanè, C.; Scordia, D.; Testa, G.; Cosentino, S.L. Physiological Screening for Drought Tolerance in Mediterranean Long-Storage Tomato. Plant Sci. 2016, 249, 25–34. [Google Scholar] [CrossRef]
  89. Patanè, C.; Cosentino, S.L.; Romano, D.; Toscano, S. Relative Water Content, Proline, and Antioxidant Enzymes in Leaves of Long Shelf-Life Tomatoes under Drought Stress and Rewatering. Plants 2022, 11, 3045. [Google Scholar] [CrossRef]
  90. Gomes, F.P.; Oliva, M.A.; Mielke, M.S.; Almeida, A.A.F.; Aquino, L.A. Osmotic Adjustment, Proline Accumulation and Cell Membrane Stability in Leaves of Cocos Nucifera Submitted to Drought Stress. Sci. Hortic. 2010, 126, 379–384. [Google Scholar] [CrossRef]
  91. Szabados, L.; Savouré, A. Proline: A Multifunctional Amino Acid. Trends Plant Sci. 2010, 15, 89–97. [Google Scholar]
  92. Barickman, T.C.; Simpson, C.R.; Sams, C.E. Waterlogging Causes Early Modification in the Physiological Performance, Carotenoids, Chlorophylls, Proline, and Soluble Sugars of Cucumber Plants. Plants 2019, 8, 160. [Google Scholar] [CrossRef]
  93. Tian, L.; Bi, W.; Liu, X.; Sun, L.; Li, J. Effects of Waterlogging Stress on the Physiological Response and Grain-Filling Characteristics of Spring Maize (Zea mays L.) under Field Conditions. Acta Physiol. Plant 2019, 41, 63. [Google Scholar] [CrossRef]
  94. Yin, J.; Niu, L.; Li, Y.; Song, X.; Ottosen, C.O.; Wu, Z.; Jiang, F.; Zhou, R. The Effects of Waterlogging Stress on Plant Morphology, Leaf Physiology and Fruit Yield in Six Tomato Genotypes at Anthesis Stage. Veg. Res. 2023, 3, 31. [Google Scholar] [CrossRef]
  95. Liu, C.; Lan, C.; Li, C.; Li, C.; Huang, J. Exogenous Spermidine and Calcium Alleviate Waterlogging Stress in Cherry Tomato at the Seedling Stage. Sci. Hortic. 2023, 307, 111504. [Google Scholar] [CrossRef]
  96. Fujita, M.; Hasanuzzaman, M. Approaches to Enhancing Antioxidant Defense in Plants. Antioxidants 2022, 11, 925. [Google Scholar] [CrossRef]
  97. Kuscu, H.; Turhan, A.; Ozmen, N.; Aydinol, P.; Demir, A.O. Optimizing Levels of Water and Nitrogen Applied through Drip Irrigation for Yield, Quality, and Water Productivity of Processing Tomato (Lycopersicon esculentum Mill.). Hortic. Environ. Biotechnol. 2014, 55, 103–114. [Google Scholar] [CrossRef]
  98. Patanè, C.; Siah, S.; Pellegrino, A.; Cosentino, S.L.; Siracusa, L. Fruit Yield, Polyphenols, and Carotenoids in Long Shelf-Life Tomatoes in Response to Drought Stress and Rewatering. Agronomy 2021, 11, 1943. [Google Scholar] [CrossRef]
  99. Cerasola, V.A.; Perlotti, L.; Pennisi, G.; Orsini, F.; Gianquinto, G. Potential Use of Superabsorbent Polymer on Drought-Stressed Processing Tomato (Solanum Lycopersicum L.) in a Mediterranean Climate. Horticulturae 2022, 8, 718. [Google Scholar] [CrossRef]
  100. Millones-Chanamé, C.E.; de Oliveira, A.M.S.; de Castro, E.M.; Maluf, W.R. Inheritance of Blossom End Rot Resistance Induced by Drought Stress and of Associated Stomatal Densities in Tomatoes. Euphytica 2019, 215, 120. [Google Scholar]
  101. Molefe, R.R.; Amoo, A.E.; Babalola, O.O. Communication between Plant Roots and the Soil Microbiome; Involvement in Plant Growth and Development. Symbiosis 2023, 90, 231–239. [Google Scholar] [CrossRef]
  102. Mhete, M.; Eze, P.N.; Rahube, T.O.; Akinyemi, F.O. Soil Properties Influence Bacterial Abundance and Diversity under Different Land-Use Regimes in Semi-Arid Environments. Sci. Afr. 2020, 7, e00246. [Google Scholar] [CrossRef]
  103. Ling, N.; Wang, T.; Kuzyakov, Y. Rhizosphere Bacteriome Structure and Functions. Nat. Commun. 2022, 13, 836. [Google Scholar] [CrossRef] [PubMed]
  104. Kalam, S.; Basu, A.; Ahmad, I.; Sayyed, R.Z.; El-Enshasy, H.A.; Dailin, D.J.; Suriani, N.L. Recent Understanding of Soil Acidobacteria and Their Ecological Significance: A Critical Review. Front. Microbiol. 2020, 11, 580024. [Google Scholar] [CrossRef] [PubMed]
  105. Fan, W.; Tang, F.; Wang, J.; Dong, J.; Xing, J.; Shi, F. Drought-Induced Recruitment of Specific Root-Associated Bacteria Enhances Adaptation of Alfalfa to Drought Stress. Front. Microbiol. 2023, 14, 1114400. [Google Scholar] [CrossRef]
  106. Hazarika, S.N.; Thakur, D. Actinobacteria. Benef. Microbes Agro-Ecol. Bact. Fungi 2020, 21, 443–476. [Google Scholar] [CrossRef]
  107. Simmons, T.; Styer, A.B.; Pierroz, G.; Gonçalves, A.P.; Pasricha, R.; Hazra, A.B.; Bubner, P.; Coleman-Derr, D. Drought Drives Spatial Variation in the Millet Root Microbiome. Front. Plant Sci. 2020, 11, 518243. [Google Scholar] [CrossRef]
  108. Mukhtar, S.; Mehnaz, S.; Malik, K.A. Microbial Diversity in the Rhizosphere of Plants Growing under Extreme Environments and Its Impact on Crop Improvement. Environ. Sustain. 2019, 2, 329–338. [Google Scholar] [CrossRef]
  109. Huber, K.J.; Vieira, S.; Sikorski, J.; Wüst, P.K.; Fösel, B.U.; Gröngröft, A.; Overmann, J. Differential Response of Acidobacteria to Water Content, Soil Type, and Land Use During an Extended Drought in African Savannah Soils. Front. Microbiol. 2022, 13, 750456. [Google Scholar] [CrossRef]
  110. Kuzyakov, Y. Sources of CO2 Efflux from Soil and Review of Partitioning Methods. Soil. Biol. Biochem. 2006, 38, 425–448. [Google Scholar] [CrossRef]
  111. Chen, L.F.; He, Z.B.; Wu, X.R.; Du, J.; Zhu, X.; Lin, P.F.; Tian, Q.Y.; Kong, J.Q. Linkages between Soil Respiration and Microbial Communities Following Afforestation of Alpine Grasslands in the Northeastern Tibetan Plateau. Appl. Soil. Ecol. 2021, 161, 103882. [Google Scholar] [CrossRef]
Figure 1. Leaf gas exchange parameters of plants under different irrigation regimes. Stomatal conductance, gs (mmol m−2 s−1); transpiration rate, E (mmol m−2 s−1); sub-stomatal CO2 concentration, Ci (µmol mol−1). Bars are mean ± SE (n = 3). Different letters indicate significantly different values at p < 0.05 according to Tukey’s test.
Agronomy 15 00915 g001
Figure 2. Cross-section of the tomato leaf blade (typical structure of dorsoventral leaves): (A) WD (water deficit irrigation regime); (B) WO (water optimal irrigation regime); (C) WE (water excess irrigation regime). Legend: e = epidermis; pa = palisade tissue; sp = spongy tissue.
Agronomy 15 00915 g002
Figure 3. Tomato fruit yields (BER: blossom end rot; green; marketable; rotten; and total) (A) and size (B) according to water regime. Bars are mean value ± SE (n = 3). Different letters for each type of fruit yield indicate statistically significant differences at the p < 0.05 level by Tukey’s test.
Agronomy 15 00915 g003
Figure 4. Biplot relative to the principal component analysis carried out on the agronomical parameters and representing the five most impacting variables.
Agronomy 15 00915 g004
Figure 5. Alpha diversity indexes calculated in different samples. WE: water excess; WD: water deficit; WO: water optimal; SWP: soil without plant.
Agronomy 15 00915 g005
Figure 6. Relative abundance of taxa based on 16S rRNA amplicon sequencing; only bacterial taxa with a cumulative abundance above 0.5% in each taxonomic level are shown. (A) Phylum level; (B) class level; (C) order level.
Agronomy 15 00915 g006
Figure 7. Principal coordinate analysis (PCoA) plot, showing the distribution of microbial taxa (small circles) and samples (large pink circles). Taxa are color-coded by class, highlighting the spatial distribution of bacterial orders within the ordination space.
Agronomy 15 00915 g007
Figure 8. Heatmap showing the Spearman correlation between soil samples (A) or bacterial taxonomic composition (y-axis) and soil metabolic activity (B), based on the substrate utilization intensity (x-axis). Dendrograms indicate the hierarchical clustering of both sample/taxa and substrate utilization patterns.
Agronomy 15 00915 g008
Figure 9. Soil respiration trend within experimental rows under different irrigation regimes. Different letters indicate significant between samples at the same time of measurement at p < 0.05 by Tukey’s post hoc test.
Agronomy 15 00915 g009
Figure 10. Correlation matrix of the most relevant variables analyzed in this study (the Simpson diversity index is calculated at the phylum taxonomy level). The upper part of the matrix shows the Pearson coefficient; the diagonal shows the frequency distribution of each variable; the lower part shows the correlation of a pair of variables.
Agronomy 15 00915 g010
Table 1. Physico-chemical properties of the soil.
Organic matter19.6 g·kg−1
pH8.2
Total N1.14 g·kg−1
Assimilable P (P2O5)26 mg·kg−1
Exchangeable K 0.3 meq kg−1
Table 2. Area of epidermis cells and ratios in length of the mesophylls of leaves under different water regimes.
Irrigation Level Upper Epidermis Cell Area (µm2)Palisade Tissue (%)Spongy Tissue (%)
WD634.68 ± 52.35 a32.12 ± 0.75 b67.88 ± 0.75 b
WO405.04 ± 48.59 b27.72 ± 0.86 c72.29 ± 0.86 a
WE619.73 ± 78.97 a37.98 ± 1.31 a62.02 ± 1.31 c
Data are reported in mean ± SE. Different letters within the same sampling indicate statistically significant differences at the p < 0.05 level by Tukey’s post hoc test.
Table 3. Chlorophyll and Carotenoids in tomato leaves at different irrigation levels.
IrrigationChl aChl bChl totCar
WD7.27 ± 0.37 b2.78 ± 0.16 b10.05 ± 0.53 b2.02 ± 0.06 b
WO7.87 ± 0.19 b2.87 ± 0.09 b10.74 ± 0.28 b2.19 ± 0.07 ab
WE9.58 ± 0.27 a3.46 ± 0.09 a13.03 ± 0.32 a2.37 ± 0.08 a
Chlorophyll a (Chl a), chlorophyll b (Chl b), total chlorophyll (Chl tot), and Carotenoids (Cars) (mg g-1 DW). Data are reported in mean ± SE (n = 3). Different letters within the same sampling indicate statistically significant differences at the p < 0.05 level by Tukey’s post hoc test.
Table 4. Chemical characterization of leaf samples at different irrigation levels.
IrrigationTPCDPPHProlineMDA
WD2.98 ± 0.21 a26.39 ± 1.52 b0.85 ± 0.03 a3.84 ± 0.09 a
WO2.56 ± 0.24 ab40.53 ± 3.96 a0.47 ± 0.07 b3.15 ± 0.30 a
WE1.88 ± 0.07 b41.50 ± 0.10 a0.81 ± 0.06 a3.42 ± 0.22 a
TPC, total polyphenol content (mg/g DW); DPPH (µM Trolox equivalent/g DW); MDA, Malondialdehyde (nmol/ g FW); Proline (µmol/g FW). Data are reported in mean ± SE (n = 3). Different letters within the same sampling indicate statistically significant differences at the p < 0.05 level by Tukey’s post hoc test.
Disclaimer/Publisher’s Note: The statements, opinions and data contained in all publications are solely those of the individual author(s) and contributor(s) and not of MDPI and/or the editor(s). MDPI and/or the editor(s) disclaim responsibility for any injury to people or property resulting from any ideas, methods, instructions or products referred to in the content.