Abstract
(1) Background: Excessive nitrogen (N) fertilizer application in tea plantations leads to challenges such as soil acidification and nitrogen loss, impending the sustainable development of the plantation system. Yet, there is a lack of research on blended fertilization strategies, and limited data regarding N loss when substituting with organic fertilizer. (2) Methods: A year-long field monitoring experiment was conducted to evaluate the effects of substituting compound fertilizer with organic fertilizer, specifically with respect to runoff N loss and uptake of chemical fertilizer N by tea trees. (3) Results: The annual runoff N loss ranged from 0.16 to 0.57 kg·hm−2 and accounted for a mere 0.22–0.48% of N from fertilizer applications. Substitution with organic fertilizer reduced runoff N loss by 21–53% and improved the tea tree utilization efficiency of chemical fertilizer N from 16% to 27%. A 50% organic fertilizer substitution (based on the amount of N) promoted a net soil N mineralization rate, creating an ammonium-rich environment favored by tea trees. (4) Conclusions: The positive effects of partially substituting N fertilizer with organic fertilizer in tea plantation systems on both N utilization efficiency and N loss were confirmed. If conditions permit, the study team would aim to expand the temporal scope of the study, and to investigate the impact of organic fertilizer substitution on N loss under various precipitation intensities.
1. Introduction
The cultivation of tea tree crops is a prominent agricultural specialty on sloped farmland in the hilly terrain surrounding the Taihu Basin [1]. Since 2010, the selling price of tea from this region has been rising, thanks to its use by commercial brands and national geographical indications. Data from Suzhou City shows that the average productive value for tea exceeded 90,000 CNY per hectare in 2021, demonstrating the higher economic value of tea as compared to other crops, such as fruits and vegetables [2]. Within the tea industry, tea leaves are a commodity raw material; therefore, high yields of high quality tea leaves are a prerequisite for favorable economic returns. The role of fertilizer in enhancing tea yield is sufficient and self-evident [3,4]. Within the industry, much focus is invested into the leaf buds and young leaves of tea trees; as a result, tea tree cultivation fosters a high demand for nitrogen (N). Additionally, these crops are quite sensitive to N fertilizer [5,6]. Consequently, the application of N fertilizer significantly impacts both tea yield and tea quality [7,8]. Previous research data has indicated that over 30% of tea plantation management relies on the excessive application of chemical fertilizers to boost yield, leading to a widespread nutrient imbalance within the tea plantation system [9]. Annually, Chinese tea plantations apply an average of 533 kg·ha−1 of N per year (with individual plantation values ranging between 0 and 1200 kg·ha−1 of N), far exceeding the necessary amount for tea growth [8,10]. Therefore, it is widely acknowledged that tea plantations exhibit low fertilizer utilization efficiency [11]. Given the preference of tea trees for ammonium-N as a fertilizer, farmers predominantly choose urea and ammonium-based fertilizers as their primary N fertilizer. However, the absorption of ammonium-N by tea trees, along with subsequent nitrification processes, both result in the release of H+ ions into plantation soil, thereby accelerating soil acidification within the tea plantation system [12,13,14,15]. Less than half (43.9%) of tea plantations maintain a soil pH within the recommended range for optimum tea tree cultivation [16,17]. Moreover, according to the “Second National Pollution Source Census Bulletin”, tea plantations and fruit orchards are classified as ‘garden’ type plantations, with a designated N loss coefficient of 2.78% in the Taihu Basin [18]. This indicates that approximately 2.78% of N from fertilizer used in tea plantations is considered to be lost into the environment. The above mentioned challenges pose a threat to the long-term sustainability of tea plantation systems [12,19,20,21]. These challenges are particularly pronounced on sloped farmlands, where N loss often coincides with the occurrence of soil erosion, thereby presenting subsequent environmental risks.
Compound fertilizers and urea, which have a higher total nutrient content than organic fertilizers, continue to serve as the main sources of N in tea plantation systems. In comparison, organic fertilizer accounts for less than 30% of overall nutrient input [20]. There is a dearth of current research on variations in fertilization strategies within tea plantation systems, leading to an ambiguous understanding of nutrient inputs among farmers and resulting in significant individual discrepancies in regards to the use of organic fertilizer [10,20]. Moreover, the advanced age of tea plantation owners is another contributing factor, considering that most tea plantations in the Taihu Basin are situated on sloped farmland [22,23]. Due to the unavailability of slope-specific equipment, the application of organic fertilizer on slopes poses greater challenges as compared to the application of compound fertilizer. Previous studies conducted in crop and vegetable systems have demonstrated that the substitution of compound fertilizer with organic fertilizer can effectively mitigate N loss [20,24], creating a more suitable soil environment for microorganisms. This in turn enhances soil-based N transformation [25,26], ultimately leading to ongoing soil fertility [27]. Evidence supporting the impact of organic fertilizer substitution on maintaining soil N pool levels in the tea plantation system has been established [28]. Furthermore, the application of organic fertilizer in tea plantations has been proven to alleviate soil acidification [12,29], influence nitrogen transformation in the soil, and enhance N utilization efficiency, thereby resulting in better economic and environmental benefits [19].
Current research on N loss in tea plantations, particularly regarding substitution with organic fertilizers, primarily focuses on N concentration in runoff [4,30,31], while lacking sufficient data pertaining to the total amount of N loss incurred on an annual basis. In practical scenarios, when the water quality in river network systems underneath hills in the tea plantation region is affected by an excess of N, blame is often attributed to tea plantations due to a lack of quantified data on N loss. Therefore, it is of immense importance to quantify the impact of different fertilizer strategies (i.e., the substitution of compound fertilizer with organic fertilizer) on annual nitrogen loss from tea plantations in order to accurately predict the contribution of tea cultivation to changes in water quality in mixed farming regions.
Given this background, the Tianwangwu tea plantation (located in Jinting Town, Wuzhong District, Suzhou City, China) was selected as the region of interest, and the present study aimed to investigate variations in N utilization efficiency and N loss under different conditions of partial or full N input substitution with organic fertilizers. This study investigated the impact of annual fertilizer application on N loss in runoff pathways, utilized 15 N-urea tracer to clarify the role of organic fertilizer substitution in reducing N loss and in nitrogen loss from fertilizer sources, and predicted the nitrogen uptake of tea trees by comparing soil nitrogen content between tea-tree-planted and non-planted areas. Furthermore, this study provided clarified evidence on the enhancement of N utilization efficiency and reduction in N loss via the substitution of chemical fertilizer with organic fertilizer, thereby offering valuable data-based support for the formulation of sustainable green production and agricultural practices for tea plantations located on sloped farmland within the Taihu Basin.
2. Materials and Methods
2.1. Site Description
2.1.1. Climatic Conditions
This study was carried out in Tianwangwu tea plantation, Jinting Town, Wuzhong District, Suzhou City, Jiangsu Province, China (31°08′14″ N, 118°51′48″ E). This region exhibits a typical northern subtropical humid monsoon climate, also influenced by the microclimate of the surrounding Taihu Lake water body. The climate could be characterized as having abundant precipitation and sufficient sunshine. The annual mean temperature is approximately 16 °C, with the annual precipitation levels ranging between 1000 and 1500 mm. The study’s experimental plots were established in the tea farm with a slope angle ranging from 9.0° to 9.2°, while the thickness of the cultivated soil layer was only 40 to 60 cm.
2.1.2. Soil Condition
The Tianwangwu tea farm has been a site for tea cultivation for more than a hundred years and has only begun to engage in chemical fertilizer usage within the past three decades. In certain regions, tea farm owners have implemented fertilizer transport tracks, while some elevated regions are equipped with integrated water and fertilizer facilities. The soil properties are listed in Table 1.

Table 1.
Properties of soil.
2.2. Experimental Design
2.2.1. Experiment
Based on preliminary research conducted in the Wuzhong District tea plantation system, the level of N application in tea plantations ranged from 0 to 240 kg·hm−2 (calculated as N), with a mean value of near 150 kg·hm−2. The substitution rate with organic fertilizer ranged from 22% to 43% [20]. In order to incentivize large-scale tea farm owners who have the means to transport fertilizer to sloped farmland, the local agricultural department subsidize organic fertilizer usage, aiming to enhance the rate of organic fertilizer substitution. This study implemented treatments with a 50% and 100% proportion of organic fertilizer substitution, with proportions being calculated according to the amount of N contained in the fertilizer. To address the issue of soil acidification impacting tea tree growth in the long run, a treatment with biochar addition (0.3% w/w of topsoil weight) was also set (Table 2). These treatments were universally applied in both tea-tree-planted and non-planted micro-zones, enabling a comparison of soil nitrogen content under different planting conditions. This experiment spanned one year, from 1 November 2022 to 31 October 2023.
Table 2.
Detail of treatments.
2.2.2. Plots
In October 2022, 15 experimental plots [each 1.5 m (horizontal) × 10 m (vertical) in size] were established for the five treatments in three replications mentioned above, based on tea planting density. These plots were constructed using welded stainless steel plates that were trenched underneath to a depth of 40 cm for separation (see Figure 1a). A runoff convergence area was constructed at the foot of each experimental plot using sand and gravel, which were intended to facilitate physical filtration. Additionally, a 25 L runoff collection bucket was buried at the periphery of each experimental plot for filtered runoff liquid collection (blue circle in Figure 1b). Measurement of the estimated amount of N uptake by tea trees was conducted through a comparison of soil nitrogen content between tea-tree-planted areas and non-planted areas. For this specific purpose, plots of bare land, measuring 0.5 m × 0.5 m, at the foot end of each experimental plot were demarcated as non-planted control group micro-zones. These micro-zones were enclosed on three sides by buried stainless steel plates, trenched to a depth of 40 cm below the ground (orange frames in Figure 1b), effectively isolating the root systems of the tea trees from absorbing nutrients within these micro-zones while also allowing proper runoff drainage.
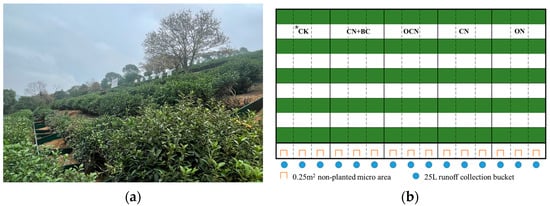
Figure 1.
Layout of the experiment plots: (a) Actual view; (b) Diagram of different treatments in the test plot. * CK represents the treatment with N control; CN + BC represents the treatment with the N input all from chemical fertilizer and 0.3% w/w biochar addition; OCN represents the treatment with 50% of N input from organic fertilizer and 50% of N from chemical fertilizer; CN represents the treatment with the N input all from chemical fertilizer; ON represents the treatment with the N input all from organic fertilizer.
2.2.3. Management
After establishing the experimental plots, desiccated branches and fallen leaves were removed from the surface layer of soil in their respective designated plots prior to the addition of biochar. The selected biochar was produced by Nanjing Qinfeng Straw Technology Co. (Nanjing, China) through wheat straw pyrolysis at 500 °C. The properties of the biochar are shown in Table S1. Considering the preference of tea trees for ammonium fertilizer [12,15], urea with 10.15% 15N abundance was chosen as the N fertilizer, with an application rate of 150 kg·hm−2 (calculated as N) in this experiment. The selected organic fertilizer (N-P2O5-K2O = 2.0%–1.1%–1.2%) was produced by Shandong Pangda Biological Group Ltd. (Heze, China) Phosphorus and potassium fertilizers were applied as basal fertilizer in all treatments, with phosphorus fertilizer (calcium superphosphate) application performed at 80 kg·hm−2 (calculated as P2O5) and potash fertilizer (potassium chloride) application also performed at 80 kg·hm−2 (calculated as K2O). The OCN and ON treatments were the only two treatments that involved the use of organic fertilizers, which naturally contain a certain amount of phosphorus and potassium. In order to balance the consistency of phosphorus and potassium in all treatments, any elemental deficiencies in the OCN and ON treatments were made-up using a single phosphorus and potassium fertilizer, respectively. Basal and additional fertilizer application occurred on 13 December 2022, and 20 February 2023, respectively. The experimental plots relied on natural precipitation as the primary water supply and no active irrigation practices were involved. In its harvesting period from mid-March to mid-April, the tea farm yielded high-quality Biluochun as its output.
2.3. Sampling, Testing and Calculations
2.3.1. Yield of Tea
Between 14 March and 10 April 2023, tea tree shoots (consisting of two rounds of young leaves and one round of leaf buds) were harvested in three rounds within the experimental area. The fresh yields of each treatment plot were individually quantified each time and then summed up. The fresh leaf yield of each treatment plot was determined through conversion of the measured area. Although Biluochun tea leaves are sold as dry matter, differences in processing techniques and leaf conditions bring about variable differences in the weight ratio of dry leaf vs. fresh leaf yield. To this end, in this study, fresh leaves were used for yield measurement to avoid the uncertainties caused by later processing.
2.3.2. Runoff
Runoff is initiated by precipitation events. When precipitation reaches a certain intensity or occurs for multiple consecutive days, runoff flowed into the collection bucket. All runoff in the collection bucket was extracted within one to three days following the end of precipitation. The volume of each collection bucket was recorded, and the runoff samples were collected after stirring and divided into four parts for chemical analysis replication. Mineral N content and total N content were tested for using a continuous-flow analyzer (Skalar Corp., Breda, The Netherlands). During the experimental period, there were four runoff events. The annual runoff water volume was calculated according to the volume and total N content of each runoff event [Equation (1)] and the average total N content of annual runoff [Equation (2)]. The annual N loss in the runoff pathway was the sum of the N loss of the four runoff events [Equations (3) and (4)]. The loss of mineral N was calculated the same way [Equations (5) and (6)]. The calculation of the ratio of mineral N in runoff pathway N loss is shown in Equation (8). The ratio of annual runoff pathway nitrogen losses to total N inputs is given in Equation (7).
NRk = cRNk × Vk ÷ S1 × S2 ÷ 106
MNRk = cMNk × Vk ÷ S1 × S2 ÷ 106
RNR = NR ÷ Ninput
RMN = MNR ÷ NR
2.3.3. Soil
After the initial collection of soil samples prior to the commencement of the experiment, subsequent soil sampling was conducted at fixed intervals (monthly) from the tillage layer in each treatment plot. At the end of the annual experiment, soil samples were collected from both the tillage layer of planted and non-planted areas. All soil samples were analyzed using three chemical analysis replications. They were extracted in a two mol·L−1 KCl solution, and the mineral N content of the soil was determined using a continuous-flow analyzer (Skalar Corp., Breda, The Netherlands), while the total N content was determined using an elemental analyzer (FlashSmart™, Thermo Scientific, Waltham, MA, USA).
2.3.4. 15N Abundance Testing
Only the CN, OCN, and CN + BC treatments had 15N urea added in this experiment. Therefore, measurements of 15N abundance and fertilizer N distribution were conducted only for the planted and non-planted soils that were under these three treatments.
At the end of the anniversary trial for these three treatments, soil samples were repeatedly rinsed using KCl solution and deionized water to remove the mineral N from them. The runoff samples, soil KCl leachate samples, and treated soil samples were pre-treated [32] separately. After that, 15N abundance was determined using an isotope mass spectrometer (MAT-251, Thermo Scientific, Waltham, MA, USA) and converted to N abundance in the runoff (Ar in %), planted soil mineral N (Apms in %), planted soil organic N (Apos in %), non-planted soil mineral N (Anms in %), and non-planted soil organic N (Ano in %s).
2.3.5. Calculation of Chemical Fertilizer N Distribution
Based on the measured 15N abundance, the amount of fertilizer N loss through the runoff pathway was calculated using Equations (9) and (10), and the remaining amount of fertilizer N in the soil in both mineral and organic states was calculated by Equations (11) and (12). The amount of fertilizer N used in tea tree uptake [Equation (15)] and the amount of fertilizer N lost through other routes [Equation (16)] were estimated by the difference between planted and non-planted micro areas. The natural abundance of 15N was taken as 0.366%. It was assumed that runoff N losses were the same in planted and non-planted areas of the same treatment.
where 15NRk represents the fertilizer N loss for the kth runoff event in kg·hm−2; 15NR represents total the runoff pathway fertilizser N loss in kg·hm−2; 15NSpm and 15NSnm refer to the amount of fertilizer N left in the soil as a mineral state in planted and non-planted areas, respectively, in kg·hm−2; MNp and MNn refer to the N content of soil in the mineral state in planted and non-planted areas, respectively, in mg·kg−1; m is the weight of soil per unit area of the ploughed layer, which is taken as 2.5 × 10⁶ kg·hm−2 here; 15NSpo and 15NSno refer to the amount of fertilizer N left in the soil in the organic state in planted and non-planted areas, respectively, in kg·hm−2; TNp and TNn refer to the total soil N content in planted and non-planted areas, respectively, in mg·kg−1; 15NT stands for the amount of fertilizer N absorbed and utilized by the plant (tea trees) in kg·hm−2; and 15NL represents the amount of fertilizser N loss throughby other routes in kg·hm−2.
15NRk = NRk × (Ar − 0.366%) ÷ 10.15%
15NSpm = MNp × m × (Apms − 0.366%) ÷ 10.15% ÷ 106
15NSpo = (TNp − MNp) × m × (Apos − 0.366%) ÷ 10.15% ÷ 106
15NSnm = MNn × m × (Anms − 0.366%) ÷ 10.15% ÷ 106
15NSno = (TNn − MNn) × m × (Anos − 0.366%) ÷ 10.15% ÷ 106
15NT = (15NSnm + 15NSno) − (15NSpm + 15NSpo)
15NL = Ninput − (15NSnm + 15NSno) − 15NR
2.3.6. Calculation of Soil Net N Mineralization Rates and Nitrification Potentials
Using aerobic incubation, the soil was replenished daily to 60% of the maximum water holding capacity and incubated at 25 °C with oxygen depletion for 56 days. Soil mineral N content was determined before and after incubation, and the net mineralization rate was calculated using Equation (17) [33]. Nitrification potential was determined using a rapid ammonia oxidation method. Soil nitrate-N content was plotted as a linear relationship with time, and the slope was calculated as the nitrification potential [33]:
where RMN represents the net soil N mineralization rate in mg·(kg·d)−1; MNaft and MNpre are the soil mineral N content after and before incubation, respectively, in mg·kg−1; and t is the incubation duration, set at 28 d in this experiment.
RMN = (MNaft − MNpre) ÷ t
2.4. Statistical Analysis
The significance of differences in N concentration, volume, and N loss in runoff (p < 0.05) was analyzed using Duncan’s multiple-range test (SPSS ver. 16.0 for Windows, SPSS Inc., Chicago, IL, USA) in this experiment. The correlation between runoff nitrogen concentration / loss and soil mineral nitrogen content was analyzed based on the most recent soil samples taken prior to the runoff event.
3. Results
3.1. Yield of Tea
The tea yield in the N control treatment (CK treatment) was significantly lower than that of the N-applied treatment, and ranged from 47% to 55%. However, there was no significant difference in the yield of Biluochun tea when equal N input conditions were applied to the treatments with different types of fertilizer (Figure 2).
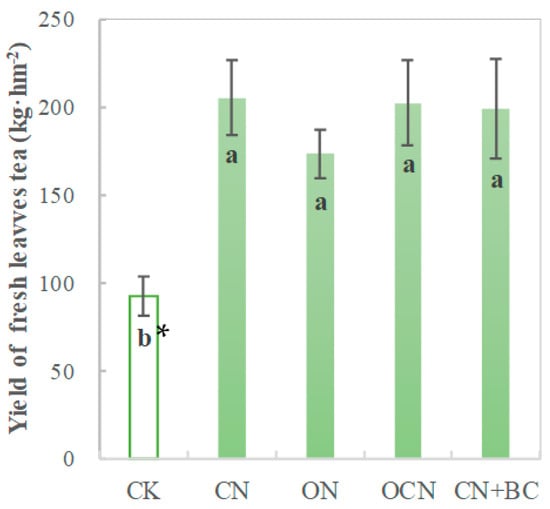
Figure 2.
Yield of Biluochun tea (fresh leaves). * Different lowercase letters indicate significant differences in the mean of the treatments with different fertilizer and N rates, determined by Duncan’s test (p < 0.05).
3.2. N Loss from Runoff
The runoff N concentrations ranged from 4.4 to 17.4 mg·L−1 under N application and from 2.4 to 4.7 mg·L−1 without N application. Substitution with organic fertilizer reduced runoff N concentration, but this reduction was only significant at 100% organic fertilizer substitution (ON treatment), decreasing runoff by 38% compared to pure chemical fertilizer (CN treatment) (Figure 3a). The treatment at 50% organic fertilizer substitution (OCN treatment) had similar runoff N concentrations to pure chemical fertilizer treatment, due to most runoff events occurring in the spring and summer after additional fertilizer application (chemical feritilizer was used as the additional fertilizer for OCN treatment). The addition of biochar (CN + BC treatment) did not reduce runoff N concentrations. It is evident that the application of chemical fertilizers during spring had a decisive impact on the N concentration In the runoff.
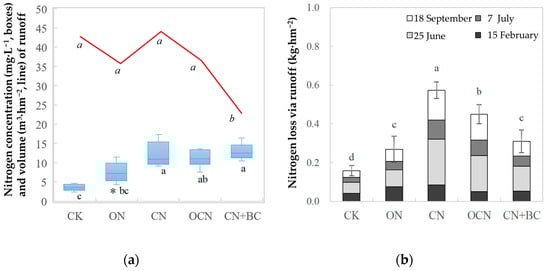
Figure 3.
N loss via runoff: (a) the N concentration and volume of runoff; (b) the amount of N loss via runoff. * Different lowercase letters indicate significant differences in the mean of the treatments with different fertilizer and N rates, determined by Duncan’s test (p < 0.05).
Since the intensity of precipitation in the short-term determines the volume of runoff, it varied widely, with a range of 3.3 to 17.5 m3·hm−2 (Figure S1). The volume of cumulative runoff loss was in the range of 22.6 to 46.4 m3·hm−2 in the anniversary year, i.e., an annual 2.3 to 4.6 mm water layer loss due to precipitation (Figure 3a). Given the absence of active irrigation practices in tea farm management, complete soil saturation by precipitation is necessary for triggering runoff, therefore imposing higher demands on both short-term precipitation intensity and cumulative precipitation and making triggering runoff more difficult. Organic fertilizer application reduced runoff volume by more than 17% per year, but not significantly. Biochar additions significantly reduced runoff volume by more than 35% (Figure 3a).
A total of four runoff events were recorded throughout the experimental period. The sample collection times and cumulative precipitation volumes for the last week before the collection were as follows: 15 February (56 mm), 25 June (263 mm), 17 July (133 mm), and 18 September (172 mm). Although fertilizer application took place in the winter and spring months, the runoff event that exhibited the highest N concentration values and greatest volume of runoff for a single event occurred in June. This shows that rainfall intensity plays a more critical role in runoff-induced N loss than distance from fertilizer application time in upland farmland environments.
N loss in the annual runoff pathway of the tea plantation ranged from 0.16 to 0.57 kg·hm−2 (Figure 3b) in this study, accounting for only 0.22 to 0.48% of the N input from fertilizer sources (Table 3). Both 50% and 100% organic fertilizer substitution (OCN and ON treatments) significantly reduced runoff pathway N losses compared to the pure chemical fertilizer treatment (CN treatment), with reductions of 21% and 53%, respectively (Figure 3b). Moreover, biochar addition significantly decreased N loss via the runoff pathway (46%). For most treatments, the mineral state was the dominant form of N in the runoff solution, comprising more than 80% (Table 3). When 100% organic fertilizer substitution was performed, the percentage of mineral N in the runoff flushed out by precipitation was significantly lower, and even higher than the percentage of N in the organic form in the no N condition (CK treatment).
Table 3.
Detail of N losses from runoff pathways and chemical fertilizer.
The percentage of chemical fertilizer-sourced N in the runoff N loss ranged from 38% to 55% (Table 3). Both organic fertilizer substitution and biochar addition reduced the proportion of chemical fertilizer-sourced N, but their pathways differed. In the case of 50% organic fertilizer substitution, the chemical N input for the OCN treatment was only half of that for the CN treatment. Despite a reduction in the percentage of chemical fertilizer-sourced N in the runoff N loss, the actual proportion of fertilizer N lost did not differ significantly (CN treatment 0.26%, OCN treatment 0.29%). On the other hand, biochar addition did not alter the amount of fertilizer N inputs, resulting in a reduction in both the percentage of chemical fertilizer-sourced N in the runoff N loss and the actual proportion of fertilizer N lost in runoff pathway. When the most recent soil mineral N content at the time of runoff occurrence was examined, it became evident that the mineral N concentration in runoff is closely related to the soil mineral N content (Figure 4a). While 100% organic fertilizer substitution did reduce soil mineral N content for a more extended period, the content fluctuated more compared to soil under purely chemical fertilizer application. Biochar addition helped stabilize soil mineral N content to some extent compared to the pure fertilizer treatment. However, soil mineral N content did not correlate well with the amount of mineral N lost in a single runoff event (Figure 4b). Under similar soil mineral content conditions, biochar addition reduced the loss of mineral N in runoff, whereas the effect of organic fertilizer substitution on the loss of mineral N in runoff was uncertain.
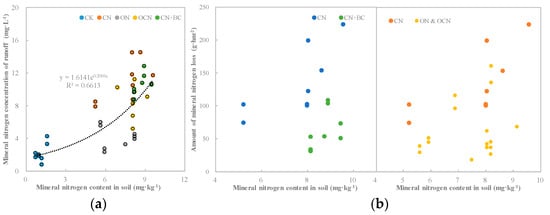
Figure 4.
Correlation between soil mineral N and runoff N loss: (a) Runoff mineral N concentration vs. soil mineral N content; (b) amount of mineral N loss vs. soil mineral N content.
3.3. Distribution of Fertilizer N
It was estimated that annually, tea trees would absorb and utilize 16% to 27% of the fertilizer N (Figure 5). In comparison to the pure chemical fertilizer treatment, 50% organic fertilizer substitution enhanced the utilization of fertilizer N by the tea trees (27% plant uptake in OCN treatment, 16% in CN treatment) and the assimilation of fertilizer-source N by the soil microbes (1.4% of the soil organic state N in the OCN treatment, 0.32% in the CN treatment). This corresponded to a substantial reduction in N loss through other routes (25% losses via other routes in OCN treatment, 33% in CN treatment). While promoting the utilization of fertilizer N by tea trees (22% in CN + BC treatment), biochar addition significantly increased the proportion of fertilizer N remaining in the soil in the mineral state (67% of soil mineral N in CN + BC treatment and 50% in CN treatment) and decreased N loss via the runoff and other routes to 46% and 33%, respectively, in pure chemical fertilizer treatment.
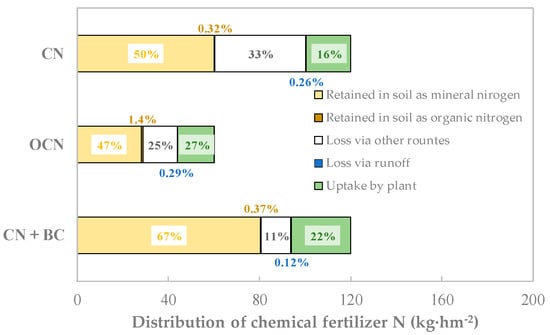
Figure 5.
Distribution of N from chemical fertilizer.
3.4. Soil N Transformations
Based on post-harvest soil, it was found that 50% organic fertilizer substitution significantly increased the rate of net N mineralization compared to the pure chemical fertilizer treatment (Table 4). However, 100% organic fertilizer substitution did not show a significant effect on the rate of net N mineralization, and also reduced the nitrification potential of the soil. Under pure chemical fertilizer conditions, biochar addition significantly promoted both the rate of net N mineralization and the nitrification potential.
Table 4.
Soil net N mineralization and nitrification potential.
4. Discussion
4.1. Effect on Yield and N Utilization of Tea
N, as the most important nutrient element supplying the growth of young tea leaves, has a crucial impact on tea yield [3,4,8,34]. It is worth mentioning that the annual N fertilizer application (0~240 kg·hm−2) in the area where the experiment was conducted was at a low level compared to other areas among the green tea producing regions in China [10,20].
Appropriately increasing the rate of N fertilizer application should result in higher tea yields and returns. Accordingly, it is perplexing as to why farmers have not taken this approach. This question was brought to light during preliminary research on fertilizer application in this region. It has been observed that the harvest of Biluochun tea is targeted towards buds and young leaves as the yield, rather than big leaves. The maximum yield of this tea occurs when there is an optimal output of new young leaves within a fixed time period (mid-March to May). Excessive application of N fertilizer would accelerate the growth of new buds and young leaves into large leaves. This would hamper efforts to extend the harvesting period to obtain a higher standard biomass under labor-limited conditions. Taking this into account, the annual N fertilizer application rate in this experiment was determined to be the average value of 150 kg·hm−2 applied by local farmers as a reflection of the actual production situation in the region. Furthermore, this study did not observe a significant impact on the current year’s tea leaf yield (Figure 1) as a result of organic fertilizer substitution, despite several previous studies demonstrating a positive association between organic fertilizer substitution and tea leaf yield [28,34,35].
The period of this experiment was only one year, which may be one of the reasons for the results acquired, but a deeper look into the pathways of the effects of organic fertilizer on tea yield shows that these effects occur mainly due to the positive effects of organic fertilizer on soil pH and ammonium-N content [3,7]. Previous studies have found that proper application of organic fertilizer can improve soil acidification [35] and change the mineral N status of soils under acidifying conditions, at which point the soils are normally dominated by nitrate N [28,36]. Although the tea plantation where this experiment was conducted had been cultivated for a long time, the soil pH was still maintained above 4.5, which is a suitable soil pH condition for tea tree growth (the optimum soil pH for tea tree growth is between 4.0 and 5.5) [12,16,17]. Additionally, there was no significant difference in soil pH between treatments during the experiment and at the end of the experiment (Table S2). The soil ammonium-N content varied between treatments only for a short period after fertilizer application. The soil ammonium-N content was relatively similar most of the time under equal N input conditions, especially in the spring when the new shoots were promoted. This implies that organic fertilizer application in this experiment did not bring about significant changes in soil acidification and soil ammonium-N content, and subsequently failed to significantly affect tea yield.
However, it was estimated that fertilizer N utilization efficiency was highest at 50% organic fertilizer substitution in this study (Figure 5). Because of the difficulty of sample collection, not much information is available on direct studies of N utilization efficiency by tea trees. Some studies have used the N carried away by the harvested part of the leaves as the utilized part for estimating the N flow of production output and concluded that the market demand for tea was the driving force affecting N flow output from tea plantations [37]. Based on N agronomic utilization efficiency, positive correlations with yield and economic return have been shown [19]. However, no matter how one goes about estimating the effective N output of tea trees, there is one conclusive consensus: the N utilization efficiency of tea systems is considered to be relatively low among crop systems [11]. Thus, increasing the N uptake of tea trees and improving the efficiency of chemical N utilization are factors of great significance in promoting green agricultural production. Previous studies on organic fertilizer substitution in field crops and vegetable systems have shown that 30% to 50% substitution with organic fertilizers significantly improves fertilizer N utilization efficiency [24], and that this is closely related to N transformation in the growing environment [38]. It is reasonable to believe that different fertilizer strategies affect N transformation and alter the availability of ammonium-N in soils, which is the most relevant form for N uptake by tea trees [34,35,36]. Previous studies have found a positive correlation between the rate of soil N mineralization and temperature [38], specifically showing that there is a significant interaction between soil temperature and moisture and soil N mineralization [39]. The application of organic fertilizer should have created better conditions for N mineralization in terms of maintaining soil moisture and temperature [40]. However, in this study, the rate of N mineralization was significantly lower in the 100% organic substitution condition than in the 50% substitution condition (Table 4). This may be explained by the higher C/N of the organic fertilizer we provided as a plant source, which inhibited N mineralization to some extent [41]. This change in soil N supply capacity due to organic fertilizer application has been found to often contribute to soil bacterial diversity [42]. It has also been speculated that there is the trade-off effect between the proportion of organic fertilizer substitution and soil N transformation. In this study, the 50% organic fertilizer substitution condition created a more favorable ammonium-N environment for tea growth, and also supported its role in enhancing the N utilization efficiency of tea.
4.2. Effect on N Loss via Runoff
N loss is determined by both runoff N concentration and runoff volume. The runoff samples obtained in this experiment exhibited high total N concentration, which was higher than Class V standards for surface water (both total N concentration and ammonium-N concentration should be less than 2 mg·L−1) [43]. With the exception of N control treatment and the 100% organic fertilizer treatment, mineral N was the predominant form of N in the runoff, accounting for more than 80%. The N concentration in runoff showed a significant decrease when the organic fertilizer substitution reached 100%. These results are consistent with previous studies [28,30,31]. The tracing of chemical fertilizer N confirmed that applied fertilizer N was an important source of runoff N (fertilizer-sourced N accounted for more than half of the N loss in the runoff pathway of the CN treatment, as shown in Table 2). Moreover, some studies have reported that the application of organic fertilizers has the potential to affect the N transformation process, as the nitrification capacity of organic fertilizers is lower than that of inorganic fertilizers [44]. This result was also reproduced in this experiment (Table 3). Organic fertilizer extends the residence time of ammonium-N by inhibiting the nitrification process [42], and ammonium is more favorable for adsorption by soil colloids [45,46] and uptake by tea trees [12] than nitrate-N. Furthermore, organic fertilizer application promoted the immobilization rates of ammonium-N, playing a positive role in retaining fertilizer N in the soil and consequently reducing the concentration of mineral N in the runoff [4,42]. While soil mineral N content exhibited a positive correlation with single runoff N concentration, it was not significantly correlated with single runoff N loss (Figure 4). This suggests that, in this study, the volume of an individual runoff event was a greater determining factor for the amount of N lost than the N concentration in the runoff. The actual monitoring results of this experiment showed that the annual N loss ranges from only 0.22% to 0.48% of the N input of the tea plantation due to the small runoff water volume, which is much lower than the N loss coefficient of tea plantations in the region as given by “the Second National Pollution Source Census Bullet” [18]. The cumulative precipitation in the region where this experiment was conducted during the monitoring period (November 2022–October 2023) reached 1300 mm, and daily precipitation exceeded 50 mm on five days, with two days exceeding 100 mm. This is considered a relatively normal rainfall year in the region, and therefore, the runoff data obtained in this study are indicative.
Data in this study showed that runoff events occurred only when cumulative precipitation reached 50 mm or more in a week. As confirmed by the previous studies, greater rainfall volumes always corresponded to a greater runoff volume [47,48]. In this experiment, the organic fertilizer substitution reduced the runoff volume by 15% (Figure 3), confirming the enhancement of soil water retention capacity by organic fertilizer [49,50]. Similarly, biochar significantly reduced runoff water volume by enhancing soil water holding capacity [51]. These findings imply that effective control of runoff water volume is crucial in mitigating losses via the runoff pathway.
5. Conclusions
This study monitored annual N loss and estimated N utilization efficiency from chemical fertilizer by tea trees under various conditions of organic fertilizer substitution. The following observations were made. (1) The N concentration of runoff in the tea plantation under fertilizer conditions was high (compared to that of Class V surface water). However, owing to the limited volume of runoff water, the annual N loss to runoff remained minimal, accounting for less than 0.5% of the input N from the fertilizers. (2) Compared to pure chemical fertilizer, substitution with organic fertilizer resulted in a significant reduction in N loss through runoff. Moreover, the addition of biochar effectively decreased the proportion of nitrogen loss from fertilizers. (3) Partial substitution with organic fertilizers enhanced the N utilization efficiency of chemical fertilizer by tea trees and promoted the assimilation of chemical-fertilizer-sourced N by soil microorganisms as compared to sole reliance on chemical fertilizers. (4) Under optimal soil pH conditions, substitution with organic fertilizers could promote N mineralization in soil and establish an advantageous ammonium-N environment for tea tree growth. (5) This study provides important practical insights into implementing organic fertilizer substitution in sloped farmland tea plantations. Future research should consider extending the time scale to validate the efficacy of nutrient utilization and runoff losses in tea plantations.
Supplementary Materials
The following supporting information can be downloaded at: https://www.mdpi.com/article/10.3390/agronomy14020392/s1, Figure S1: runoff volume for all treatments and events; Table S1: properties of the biochar; Table S2: pH of soils at the start and end of study.
Author Contributions
Y.Y.: conceptualization, methodology, formal analysis and drafting the work; Y.Z.: formal analysis; B.Y.: editing the work; C.Q.: methodology and drafting the work; Y.W.: formal analysis; T.C.: editing the work and funding acquisition; X.H.: formal analysis; L.Y.: review the work and funding acquisition; L.X.: review the work and funding acquisition. All authors have read and agreed to the published version of the manuscript.
Funding
This research was funded by the National Key Research and Development Project of China, grant number 2021YFD1700801.
Data Availability Statement
The datasets used and/or analyzed during the current study are available from the corresponding author on reasonable request.
Conflicts of Interest
The authors declare no conflict of interest.
References
- Li, J. Research on Coupling Characteristics between Soil Erosion and Topographic Fractal Ferture of Taihu Lake Basin. Master’s Thesis, Beijing Forestry University, Beijing, China, 2009. [Google Scholar]
- Tao, Y.Y.; Yu, M.H.; Ma, L.; Zha, J.F.; Qin, H.; Li, H.Y. Current situation and countermeasures of Biluochun tea industry in Suzhou City. J. Tea 2022, 48, 182–186. [Google Scholar]
- Huang, Z.J.; Wang, F.X.; Li, B.; Pang, Y.L.; Du, Z.Y. Appropriate nitrogen form and application rate can improve yield and quality of autumn tea with drip irrigation. Agronomy 2023, 13, 1303. [Google Scholar] [CrossRef]
- Wang, Z.T.; Geng, Y.B.; Liang, T. Optimization of reduced chemical fertilizer use in tea gardens based on the assessment of related environmental and economic benefits. Sci. Total Environ. 2020, 713, 136439. [Google Scholar] [CrossRef] [PubMed]
- Tang, S.; Liu, Y.L.; Zheng, N.; Li, Y.; Ma, Q.X.; Xiao, H.; Zhou, X.; Xu, X.P.; Jiang, T.M.; He, P. Temporal variation in nutrient requirements of tea (Camellia sinensis) in China based on QUEFTS analysis. Sci. Rep. 2020, 10, 1745. [Google Scholar] [CrossRef] [PubMed]
- Sedaghathoor, S.; Torkashvand, A.M.; Hashemabadi, D.; Kaviani, B. Yield and quality response of tea plant to fertilizers. Afr. J. Agric. Res. 2009, 4, 568–570. [Google Scholar]
- Ma, L.F.; Yang, X.D.; Shi, Y.Z.; Yi, X.Y.; Ji, L.F.; Cheng, Y.; Ni, K.; Ruan, J.N. Response of tea yield; quality and soil bacterial characteristics to long-term nitrogen fertilization in an eleven-year field experiment. Appl. Soil Ecol. 2021, 166, 103976. [Google Scholar] [CrossRef]
- Zhang, G.Q.; Sun, L.X.; Gu, J.R.; Dong, M.H.; Liu, T.F. Effects of fertilization on yield and quality of Biluochun tea cultivated in different tea-fruit intercropping plantations. Chin. Agric. Sci. Bull. 2018, 34, 59–64. [Google Scholar]
- Ni, K.; Liao, W.Y.; Yi, X.Y.; Niu, S.Y.; Ma, L.F.; Shi, Y.Z.; Zhang, Q.F.; Liu, M.Y.; Ruan, J.Y. Fertilization status and reduction potential in tea gardens of China. J. Plant Nutr. Fertil. 2019, 25, 421–432. [Google Scholar]
- Wu, Y.Z.; Li, Y.; Fu, X.Q.; Liu, X.L.; Shen, J.L.; Wang, Y.; Wu, J.S. Three-dimensional spatial variability in soil microorganisms of nitrification and denitrification at a row-transect scale in a tea field. Soil Biol. Biochem. 2016, 103, 452–463. [Google Scholar] [CrossRef]
- Balasubramanian, V.; Alves, B.; Aulakh, M.; Bekunda, M.; Cai, Z.; Drinkwater, L.; Mugendi, D.; van Kessel, C.; Oenema, O. Agriculture and the Nitrogen Cycle-Assessing the Impact of Fertilizer Use on Food Production and Environment; Island Press: Washington, DC, USA, 2004. [Google Scholar]
- Yang, X.D.; Ni, K.; Shi, Y.Z.; Yi, X.Y.; Zhang, Q.F.; Fang, L.; Ma, L.F.; Ruan, J.Y. Effects of long-term nitrogen application on soil acidification and solution chemistry of a tea plantation in China. Agric. Ecosyst. Environ. 2018, 252, 74–82. [Google Scholar] [CrossRef]
- Yan, P.; Shen, C.; Fan, L.C.; Li, X.; Zhang, L.P.; Zhang, L.; Han, W.Y. Tea planting affects soil acidification and nitrogen and phosphorus distribution in soil. Agric. Ecosyst. Environ. 2018, 254, 20–25. [Google Scholar] [CrossRef]
- Rothenberg, D.O.; Abbas, F.; Mei, X.; Yan, C.Y.; Zeng, Z.; Mo, X.L.; Chen, S.H.; Zhang, L.Y.; Huang, Y.H. Metabarcoding of organic tea (Camellia sinensis L.) chronosequence plots elucidates soil acidification-induced shifts in microbial community structure and putative function. Appl. Soil Ecol. 2022, 178, 104580. [Google Scholar] [CrossRef]
- Ruan, L.; Wei, K.; Wang, L.Y.; Cheng, H.; Wu, L.Y.; Li, H.L. Characteristics of free amino acids (the quality chemical components of tea) under spatial heterogeneity of different nitrogen forms in tea (Camellia sinensis) Plants. Molecules 2019, 24, 415. [Google Scholar] [CrossRef] [PubMed]
- Yan, P.; Wu, L.Q.; Wang, D.H.; Fu, J.Y.; Shen, C.; Li, X.; Zhang, L.P.; Zhang, L.; Fan, L.C.; Han, W.Y. Soil acidification in Chinese tea plantations. Sci. Total Environ. 2020, 715, 136963. [Google Scholar] [CrossRef] [PubMed]
- Zhang, X.Y.; Yin, T.Y.; Zhou, S.Q.; Hu, J. Current status of soil acidification in tea plantation in China’s tea planting provinces. Guishou Sci. 2022, 40, 81–85. [Google Scholar]
- Ministry of Ecology and Environment of the People’s Republic of China; National Bureau of Statistics; Ministry of Agriculture and Rural Affairs of the People’s Republic of China. The Second National Pollution Source Census Bulletin. Environ. Protect. 2020, 48, 8–10. [Google Scholar]
- Tang, S.; Fu, H.R.; Pan, W.K.; Zhou, J.J.; Xu, M.; Han, K.F.; Chen, K.J.; Ma, Q.X.; Wu, L.H. Improving tea (Camellia sinensis) quality, economic income, and environmental benefits by optimizing agronomic nitrogen efficiency: A synergistic strategy. Eur. J. Agron. 2023, 142, 126673. [Google Scholar] [CrossRef]
- Yu, Y.L.; Wang, Y.Z.; Yang, B.; Yang, L.Z.; Duan, J.J.; Han, X.M.; Xue, L.H. Effects of fertilizer application strategy adjustments on nitrogen and phosphorus loss from typical crop systems in Taihu Lake region. Environ. Sci. 2023, 44, 3902–3912. [Google Scholar]
- Gu, B.J.; Ju, X.T.; Chang, J.; Ge, Y.; Vitousek, P.M. Integrated reactive nitrogen budgets and future trends in China. Proc. Natl. Acad. Sci. USA 2015, 112, 8792–8797. [Google Scholar] [CrossRef]
- Yu, Y.L.; Hu, Y.; Gu, B.J.; Reis, S.; Yang, L.Z. Reforming smallholder farms to mitigate agricultural pollution. Environ. Sci. Pollut. Res. 2022, 29, 13869–13880. [Google Scholar] [CrossRef]
- Ren, C.C.; Zhou, X.Y.; Wang, C.; Guo, Y.L.; Diao, Y.; Shen, S.S.; Reis, S.; Li, W.Y.; Xu, J.M.; Gu, B.J. Ageing threatens sustainability of smallholder farming in China. Nature 2023, 616, 96–103. [Google Scholar] [CrossRef]
- Lin, S.F.; Pi, Y.J.; Long, D.Y.; Duan, J.J.; Zhu, X.T.; Wang, X.L.; He, J.; Zhu, Y.H. Impact of organic and chemical nitrogen fertilizers on the crop yield and fertilizer use efficiency of soybean-maize intercropping systems. Agriculture 2022, 12, 1428. [Google Scholar] [CrossRef]
- Liu, B.; Wang, X.Z.; Ma, L.; Chadwick, D.; Chen, X.P. Combined applications of organic and synthetic nitrogen fertilizers for improving crop yield and reducing reactive nitrogen losses from China’s vegetable systems: A meta-analysis. Environ. Pollut. 2021, 269, 116143. [Google Scholar] [CrossRef] [PubMed]
- Huang, R.; Wang, Y.Y.; Gao, X.S.; Liu, J.; Wang, Z.F.; Gao, M. Nitrous oxide emission and the related denitrifier community: A short-term response to organic manure substituting chemical fertilizer. Ecotox. Environ. Saf. 2020, 192, 110291. [Google Scholar] [CrossRef]
- Xu, X.T.; Bi, R.Y.; Song, M.X.; Dong, Y.B.; Jiao, Y.; Wang, B.X.; Xiong, Z.Q. Organic substitutions enhanced soil carbon stabilization and reduced carbon footprint in a vegetable farm. Soil Till. Res. 2024, 236, 105955. [Google Scholar] [CrossRef]
- Xie, S.W.; Yang, F.; Feng, H.X.; Yu, Z.Z.; Liu, C.S.; Wei, C.Y.; Liang, T. Organic fertilizer reduced carbon and nitrogen in runoff and buffered soil acidification in tea plantations: Evidence in nutrient contents and isotope fractionations. Sci. Total Environ. 2021, 762, 143059. [Google Scholar] [CrossRef]
- Zhen, H.Y.; Qiao, Y.H.; Ju, X.H.; Hashemi, F.; Knudsen, M.T. Organic conversion tea farms can have comparable economic benefits and less environmental impacts than conventional ones-A case study in China. Sci. Total Environ. 2023, 877, 162698. [Google Scholar] [CrossRef] [PubMed]
- Liu, Z.A.; Yang, J.P.; Yang, Z.C.; Zou, J.L. Effects of rainfall and fertilizer types on nitrogen and phosphorus concentrations in surface runoff from subtropical tea fields in Zhejiang, China. Nutr. Cycl. Agroecosyst. 2012, 93, 297–307. [Google Scholar] [CrossRef]
- Wang, R.; Zhang, J.; Cai, C.; Zhang, H. How to control nitrogen and phosphorus loss during runoff process?—A case study at Fushi Reservoir in Anji County (China). Ecol. Indic. 2023, 155, 111007. [Google Scholar] [CrossRef]
- Goerges, T.; Dittert, K. Improved diffusion technique for 15N: 14N analysis of ammonium and nitrate from aqueous samples by stable isotope spectrometry. Commun. Soil Sci. Plan. 1998, 29, 361–368. [Google Scholar] [CrossRef]
- Lu, R.K. Soil Agrochemical Analysis Methods; China Agricultural Science and Technology Press: Beijing, China, 2000. [Google Scholar]
- Liu, W.B.; Cui, S.Y.; Wu, L.T.; Qi, W.L.; Chen, J.H.; Ye, Z.Q.; Ma, J.W.; Liu, D. Effects of bio-organic fertilizer on soil fertility, yield, and quality of tea. J. Soil Sci. Plant Nutr. 2023, 23, 5109–5121. [Google Scholar] [CrossRef]
- Ye, J.H.; Wang, Y.H.; Kang, J.Q.; Chen, Y.L.; Hong, L.; Li, M.Z.; Jia, Y.; Wang, Y.C.; Jia, X.L.; Wu, Z.Y. Effects of long-term use of organic fertilizer with different dosages on soil improvement, nitrogen transformation, tea yield and quality in acidified tea plantations. Plants 2023, 12, 122. [Google Scholar] [CrossRef] [PubMed]
- Lin, S.; Liu, Z.J.; Wang, Y.C.; Li, J.Y.; Wang, G.G.; Zhang, W.; Wang, H.B.; He, H.B. Soil acidification associated with changes in inorganic forms of N reduces the yield of tea (Camellia sinensis). Arch. Agron. Soil Sci. 2023, 69, 1660–1673. [Google Scholar] [CrossRef]
- Hirono, Y.; Sano, T.; Eguchi, S. Changes in the nitrogen footprint of green tea consumption in Japan from 1965 to 2016. Environ. Sci. Pollut. Res. 2021, 28, 44936–44948. [Google Scholar] [CrossRef]
- Miller, K.S.; Geisseler, D. Temperature sensitivity of nitrogen mineralization in agricultural soils. Biol. Fertil. Soils 2018, 54, 853–860. [Google Scholar] [CrossRef]
- Li, Y.; Liu, Y.H.; Wang, Y.L.; Lei, N.; Xia, X.; Yu, Q.T. Interactive effects of soil temperature and moisture on soil N mineralization in a Stipa krylovii grassland in Inner Mongolia, China. J. Arid Land 2014, 6, 571–580. [Google Scholar] [CrossRef]
- Wei, J.; Li, Y. Effects of bioorganic fertilizer and high carbon base fertilizer on some soil quality indexes in forage fields. Pak. J. Agric. Sci. 2022, 59, 519–528. [Google Scholar]
- Shen, S.Z.; Wan, C.; Ma, X.J.; Hu, Y.K.; Wang, F.; Zhang, K.Q. Nitrogen mineralization characteristics of organic fertilizer in livestock and poultry under the condition of flood-drought rotation. J. Agric. Environ. Sci. 2021, 40, 2513–2520. [Google Scholar]
- Ji, L.F.; Wu, Z.D.; You, Z.M.; Yi, X.Y.; Ni, K.; Guo, S.W.; Ruan, J.Y. Effects of organic substitution for synthetic N fertilizer on soil bacterial diversity and community composition: A 10-year field trial in a tea plantation. Agric. Ecosyst. Environ. 2018, 268, 124–132. [Google Scholar] [CrossRef]
- State Environmental Protection Administration. GB3838; Environmental Quality Standards for Surface Water. Standardization Administration of China: Beijing, China, 2022.
- Koper, T.E.; Stark, J.M.; Habteselassie, M.Y.; Norton, J.M. Nitrification exhibits Haldane kinetics in an agricultural soil treated with ammonium sulfate or dairy-waste compost. FEMS Microbiol. Ecol. 2010, 74, 316–322. [Google Scholar] [CrossRef]
- Diana, G.; Beni, C.; Marconi, S. Organic and mineral fertilization: Effects on physical characteristics and boron dynamic in an agricultural soil. Commun. Soil Sci. Plan. 2008, 39, 1332–1351. [Google Scholar] [CrossRef]
- Liu, Z.Y.; Zhou, M.; Liao, W.F.; Liu, J.Y.; Luo, C.G.; Lu, C.Y.; Chen, Z.W.; Zhu, H.W. Fertilizer-holding performance of graphene on soil colloids based on double electric layer theory. Materials 2023, 16, 2578. [Google Scholar] [CrossRef] [PubMed]
- Wang, T.; Xiao, W.F.; Huang, Z.L.; Zeng, L.X. Interflow pattern govern nitrogen loss from tea orchard slopes in response to rainfall pattern in Three Gorges Reservoir Area. Agric. Water Manag. 2022, 269, 107684. [Google Scholar] [CrossRef]
- Zhang, J.; Xie, S.H.; Mo, M.H.; Tu, A.G.; Wu, J.Y. Characteristics of surface runoff and interflow output on red-soil slope under different rainfall patterns of natural rainfall conditions. Water Resour. Power 2017, 35, 18–21. [Google Scholar]
- Bulluck, L.R.; Brosius, M.; Evanylo, G.K.; Ristaino, J.B. Organic and synthetic fertility amendments influence soil microbial, physical and chemical properties on organic and conventional farms. Appl. Soil Ecol. 2002, 19, 147–160. [Google Scholar] [CrossRef]
- De Corato, U. Agricultural waste recycling in horticultural intensive farming systems by on-farm composting and compost-based tea application improves soil quality and plant health: A review under the perspective of a circular economy. Sci. Total Environ. 2020, 738, 139840. [Google Scholar] [CrossRef]
- Liu, C.; Wang, H.L.; Tang, X.Y.; Guan, Z.; Reid, B.J.; Rajapaksha, A.U.; Ok, Y.S.; Sun, H. Biochar increased water holding capacity but accelerated organic carbon leaching from a sloping farmland soil in China. Environ. Sci. Pollut. Res. 2016, 23, 995–1006. [Google Scholar] [CrossRef]
Disclaimer/Publisher’s Note: The statements, opinions and data contained in all publications are solely those of the individual author(s) and contributor(s) and not of MDPI and/or the editor(s). MDPI and/or the editor(s) disclaim responsibility for any injury to people or property resulting from any ideas, methods, instructions or products referred to in the content. |
© 2024 by the authors. Licensee MDPI, Basel, Switzerland. This article is an open access article distributed under the terms and conditions of the Creative Commons Attribution (CC BY) license (https://creativecommons.org/licenses/by/4.0/).