Article

A Novel Approach to Mapping the Spatial Distribution of Fruit Trees Using Phenological Characteristics

1
Guangzhou Institute of Geography, Guangdong Academy of Sciences, Guangzhou 510070, China
2
School of Civil Engineering and Geomatics, Shandong University of Technology, Zibo 255000, China
3
Maoming Meteorological Observatory of Guangdong Province, Maoming 525000, China
4
Key Laboratory of Land Surface Pattern and Simulation, Institute of Geographical Sciences and Natural Resources Research, Chinese Academy of Sciences, Beijing 100101, China
5
Satellite (SHANDONG) Technology Group Co., Ltd., Jinan 250031, China
6
GEOVIS Wisdom Technology Co., Ltd., Qingdao 266101, China
*
Authors to whom correspondence should be addressed.
These authors contributed equally to this work.
Agronomy 2024, 14(1), 150; https://doi.org/10.3390/agronomy14010150
Submission received: 29 November 2023 / Revised: 23 December 2023 / Accepted: 2 January 2024 / Published: 9 January 2024
(This article belongs to the Section Precision and Digital Agriculture)

Abstract

:
The lack of high-spectral and high-resolution remote sensing data is impeding the differentiation of various fruit tree species that share comparable spectral and spatial features, especially for evergreen broadleaf trees in tropical and subtropical areas. Here, we propose a novel decision tree approach to map the spatial distribution of fruit trees at a 10 m spatial resolution based on the growth stage features extracted from Sentinel-1A (S-1A) time-series synthetic aperture radar (SAR) data. This novel method was applied to map the spatial distribution of fruit trees in Maoming City, which is known for its vast cultivation of fruit trees, such as litchi, citrus, and longan. The results showed that the key to extracting information on the distribution of fruit trees lies in the fact that the fruit ripening and expansion period attenuates the information on the vegetation of fruit trees, a characteristic of the reproductive period. Under VH polarization, different fruit tree growth stage traits were more separable and easier to distinguish. The optimal features, such as H v (high valley value of the 14 May, 26 May, and 7 June SAR data), T b (difference between the 7 June and 14 January SAR data), Cr (high valley value of the 13 July, 25 July, and 6 August SAR data), and L o (high valley value of the 23 September, 17 October, and 11 November SAR data), were constructed based on the optimal window. The thresholds for these features were set to 1, 1, 1.5, and 1, respectively. The classification model can effectively distinguish different fruit trees and extract distribution information with overall accuracy (OA) of 90.34% and a Kappa coefficient of 0.84. The proposed method extracts the spatial distribution information of different fruit trees more accurately and provides a reference for the extraction of more tropical and subtropical species.

1. Introduction

With the extensive adjustment and optimization of the agricultural industrial structure, fruit trees have become one of the most important ways to increase incomes for farmers. Currently, the worldwide fruit tree planting area exceeds 64,859.3 thousand hectares and the production surpasses 887.027 million tons [1]. The fruit tree planting industry has become an essential component of agricultural production on a global scale [2]. Accurate and timely access to information on fruit tree planting areas is crucial for agricultural production [3]. Remote sensing is a valuable resource in terms of identifying and mapping fruit tree species at a large scale, especially in providing the growth stage information of fruit tree types [4,5].
Over the last two decades, the use of various optical remote sensing data for the identification and mapping of fruit tree species at different spatial resolutions has been reported [6,7]. MODIS and MERRA-2 data, with their high temporal and spectral resolutions, are commonly used in crop and forest mapping on a large scale [8,9]. However, the spatial resolution of MODIS and MERRA2 data is too coarse for fruit tree species identification in regions with highly fragmented fields [10,11]. Satellites such as Landsat 5/7/8, SPOT 5/6/7, and Sentinel-2 (S-2) can provide high-spatial-resolution data that are suitable for the accurate identification and mapping of fruit tree species in large areas [12,13]. The current remote sensing technology allows for the acquisition of high-resolution and multispectral imagery data through drones and satellites [14,15]. However, most fruit tree mapping methods used for the feature selection of classification algorithms are affected by the methods of observation (e.g., timing and frequency of cloud-free images acquired during fruit tree growing season). These methods were typically developed assuming that accurate and high-precision remote sensing data are available to describe the fruit tree phenology. However, optical remote sensing data, particularly high-spatial-resolution satellite data [9] (e.g., Landsat 5/7/8, SPOT 5/6/7, and S-2), are limited by the weather conditions (cloudy and rainy days) when characterizing the fruit tree phenology (i.e., specific phenology or time-series data of entire growing season) [10,16,17]. Even though UAV data are affected less by the weather conditions compared to satellites, their use in large areas is not feasible [18].
In addition, current methods of mapping fruit trees primarily rely on the spectral features and spatial features of fruit trees, which may not be the most optimal features for the identification of specific fruit tree species because of the comparable spectral and spatial features. To establish optimized features that preserve the classification accuracy and reduce the computational cost, various studies have reported optimal feature selection by different methods [19] (e.g., random forest, convolutional neural networks (CNNs), artificial neural networks (ANNs), extreme gradient boosting, recursive feature elimination [20,21]), which may result in varying optimal feature subsets for the same identification task. Numerous studies have shown that the random forest, CNN, and ANN methods have higher accuracy and better performance in classification [21]. However, as a nonparametric supervised learning approach for classification and regression problems, the decision tree has been proven more effective in distinguishing various types of vegetation [22]. The spatial structure of the orchards of evergreen fruit trees in tropical and subtropical regions is similar, and the variety of fruit tree species leads to similar visible spectral information, which can easily cause confusion and brings difficulties to the identification of fruit trees [23,24,25]. Therefore, the identification of perennial fruit trees requires the use of Sentinel-1 (S-1) data, and synthetic aperture radar (SAR) is highly sensitive to structural changes in the canopies of fruit trees [22]. The construction of backward scattering coefficient models for long time series under S-1 polarization conditions, the comparative analysis of the growth cycles of different fruit trees, and the search for their growth stage characteristics for identification [26,27] are important tasks. However, it may be challenging to distinguish different objects when they share similar backscattering characteristics [2]. In this case, a single piece of S-1 data would not be able to distinguish the different features; thus, there is a need to combine this with visible data and use the spectra of the two different data to differentiate between features that are easily intermixed under the same growth stage feature [28,29]. The mapping of fruit trees is significantly affected by the validity of observations, which must be available to accurately describe the fruit tree phenology. However, many fruit tree morphological characteristics in tropical and subtropical regions are similar, making it easy to confuse them with single-time data [17]. For the identification of different fruit trees, the most important aspect is to construct a long time series to find the key features and determine the optimal identification features according to the sensitivity of the growth stage under different polarizations [2].
C-band SAR data from S-1 are unaffected by cloudy and rainy conditions due to its high penetration and its ability to acquire data at nighttime, as well as its sensitivity to changes in vegetation structure, compared with optical remote sensing data [30,31]. Many studies have demonstrated the efficacy of using S-1 data to identify annual crops’ (e.g., soybean, corn, and rice) phenology [32,33,34,35]. Studies identifying the characteristics of perennial fruit trees’ phenology are rarely reported. Some researchers have demonstrated variations in fruit tree species with varying growth stage features. SAR is highly sensitive to structural changes in the canopies of fruit trees [36], providing a suitable basis for this study. Maoming City is located in the southern part of China, a region dominated by agriculture and planted with large areas of fruit trees (e.g., litchi, longan, and citrus orange, etc.). These fruit trees belong to subtropical evergreen broadleaf forests that share similar spatial and spectral features but vary significantly in their fruiting seasons, providing a suitable area for this study [37]. This study’s goals were two-fold: (1) to extract the key growth stage characteristics of typical fruit trees from microwave data; (2) to construct a fruit tree identification model appropriate for evergreen broadleaf trees in subtropical and tropical regions by utilizing these key growth stage features. In this study, we used Sentinel-1 long-time-series SAR data to construct the growth stage features of fruit trees. We analyzed and identified the optimal recognition features of litchi, longan, and citrus orchards based on the growth stage features. Then, we developed an improved method for the extraction of spatial distribution information of decision tree orchards by combining single classification recognition algorithms. The methodology can provide a point of reference for the retrieval of perennial fruit trees in tropical and subtropical areas, whilst offering essential technical assistance for the surveillance and meticulous administration of litchi plantations.

2. Materials and Methods
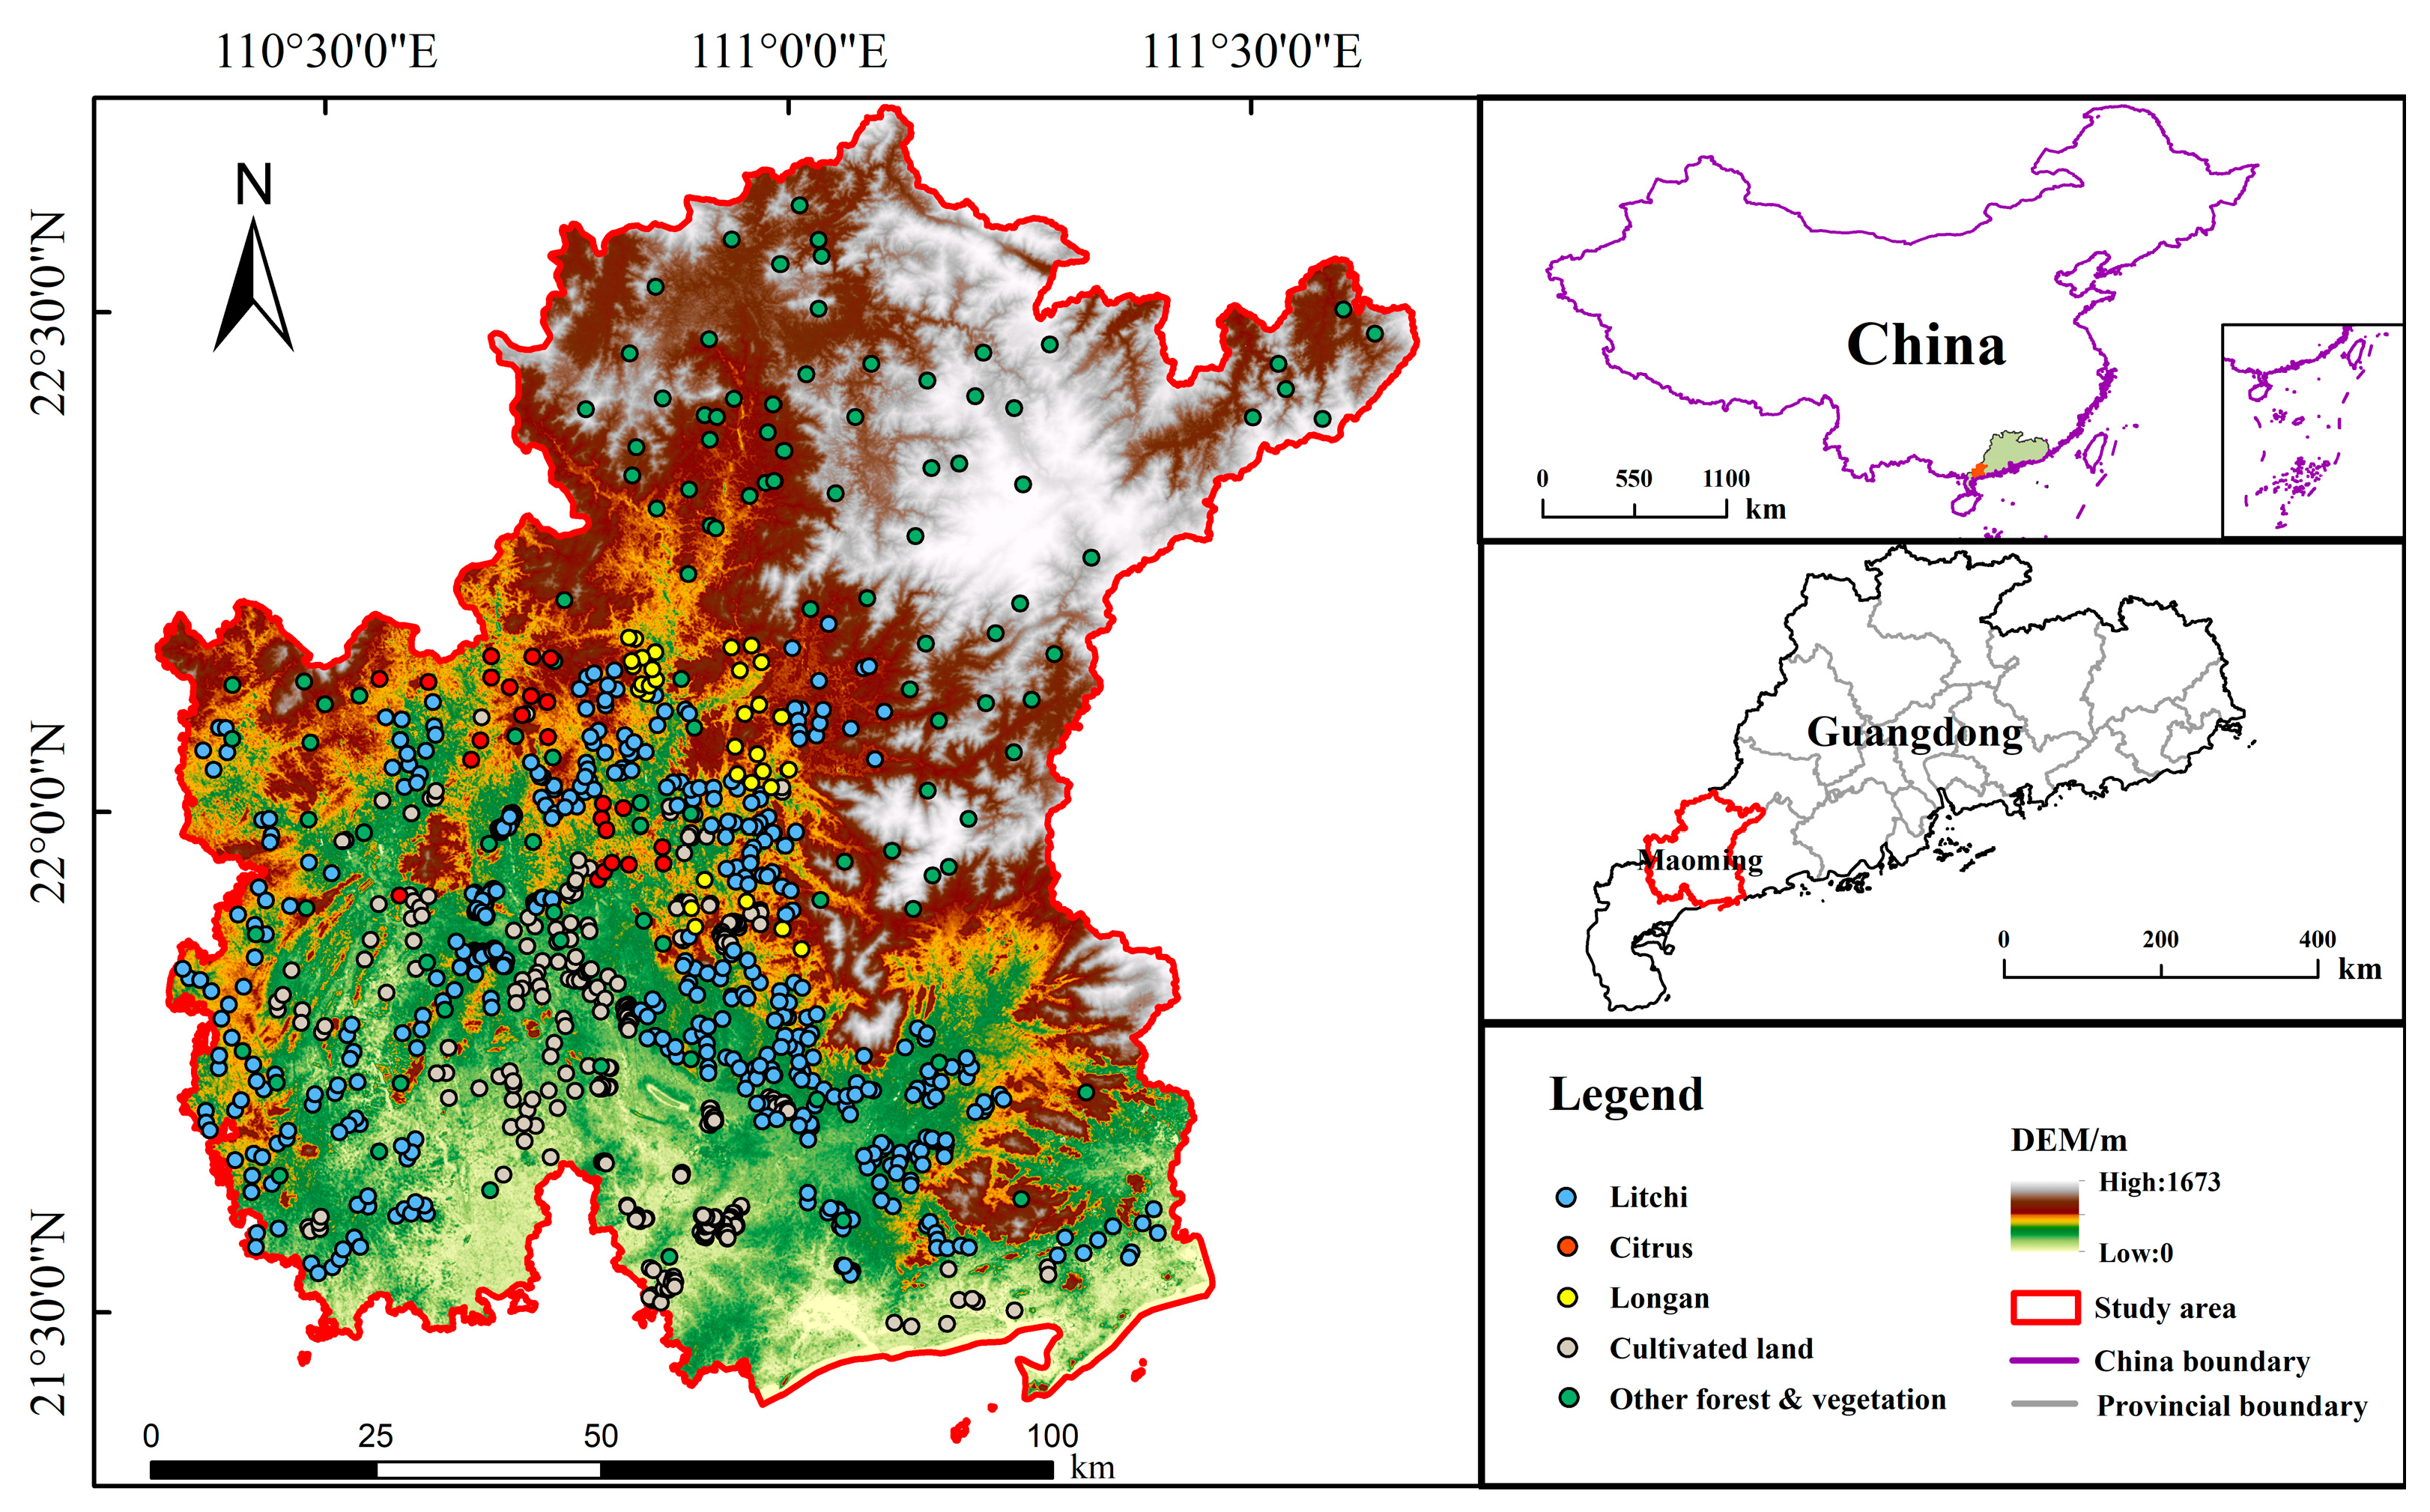
2.1. Study Area

Maoming is located in the western part of Guangdong Province, with its geographical coordinates ranging from 110°20′ to 111°40′ E and 21°25′ to 22°43′ N. The city’s administrative region covers a total area of 11,427.63 square kilometers, mainly consisting of mountains, hills, and plains, which account for 11.5%, 23%, and 65.5%, respectively (Figure 1). Additionally, Maoming’s coastline stretches across 182.1 km, with a sea area within the 40-m isobath of over 4300 km2. It has 21 islands, including 16 islands with an area of more than 500 km [38].
Maoming’s climate belongs to the subtropical monsoon. During the winter season, the average temperature is between 15.1 °C and 16.3 °C. Conversely, the average temperature during the summer season is between 28.3 °C and 28.7 °C. The annual precipitation falls between 1500 and 1800 mm, with more than 80% falling within the months from April to September. Notably, Maoming is famous for its extensive cultivation of fruit trees, including litchi, citrus, and longan, with a particular distinction given to the litchi. Maoming is the world’s largest litchi growing area, with annual production of 543,000 tons, accounting for 50% of the Guangdong Province crop, 25% of the national crop, and 20% of the world crop. The phenological characteristics of litchi are listed in Table 1.

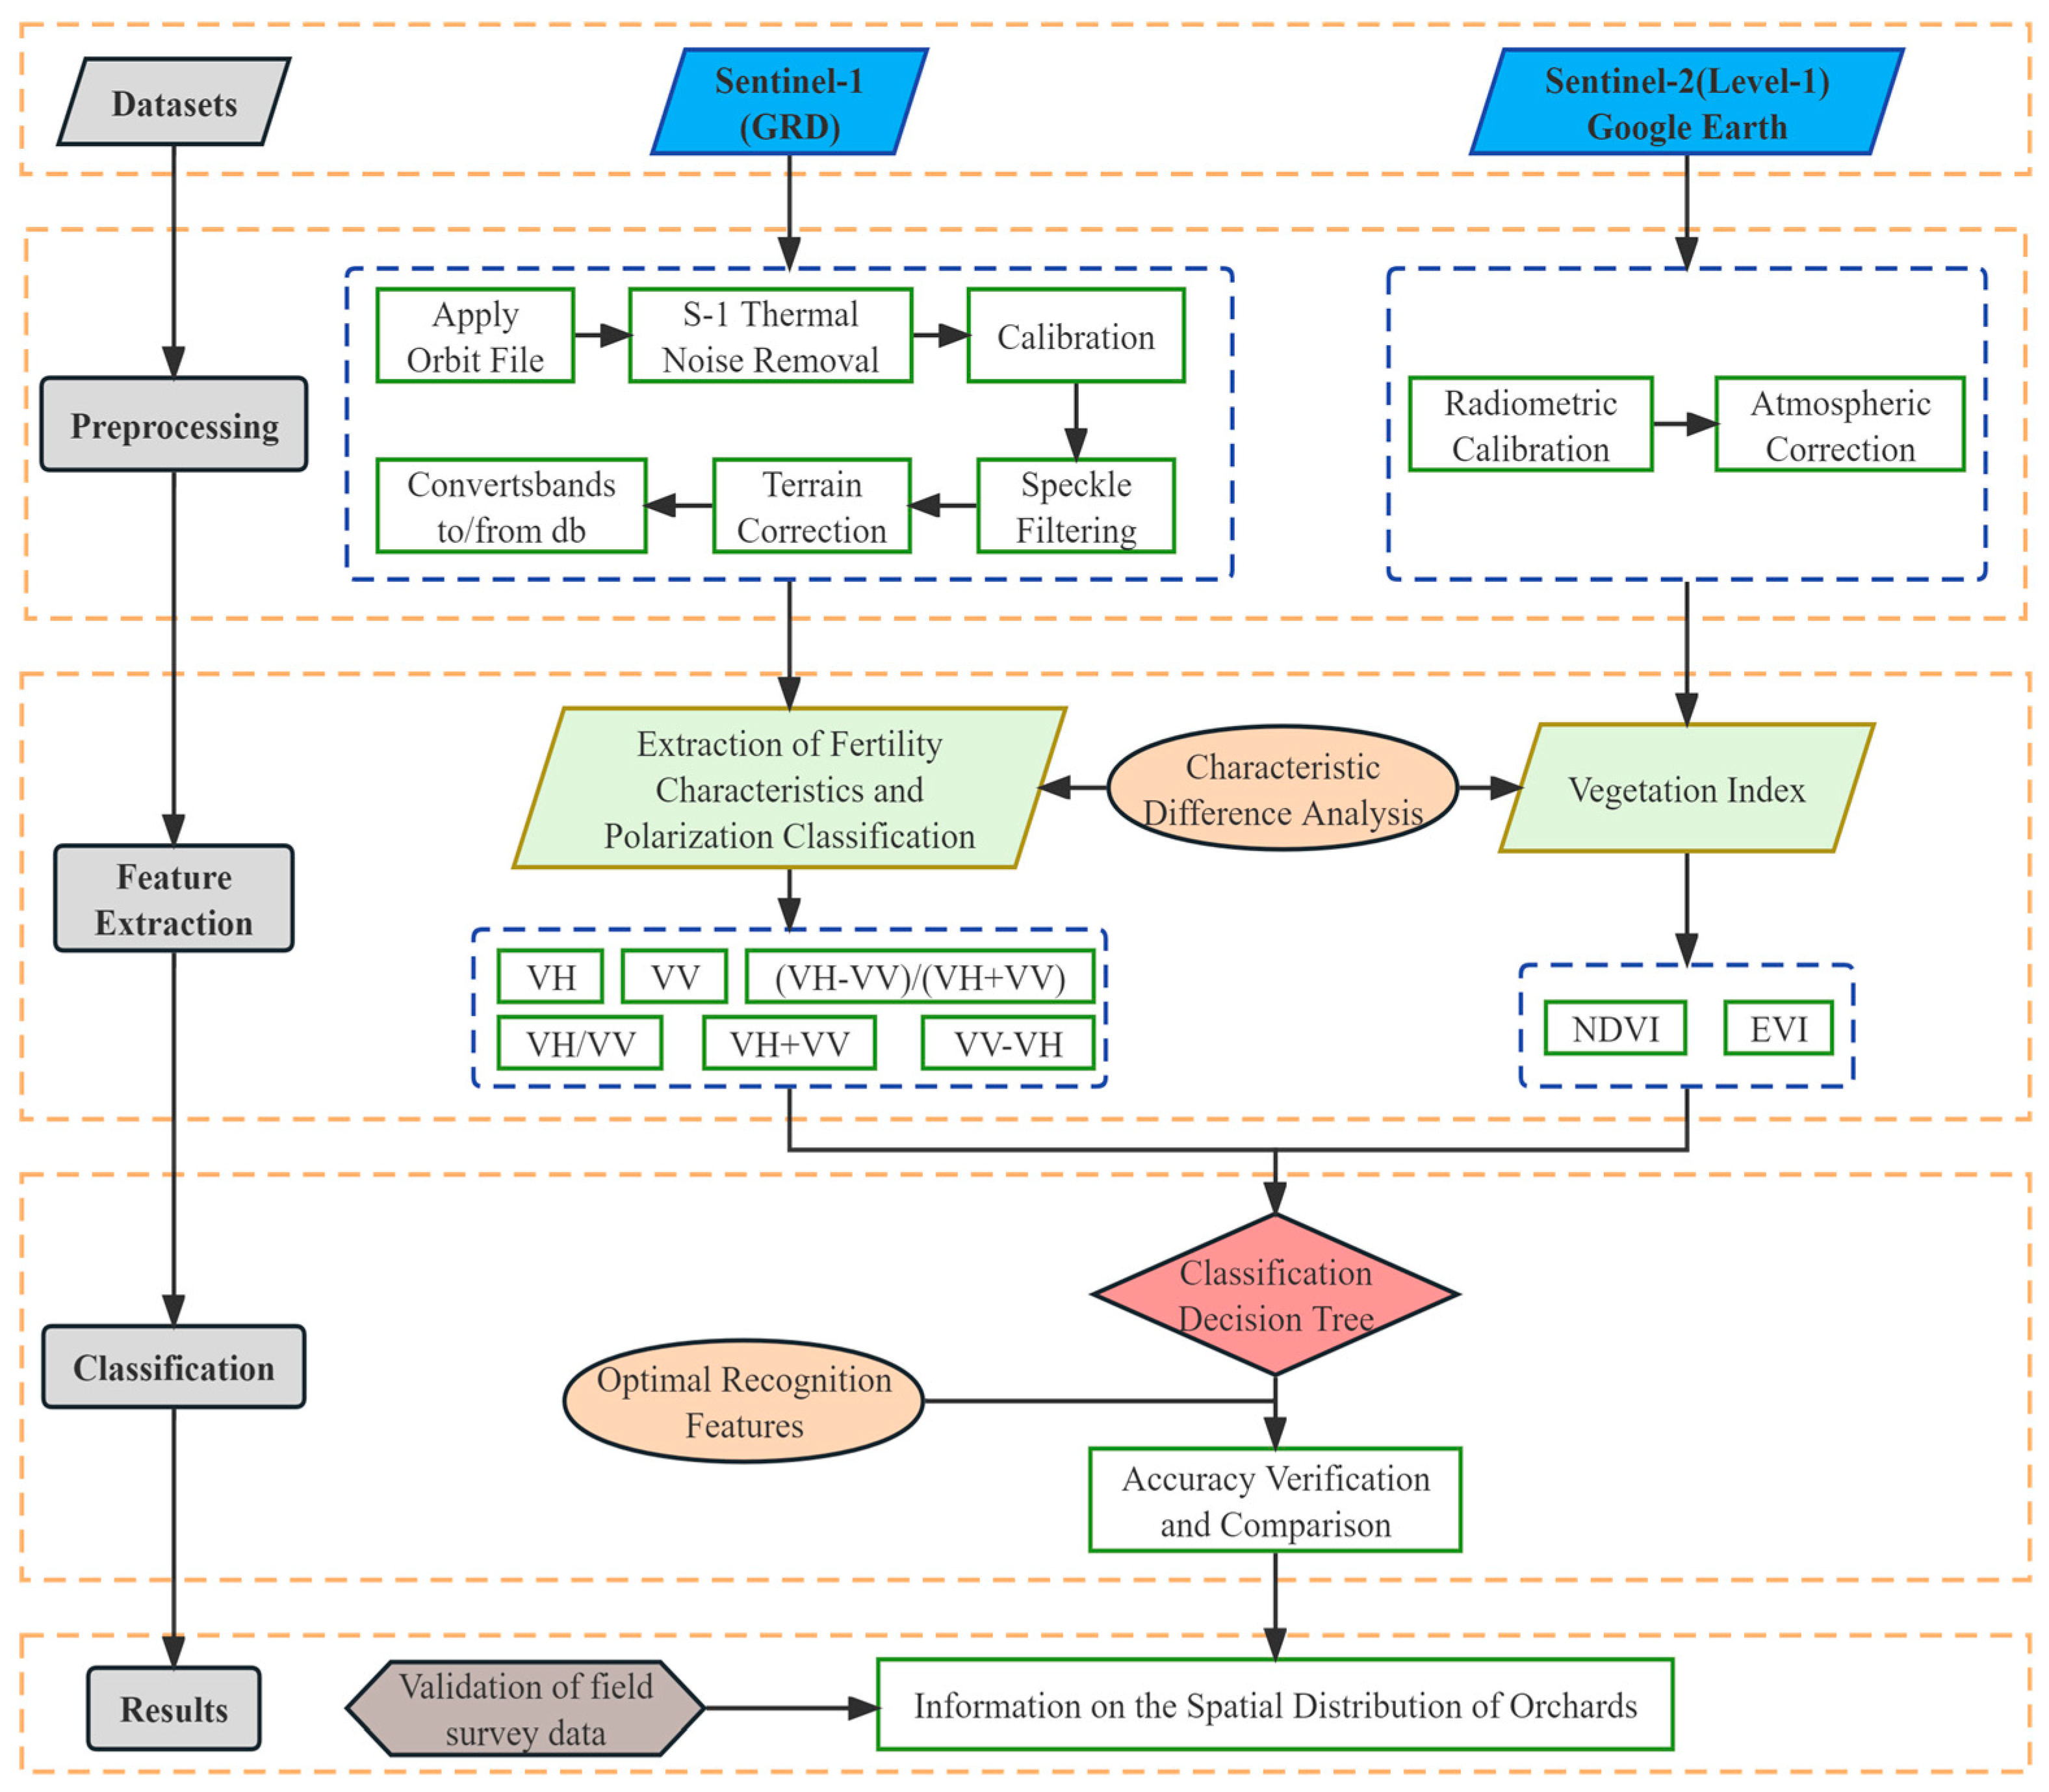
2.2. Data Sources and Preprocessing

In this study, the time series of satellite remote sensing data used were mainly the Level-l SAR data from S-1A in 2022 and the Level-1 C product data from S-2A. The S1 satellite is the first environmental satellite in the Copernicus global monitoring program. S-1 is a constellation of two polar-orbiting satellites, A and B, which are part of the European Space Agency (ESA, Paris, France)’s Copernicus Earth observation satellite series. S-1A and S-1B were launched on 3 April 2014 and 25 April 2016, respectively. The orbital period of an individual satellite is 12 days. The standard revisit period of the two-satellite network is 6 days, with the fastest revisit time being between 1 and 3 days. The satellites are equipped with a 5.404 GHz C-band SAR with a maximum coverage width of 400 km, featuring four imaging modes: SM (Strip Map), IW (Interferometric Wide Swath), EW (Extra-Wide Swath), and WV (Wave). The SM, IW, and EW modes support single polarization (HH/VV) as well as dual polarization (HH + HV/VV + VH). The WV mode, on the other hand, represents single polarization, i.e., it supports HH/VV only. This study employed the IW GRD ground distance multi-view imagery, with a width of 250 km and a ground resolution of 5 m by 20 m (Table 2).
The S-2 satellite is the second satellite belonging to the Global Environment and Safety Monitoring program. Launched on 23 June 2015, it carries a multispectral imager (MSI) at an altitude of 786 km, covering 13 spectral bands over a width of 290 km. The ground resolutions are 10 m, 20 m, and 60 m, respectively. Each satellite is revisited every 10 days. Both satellites are complementary and revisit during the same week.
A large number of studies have reported that the growth stage period is effective in identifying fruit trees; it is a longer period rather than a point in time, which can be categorized into the branch growth, bud differentiation and anthesis, fruit growth and ripening, and harvest periods [2]. Hence, specific screening stages are required for the growth stage period. During the critical growth stage period of fruit trees, frequent cloud cover limits access to clear-sky observations and visible light data. However, microwave data are less affected by cloudy and rainy weather, providing coverage throughout the entire growth stage period. For the 2018 and 2022, 68 images (Table 3) were downloaded from the European Space Agency (ESA, Paris, France) Copernicus Open Access Hub based on the temporal coverage of the available S-1 SAR imagery and S-2 optical multispectral imagery. These two years data were used to map the spatial distribution of fruit trees.
The processing of the satellite data was largely based on the SNAP 9.0.0 (European Space Agency, Paris, France) platform developed by the ESA. The data were processed as follows: (1) apply the orbit file, download the accurate orbit file, and update the S-1 satellite orbit state information in the metadata file of S-1 satellite data; (2) perform S-1 thermal noise removal, reducing the influence of thermal noise on the accuracy of radar backscatter signals; (3) perform calibration—the received backscattering signal is converted into a backscattering coefficient; (4) perform single product speckle filtering, using the refined Lee filter to remove speckle noise; (5) perform range-Doppler terrain correction—the SRTM 3 Sec digital elevation model is used for geocoding to give the actual coordinate information of the image; (6) converts bands to/from DB, which is convenient for visualization and data analysis [39]. The Sentinel-2A Level-1C multispectral data are orthophotos that have undergone geometric correction but have not yet been radiometrically calibrated or atmospherically corrected. Therefore, radiometric calibration and atmospheric correction are necessary. The Level-1C multispectral data were downloaded and then radiometrically calibrated and atmospherically corrected using the SNAP 9.0.0 (European Space Agency, Paris, France) provided by the European Space Agency. The data in the utilized bands were then resampled to a 10 m resolution [40].
A total of 1156 field sampling sites were investigated, comprising 724 sampling sites for litchi and 432 sampling sites for non-litchi (Figure 1). The investigation was carried out in townships and areas surrounding large citrus cultivation areas within the study area. The non-litchi sampling sites consisted of five main features, i.e., citrus, longan, cropland, and other forest and vegetation. One third of the field sampling sites were selected for the construction of the growth stage characteristics of orchard vegetation, while the remaining sites were used for accuracy evaluation. Because of the large area of agricultural land and the many types of crops in the central and southern plains, there were more field sampling sites in and around the townships in the central and southern parts of the study area. In contrast, the northern part of the study area was predominantly hilly and forested, with a comparatively limited area devoted to the cultivation of litchi and other fruit trees. As a result, fewer field sampling sites were investigated within these regions.

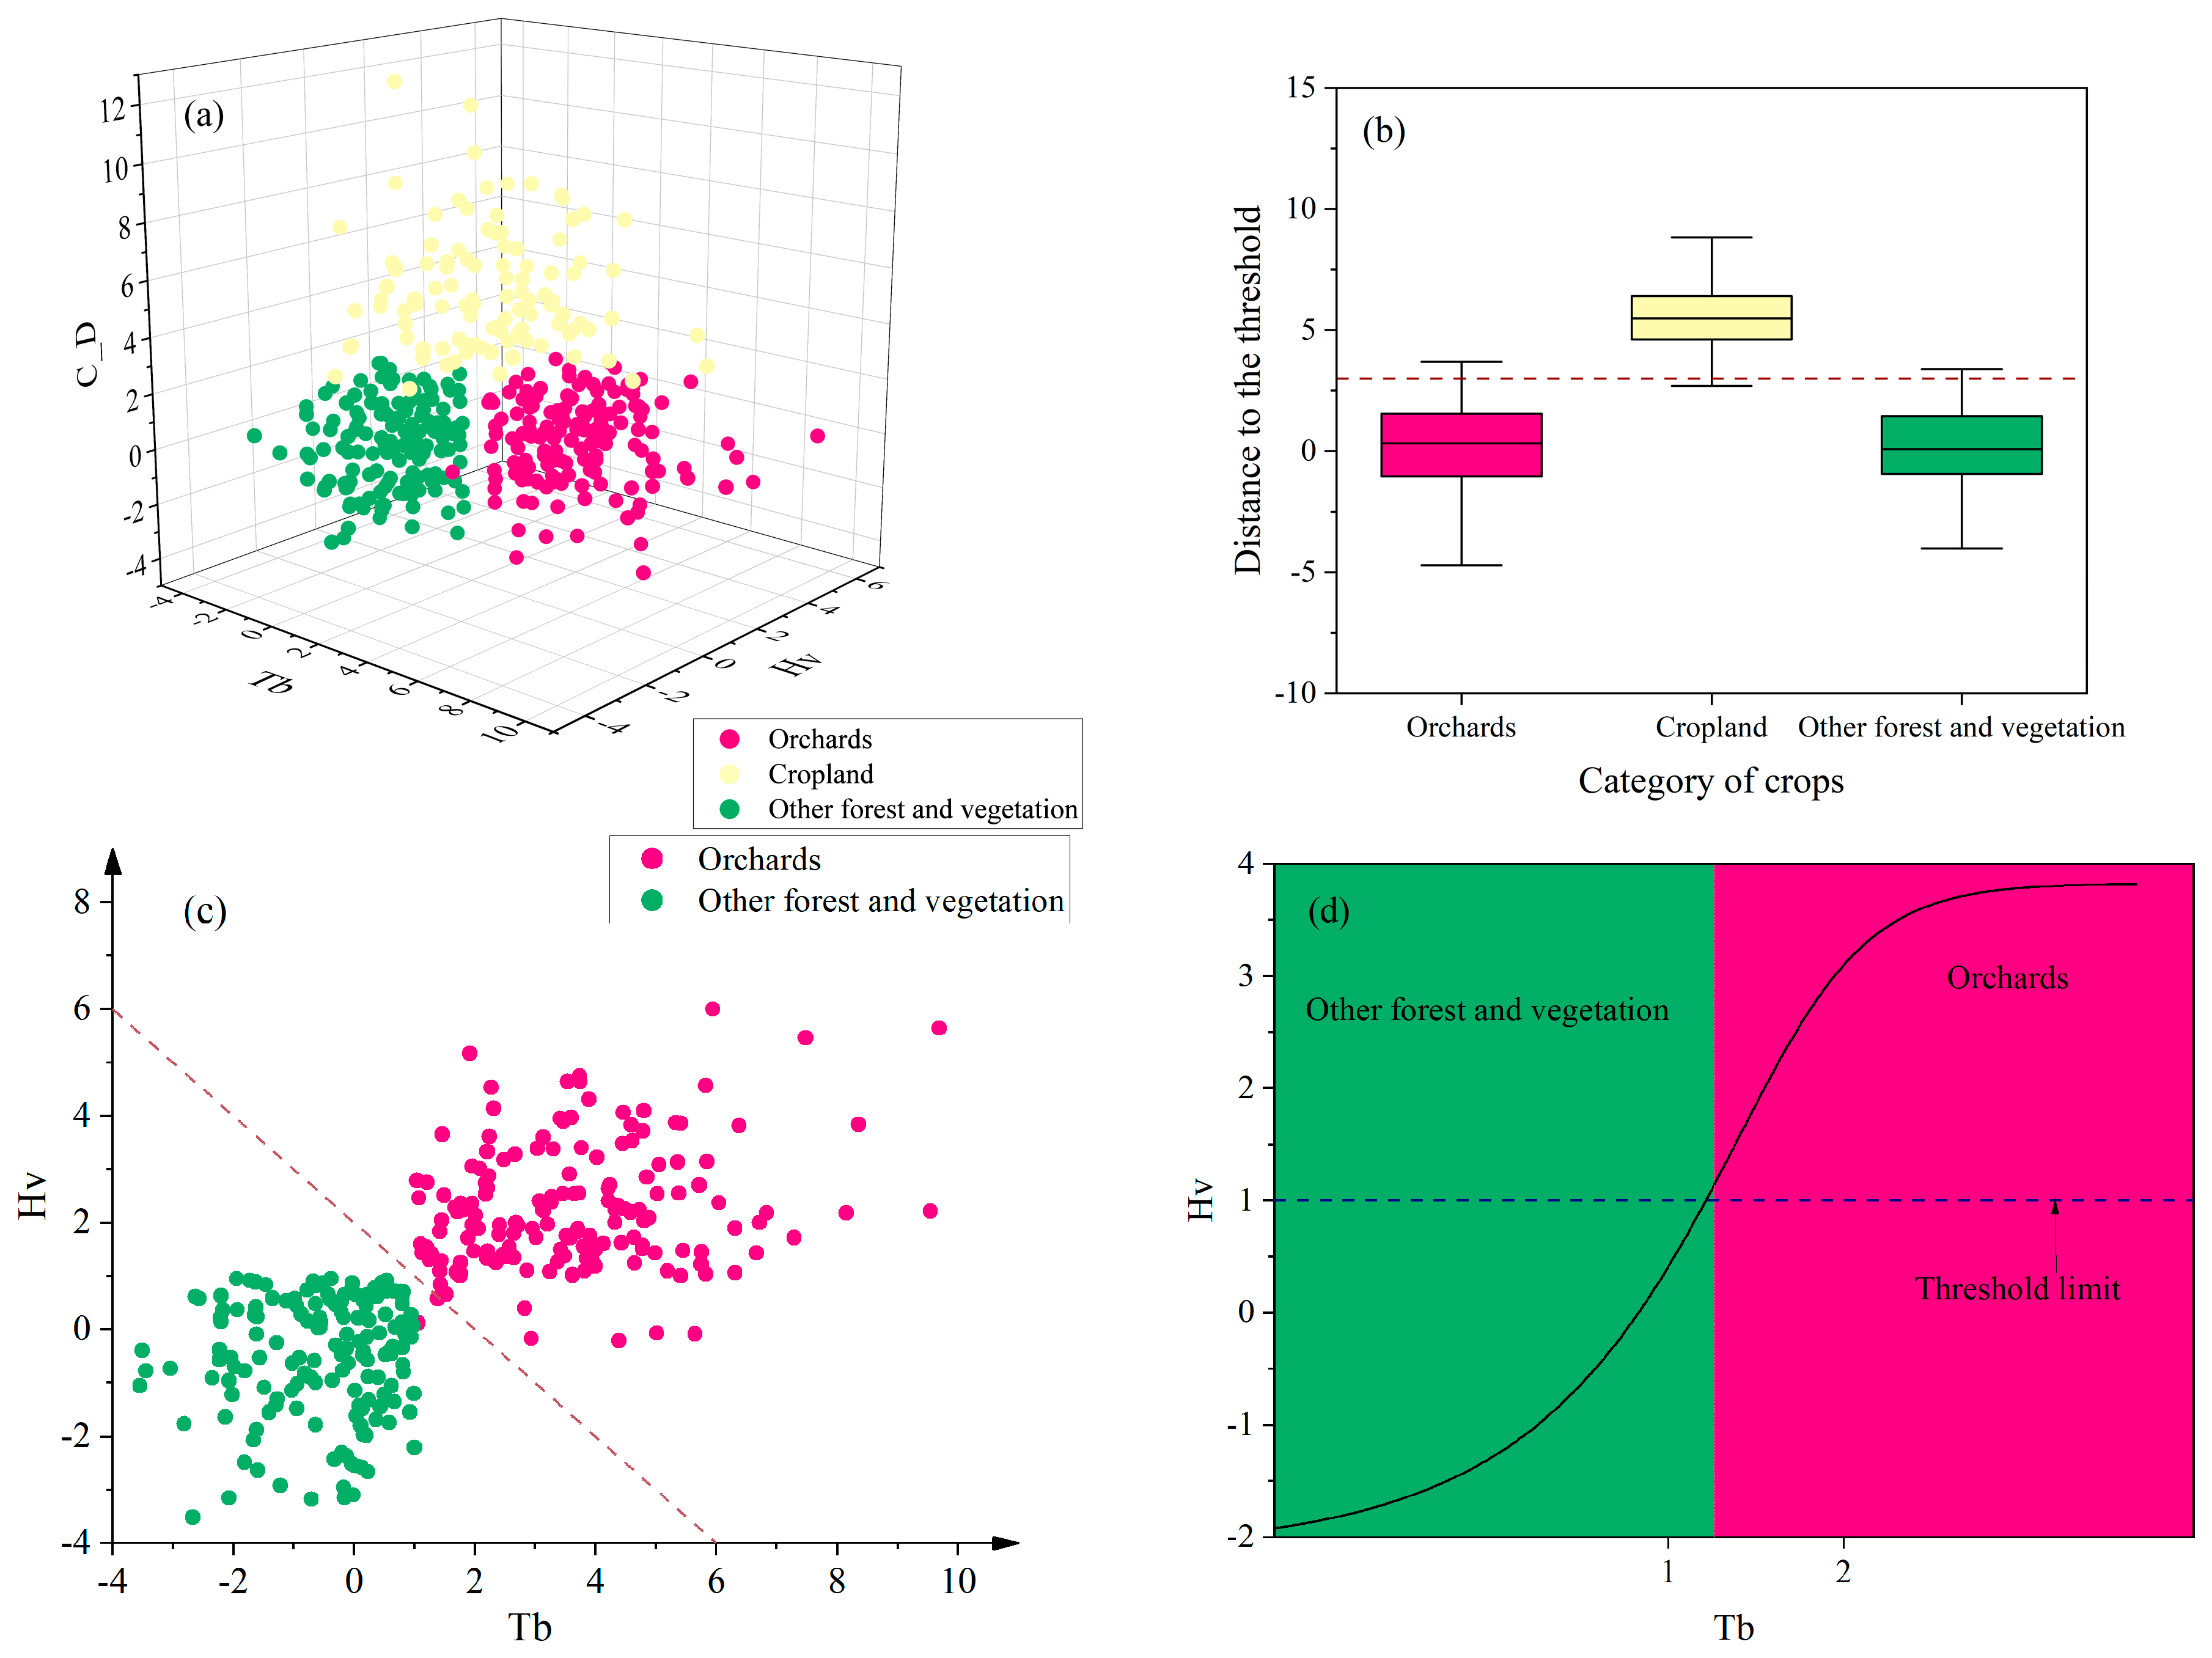
2.3. Construction of Optimal Identifying Feature

One-Class SVM (OCSVM) is used for anomaly detection and outlier detection. Its goal is to identify anomalous data points that differ from the normal pattern by modeling them using only normal data. It does not need abnormal data for training, has good adaptability to high-dimensional data and complex data distributions, and can control the detection sensitivity of anomalies by adjusting the model parameters. Its key lies in how to choose a suitable hyperplane so that normal data are surrounded as much as possible and abnormal data are kept away. This is achieved by optimizing an objective function, which includes minimizing the distance from the hyperplane to the nearest normal data point and maximizing the interval between the hyperplane and the normal data [41,42]. The model mapped the data samples to a high-dimensional feature space through a kernel function for better aggregation and solved the optimal hyperplane in the feature space to realize the maximum separation of the target data from the coordinate origin [43].
Because the data set will inevitably contain abnormal points and noise points, to maintain the accuracy of the algorithm, a slack variable will usually be introduced to reduce the error brought by the abnormal points and noise points [44,45]. Therefore, One-Class SVM had to address the following minimization issues:
min ε , δ i , ρ 1 2 ε 2 + 1 ϑ μ i = 1 μ δ i ρ  
ε T ϕ ( x i ) > ρ δ i , δ i > 0 , i = 1 , , n  
where ϑ is the most important parameter that sets an upper limit for the outlier score and is also the lower term for the number of samples that are support vectors in the training dataset, δ i denotes the slack variable that allows some samples to lie on the wrong side of the separation hyperplane, ε denotes the normal vector of the separation hyperplane, ρ denotes the distance from the separation hyperplane to the nearest training sample, and ϕ ( x i ) denotes the feature mapping function that maps the input samples to the high-dimensional space.
The minimization problem was solved by employing the Lagrange operator. The resulting final decision function is shown below.
f ( x ) = sgn i = 1 n n α i K x , x i ρ
where α i is the Lagrange operator and K ( x , x i ) is the feature vector of the input sample x . The method creates a hyperplane with a parameter ε , ρ that maximizes the distance from the zeros in the feature space and separates the zeros from all data points.
In this study, we verified the optimal parameters for the identification of litchi fruit trees by six backscattering coefficients, VV, VH, VV + VH, VV − VH, VH/VV, and (VH − VV)/(VH + VV), composed by polarization in S-1 multitemporal images [30]. Firstly, the backscattering coefficients VV and VH (in dB) were obtained by preprocessing the GRD products; then, based on the linear combination of polarization, the feature parameters VV + VH, VV − VH, VH/VV, and (VH − VV)/(VH + VV) were calculated. Based on the polarized feature parameters, the divisibility between litchi fruit trees, cropland, and other forest and vegetation was proven (Figure 2a,c), and the single-class classification model was used to determine the optimal segmentation planes between litchi fruit trees and the other two crops (Figure 2b,d).
To achieve greater precision regarding the spatial distribution of litchi fruit trees, this study combined the polarization characteristics with growth stage information and proposed three extraction factors: H v , T b , and C _ D . The growth stage information revealed that the backscattering coefficient experienced a valley during the ripening period of litchi, which was succeeded by a new peak post-ripening. By combining long-time-series image data, a recognition model was developed.
H v refers to the high valley value of the backward scattering coefficients of the 14 May, 26 May, and 7 June data for the six polarizations and their combinations:
H v = M a 14 + J u 07 2 M a 26
where M a 14 is the backscatter coefficient for the 14 May data, and J u 07 and M a 26 represent the backscatter coefficients for the 7 June and 26 May, respectively.
T b represents the difference in the backscattering coefficients of the data of 7 June and those of 14 January. In January, litchi was in the spring period, when the vegetation information was weak and the backscattering value was low. Therefore, the difference between the two periods of data is an important growth stage feature:
T b = J u 07 J a 14
where J u 07 is the backscattering coefficient of the 7 June data; J a 14 is the backscattering coefficient of the 14 January data.
C _ D represents the difference in backscattering coefficients between the 13 July data and the 25 July data. July is the crop harvesting and planting season, and there is a difference in the backscattering coefficients of the two data, which can accurately distinguish cropland from other features:
C _ D = J l 13 J l 25
In the above equation, J l 13 is the backscatter coefficient for the 13 July data, and J l 25 is the backscatter coefficient for the 25 July data.
L o and C r indicate that the backward scattering coefficients of longan and mandarin orange are high in the trough of the ripening stage:
L o = J l 13 + A u 06 2 J l 25
C r = S e 23 + N o 11 2 O c 17
In the above equation, J l 13 , J l 25 , A u 06 , S e 23 , O c 17 , N o 11 are the backscatter coefficients for the 13 July, 25 July, 6 August, 23 September, 17 October, and 11 November data, respectively.
The growth stages of mature litchi fruit trees typically exhibit the following features: as litchi trees are categorized under broadleaved evergreen forests, their vegetation remains fairly stable throughout the year; during the first half of the year, litchi undergoes the flowering and fruit growth stage, resulting in noticeable shifts in the spectral properties of litchi fruit trees. This is partly attributable to the unique growth of the litchi fruit, where the shell develops initially, followed by the flesh. During April and May, the litchi fruit undergoes growth and expansion. By June, the shell loses its green color, transitioning from lime green to a shade of red. Along with the fruit’s expansion, the shading effects of the leaves on the litchi fruit trees also gradually increase. As the picking period approaches, the spectral effects of the fruit’s shading on the canopy of the litchi trees weaken steadily. Summarizing the aforementioned traits, this investigation proposes a scientific hypothesis that, from a growth stage information perspective, the vegetation information of litchi fruit trees may weaken during their flowering period and the process of fruit growth, expansion, and ripening [45]. Moreover, the vegetation information of litchi gardens could be gradually recovered during the harvesting period. Hence, the period in which litchi fruit trees flower in February–March and grow and ripen in May–July may be the ideal time window for the identification of litchi fruit trees. In particular, litchi fruit trees have a turning point between the ripening period and the picking period between June and July, which is also the period when litchi fruit trees are most affected by ripening fruit [46].
Longan and citrus trees share growth stage features with litchi fruit trees, as they all exhibit vegetative information about the trees at maturity as a result of foliage shading from expanding fruits. However, the three fruit trees have distinct ripening periods, meaning that the optimal time window for the recognition of different fruit trees also differs. Therefore, the critical growth stage characteristics for the identification of fruit trees lie at fruit maturity.

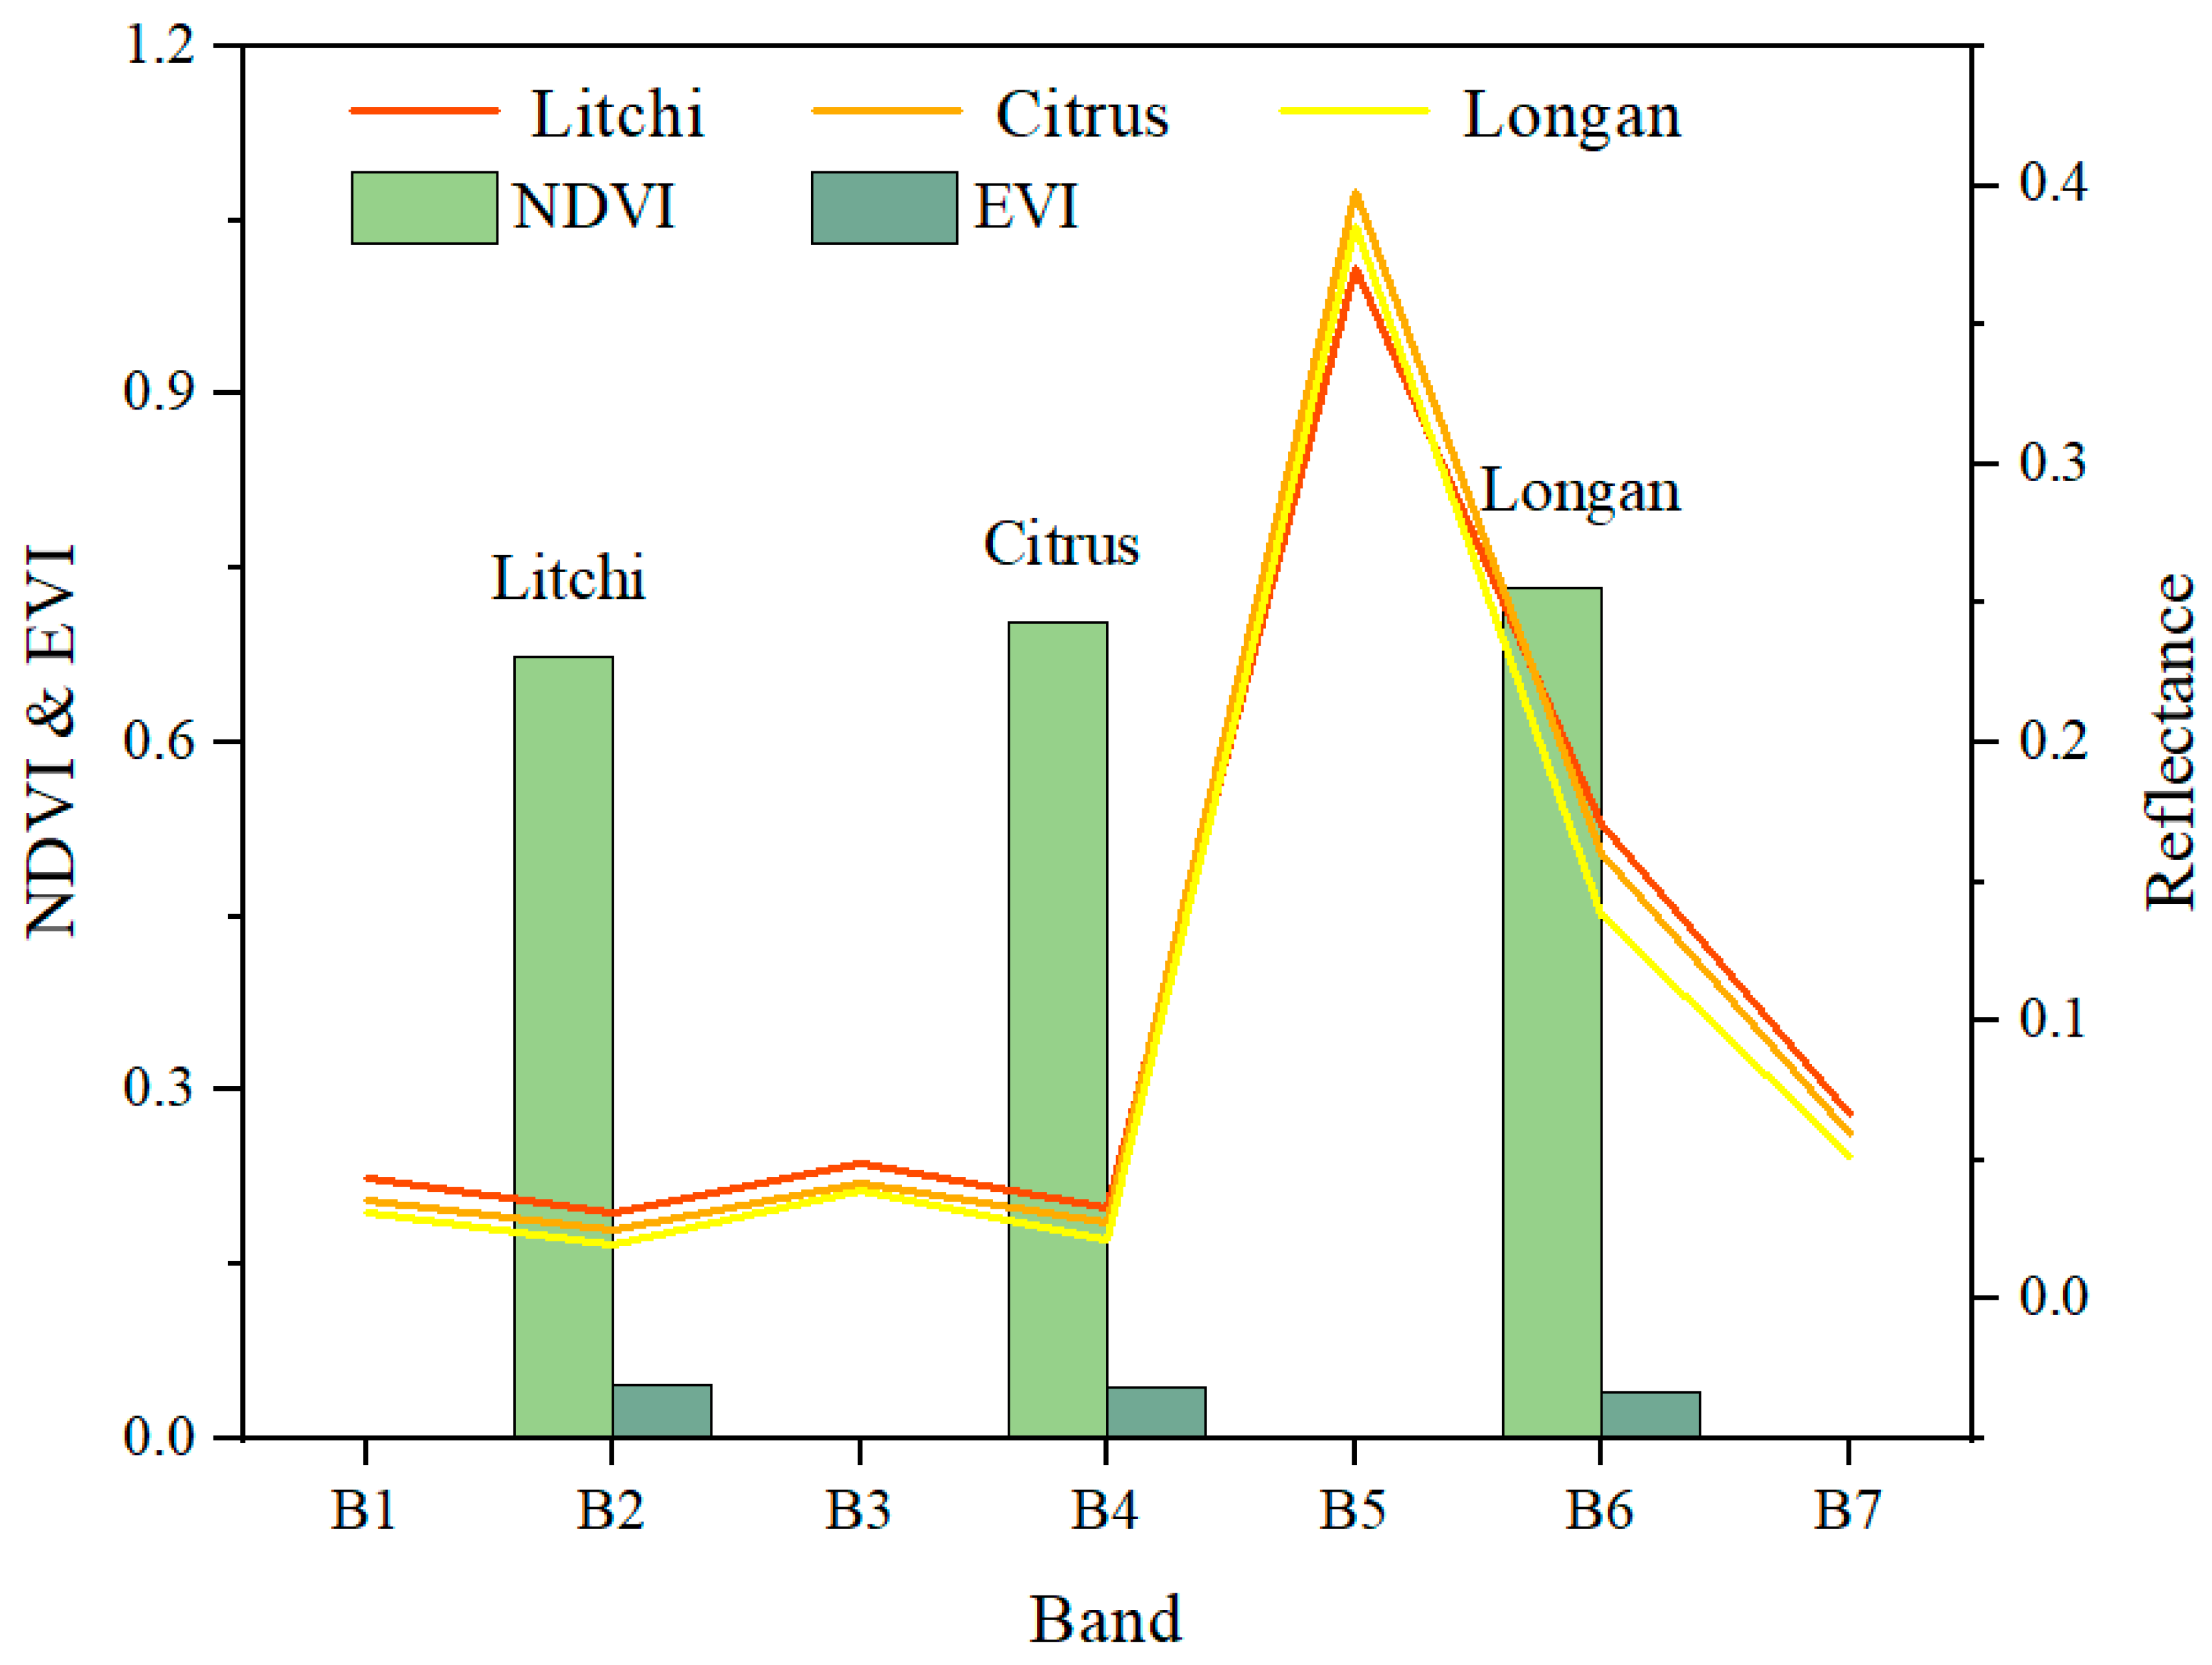
2.4. Sensitivity Analysis of Vegetation Indices

S-1 radar data are susceptible to the terrain, and plain areas and mountainous areas show different surface characteristics and different reflection and absorption properties for electromagnetic waves. Therefore, when distinguishing other features without vegetation, different vegetation indices are selected for different terrains.
The Normalized Difference Vegetation Index (NDVI) is a calculation of the reflectance in the red and near-infrared bands, and its main application is to detect the growth status of vegetation and the degree of vegetation cover. The Enhanced Vegetation Index (EVI) is a remotely sensed index for the assessment of surface vegetation cover and growth. It is an improved vegetation index that overcomes the limitations of traditional vegetation indices under high vegetation cover and atmospheric conditions [47]. Compared with the NDVI, the EVI has better sensitivity and dynamic range under high vegetation cover.
The NDVI reduces the atmospheric impact at the expense of vegetation index saturation, while the EVI is more sensitive to high-vegetation areas. At the same time, under high aerosol content, the EVI is more stable than the NDVI, showing higher resistance to atmospheric interference and insensitivity to background noise [48]. In the dense vegetation area, the NDVI tends to be saturated, while the EVI does not show this phenomenon and can better reflect the spatial variability of vegetation in the region. Therefore, it is more suitable to use the EVI to extract vegetation in mountainous areas than in plains. In the plain area, the surface features are complex, and the forest land, cropland, and residential land are staggered. The growth period, maturity period, and decline period of different crops are different, and the NDVI is a more suitable index for the extraction of vegetation in the plain region [49,50].
Figure A2 highlights the challenge of differentiating between various orchard categories solely by utilizing spectral features, the NDVI, and the EVI. In light of this, the present study proposes the development of a recognition model for orchard extraction by the integration of S-1 data.

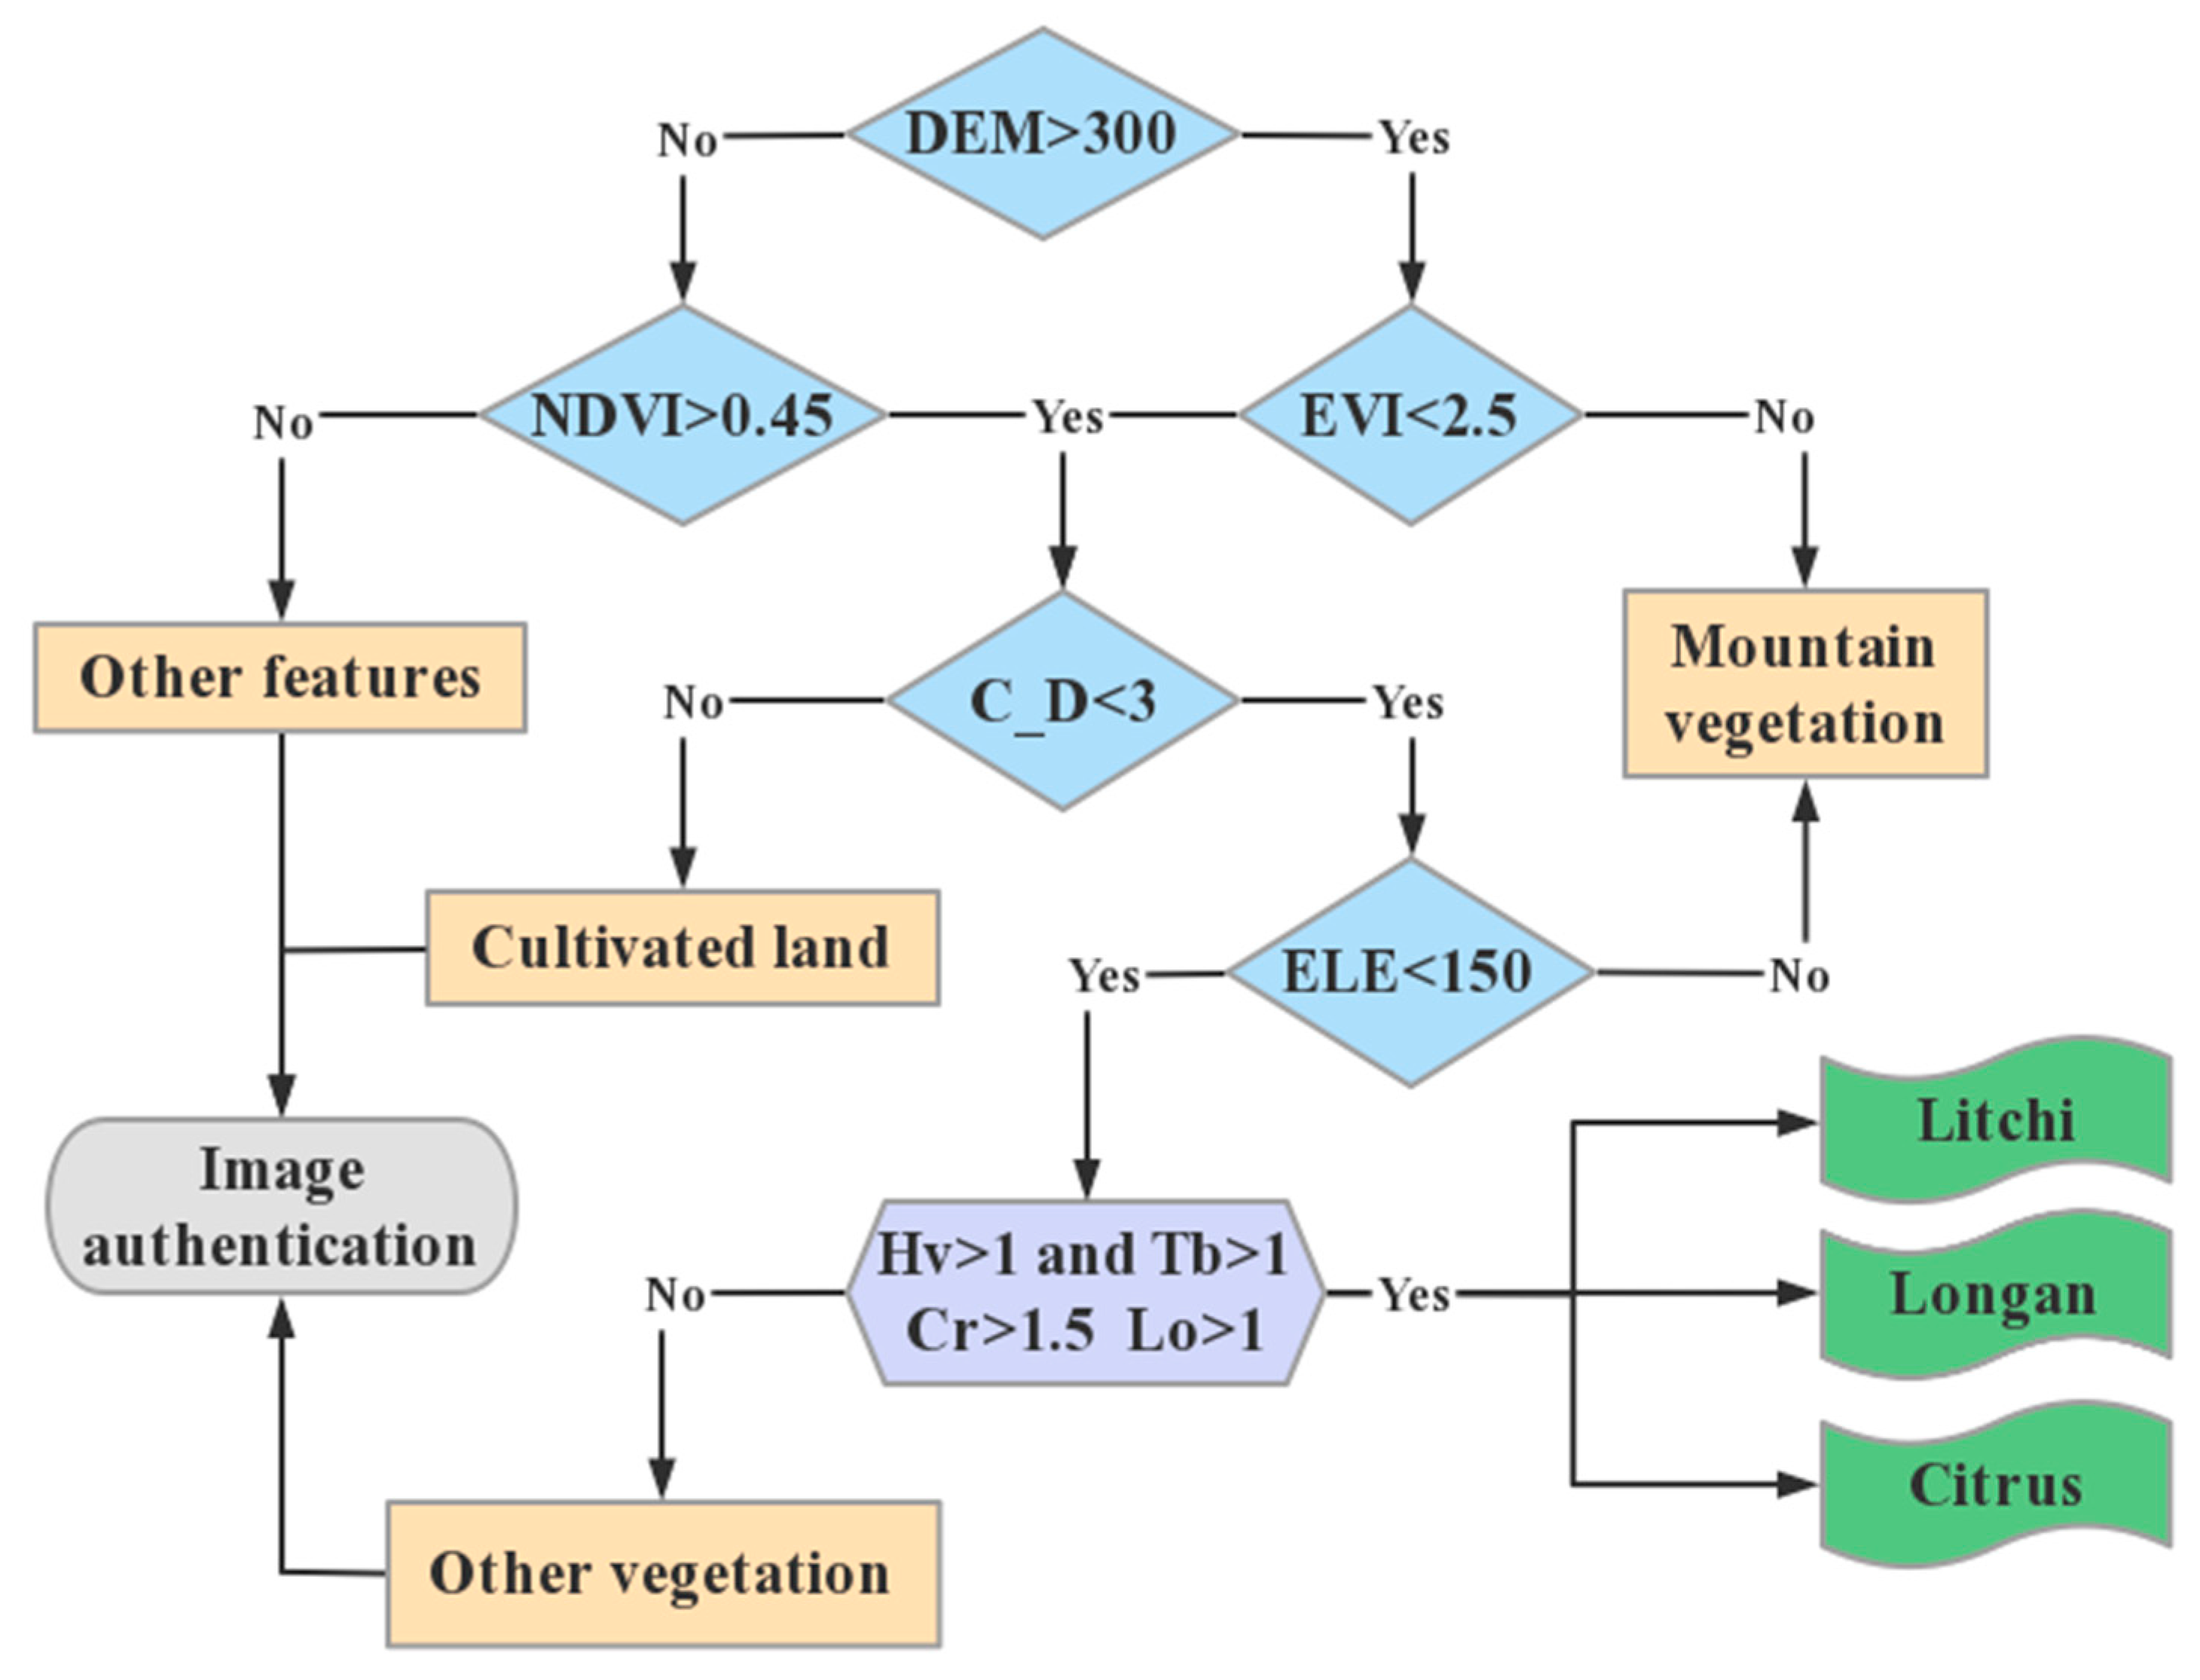
2.5. Construction of Decision Tree

Based on multi-source data classification, the optimal recognition features were selected, and the decision tree recognition model was established to extract the spatial distribution information of the litchi fruit trees. To obtain more accurate recognition results, it was further investigated whether the selected feature parameters could accurately extract the distribution information of the litchi fruit trees. The high-resolution image and multispectral image data were used to obtain the distribution information of the vegetation and green space, and the long-term sequence box plot and scatter plot of litchi, cropland, and other forest and vegetation were constructed for discriminant analysis (Figure 3). This can intuitively represent the separability between different categories of crops and highlight the segmentation thresholds between crops [51]. Through the pairwise comparison of litchi, cropland, and other forest and vegetation box plots, the optimal features and segmentation thresholds to distinguish different categories were determined. The method of a hierarchical decision tree combined with the litchi backscattering coefficient and different feature segmentation thresholds at each level was used to extract the results [43]. This method has the advantage of ignoring the influence of terrain and other features, and it is simple and intuitive.

2.6. Accuracy Evaluation Method

The confusion matrix was used to calculate the user accuracy (UA), producer accuracy (PA), overall accuracy (OA), and kappa coefficient [52] of the classification results (as shown in Equations (9)–(12)), reflecting the location accuracy of the classification results in the study area.
P A = k i i j = 1 t k i j
U A = k j j i = 1 t k i j
O A = 1 n i = 1 t k i i
K a p p a = n i = 1 t k i i i = 1 t ( k i + × k + i ) n 2 i = 1 t ( k i + × k + i )
Among them, n represents the number of sample points, i represents the row, j represents the column, t represents the total number of rows or columns, k i i denotes the element in row i and column i , k j j denotes the element in row j and column j , k i j denotes the element in row i and column j , and k i + and k + i denote the sum of the elements in row i and column i , respectively.

3. Results and Discussion

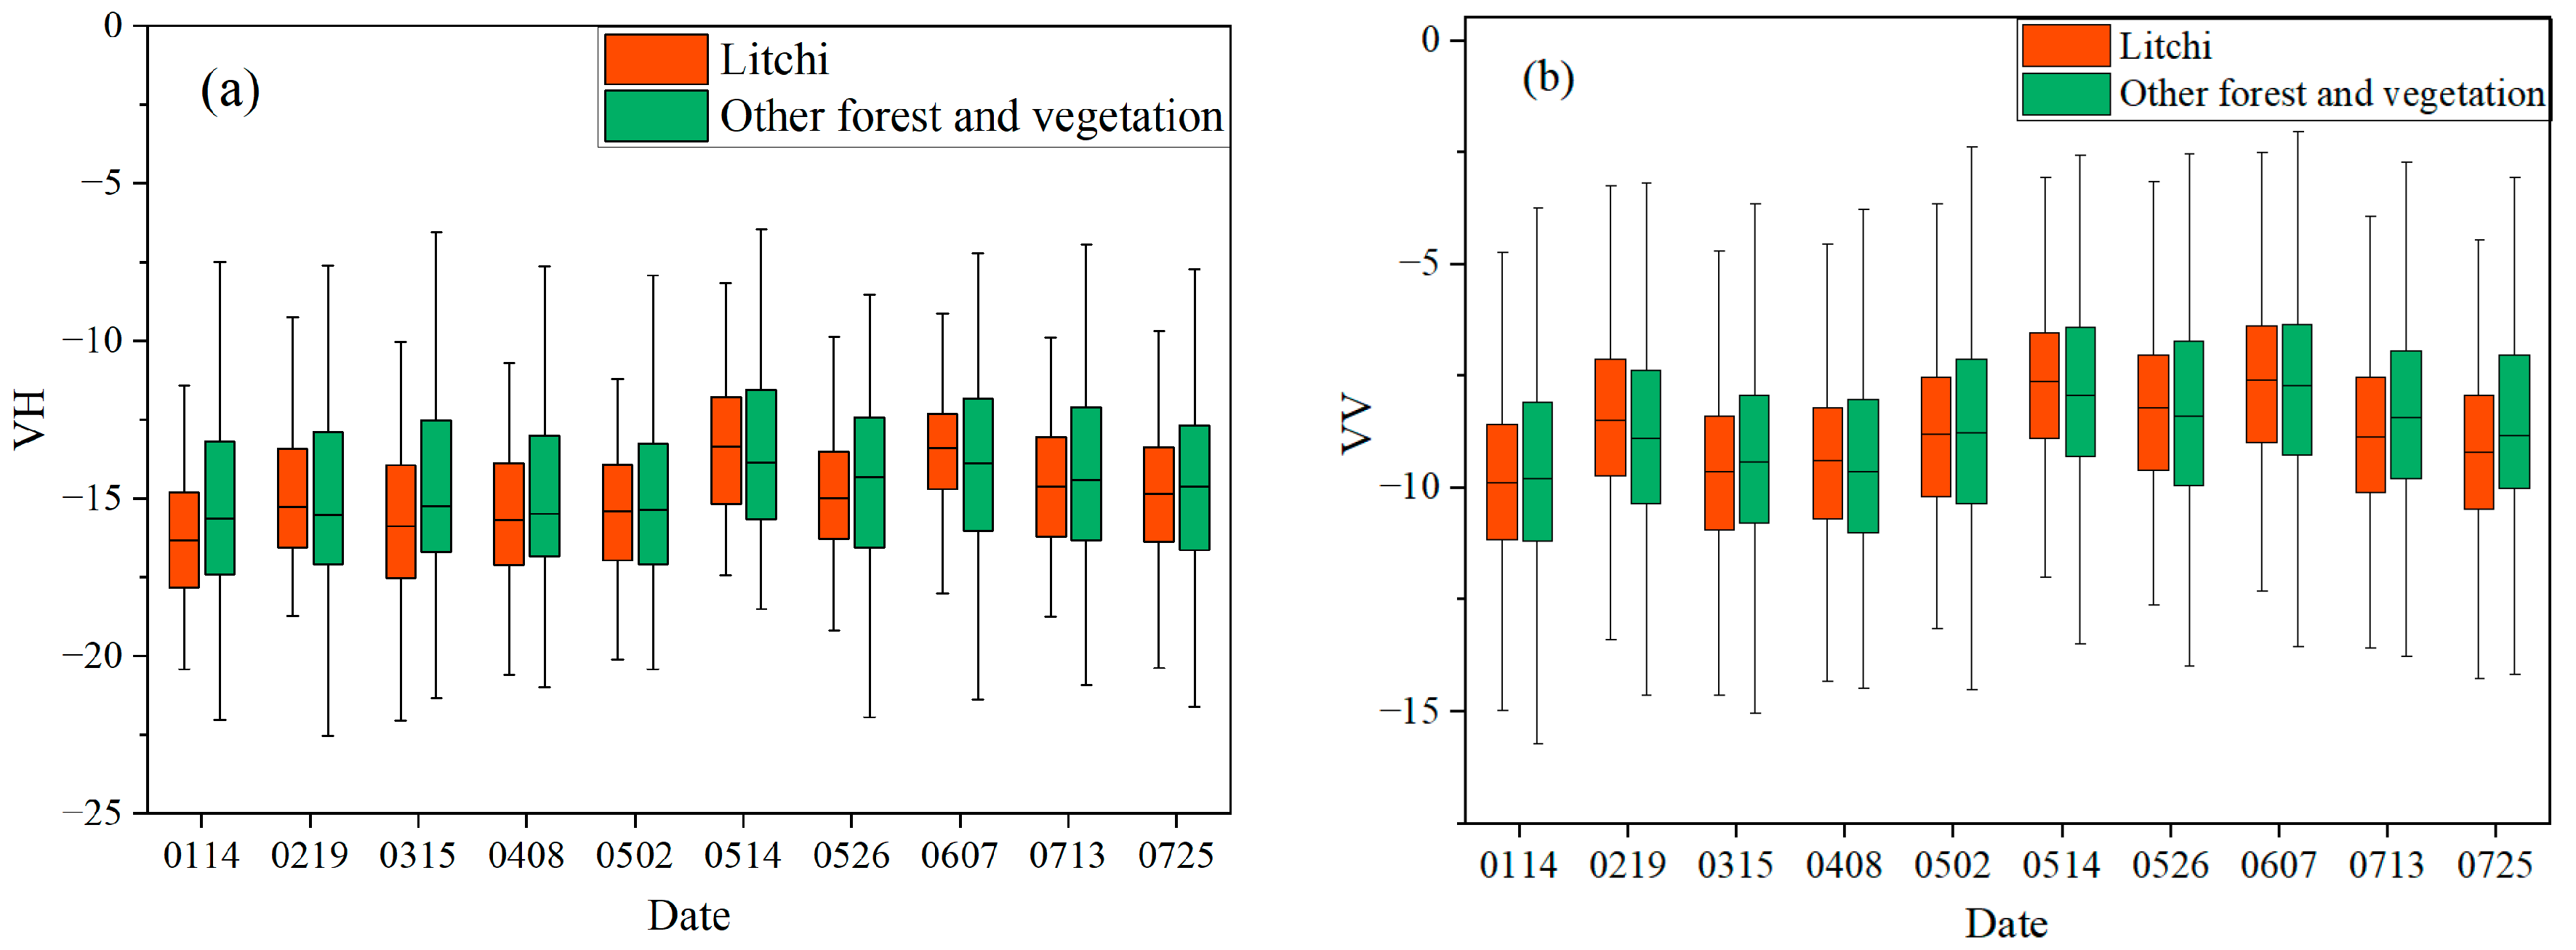
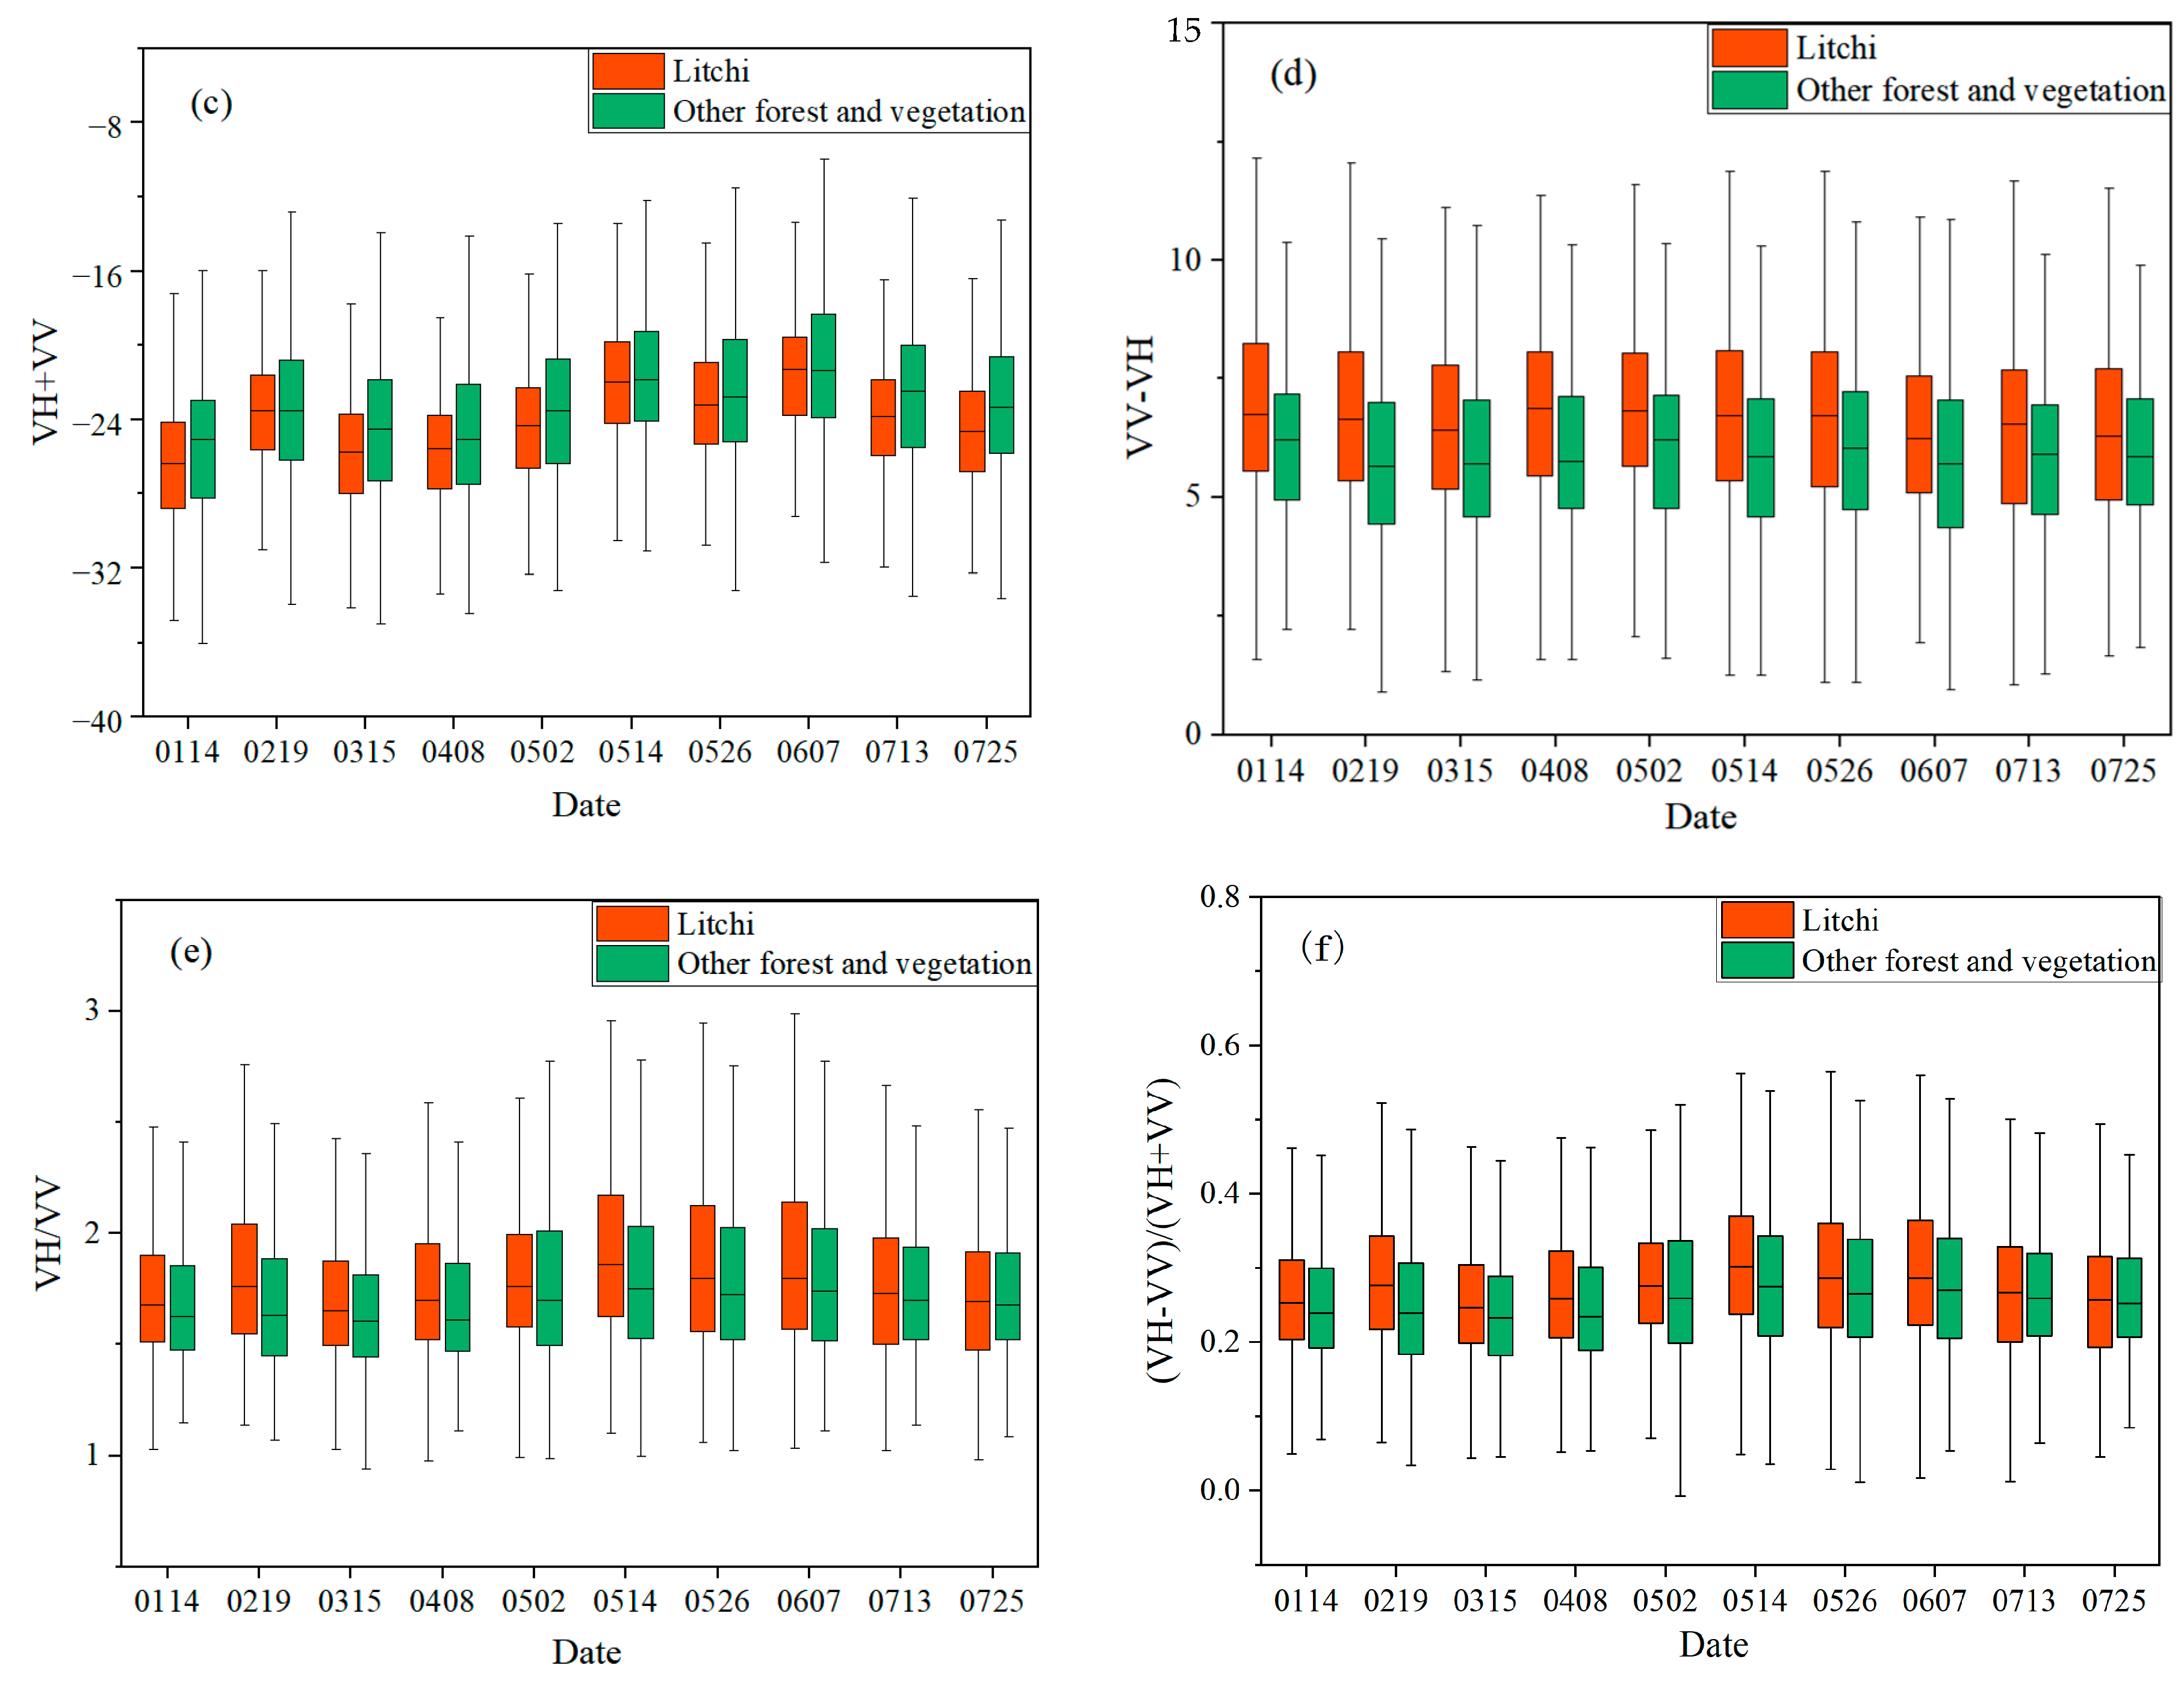
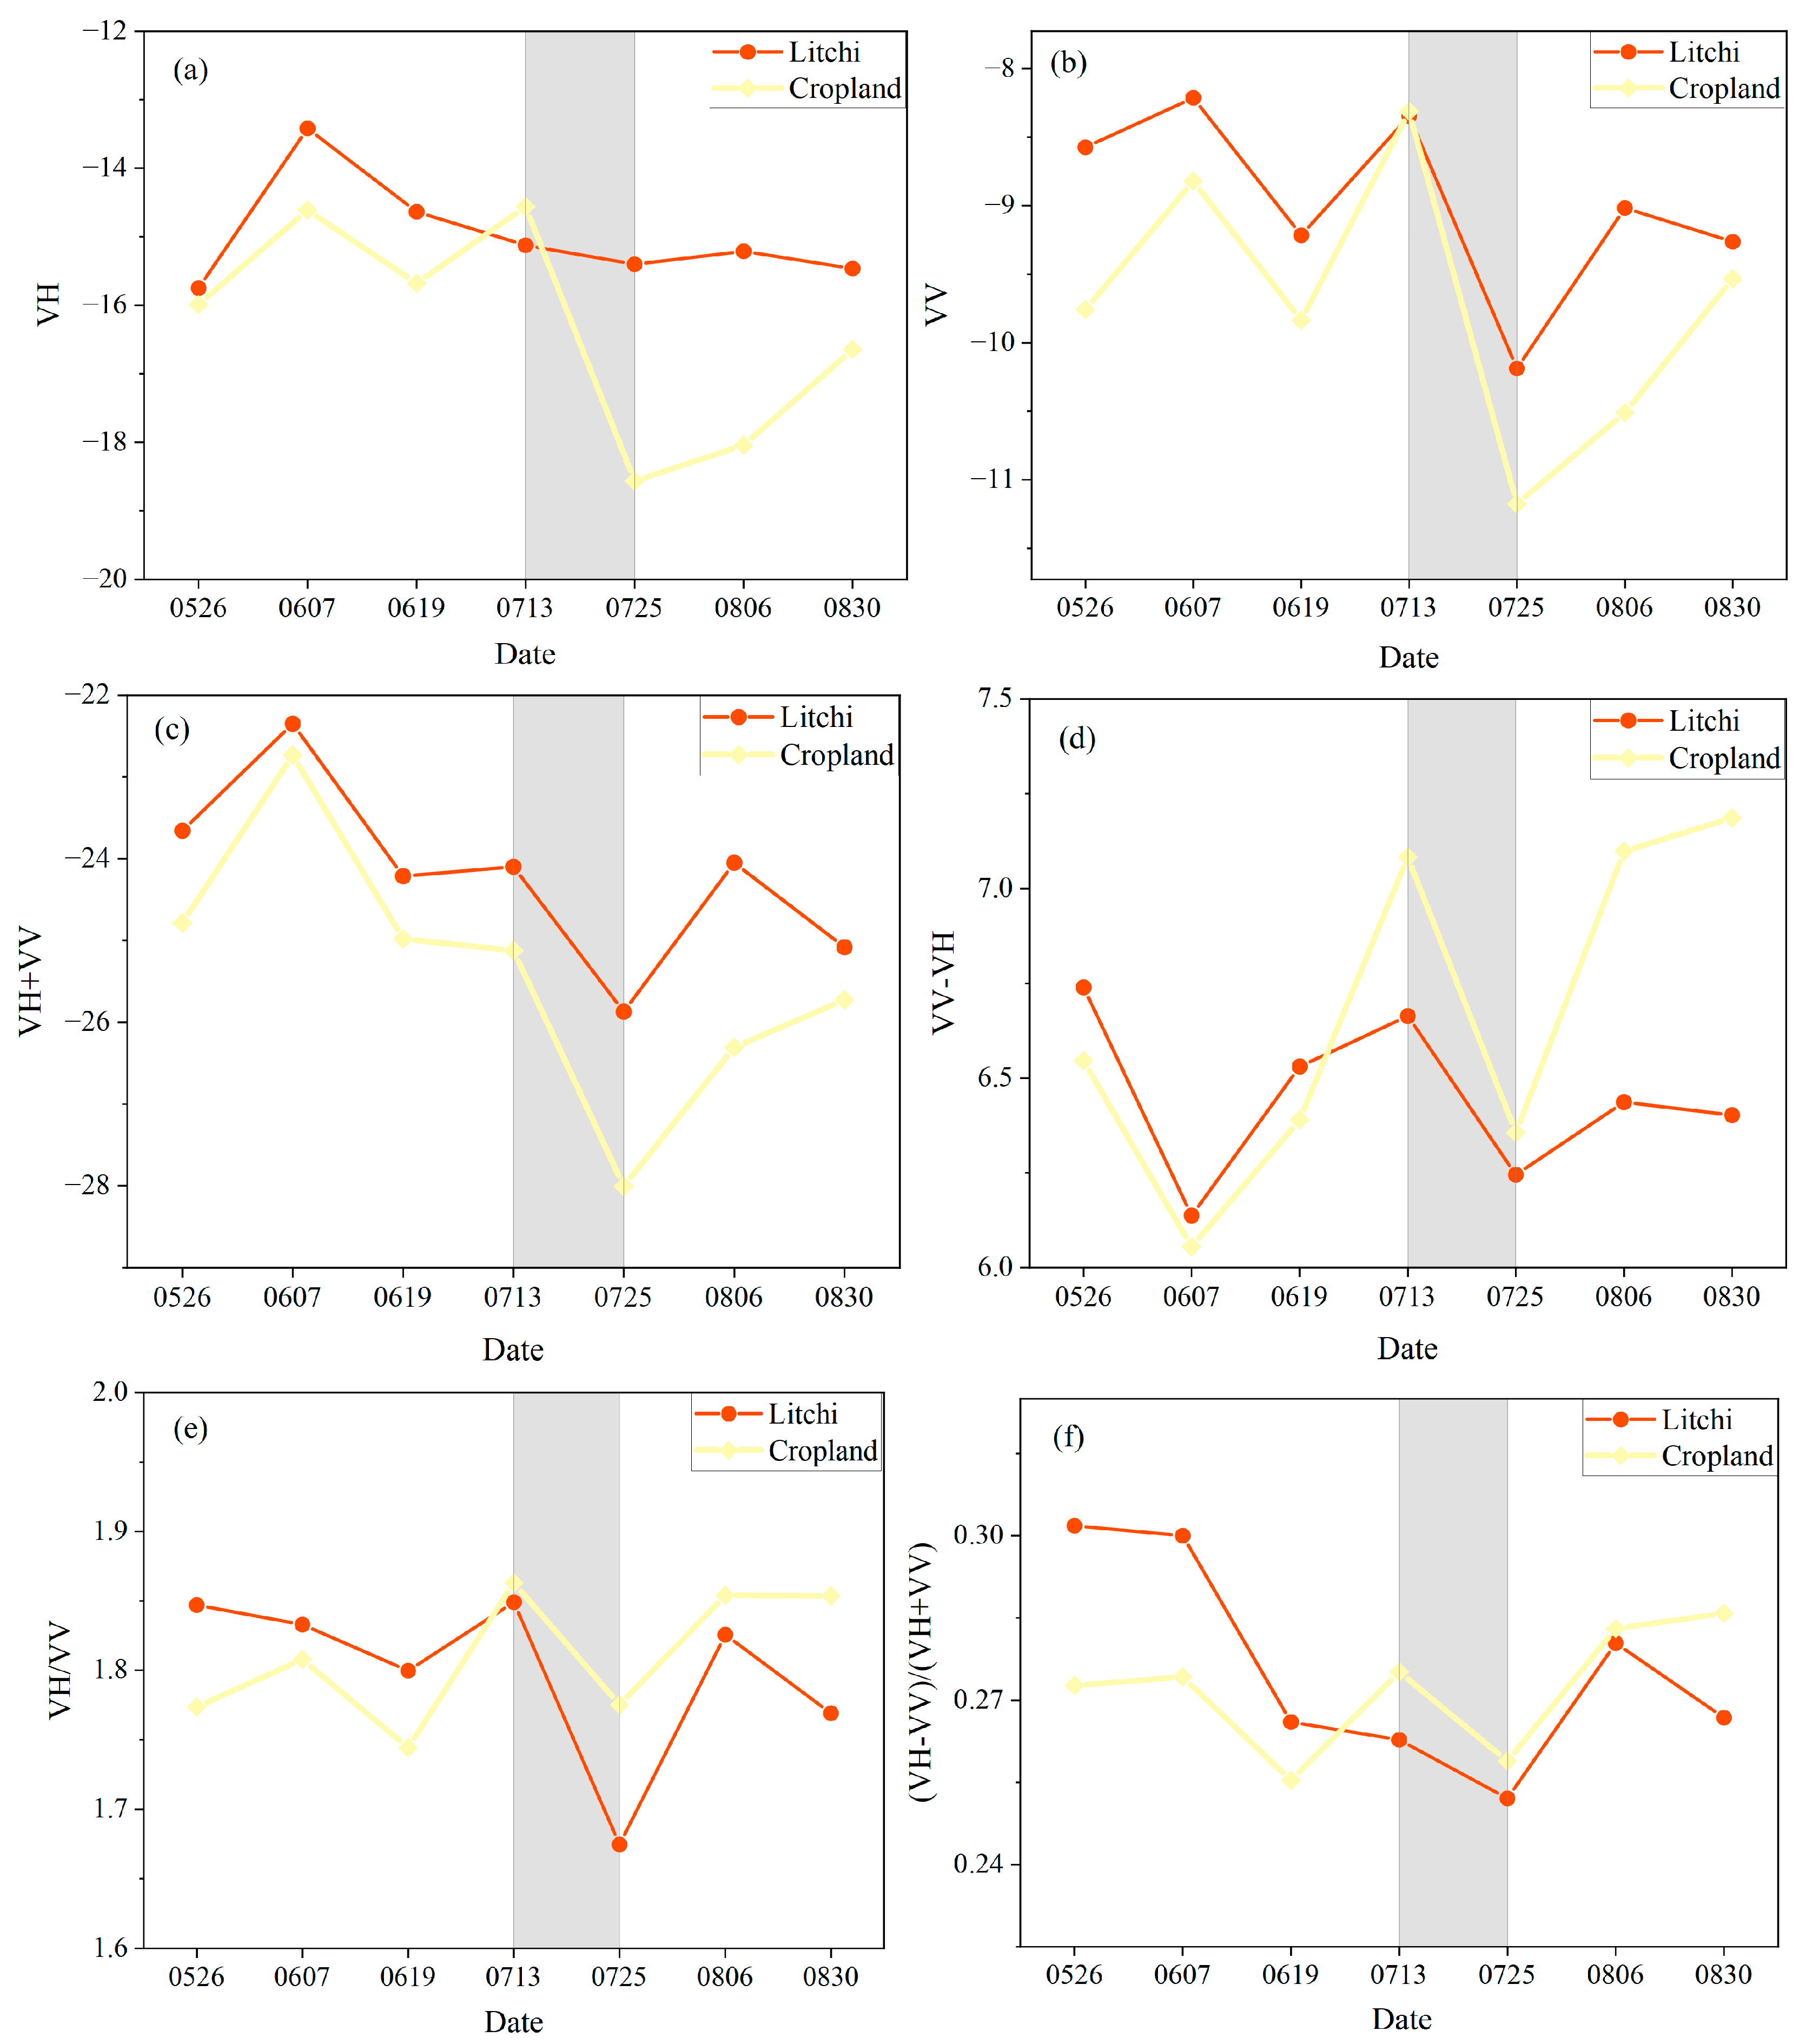
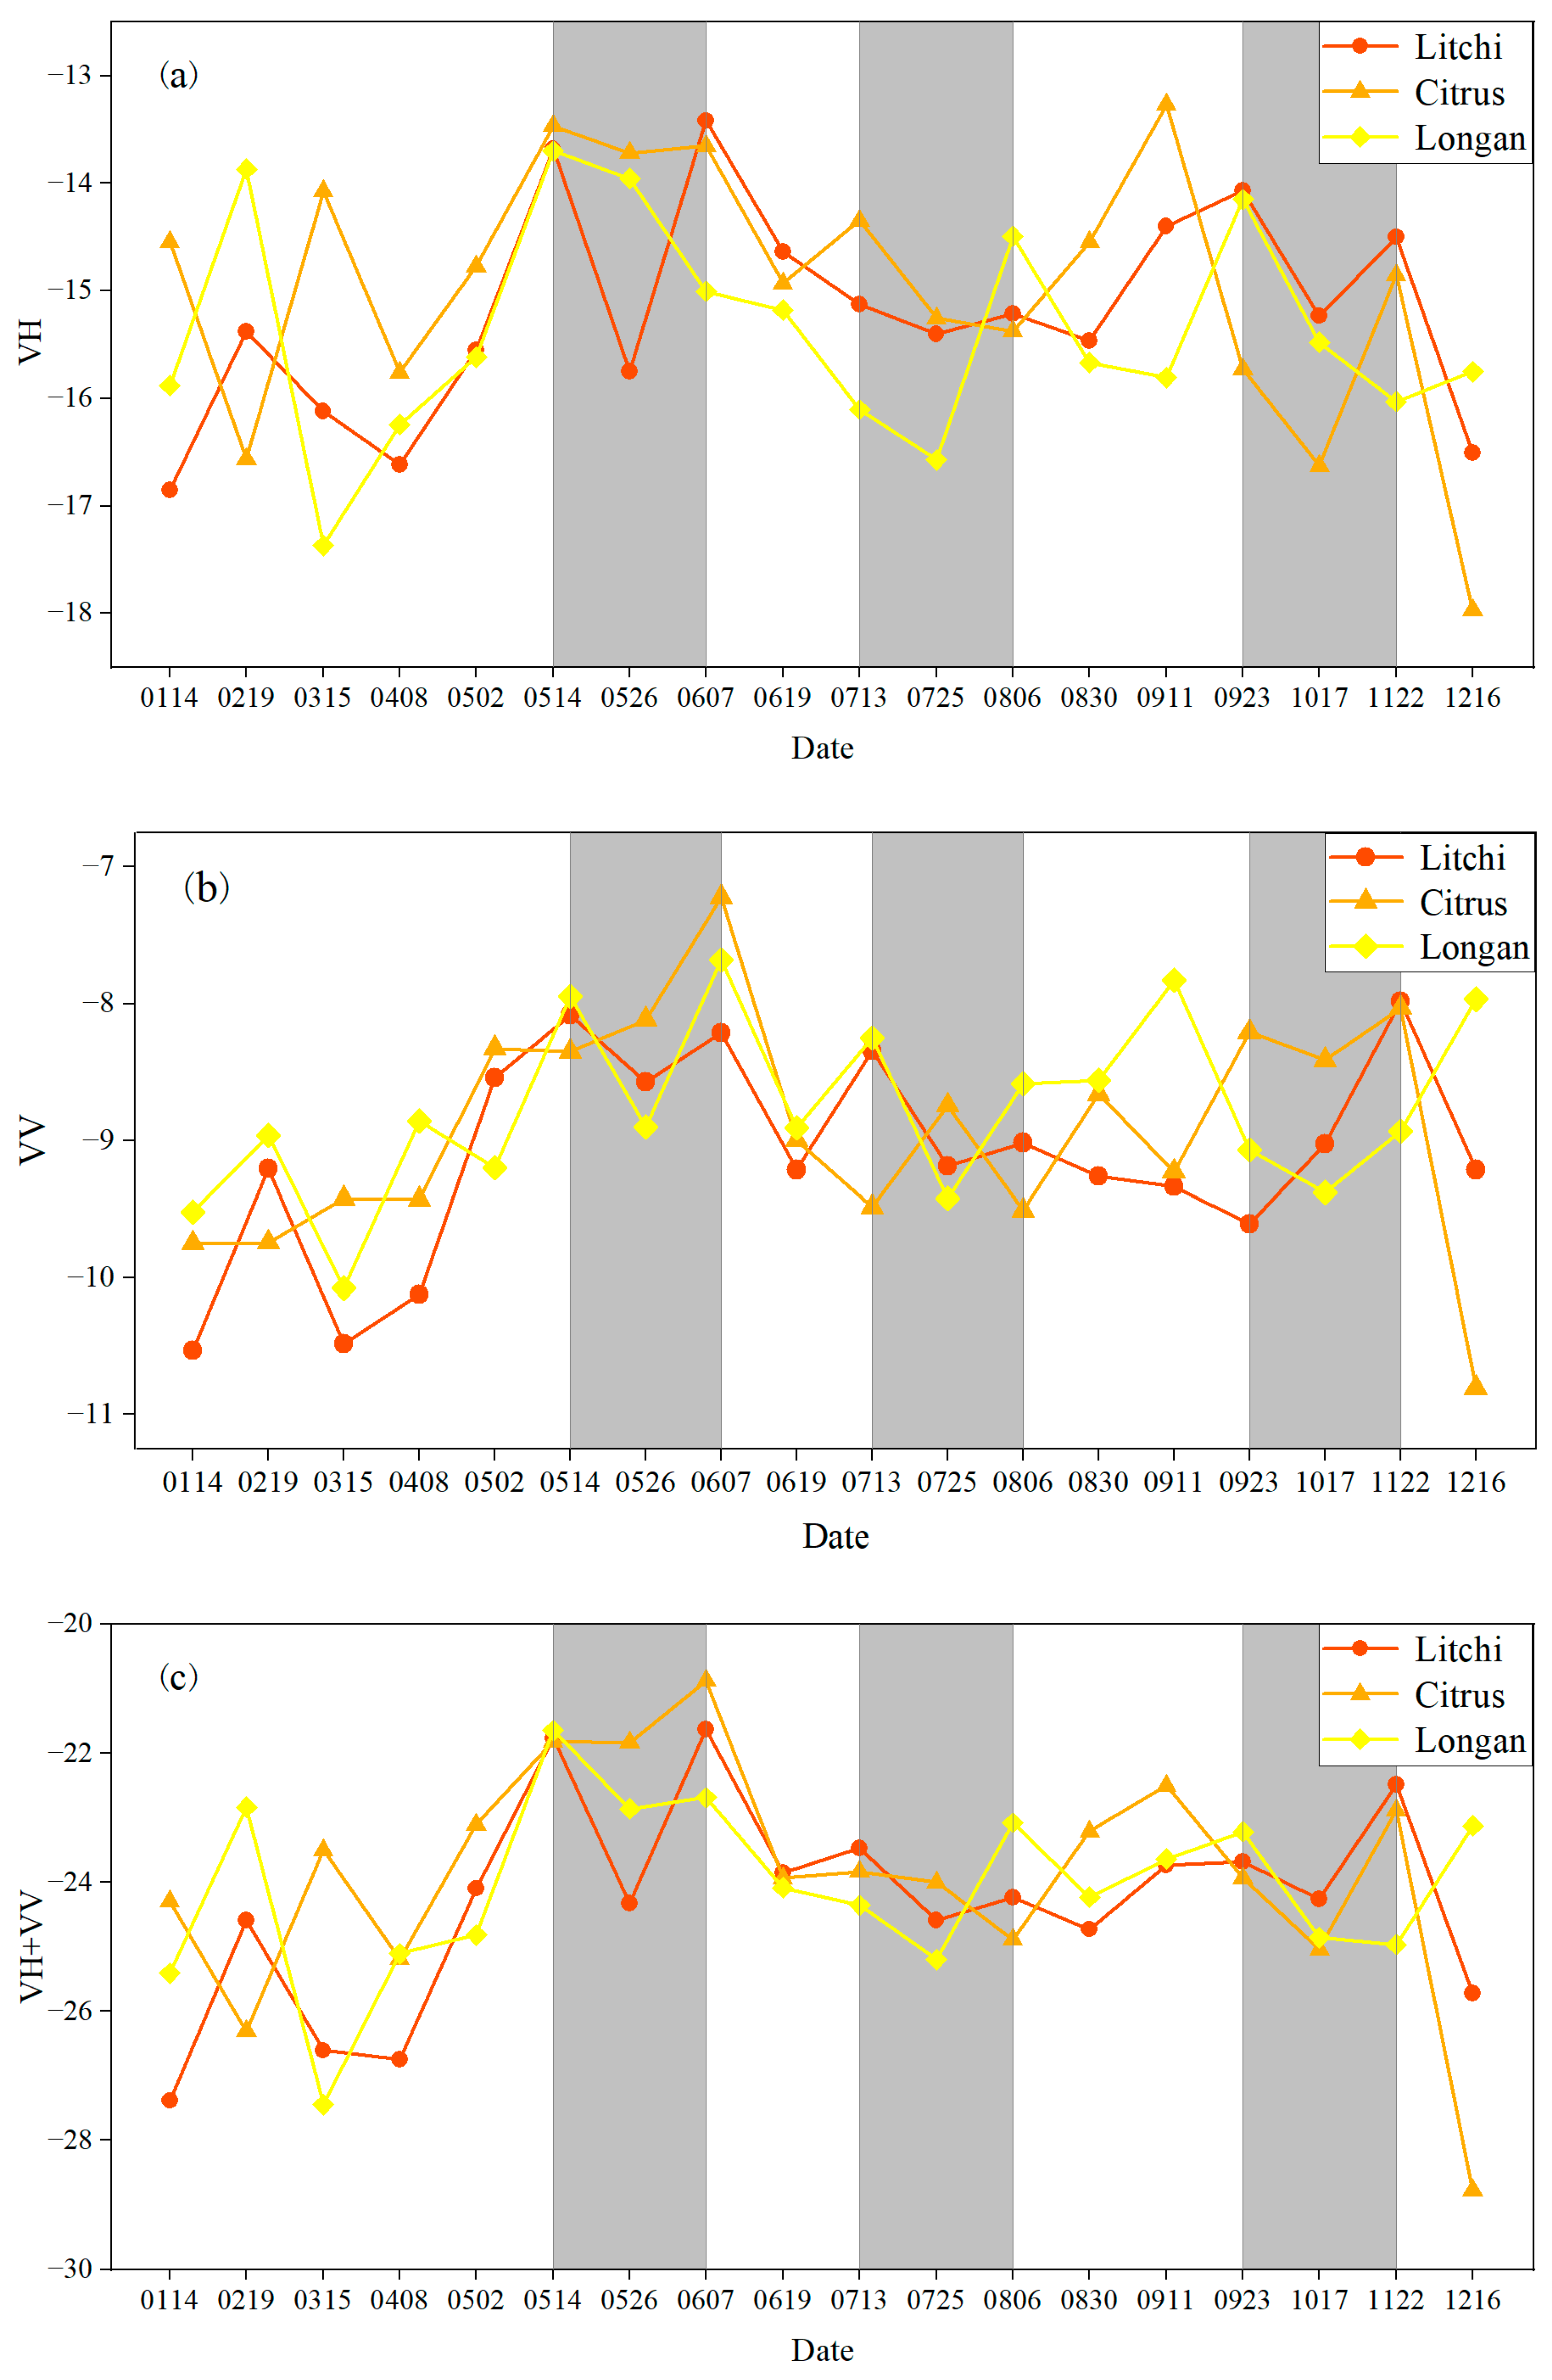
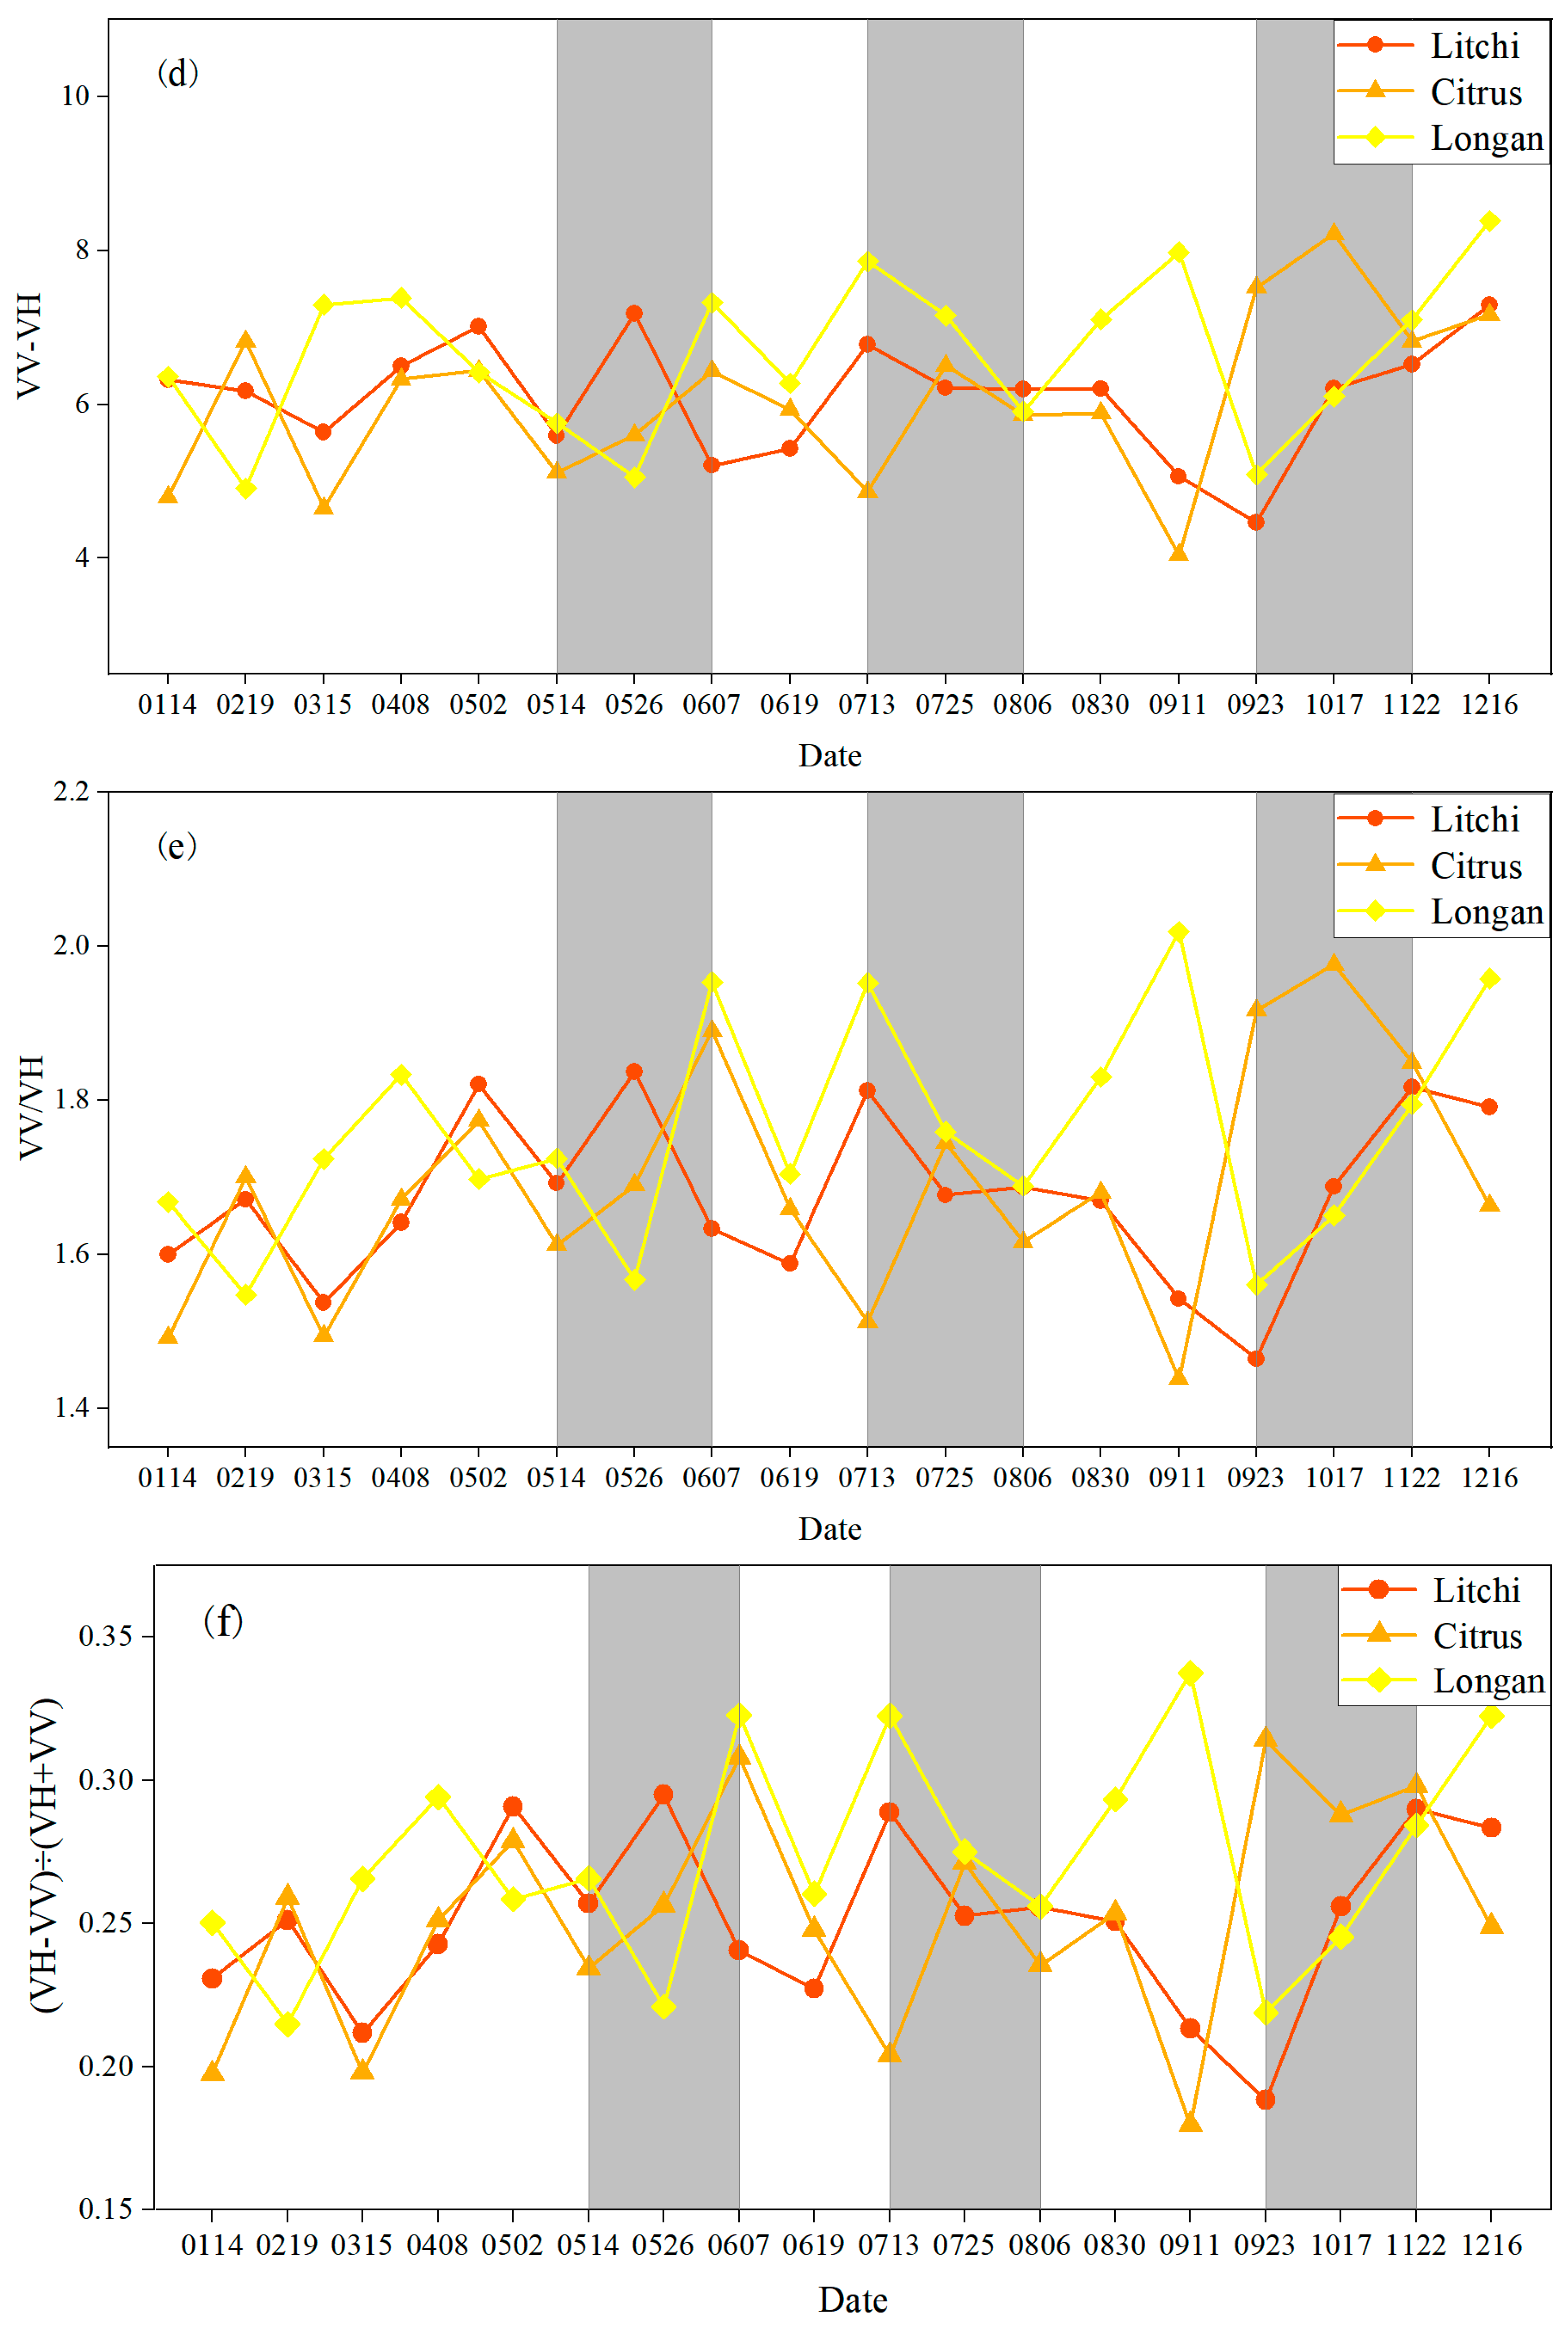
3.1. Characteristics of Different Fruit Trees at Different Growth Stages

The discriminated characteristic parameters of litchi fruit trees and cultivated land with the most favorable results are presented in Figure 4 and Figure A1, as well as the results of the best discriminating characteristic parameters of litchi fruit trees and other forest and vegetation types under the six polarizations and their combinations, respectively. The coefficients for cropland on 13 July and 25 July showed significant disparity, as depicted in Figure 4a, and the range of the difference in cropland was three times greater than that of litchi, although litchi also showed a decreasing trend. Therefore, this growth stage characteristic was chosen as the optimal identification feature of the litchi fruit trees and cropland. From Figure A1a, it can be seen that the data of the litchi fruit trees showed a valley on 26 May, the data on 7 June recovered to the peak, and the height of the valley of other forest and vegetation was only half of that of the litchi fruit trees. Therefore, this growth stage characteristic was selected as the optimal recognition feature for litchi fruit trees and cropland.
The growth stage features of litchi, longan, and citrus fruit trees are shown in Figure 5. The polarization with the strongest separability of the three fruit tree features under the six polarizations and their combinations was selected, and the growth stage features under this polarization were taken as the optimal recognition features. In the VH polarization (Figure 5a), the growth stage features of three fruit trees, i.e., litchi, longan, and citrus, were particularly prominent. Litchi ripened in May, so the data for litchi fruit trees had a trough and then recovered to a peak. Longan, on the other hand, ripened two months later than litchi, with a downward trend and then an upward trend in July. Citrus ripened in September and October, and the backscatter coefficients of litchi and longan did not change significantly during this period. Therefore, the features under these time windows were considered to be the optimal identification features.
The study’s findings indicated that the backscattering intensity of VH polarization exceeded that of VV polarization, which was consistent with the polarization traits of annual crops such as rice, wheat, maize, and sugarcane, as well as wetland flora like reeds and miscanthus [20,53]. Seasonal variations in the growth stage characteristics of annual vegetation can be reflected, whereas the growth stage characteristics of perennial vegetation, such as fruit trees in the tropics and subtropics, were constant throughout the year. Related research indicated that growth stage traits were crucial in distinguishing between various types of flora and crops. Additionally, alterations in the vegetation canopy over the growth cycle can impact the sensitivity of SAR information parameters [54]. While the foliage of fruit tree canopies remains mostly unchanged throughout the seasons, there exists a distinct developmental period during which these plants undergo branch growth, bud differentiation, flowering, fruit growth, and maturation. The results of this study showed that July was the best window of time to identify fruit trees and cropland, which was the period when there were crops harvested in the farmland, so the backscattering coefficient of the cropland will show a cliff-decreasing trend. Similarly, the other five polarization combinations were able to observe a decreasing trend in the backscatter coefficients of fruit trees and cropland within the July time window [34], but none of them were as discriminating as the identified features under VH polarization. It followed that the microwave backscattering properties of the ground feature showed different separation characteristics for different polarization combinations [50]; the distinguishing feature between the fruit trees and cropland obtained under VH polarization was the best.

3.2. Production of Decision Tree

The study area comprised two types of terrain: mountains and plains. Therefore, the first layer of the decision tree was based on the DEM data to separate the mountains and plains, and the area with DEM greater than 300 was recognized as a mountainous area by combining the high-resolution image, and the area with DEM lower than 300 was recognized as a plain. The sensitivity of mountains and plains to different vegetation indices is different, so, according to the sensitivity analysis of the vegetation indices, the EVI and NDVI, which were the most effective in distinguishing mountains and plains, were selected as the second layer of the decision tree. A value of 2.5 was selected as the threshold value of the EVI, and the range of fruit trees was defined as less than 2.5. Meanwhile, 0.45 was selected as the threshold value of the NDVI, the range of fruit trees was defined as less than 0.45, and the threshold value of the range greater than 0.45 was defined as the range of mountain vegetation. Cropland was mostly distributed in the plain area, and the third layer of the decision tree first distinguished cropland. To ensure that the threshold value could cover all cropland, the determination condition of cropland C _ D > 3, the threshold value was greater than 3 for the recognition of cropland, and the value was less than 3 for the recognition of vegetation containing fruit trees. Influenced by the topography of the southern region, there were hills with lower elevations in the plain area, with the planting of some non-cash-crop species, so the fourth layer of the decision tree used the elevation to retain only the height range suitable for litchi fruit tree planting, elevations (ELE) to 150 m as the boundary to remove the mountainous vegetation, and those less than 150 for the existence of fruit trees. The last layer of the decision tree was used to distinguish the fruit trees and other forest and vegetation, based on the two identification parameters of H v and T b . We set the identification conditions as H v > 1 and T b > 1 to extract the litchi fruit trees. The values of the two identification parameters, C r and Lo, were set to C r > 1.5 and Lo > 1 to extract citrus and longan, respectively (as shown in Figure 6).
The validity of the decision tree model for the extraction of fruit trees was confirmed through field survey data and area statistics. However, SAR data can be influenced by topographic factors, and the backscattering coefficients of various features may be relatively similar due to the varying surface properties of lowlands and highlands and the disparate reflection and absorption characteristics of electromagnetic waves [47]. Identifying different features in complex terrain areas using SAR data alone is difficult. The integration of SAR and optical data was necessary to highlight unique features and extract target features successfully. The study area comprised complex mountainous and hilly terrain. The analysis of S-2 visible data using the NDVI and EVI indices effectively distinguished vegetation in different terrain conditions [55]. The backscattering coefficients of the S-1 data were influenced by factors such as the leaf density, planting structure, and water content. These factors made it difficult to determine reasonable vegetation information and a segmentation threshold for vegetation information [56]. The microwave data’s backward scattering coefficient showed marked differences during crop harvesting and sowing compared to fruit trees and other vegetation, with relatively smaller differences.

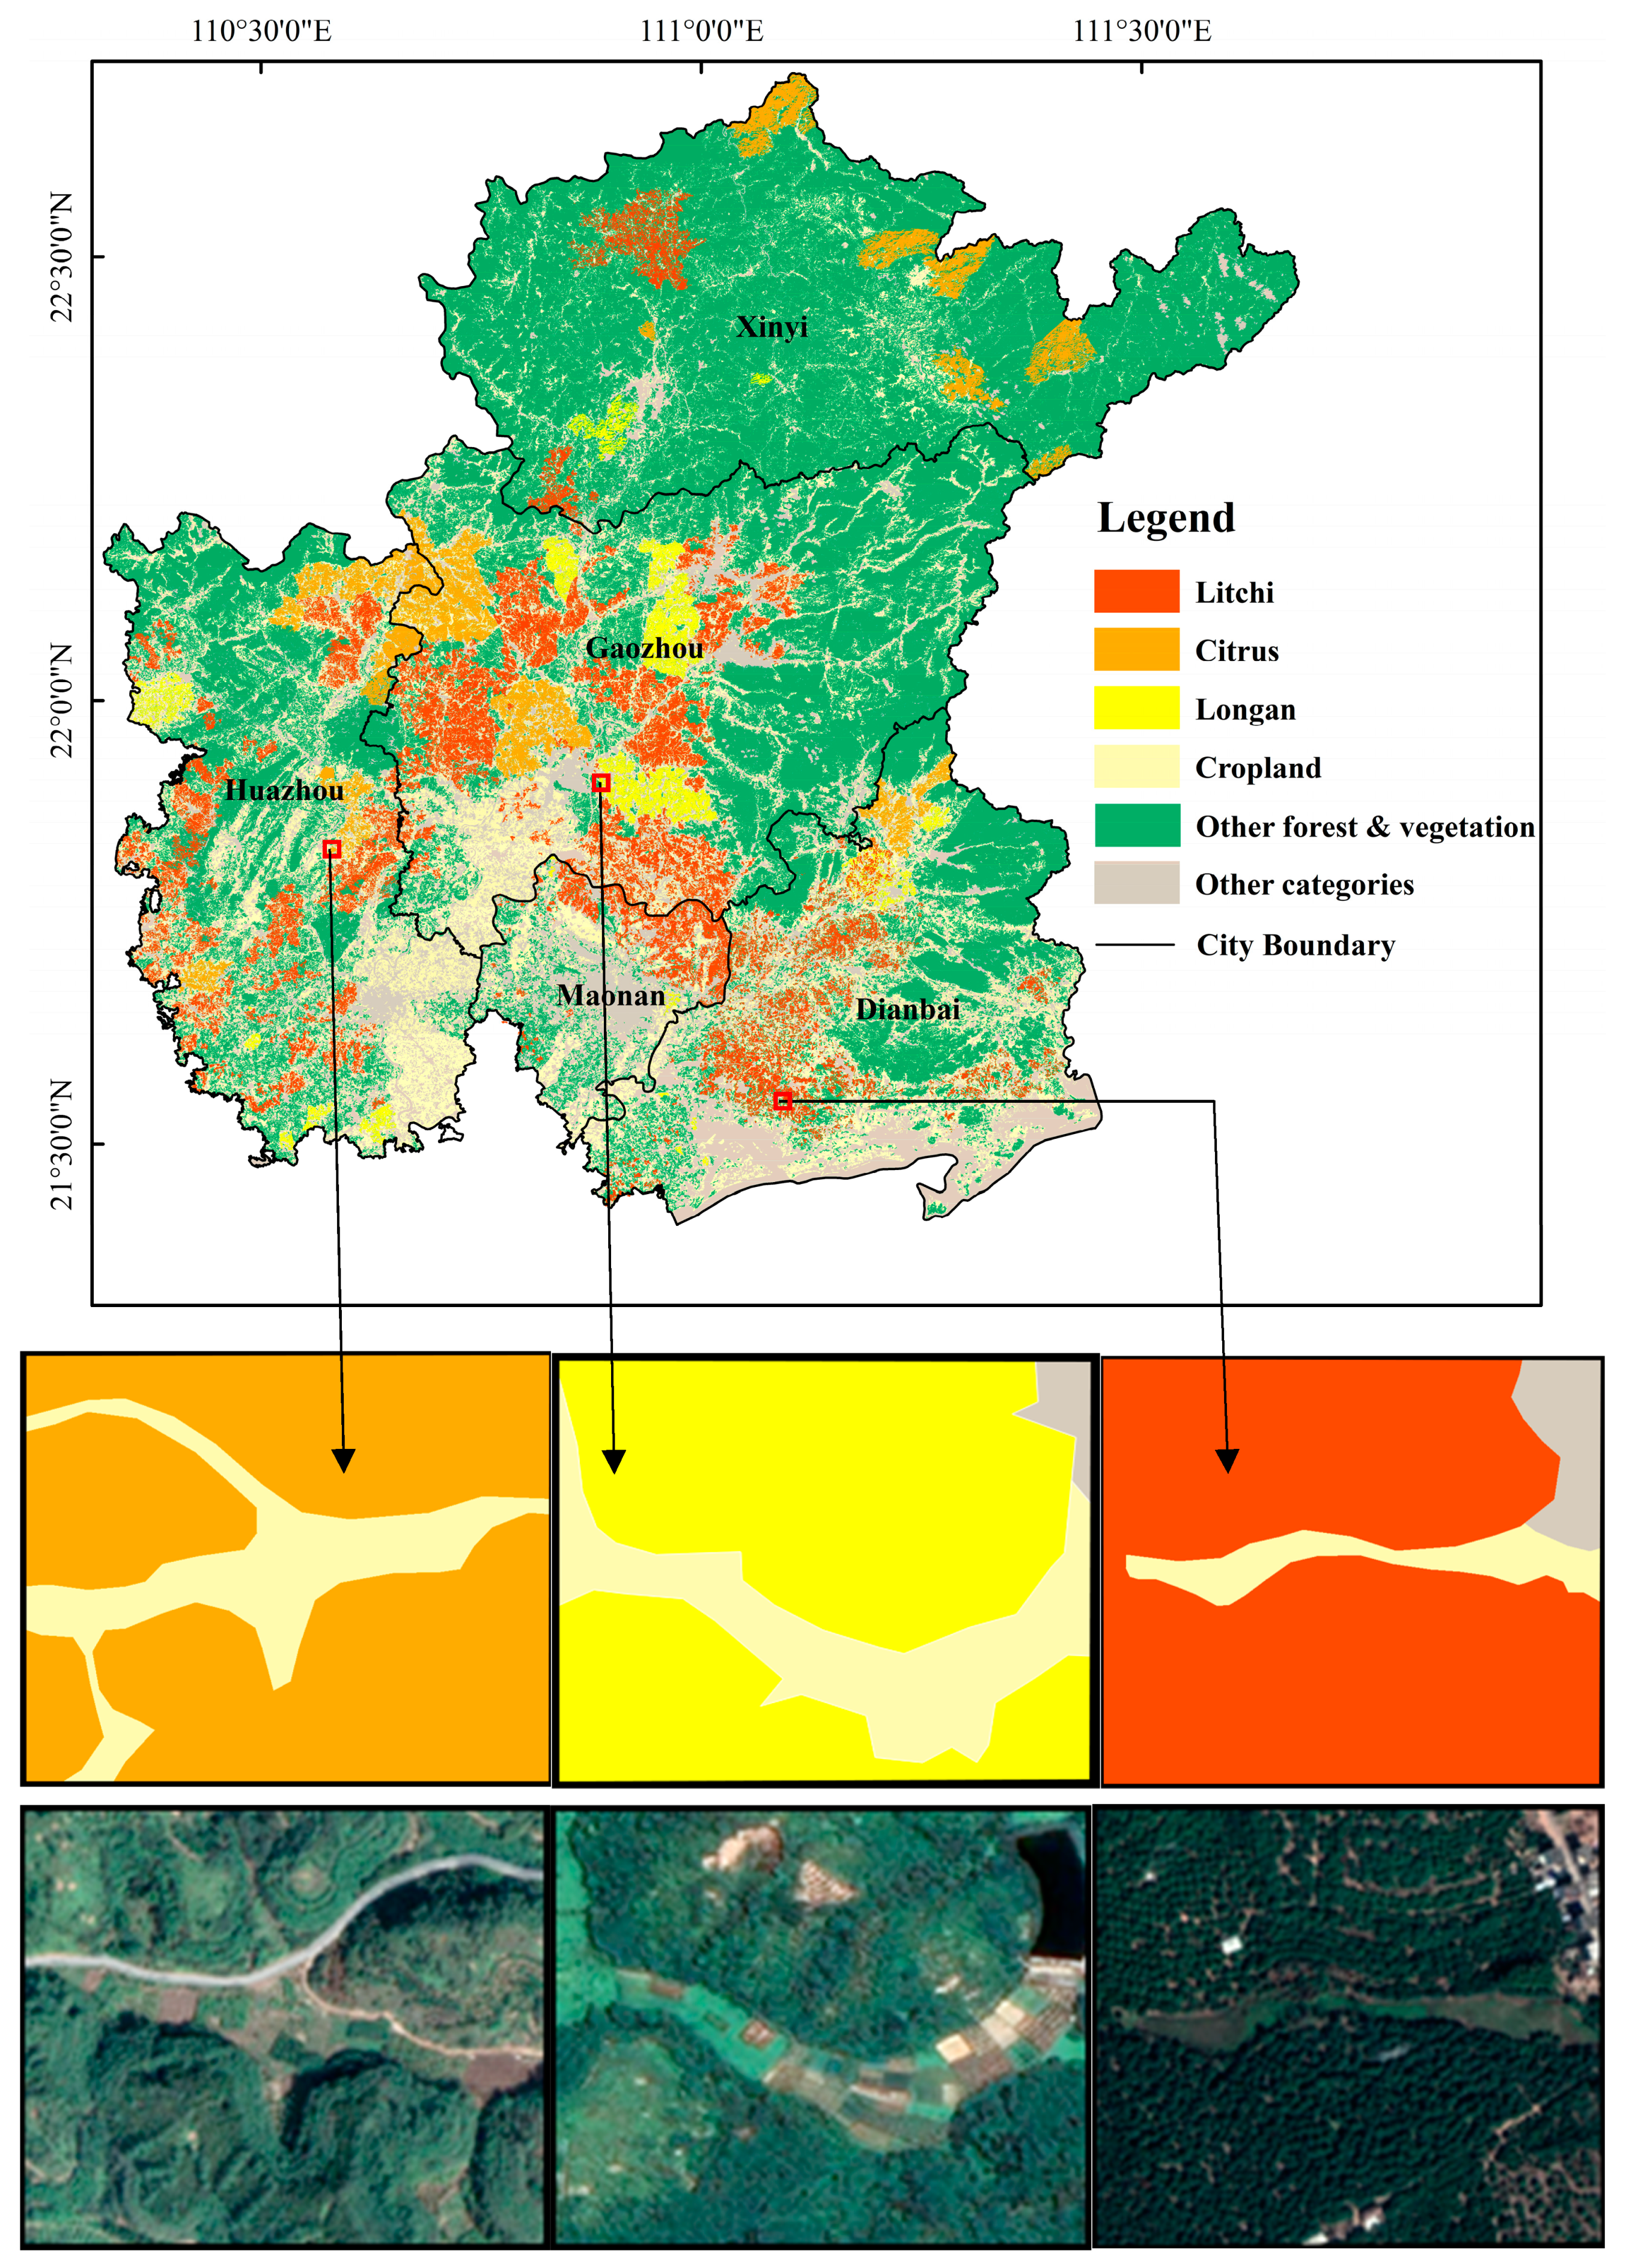
3.3. Spatial Distribution of Litchi Fruit Trees

The key growth stage characteristics and combinations of different polarization characteristics were identified by the decision tree. The proposed fruit tree identification model was tested with satellite data from 2018 and 2022. The recognition results are shown in Figure A3 and Figure 7. The identification results in 2018 were consistent with those in 2022. According to the actual survey, there has been no significant deforestation or reforestation. It confirmed that the identification results were reasonable, and it also demonstrated that the fruit tree identification model was stable. In 2022, the total planting area of litchi in Maoming was about 90,333 hectares, the total area under longan cultivation was about 52,000 hectares, and the total area under citrus cultivation was about 2560 hectares. The recognition accuracy of litchi fruit trees was 90.34%, which was consistent with the results of the field survey. It can be seen from the figure that the planting distribution of the three fruit trees was not uniform. From the north–south direction, the topography of Maoming was mainly divided into southern plains, hills, and northern mountains. In the southern plains and hills, the planting of fruit trees was concentrated and extensive, while, in the northern mountains, the planting area was small and scattered.

3.4. Accuracy Analysis

A confusion matrix was created to assess the accuracy of the decision tree classification method to classify the results for litchi, cropland, and other forest and vegetation (Table 4). OA was 90.34%, with a kappa coefficient of 0.84. The PA value for litchi was 94.31%, PA for other forest and vegetation was 87.33%, and PA for cropland was 88.02%. The UA of litchi was 94.64%, the UA of other forest and vegetation was 85.40%, and the UA of cropland was 89.89%. The extraction results of the litchi fruit trees indicate that the decision-tree-based vegetation recognition method has a high recognition rate for litchi fruit trees. However, the extraction results for both cropland and other forest and vegetation were less than 90.0%, indicating that the method has a low recognition rate for cropland and other forest and vegetation. This is mainly because it is difficult to distinguish the crops planted in the cropland from the wide variety of tree species in the other forest and vegetation types, resulting in a small number of mixed scores among the three crops.
In terms of area, the extracted area of litchi fruit trees matches the officially reported area in Maoming. However, due to the differences in the growth cycles of different litchi species, the method will incorrectly identify some litchi fruit trees as non-litchi fruit trees. Overall, the method in this paper possesses high accuracy in the identification of litchi, other forest and vegetation, and cropland. Due to the insufficient sampling sites of longan and citrus, the extraction of spatial distribution information of these two fruit trees was not assessed. These were also the main shortcomings of this study.

4. Discussion

In this study, the time window for the differentiation of litchi, longan, and citrus fruit trees from other forests and vegetation was the respective maturity period, which was May–June for litchi, July for longan, and September–October for citrus [57]. The shading of foliage by expanding fruit during the ripening period can lead to the weakening of vegetation information [58]. The backscattering coefficient of fruit trees exhibits a discernible trough at the maturity stage, followed by a decreasing and then increasing trend. This characteristic differentiates fruit trees from other vegetation in the identified time frame. Among all the polarization combinations, the trend of identification features under VH polarization was the most obvious, and there was no strong separation between the identification features of the three types of fruit trees and other forest and vegetation in other polarization combinations [39,59]. Therefore, the identification parameters of fruit trees and other forests and vegetation were equally optimal under VH polarization.
This study found that C _ D features based on the crop harvesting and sowing periods are an effective means of distinguishing between cultivated land and vegetation, including litchi. According to Figure A1, the backscattering coefficient of a litchi orchard during its ripening period exhibited a pattern of low and high values within the optimal window period [55]. Furthermore, a distinct valley value was observed, which allowed for the effective differentiation of the litchi orchard from other vegetation by means of the T b and H v features during the optimal window period. During the ripening period, citrus and longan possess valley value characteristics, which allowed the Cr and Lo features to distinguish citrus and longan orchards from other vegetation at the optimal window for these fruits. This study introduced an improved decision tree model that effectively extracts the spatial distribution information of fruit trees.
The innovative combination of long-time-series SAR and high-spatial-resolution optical imagery was effectively utilized in this study, and the final extraction results were obtained relatively accurately. However, according to the vegetation extraction result map, there were still some problems in the application of the decision tree model used in this study to extract fruit trees, and the classification results depended on the similarity between the precise sample size and the topography of fruit trees. Moreover, the algorithm needs to be tested in a larger area with a complex planting structure [60]. Therefore, the final results may have included some incorrect scores and omissions. The main reason for the error was that there were different varieties of the same fruit trees grown in the study area, and there was a slight difference in the phenological period. Secondly, sparse woodlands and thickets were more similar to the spectrum of fruit trees, which made it easy to confuse them [61]. In the case of litchi fruit trees, there were early- and late-maturing litchi species, and the time window for the identification of the characteristics of litchi fruit trees in this study was in May and early June. However, for late-maturing varieties, this period was in the growing period, and not yet the period to produce recognition features [46]. Therefore, these late-maturing litchi fruit trees could not be accurately extracted during the recognition process. In the southern plains area, fruit trees were more densely planted, and the vegetation information was more prominent and more accurately recognized. In sparsely planted areas, the surface information had a greater influence on the vegetation information of fruit trees, which will lead to detection and classification errors.
The models applied to the extraction of fruit trees in different terrains of mountains and plains were slightly different, and the thresholds of the optimal recognition parameters were set in different ranges [62]. This study mainly focused on the extraction of fruit trees in the plains, and the applicability of the decision tree model to the identification of fruit trees in mountainous areas was low, so the effects of different terrains on the identification methods need to be taken into account [54], which was also lacking in this study. Thus, the decision tree model developed is better suited for the identification of fruit trees in flat areas. The model’s performance is influenced by the topography, fruit tree varieties, and planting density. The classification results presented in this paper are solely based on the sample size of fruit trees in Maoming City. Therefore, a more universally applicable classification model needs to be constructed and tested in a wider area with complex planting structures. In addition, the S-1A satellite data contained only two polarization modes, and it is necessary to further study the effect of quadrupolar radar data with more scattering information in vegetation extraction [57,63].

5. Conclusions

The spatial mapping of orchards is essential in monitoring tree growth, estimating yields, and managing planting. This study used S-1 dual-polarization multi-temporal data to design a new decision tree method for the extraction of the spatial distribution information of various fruit trees by combining growth stage features and backscattering coefficients. There was a significant difference in the characteristics of mature fruit trees when compared to other forest and vegetation types in the research area. During this period, there were changes in the size and color of the fruit. The spectral data of the vegetation on fruit trees has undergone significant alterations, enabling the recognition of the spatial distribution of various fruit tree categories. Characteristics for the identification of fruit trees exhibit different separability qualities in six polarization combinations: VV, VH, VV + VH, VV − VH, VH/VV, and (VH − VV)/(VH + VV). The top five identifying features, C _ D , T b , H v , L o , and C r , have been found to be the most significant markers for differentiation between fruit trees, cropland, other vegetation, and each other using VH polarization. Consequently, VH polarization is deemed the most critical polarization in the classification model as it demonstrates greater sensitivity to the identification features.
Litchi, logan, and citrus plantations were widely distributed throughout the region. However, due to the monsoon’s impact on Maoming during the fruit tree growth cycle, there was insufficient visible image data and a lack of spectral information in the growth stage period. To address this issue, this study employed S-1 microwave data to create a time-series model that identified the essential growth stage characteristics of fruit trees, and it evaluated the model’s accuracy in distinguishing between different fruit trees. The proposed recognition model achieved overall accuracy of 90.34% in recognizing fruit trees, with a kappa coefficient of 0.84. The method offers valuable theoretical support for the remote sensing identification of fruit trees in cloudy and rainy conditions, as well as serving as a reference and foundation for perennial evergreen crops in the tropics and subtropics.

Author Contributions

Conceptualization, L.H. and D.L.; Data curation, X.W., S.W. and Z.Z.; Formal analysis, X.W.; Funding acquisition, L.H.; Investigation, D.L. and W.Y.; Project administration, L.H.; Resources, D.L. and W.Y.; Software, L.H., X.L., X.G. and J.F.; Supervision, L.H. and Z.F.; Validation, D.L.; Visualization, S.W. and Z.Z.; Writing—original draft, X.W.; Writing—review and editing, L.H., D.L. and Z.F. All authors have read and agreed to the published version of the manuscript.

Funding

This research was supported by the Natural Science Foundation of Shandong Province, grant numbers ZR2020MD018 and ZR2020MD015, and by the National Natural Science Foundation of China, grant number 42171413; Guangdong Province Agricultural Science and Technology Innovation and Promotion Project (2023KJ102).

Data Availability Statement

The data presented in this study are available on request from the author.

Acknowledgments

The authors would like to thank the anonymous reviewers for their helpful comments that improved the manuscript.

Conflicts of Interest

Author Wenjie Yu was employed by the Maoming Meteorological Observatory of Guangdong Province. Author Xingqiang Lu was employed by company Satellite (SHANDONG) Technology Group Co., Ltd. Author Xin Gao was employed by company GEOVIS Wisdom Technology Co., Ltd. The remaining authors declare that the research was conducted in the absence of any commercial or financial relationships that could be construed as a potential conflict of interest.

Appendix A

Figure A1. Differentiability of spectral features of litchi and other forest and vegetation under different polarizations. (a) VH polarization difference, (b) VV polarization difference, (c) VH + VV polarization difference, (d) VV − VH polarization difference, (e) VH/VV polarization difference, (f) (VH − VV)/(VH + VV) polarization difference.
Agronomy 14 00150 g0a1aAgronomy 14 00150 g0a1b
Figure A2. Comparison of spectral curves of litchi, logan, and citrus.
Agronomy 14 00150 g0a2
Figure A3. Results of spatial information extraction mapping of citrus, longan, and litchi fruit trees in 2018.
Agronomy 14 00150 g0a3

References

  1. Li, M.Z.; Cheng, S.L.; Meng, Z.G. Development status and countermeasures of major fruit trees in China. Agric. Sci. Technol. Newsl. 2023, 92, 11–16. Available online: http://tongxun.aiijournal.com/CN/Y2023/V0/I9/11 (accessed on 28 November 2023).
  2. Liang, C.X.; Huang, Q.H.; Wang, S.; Wang, C.; Yu, Q.Y.; Wu, W.B. Identification of citrus orchards based on multi-temporal remote sensing vegetation index. J. Agric. Eng. 2021, 37, 168–176. [Google Scholar] [CrossRef]
  3. Wang, H.; Magagi, R.; Goïta, K.; Trudel, M.; McNairn, H.; Powers, J. Crop phenology retrieval via polarimetric SAR decomposition and Random Forest algorithm. Remote Sens. Environ. 2019, 231, 111234. [Google Scholar] [CrossRef]
  4. Luo, Y.Z.; Bai, B.; Yu, X.Y.; Peng, X.Y. Analysis of research situation of remote sensing monitoring of agriculture in China based on scientific knowledge mapping. Liaoning Agric. Sci. 2023, 30–34. [Google Scholar] [CrossRef]
  5. Wang, Z.Q.; Zhang, H.Y.; He, W.; Zhang, L.P. Cross-phenological-region crop mapping framework using Sentinel-2 time series Imagery, A new perspective for winter crops in China. ISPRS J. Photogramm. Remote Sens. 2022, 193, 200–215. [Google Scholar] [CrossRef]
  6. He, T.T.; Guo, J.W.; Xiao, W.; Xu, S.C.; Chen, H. A novel method for identification of disturbance from surface coal mining using all available Landsat data in the GEE platform. ISPRS J. Photogramm. Remote Sens. 2023, 205, 17–33. [Google Scholar] [CrossRef]
  7. Song, W.Y.; Wang, C.; Dong, T.F.; Wang, Z.H.; Wang, C.X.; Mu, X.D.; Zhang, H.X. Hierarchical extraction of cropland boundaries using Sentinel-2 time-series data in fragmented agricultural landscapes. Comput. Electron. Agric. 2023, 212, 108097. [Google Scholar] [CrossRef]
  8. Tehrani, N.A.; Farhanj, F.; Janalipour, M. Introducing a novel dust source identification method based on edge points and paths extracted from integration of time-series MODIS products. Remote Sens. Appl. Soc. Environ. 2023, 32, 101054. [Google Scholar] [CrossRef]
  9. Cui, C.; Liu, Y.S.; Chen, L.; Liang, S.; Shan, M.; Zhao, J.W.; Liu, Y.X.; Yu, S.B.; Sun, Y.L.; Mao, J. Assessing public health and economic loss associated with black carbon exposure using monitoring and MERRA-2 data. Environ. Pollut. 2022, 313, 120190. [Google Scholar] [CrossRef]
  10. Graesser, J.; Ramankutty, N. Detection of cropland field parcels from Landsat imagery. Remote Sens. Environ. 2017, 21, 165–180. [Google Scholar] [CrossRef]
  11. Li, H.J.; Li, Z.; Lei, Y.P.; Li, C.Q.; Zhou, K. Comparison of NDVI and EVI based on EOS/MODIS data. Prog. Geogr. 2007, 26, 26–32. [Google Scholar] [CrossRef]
  12. Qi, N.; Yang, H.; Shao, G.W.; Chen, R.Q.; Wu, B.G.; Xu, B.; Feng, H.K.; Yang, G.J.; Zhao, C.J. Mapping tea plantations using multitemporal spectral features by harmonised Sentinel-2 and Landsat images in Yingde, China. Comput. Electron. Agric. 2023, 212, 108108. [Google Scholar] [CrossRef]
  13. Mazumder, B.; Khan, M.S.I.; Uddin, K.M.M. Biorthogonal wavelet based entropy feature extraction for identification of maize leaf diseases. J. Agric. Food Res. 2023, 14, 100756. [Google Scholar] [CrossRef]
  14. Shu, M.Y.; Zhou, L.F.; Gu, X.H.; Yun, T.; Ma, Q.; Yang, G.J.; Zhou, C.Q. Monitoring of maize lodging using multi-temporal Sentinel-1 SAR data. Adv. Space Res. 2020, 65, 470–480. [Google Scholar] [CrossRef]
  15. Singh, S.K.; Prasad, R.; Srivastava, P.K.; Yadav, S.A.; Yadav, V.P.; Sharma, J. Incorporation of first-order backscattered power in Water Cloud Model for improving the Leaf Area Index and Soil Moisture retrieval using dual-polarized Sentinel-1 SAR data. Remote Sens. Environ. 2023, 296, 113756. [Google Scholar] [CrossRef]
  16. Luo, C.; Liu, H.J.; Lu, L.P.; Liu, Z.R.; Kong, F.C.; Zhang, X.L. Monthly composites from Sentinel-1 and Sentinel-2 images for regional major crop mapping with Google Earth Engine. J. Integr. Agric. 2021, 7, 1944–1957. [Google Scholar] [CrossRef]
  17. Luis, F.C.R.; Laurindo, A.G.; Simio, J.P.D.; Belloli, T.F.; Fernandes, P.C.B. Object-based classification of vegetation species in a subtropical wetland using Sentinel-1 and Sentinel-2A images. Sci. Remote Sens. 2021, 3, 100017. [Google Scholar] [CrossRef]
  18. Yu, T.Y.; Ni, W.J.; Liu, J.L.; Zhao, R.Q.; Zhang, Z.Y.; Sun, G.Q. Extraction of tree heights in mountainous natural forests from UAV leaf-on stereoscopic imagery based on approximation of ground surfaces. Remote Sens. Environ. 2023, 293, 113613. [Google Scholar] [CrossRef]
  19. Mandal, D.; Kumar, V.; Ratha, D.; Dey, S.; Bhattacharya, A.; Lopez-Sanchez, J.M.; McNairn, H.; Rao, Y.S. Dual polarimetric radar vegetation index for crop growth monitoring using sentinel-1 SAR data. Remote Sens. Environ. 2020, 247, 111954. [Google Scholar] [CrossRef]
  20. Adrian, J.; Sagan, V.; Maitiniyazi, M. Sentinel SAR-optical fusion for crop type mapping using deep learning and Google Earth Engine. ISPRS J. Photogramm. Remote Sens. 2021, 175, 215–235. [Google Scholar] [CrossRef]
  21. Liu, P.L.; Huang, J.J.; Cai, Z.; Chen, H.T.; Huang, X.; Yang, S.N.; Su, Z.X.; Azam, M.; Chen, H.; Shen, J. Influence of girdling on growth of litchi (Litchi chinensis) roots during cold-dependent floral induction. Sci. Hortic. 2022, 297, 110928. [Google Scholar] [CrossRef]
  22. Topouzelis, K.; Psyllos, A. Oil spill feature selection and classification using decision tree forest on SAR image data. ISPRS J. Photogramm. Remote Sens. 2012, 68, 135–143. [Google Scholar] [CrossRef]
  23. Jin, S.L.; Zhang, W.D.; Yang, P.F.; Zheng, Y.; An, J.L.; Zhang, Z.Y.; Qu, P.X.; Pan, X.P. Spatial-spectral feature extraction of hyperspectral images for wheat seed identification. Comput. Electr. Eng. 2022, 101, 108077. [Google Scholar] [CrossRef]
  24. Wu, G.S.; Fang, Y.L.; Jiang, Q.Y.; Cui, M.; Li, N.; Ou, Y.M.; Diao, Z.H.; Zhang, B.H. Early identification of strawberry leaves disease utilizing hyperspectral imaging combing with spectral features, multiple vegetation indices and textural features. Comput. Electron. Agric. 2023, 204, 107553. [Google Scholar] [CrossRef]
  25. Xu, P.; Fu, L.X.; Xu, K.; Sun, W.B.; Tan, Q.; Zhang, Y.P.; Zha, X.T.; Yang, R.B. Investigation into maize seed disease identification based on deep learning and multi-source spectral information fusion techniques. J. Food Compos. Anal. 2023, 119, 105254. [Google Scholar] [CrossRef]
  26. Rouhollah, N.; Fusun, B.S.; Saygin, A.; Ziyadin, C.; Aliihsan, S.; Mustafa, U. Sensitivity Analysis of Multi-Temporal Sentinel-1 SAR Parameters to Crop Height and Canopy Coverage. Appl. Sci. 2019, 9, 655. [Google Scholar] [CrossRef]
  27. Bhogapurapu, N.; Dey, S.; Bhattacharya, A.; Mandal, D.; Juan, M.L.S.; McNairn, H.; Carlos, L.M.; Rao, Y.S. Dual-polarimetric descriptors from Sentinel-1 GRD SAR data for crop growth assessment. ISPRS J. Photogramm. Remote Sens. 2021, 178, 20–35. [Google Scholar] [CrossRef]
  28. Raman, M.G.; Kaliaperumal, R.; Pazhanivelan, S.; Kannan, B. Rice area estimation using parameterized classification of Sentinel 1A SAR data. The international archives of the photogrammetry. Remote Sens. Spat. Inf. Sci 2019, XLII-3, 141–147. [Google Scholar] [CrossRef]
  29. Alvarez, R.D.D.; Apan, A. Deep learning U-Net classification of Sentinel-1 and 2 fusions effectively demarcates tropical montane forest deforestation. Remote Sens. Appl. Soc. Environ. 2023, 29, 100887. [Google Scholar] [CrossRef]
  30. Dai, X.M.; Chen, S.S.; Jia, K.; Jiang, H.; Sun, Y.H.; Li, D.; Zheng, Q.; Huang, J. A Decision-Tree Approach to Identifying Paddy Rice Lodging with Multiple Pieces of Polarization Information Derived from Sentinel-1. Remote Sens. 2022, 15, 240. [Google Scholar] [CrossRef]
  31. Octavio, L.-G.; Ernesto, R.-S.; Miguel, A. M-P. Towards improving decision tree induction by combining split evaluation measures. Knowl.-Based Syst. 2023, 277, 110832. [Google Scholar] [CrossRef]
  32. Li, L.W.; Li, N.; Lu, D.S. Mapping tea gardens spatial distribution in northwestern Zhejiang Province using multi-temporal Sentinel-2 imagery. J. Zhejiang AF Univ. 2019, 36, 841–848. [Google Scholar] [CrossRef]
  33. Shen, Q. Survey of Live Resources and Genetic Diversity of Early-Maturing Litchi in Southwestern Guangxi. Master’s Thesis, Guangxi University, Nanning, China, 2012. [Google Scholar]
  34. Zhu, M.Q.; She, B.; Huang, L.S.; Zhang, D.Y.; Xu, H.F.; Yang, X.Y. Identification of soybean based on Sentinel-1/2 SAR and MSI imagery under a complex planting structure. Ecol. Inform. 2022, 72, 101825. [Google Scholar] [CrossRef]
  35. Liu, X.; Jiang, Y.J. Extraction of pre-wintering area of winter wheat in Hengshui City based on Sentinel-1 and Sentinel-2 data. Sci. Technol. Inf. 2021, 19, 92–94. [Google Scholar] [CrossRef]
  36. Zhao, L.C.; Li, Q.Z.; Chang, Q.R.; Shang, J.L.; Du, X.; Liu, J.G.; Dong, T. In-season crop type identification using optimal feature knowledge graph. ISPRS J. Photogramm. Remote Sens. 2022, 194, 250–266. [Google Scholar] [CrossRef]
  37. Mao, L.; Jin, C.; Song, Z.; Li, J. Characterization of climate change in Maoming City from 1980 to 2021. Meteorol. Hydrol. Mar. Instrum. 2023, 40, 67–69+72. [Google Scholar] [CrossRef]
  38. Xiao, Y.C.; Wang, H.G.; Zhang, L.; Xu, W.L. Two methods of selecting Gaussian kernel parameters for one-class SVM and their application to fault detection. Knowl.-Based Syst. 2014, 59, 75–84. [Google Scholar] [CrossRef]
  39. Ma, Z.F.; Liu, J.H.; Aoki, Y.; Wei, S.J.; Liu, X.L.; Cui, Y.C.; Hu, J.; Zhou, C.; Qin, S.H.; Huang, T.; et al. Towards big SAR data era, An efficient Sentinel-1 Near-Real-Time InSAR processing workflow with an emphasis on co-registration and phase unwrapping. ISPRS J. Photogramm. Remote Sens. 2022, 188, 86–300. [Google Scholar] [CrossRef]
  40. Chang, W.T.; Wang, H.; Ning, X.G.; Zhang, H.C. Information extraction of Zalong wetland by fusing Sentinel-2 red edge band and Sentinel-1 radar band images. Wetl. Sci. 2020, 18, 10–19. [Google Scholar] [CrossRef]
  41. Xue, Y.J.; Beauseroy, P. Transfer learning for one class SVM adaptation to limited data distribution change. Pattern Recognition Lett. 2017, 100, 7–123. [Google Scholar] [CrossRef]
  42. He, X.; Mourot, G.; Maquin, D.; Ragot, J.; Beauseroy, P.; Smolarz, A.; Grall-maës, E. Multi-task learning with one-class SVM. Neurocomputing 2014, 133, 416–426. [Google Scholar] [CrossRef]
  43. Xia, J.; Su, T.; Liu, L.N.; Wang, J.; Zhu, F.; Liao, J. Rice area extraction based on multi-temporal Sentinel-1A data. Jiangsu J. Agric. 2022, 38, 666–674. [Google Scholar] [CrossRef]
  44. Xu, Z.Y.; Liu, C.; Wang, J.B. Study on Remote Sensing Extraction of Gannan Citrus Orchards Supported by Google Earth Engine Platform. J. Geo-Inf. Sci. 2018, 20, 9. [Google Scholar] [CrossRef]
  45. Mushava, J.; Murray, M. Flexible loss functions for binary classification in gradient-boosted decision trees: An application to credit scoring. Expert Syst. Appl. 2024, 238, 121876. [Google Scholar] [CrossRef]
  46. Shammi, S.A.; Meng, Q. Use time-series NDVI and EVI to develop dynamic crop growth metrics for yield modeling. Ecol. Indic. 2021, 121, 107124. [Google Scholar] [CrossRef]
  47. Sah, S.; Haldar, D.; Chandra, S.; Nain, A.S. Discrimination and monitoring of rice cultural types using dense time series of Sentinel-1 SAR data. Ecol. Inform. 2023, 76, 102–136. [Google Scholar] [CrossRef]
  48. Wang, Z.X.; Liu, C.; Chen, W.B.; Lin, X. Preliminary Comparison of MODIS-NDVI and MODIS-EVI in Eastern Asia. Geomat. Inf. Sci. Wuhan Univ. 2006, 31, 407–410. [Google Scholar] [CrossRef]
  49. Teshome, F.T.; Bayabil, H.K.; Hoogenboom, G.; Schaffer, B.; Singh, A.; Ampatzidis, Y. Unmanned aerial vehicle (UAV) imaging and machine learning applications for plant phenotyping. Comput. Electron. Agric. 2023, 212, 108064. [Google Scholar] [CrossRef]
  50. Wang, L.M.; Liu, J.; Ji, F.H. Current status and development trend of remote sensing technology application in Chinese agriculture. China Agron. Bull. 2021, 37, 138–143. [Google Scholar] [CrossRef]
  51. Marino, S. Understanding the spatio-temporal behavior of crop yield, yield components, and weed pressure using time series Sentinel-2-data in an organic farming system. Eur. J. Agron. 2023, 145, 126785. [Google Scholar] [CrossRef]
  52. Deng, X.Y.; Liu, Q.; Deng, Y.; Sankaran, M. An improved method to construct basic probability assignments based on the confusion matrix for classification problems. Inf. Sci. 2016, 340–341, 250–261. [Google Scholar] [CrossRef]
  53. Woźniak, E.; Rybicki, M.; Kofman, W.; Aleksandrowicz, S.; Wojtkowski, C.; Lewiński, S.; Bojanowski, J.; Musiał, J.; Milewski, T.; Slesiński, P.; et al. Multi-temporal phenological indices derived from time series Sentinel-1 images to country-wide crop classification. Int. J. Appl. Earth Obs. Geoinf. 2022, 107, 102683. [Google Scholar] [CrossRef]
  54. Richard, R.; Waqar, S.Q.; Hamid, J.; Ayesha, Z.; Alina, M.; Eisa, A.; Umar, S.K.; Nasir, R. A new method for pixel classification for rice variety identification using spectral and time series data from Sentinel-2 satellite imagery. Comput. Electron. Agric. 2022, 193, 106731. [Google Scholar] [CrossRef]
  55. Testa, S.; Soudani, K.; Boschetti, L.; Borgogno, E. MODIS-derived EVI, NDVI, and WDRVI time series to estimate phenological metrics in French deciduous forests. Int. J. Appl. Earth Obs. Geoinf. 2018, 64, 132–144. [Google Scholar] [CrossRef]
  56. Chauhan, S.; Srivastava, H.S.; Patel, P. Wheat crop biophysical parameters retrieval using hybrid-polarized RISAT-1 SAR data. Remote Sens. Environ. 2018, 216, 28–43. [Google Scholar] [CrossRef]
  57. Azadnejad, S.; Maghsoudi, Y.; Perissin, D. Evaluation of polarimetric capabilities of dual polarized Sentinel-1 and TerraSAR-X data to improve the PSInSAR algorithm using amplitude dispersion index optimization. Int. J. Appl. Earth Obs. Geoinf. 2020, 84, 101950. [Google Scholar] [CrossRef]
  58. Ren, C.S.; Huang, W.J.; Ye, H.C.; Cui, B. Extraction of banana forest information and accuracy analysis using Gaofen-2 data. Remote Sens. Inf. 2017, 32, 78–84. [Google Scholar] [CrossRef]
  59. Shu, M.; Li, S.; Wei, J.; Che, Y.P.; Li, B.G.; Ma, T.Y. Extraction of citrus crown parameters using UAV platform. Trans. Chin. Soc. Agric. Eng. 2021, 37, 68–76. [Google Scholar] [CrossRef]
  60. Weiss, M.; Jacob, F.; Duveiller, G. Remote sensing for agricultural applications, A meta-review. Remote Sens. Environ. 2020, 236, 111402. [Google Scholar] [CrossRef]
  61. Zhao, X.; Nishina, K.; Akitsu, T.K.; Jiang, L.; Masutomi, Y.; Nasahara, K.N. Feature-based algorithm for large-scale rice phenology detection based on satellite images. Agric. For. Meteorol. 2023, 329, 109283. [Google Scholar] [CrossRef]
  62. Fathololoumi, S.; Firozjaei, M.K.; Li, H.; Biswas, A. Surface biophysical features fusion in remote sensing for improving land crop/cover classification accuracy. Sci. Total Environ. 2022, 838, 156520. [Google Scholar] [CrossRef] [PubMed]
  63. He, F.; Cai, J.Z.; He, Y. Sea surface wind speed inversion based on RADARSAT-2 quad-polarized SAR images. Mar. Forecast. 2021, 38, 42–54. [Google Scholar] [CrossRef]
Figure 1. Geographic location of the study area and distribution of sampling sites.
Agronomy 14 00150 g001
Figure 2. Separability of orchards, cropland, and other forest and vegetation: (a) separability of orchards, cropland, and other forest and vegetation in 3D feature space; (b) distance box plot of each vegetation type to the optimal threshold plane; (c) scatter plot of divisibility of orchards and other forest and vegetation species; (d) knowledge model diagram of optimal identification features of orchards and other forest and vegetation. Sentinel-1 (S-1) data were used to make divisions among orchards, cropland, and other forest and vegetation. C _ D represents the difference in backscattering coefficient between the 13 June data and the 25 June data; H v refers to the high valley value of the backward scattering coefficients of the 14 May, 26 May, and 7 June data for the six polarizations and their combinations; T b represents the difference between the backscattering coefficient of the data of 7 June and those of 14 January.
Agronomy 14 00150 g002
Figure 3. The flow chart of the method of extracting the spatial distribution of the litchi forest by remote sensing imagery.
Agronomy 14 00150 g003
Figure 4. Differentiability of features of litchi and cropland under different polarizations: (a) VH polarization feature separability, (b) VV polarization feature separability, (c) VH + VV polarization feature separability, (d) VV − VH polarization feature separability, (e) VH/VV polarization feature separability, (f) (VH − VV)/(VH + VV) polarization feature separability.
Agronomy 14 00150 g004
Figure 5. Separability of growth stage characteristics in litchi, longan, and citrus. (a) Separability of VH polarized growth stage characteristics, (b) separability of VV polarized growth stage characteristics, (c) separability of VH + VV polarized growth stage characteristics, (d) separability of VV − VH polarized growth stage characteristics, (e) separability of VH/VV polarized growth stage characteristics, (f) separability of (VH − VV)/(VH + VV) polarized growth stage characteristics.
Agronomy 14 00150 g005aAgronomy 14 00150 g005b
Figure 6. Decision tree modeling for classification and recognition of litchi, longan, and citrus.
Agronomy 14 00150 g006
Figure 7. Mapping results of spatial information extraction for citrus, longan, and litchi fruit trees, as well as magnified views of the three classifications and corresponding Google Earth views.
Agronomy 14 00150 g007
Table 1. The growth periods of litchi, citrus, and longan in the study area.
Agronomy 14 00150 i001
Agronomy 14 00150 i002 
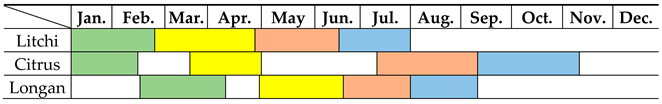
Branch growth period; Agronomy 14 00150 i003 Bud differentiation and anthesis; Agronomy 14 00150 i004 Fruit growth and ripening; Agronomy 14 00150 i005 Harvest period.
Table 2. Sentinel-1 and Sentinel-2 data parameters.
SatelliteResolutionWork PatternFlight DirectionPolarization Scheme
Sentinel-1A
(GRD)
10 mInterferometric Wide Swath (IW)AscendingVV, VH
Sentinel-2A
(Level-lC)
10 m/AscendingB2, B3, B4, B8
Table 3. A summary of the remote sensing data.
SatelliteAcquisition DateNumber of ScenesGrowth Stage
S-1A11 January 2018 (0111)
14 January 2022 (0114), 19 February 2022 (0219)
6The branch growth period of litchi and citrus
S-1A15 March 2022 (0315), 8 April 2022 (0408)4The bud differentiation and anthesis of litchi and citrus. The branch growth period of longan
S-1A11 May 2018 (0511), 23 May 2018 (0523), 4 June 2018 (0604)
2 May 2022 (0502), 14 May 2022 (0514)
26 May 2022 (0526), 7 June 2022 (0607)
14The fruit growth and ripening of litchi. The bud differentiation and anthesis of longan
S-1A10 June 2018 (0610), 22 June 2018 (0622)
7 June 2022 (0607), 19 June 2022 (0619)
13 July 2022 (0713), 25 July 2022 (0725)
12The harvest period of litchi. The fruit growth and ripening of citrus and longan
S-1A6 August 2018 (0806), 15 August 2018 (0815)
6 August 2022 (0806), 30 August 2022 (0830)
8The fruit growth and ripening of citrus. The harvest period of longan
S-1A20 September 2018 (0920), 14 October 2018 (1014)
11 September 2022 (0911), 23 September 2022 (0923), 17 October 2022 (1017)
10The harvest period of longan
S-1A19 November 2018 (1119), 13 December 2018 (1213)
22 November 2022 (1122), 16 December 2022 (1216)
8/
S-2A30 September 2018, 9 September 2022, 29 October 20226/
Table 4. Results of precision evaluation of classification results.
CategoryLitchiOther Forest and VegetationCroplandTotalUser’s Accuracy
Litchi26511428094.64%
Other forest and vegetation141931922685.40%
Cropland21716918889.89%
Total281221192694-
Producer’s accuracy94.31%87.33%88.02%--
Overall accuracy = 90.34%Kappa = 0.84
Disclaimer/Publisher’s Note: The statements, opinions and data contained in all publications are solely those of the individual author(s) and contributor(s) and not of MDPI and/or the editor(s). MDPI and/or the editor(s) disclaim responsibility for any injury to people or property resulting from any ideas, methods, instructions or products referred to in the content.

