Abstract
The knowledge of interactions among crop genotypes, soil types, and crop management is essential for precision agriculture. This paper explores these interactions through the analysis of 27 years of winter wheat trials, with 276 unique varieties tested across seven distinct soil types and more than 8000 plots. The study investigates how different winter wheat crop varieties respond to varying soil types and preceding crops. The findings revealed a significant interaction between variety, soil type, and preceding crop. With only a few exceptions, the highest-yielding varieties were predominantly the most recently developed. The ranking of the varieties exhibited inconsistency across the various soil types, implying that a variety yields differently when cultivated in different soil types. Furthermore, the influence of preceding crops on yield varied with soil type. This suggests that taking field-specific soil variation and the preceding crop into account during variety selection may improve the yield potential. Furthermore, the study highlights consistent yield increases due to advancements in breeding programs, with yearly increases ranging from 0.05 to 0.1 t/ha per year across all soil types. Integration of insights from genetics, soil attributes, and management practices demonstrates how farmers can increase productivity.
1. Introduction
To achieve optimal crop growth and yield, it is essential to consider the influence of within-field soil variation and the response of genotypes and crop management to such variation. A deep investigation of genotype-soil-management relationships is imperative for precision farmers to select crop varieties that can perform under diverse environmental conditions and to implement precision management of each field. Understanding variety-specific characteristics can help farmers identify the best crop varieties for specific soil variations and expected weather conditions. This information can also help optimize precision crop management practices to ensure that crops reach their full potential. By selecting crop varieties that are better suited to specific soil types, soil profiles, and environmental conditions, farmers can promote sustainable and efficient crop production. However, despite its importance, there is still a lack of understanding of these complex interactions.
Different crop varieties exhibit a wide range of characteristics that influence their ability to grow and produce high yields in different environmental conditions. Variations in root structures or growth patterns can affect a variety’s ability to take up nutrients and water from different soil types and profiles [1,2,3,4]. Additionally, differences in resistance to pests and diseases, as well as drought tolerance, can greatly affect the productivity of crops grown on different soil types and profiles [5,6,7].
Furthermore, different crop varieties can exhibit distinct responses to varying weather conditions [8,9]. Certain varieties may be better adapted to hot and dry environments, whereas others may be more adapted to cooler and wetter conditions. This can be attributed to specific genetic traits, such as water conservation mechanisms, efficient photosynthesis, or protective cellular mechanisms that prevent cellular damage.
Breeders leverage specific traits to develop crop varieties that exhibit high yield potential and broad adaptation, performing well across diverse environmental and management conditions [10,11]. This is achieved by conducting field trials under different conditions, using appropriate statistical methods to analyze the data, and selecting the most promising genotypes for further breeding [12,13]. By selecting varieties that exhibit desired traits, such as tolerance to different weather conditions, soil types, drought tolerance, pest and disease resistance, and efficient nutrient uptake, breeders can develop crop varieties with improved adaptability to diverse environmental conditions. Another strategy involves a narrower breeding approach, wherein the selection is focused on varieties that perform optimally under specific weather conditions and different soil types. This narrow adaptation can help farmers produce consistent yields and optimize resource use in fields with varying soil conditions.
The Yield = G + E + GxE equation is widely used in plant breeding and genetics to analyze the contribution of genetic and environmental factors, and their interactions [13,14]. Here, yield is the measured amount of crop produced per unit area.
The G component of the model represents the genetic contribution to yield, which can be estimated by comparing the yield between different genotypes grown under the same environmental conditions. Plant breeding efforts aim to optimize the genetic component of the model by selecting genotypes with superior yield potential and other desired traits.
The E component of the model represents the environmental contribution to yield, attributed to non-genetic factors such as soil, climate, and common management practices. This component is estimated by comparing the yield of the same genotype grown under different environmental and management conditions.
Finally, the GxE interaction term accounts for the combined effect of genetic and environmental factors on yield not accounted for by the main effects of genotype and environment alone. The GxE interaction implies that different genotypes may have different responses to changes in environmental conditions. For example, some genotypes may be more adapted to a specific soil type or more tolerant to drought, while others may be better adapted to colder climates or have higher yield potential under high rainfall [4,5,9].
The GxE interaction is important in plant breeding programs because it affects the selection of genotypes. The GxE interaction can be positive, negative, or neutral, depending on specific environmental conditions and the genetic traits of the plant. A positive GxE interaction occurs when the performance of a genotype is better than expected under specific environmental conditions, while a negative GxE interaction occurs when the performance of a genotype is worse than expected. A neutral GxE interaction occurs when there is an additive effect of G and E.
The equation Yield = G + E + M + GxE + GxM + ExM + GxExM is a more comprehensive version of the previous model, adding management (M) and its interactions with genotype and environment. M refers to the practices and interventions applied to the crop to optimize its yield or performance, such as preceding crop, irrigation, fertilizer application, and pest management. Including genotype-management (GxM), environment-management (ExM), and genotype-environment-management (GxExM) interactions allow for a more nuanced understanding of the factors that contribute to crop yield. The GxM factor recognizes that different crop varieties may respond differently to management interventions, while the ExM factor recognizes that the effectiveness of management interventions can depend on the environmental conditions in which they are applied. The GxExM interaction incorporates the varying effectiveness of management interventions among crop varieties, depending on the environmental conditions in which they are grown.
By incorporating the more comprehensive equation into precision agriculture, farmers and researchers can generate more accurate predictions on how different management interventions will impact crop yield under different environmental and genetic conditions. These predictions can then be used to guide decision-making on a field-specific or sub-field basis, allowing farmers to optimize their management strategies to achieve the highest possible yield for each field.
The objective of this paper is to elucidate the yield performance demonstrated through a series of field trials involving winter wheat varieties spanning the years 1995 to 2021. These trials were conducted on different soil types, encompassing seven distinct categories, and various preceding crops. The overarching goal is to unravel the intricate interaction among genotypes, soil types, and one of the primary management practices: crop rotations involving different preceding crops. These insights provide significant potential for precision agriculture, with the requisite knowledge to optimize varietal selection and management strategies. This investigation carries with it the potential to contribute significantly to the advancement of sustainable and financially viable precision agriculture.
2. Materials and Methods
2.1. Field Trials and Selected Varieties
Data from a series of crop variety testing programs organized by the Danish Ministry of Food, Agriculture and Fisheries in collaboration with SEGES, the Danish Technical Institute, and Tystofte Foundation were used. The purpose of crop variety testing is to evaluate and classify new plant varieties based on their quality, yield, disease resistance, pest resistance, and other factors that affect their value for cultivation and use, providing farmers with valuable information for their crop production. Varieties that prove to be suitable and meet established standards are approved on the Danish or the EU public variety lists.
Crop variety testing in Denmark involves a series of field trials conducted across the country every year. These trials are designed to represent a range of soil and weather conditions. The varieties are tested over several years to ensure reliable results, with the objective of assessing the performance, quality, and cultivation characteristics of different varieties under the varying conditions commonly found in Denmark and the surrounding region with similar growing conditions.
The field trials are documented in a shared database, the Nordic Field Trial System (nfts.dlbr.dk). The outcomes of the trials are also published on the public website Sortinfo.dk and included in the SEGES annual overview of national trials (Landsforsøgene®), ensuring transparency and accessibility of the results to all interested parties.
Data used in this paper were collected between 1995 and 2021, encompassing a total of 1159 winter wheat varieties that were tested at multiple locations across Denmark, representing the seven soil types: 1: Coarse sandy soil; 2: Fine sandy soil; 3: Coarse loamy sand soil; 4: Fine loamy sand soil; 5: Coarse sandy loam soil; 6: Fine sandy loam soil; and 7: Clay soil, based on the Danish soil texture classification (Table S1).
The variety tests were conducted at 12 locations each year. Figure S1 illustrates the spatial distribution of the locations. Most of the locations remained the same over the entire 27-year period, but a few locations were replaced during the 27 years. Nevertheless, the goal of the trials has consistently been to capture the diversity of soil types across Denmark. Within each location, the tests were part of a crop rotation scheme, where crops rotated among fields.
Weather conditions exert a significant influence on crop growth and yield. Figure S2 presents the Danish climate normals for precipitation and temperature throughout the year during the period 1990–2020. The Danish temperate climate iss characterized by four distinct seasons: winter, spring, summer, and autumn. Average temperatures exhibited seasonal variations, with the warmest months typically being July and August, with average temperatures ranging from 15 to 20 °C. Conversely, the winter months, particularly January and February, were cooler, with average temperatures hovering around 0–5 °C.
Generally, precipitation was moderately distributed throughout the year, with a slight tendency for increased rainfall during the autumn and winter seasons, while the summer months tended to be somewhat drier. The average annual precipitation varied by region, with the western coast and islands often experiencing higher levels of rainfall compared to eastern areas. Figure S3 illustrates the annual precipitation and temperature during the test period from 1995 to 2021. The lowest annual precipitation recorded was 505 mm in 1996, while the highest was 905 mm in 2019. The minimum and maximum temperatures fluctuated by about 3 °C between the years.
The experimental design was an alpha design. The crops were sown in September and harvested in August. The seed rate for all varieties was calculated to be 350 viable seeds per square meter. In all trials, weed control was carried out using herbicides in autumn and spring when grass weed species were present. Disease control was carried out using fungicides according to the Danish decision support from SEGES. Pest control was carried out when needed using insecticides, and growth regulation was carried out to avoid lodging. Nitrogen was fertilized according to the Danish Agricultural Agency’s norms for the location, corrected for expected yield level, previous crop, and nitrogen forecasts, and years of animal manure addition. The first nitrogen application was carried out as soon as possible after March 1st. Phosphorus and potassium were applied as needed. Irrigation was not employed in the trials.
In all trials, a range of metadata was recorded to ensure high data quality, including germination, plant density, overwintering, disease and pest attacks, soil type, and preceding crops. Only the data regarding soil type and preceding crops were used in the present analyses, as they influence crop growth, health, and yield [15]. The trials were harvested using a plot harvester, and measurements were taken for grain yield and various grain quality parameters. Only yield data were used in this work. Grain yield was adjusted to a water content of 15%.
The complete data set consisted of 27,170 yield plots spanning 27 years (1995–2021) and encompassing 1159 varieties (Table 1). The purpose of this work was solely to analyze the yield of different winter wheat varieties on various soil types and different preceding crops. Therefore, only the 13,041 plots treated with fungicides were included in the analyses (Table 1). To ensure the robustness of the analyses, the data set was further refined to include only varieties tested in a minimum of three years, across at least three distinct soil types, and at least two different soil types within each test year (robust data set 1, Table 1). Individual trials were included, only if the crop was treated with fungicides and included at least two varieties fulfilling the above-mentioned criteria. The resulting data set comprised 8688 plots with information on soil type, representing 276 unique winter wheat varieties, and 8484 plots with information on both soil type and preceding crop (robust data set 2, Table 1).

Table 1.
Number of plots (and varieties) on the different soil types and preceding crops in the different data sets used for analyses.
Table 2 presents the distribution of winter wheat varieties on the preceding crop and the soil types in the robust data set. Potatoes were only used as a preceding crop on coarse sandy soil, while legumes, oats, and oilseed rape were commonly used as preceding crops in most soil types.
Table 2.
Number of winter wheat varieties tested in each soil type with each proceeding crop.
2.2. Statistical Analysis
To assess the effects of and interactions between variety and soil type on yield, a linear mixed model [16], based on the simple yield model was fitted to the data; with soil type, variety, and their interaction as fixed effects, and year, trial within a year, and variety by soil type within a year as random effects:
where yieldijklm was the yield in soil type i, of variety j, in year k, and plot m in trial l. Random effects were assumed to be normally distributed; , and independent of the residual Associations between the estimated variety-specific yield on different soil types were evaluated based on Spearman correlations on pairwise complete observations.
Similarly, a second linear mixed model was fitted to estimate the effect of the preceding crop. In this model, preceding crop, variety, and their interaction were included as fixed effects, and year, trial within a year, and variety by preceding crop within the year were included as random effects:
where yieldijklm was the yield with preceding crop i, of variety j, in year k, and plot m in trial l. Random effects were assumed to follow a normal distribution; , and were independent of the residual
The overall trend in yield development was estimated using a linear regression model on the yield estimates as a function of the first year of appearance of each variety in the test trials. Additionally, two ANCOVA models were fitted to the yield estimates as a function of either soil type or preceding crop, the first year of appearance, and their interaction:
where was the estimated mean yield for variety j in soil type i, and
where was the estimated mean yield for variety j in preceding crop i. These models were used to estimate soil type-specific and preceding crop-specific yield development trends. Pairwise comparisons of yield trends were based on post-hoc pairwise comparisons of the soil-specific slope estimates, . This model was fitted to the comprehensive robust data set comprising information on both soil type and preceding crop.
The soil type and variety-specific yield estimates were further used to predict the top-performing winter wheat varieties within each soil type. A weighted variety-specific yield estimate across a pre-specified distribution of soil types was estimated and reported with 95% confidence intervals using the delta method.
A third linear mixed model, based on the more comprehensive yield equation, was used to assess the influence of the preceding crop, the soil type, and variety-specific yield. This model encompassed soil type, variety, preceding crop, and their interactions as fixed effects, along with year, trial within a year, and variety by soil type by preceding crop within a year as random effects.
where yieldijklmn was the yield in soil type i, of variety j, in year k, and plot m in trial l with preceding crop n. Random effects were assumed to follow a normal distribution; , and were independent of the residual The preceding crop was not included as a factor in the experimental design but rather as a component capturing part of the management variation in the experiment. The model was fitted to the comprehensive robust data set comprising information on both soil type and preceding crop. However, results were only shown for a subset of two soil types, three preceding crops, and three varieties, aiming to provide a simplified illustration of the interactions.
For all fitted models, model assumptions were validated using visual assessment of residual and qq-plots of residuals and random effects.
All models were fitted in the statistical software R version 4.2.0 [17]. Specifically, the extension package ‘lme4′ was used for fitting the linear mixed models, and ‘multcomp’ for post-hoc pairwise comparisons [18,19].
3. Results
3.1. Variety Performance across Soil Types
All three models reported significant effects of soil type, preceding crop, variety, and their interactions (all p < 0.0001, Table S2). The estimated mean yields varied up to 4.0 t/ha between soil types across years. As expected, the lowest and highest yields were estimated on soil types 1 and 7, respectively.
Figure 1 shows the association between the estimated yield in soil type 6 and the estimated yield in each of the six remaining soil types for the 276 varieties in the robust data set. The ranking was not consistent across the soil types, indicating a GxE interaction (Figure 1 and Figure S4). This was supported by model 1, which showed a significant interaction between soil type and variety (p < 0.0001, Table S2). Correlations between estimated variety-specific yields in different soil types ranged from −0.01 (soil type 1 vs. soil type 2) to 0.90 (soil type 6 vs. soil type 7), with the remaining correlations falling between 0.33 and 0.83 (Figure S5). This effect of soil type implies that the same variety can produce different yields when cultivated in different soil types. With a few exceptions, the highest-yielding varieties were primarily the newest ones.
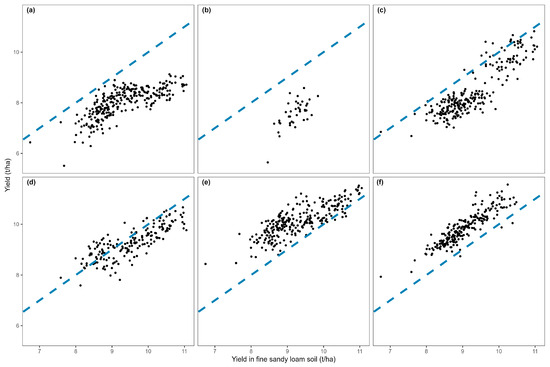
Figure 1.
Estimated yield of the 276 winter wheat varieties in fine sandy loam soil (soil type 6) (x-axis) against the estimated yield in (a) 1: coarse sandy soil, (b) 2: fine sandy soil, (c) 3: coarse loamy sand soil, (d) 4: fine loamy sand soil, (e) 5: coarse sandy loam soil, and (f) 7: clay soil. Estimated yields were based on a linear mixed model. The blue dashed line represents the one-to-one relationship between yield in the two soil types, such that points above the line represent varieties performing better in the given soil type compared to fine sandy soil, and the other way around for points below the line.
The top five rankings, along with the associated yield estimates in Table 3, offer an overview of the relative crop productivity potential across two soil types. For soil type 4, the variety RGT Bairstow attained the highest ranking with an estimated yield of 10.67 t/ha/year, 0.22 t/ha (p > 0.1) higher than the fifth-ranking variety, Pondus.
Table 3.
Predicted yield with 95% confidence intervals for the five top ranking winter wheat varieties with the highest estimated yield performance (t/ha/year). The last column represents estimated yields for the five top ranking varieties in a field where soil type 4 (fine loamy sand soil) constitutes 40% of the area, and soil type 6 (fine sandy loam soil) constitutes 60% of the area.
For soil type 6, RGT Bairstow maintained its position among the top five varieties, with a fifth rank and a yield estimate of 10.95 t/ha/year, only 0.1 t/ha (p > 0.1) less than the first ranking variety, RGT Thorpe (11.05 t/ha). Furthermore, Pondus emerged as the fourth-ranking variety, yielding 10.97 t/ha/year.
In Table 3, the top 5 ranking of varieties are also presented for a thought example of a field, where 40% of the area was classified as soil type 4, and the remaining 60% was categorized as soil type 6. RGT Bairstow and Pondus continued to exhibit strong performance, with the first and second ranks with yield estimates of 10.84 t/ha/year and 10.76 t/ha/year, respectively. Notably, two varieties that were not present among the top five candidates in the single soil type scenarios claimed the third and fourth ranks with yield estimates of 10.68 t/ha/year (Heerup) and 10.67 t/ha/year (Rembrandt).
3.2. Yield Development Trends
For all soil types, there was a significant increase in yield over the years for the first-year appearance of varieties in the test trials (all p < 0.0001), due to ongoing selection by the breeders for new varieties that yield higher than the older ones (Figure 2, Table 4). Across all soil types, model 1 predicted a yield increase of 0.068 t/ha per year. The development in yield was almost twice as high on soil types 2 and 3, with a mean increase of 0.10 and 0.11 t/ha per year, compared to soil types 1, 4, and 5 (0.051, 0.053, and 0.051 t/ha per year, respectively).
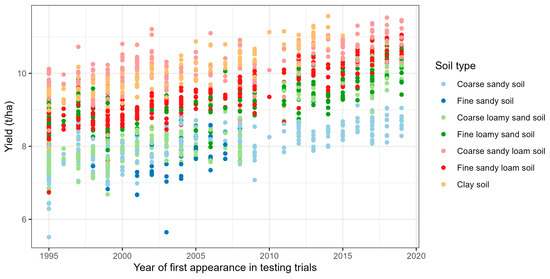
Figure 2.
Estimated mean yield for each of the 276 varieties included in the robust data set by soil types and year of first appearance in the testing trials. Estimates were based on a linear mixed model (model 1).
Table 4.
Estimated development in yield over time (±standard error) for each soil type, estimated using linear regression and ANCOVA models. Soil types not sharing a letter were significantly different. p-values represent the test for slope = 0.
For all preceding crops except for spring oil seed rape, there was a significant increase in yield over the years for the first-year appearance of varieties in the test trials (Table 5, Figure S6).
Table 5.
Estimated development in yield over time (±standard error) for each preceding crop, estimated using linear regression and ANCOVA models. Preceding crops not sharing a letter were significantly different. p-values represent the test for slope = 0.
3.3. Effect of Preceding Crops on Yield
Table 6 illustrates the three-way interaction between two soil types, the three most common preceding crops (legume, oat, and winter oilseed rape), and three high-yielding winter wheat varieties. On soil type 6, the yields were significantly higher for all three varieties when oil seed rape was the preceding crop compared to legumes as the preceding crop. In addition, the choice of variety only affected the yield significantly when following legumes, whereas no differences between varieties were found with winter oilseed rape as the pre-crop. On the contrary, no differences in yield were found on soil type 4 between any preceding crops for any of the three varieties.
Table 6.
Estimated variety-specific yield (t/ha) with 95% confidence intervals by selected soil types, preceding crops, and three winter wheat varieties using a linear mixed model. The combinations not sharing a letter were significantly different.
For soil type 4 with legume as the preceding crop, the estimated variety-specific yields ranged from 10.12 to 10.52 t/ha across the three varieties. With oat as the preceding crop, the estimated yields were in the range of about 9.8 to 10.46 t/ha. For winter oilseed rape as the preceding crop, the estimated yields varied between approximately 9.38 and 10.05 t/ha.
For soil type 6 with legume as the preceding crop, the estimated yields spanned approximately 0.95 t/ha across the three varieties, whereas only a 0.2 t/ha difference between varieties (not significant) was observed for oat as the preceding crop. Under the winter oilseed rape preceding crop, the estimated yields varied less than 0.05 t/ha.
4. Discussion
In recent years, there has been increasing interest among Danish farmers in understanding how winter wheat varieties respond differently to soil types and preceding crops. The difference among the top five varieties included in Table 3 ranged from 1% to 2%. However, in practice, even 1–2% variations can have an impact on productivity and net yield on larger farms in Denmark, where field sizes typically span over 100 hectares. The challenge so far has been the lack of a robust statistical model capable of ranking the varieties based on their performance in various soil types and preceding crops. In this paper, statistical advancements for the analysis of unbalanced data sets were used [16]. The linear mixed model and its corresponding results demonstrate robustness, primarily stemming from their reliance on the extensive data set from 1995 to 2021. This robustness is supported by the inherent prerequisite for the approval of new varieties, where their performance in terms of yield or quality traits must surpass that of the varieties already approved and present in the public varietal lists. The request for improved crop performance encompasses yield or quality parameters. However, within the domain of feed crops, improved performance is notably intertwined with yield improvements.
The strength of the results from the robust data set lies in the extensive testing of a large number of varieties over multiple years and at 12 different locations, all accomplished at a relatively low cost. Consequently, the testing protocols do not encompass local climate measurements or specific soil analyses, such as pH, nutrient levels, field capacity, or plant-available water content, as these parameters are not included in the standard variety testing procedures. The agricultural practices applied at the 12 locations adhere to conventional cultivation methods, with crops following a rotation system optimized following local practices. The influence of diverse management practices and local weather conditions is reflected in the “trial × year” variance component of the models applied. Variations in general climatic conditions between years are accounted for in the “year” variance component. However, there is potential for expanding Models 1–3 with additional variables. In recent years, there have been advancements in the development of cost-effective and reliable weather stations, as well as affordable and efficient soil analysis methods. These innovations have the potential to collect data locally that could improve the analyses and expand the knowledge base for genotype-environment-management interactions.
Breeding for higher yields, along with the utilization of chemical fertilizers and pesticides, constitutes the Green Revolution that commenced after World War II and has contributed to ensuring global food security [20]. Notably, advancements in breeding and enhanced crop cultivation have consistently demonstrated an upward trajectory in yields [21]. A comprehensive study by Mackay et al. [22] delved into the genetic advancements in winter wheat in the UK, encompassing 3590 combinations of site and year. Their findings disclosed a linear trajectory of yield increase, reaching 69 kg/ha per year between 1948 and 2007. The results in this paper, obtained from the Danish trials spanning from 1995 to 2021, closely align with those of the UK, demonstrating an increase of 68 kg/ha per year. However, a continuous discussion persists among researchers and breeders regarding the adaptability of breeding through selection in response to climate change, particularly the shifting patterns of temperature and precipitation [23]. Consequently, there is an urgent need to acquire a more profound understanding of the intricate interactions between genetic, environmental, and management factors (GxExM).
The results from the Danish trials reveal an interaction between variety and soil type, suggesting that the highest yield may be obtained from different varieties in different soil types. It is widely recognized that substantial spatial differences in soil type and its physical and chemical attributes can be present within agricultural fields [24]. As a result, the yield at any specific location within a field is influenced by a combination of factors, including genetics, plant density, management techniques, climatic conditions, and the cumulative effect of stresses encountered by the plant population throughout the growing season [25]. Moreover, the yield is intricately linked to root traits and the intricate spatial and temporal variations in soil water availability, as well as the chemical and physical properties of the soil. This includes factors such as organic matter content, pH levels, and other pertinent aspects. Currently, there have been limited breeding approaches that incorporate the selection of crop varieties exhibiting optimal performance aligned with these spatial and dynamic soil characteristics. One possible approach could involve the utilization of genomic data for the identification of genetic markers linked to targeted root traits. Subsequently, the development of linkage maps could be undertaken to establish associations between these genetic markers and quantitative trait loci (QTL) responsible for controlling the desired root traits.
As the volume of data continues to expand and new data science technologies emerge, the opportunity arises to potentially incorporate soil variability into breeders’ selection and the farmer’s choice of optimal varieties for different fields. This could also involve either a blend of varieties tailored to excel under diverse soil conditions, or a combination best suited for specific soil conditions. Such an approach demands an understanding of the spatial distribution of soil types within a given field, along with the capability to select an appropriate single variety or mixture that aligns with this distribution.
Given that most fields are not comprised of a single soil type but often have a mix of soil types, the question arises as to whether it is possible to achieve higher yields by selecting varieties that perform well across multiple soil types. The results presented in Table 3 provide an example where the top 5 varieties that excel in a field with mixed soil types consist of two varieties present on both of the individual soil type lists, one variety listed only on one of these, and two varieties absent in either of the single soil top 5 lists. This suggests that taking the field-specific soil variation into account during variety selection may improve yield potential.
An alternative and novel approach to variety blends would be to sow varieties that align with the soil type patterns within the field. This can be achieved through either multiple sowing passes or by utilizing advanced seeders that can handle and distribute multiple varieties simultaneously.
In the variety testing program, the Danish soil classification system has been utilized. Regulatory authorities use this system for monitoring and managing land use. However, the current resolution of 1:200,000, equivalent to a resolution of 200 hectares, proves inadequate for accurately mapping variations within fields that are significantly smaller than 200 hectares. Therefore, there is a need to enhance the resolution to fully exploit the potential of selecting the best-performing varieties, or a blend of varieties. The utilization of satellite imagery or drones holds promise for mapping within-field soil-type variations.
Rotational cropping is widespread in Danish cultivation systems. This is supported by the results from the 1995 to 2021 data set where there is a clear variation in different varietal responses to preceding crops. Changes in the crop sequence are well-documented for the potential to enhance the yield. The yield effects comprise a complexity of several factors; for instance, different crops impact the prevalence of plant diseases, along with other biological implications, such as residual arbuscular mycorrhizal fungi, in addition to exerting influences on nutrients, water, soil structure, and allelopathic effects [26]. The spatial and temporal variance of these effects inherently contributes to the spatial diversity in yield outcomes. A more profound understanding of the interactions between genotypes and crop rotation effects could be harnessed by breeders and farmers to breed or select varieties that perform optimally within different crop rotation systems.
5. Conclusions
The results from the Danish variety trials and similar experiments in other countries hold promise for the future of precision agriculture, where the incorporation of genotype-soil-management interactions can assist farmers in choosing the best-suited crop varieties and management strategies tailored to each specific field. This incorporation not only enhances the potential for higher yields but also fosters resource-efficient farming techniques and environmental sustainability. The yearly inclusion of new varieties on the market makes it difficult to give once-and-for-all recommendations on the choice of specific varieties. However, with the fitted model, or a model updated yearly with the most recent testing trial data, the yield can be predicted for all varieties on different soil types and in various combinations of preceding crops that have been part of the crop variety testing program, for a more transparent and well-informed basis for decision-making for precision farmers.
Supplementary Materials
The following supporting information can be downloaded at: https://www.mdpi.com/article/10.3390/agronomy13112727/s1, Figure S1: Locations of testing trials in Denmark. Figure S2: Climate normal in Denmark 1991–2021. The National Danish Meteorological Institute (Klimanormaler Danmark (dmi.dk). Figure S3: Weather data for Denmark 1997–2021. Figure S4: Estimated variety-specific yield of the 276 winter wheat varieties by soil type based on a linear mixed model. Figure S5: Spearman correlations between estimated variety-specific yields in different soil types. Figure S6: Estimated mean yield for each of the 276 varieties included in the robust data set by preceding crop and year of first appearance in the testing trials. Table S1. The Danish Soil Classification System. Table S2: Model output from the three linear mixed models; p-values for the fixed effects and variance components for the random effects.
Author Contributions
S.C., generated and formulated the overarching research objectives. He also wrote and edited most of the paper. S.M.J., contributed to the generation of the research objectives, and the methodology sections, and applied statistical methods to analyze the data. All authors have read and agreed to the published version of the manuscript.
Funding
This research received no external funding.
Data Availability Statement
Relevant data can be requested after an agreement with SEGES.
Acknowledgments
Leif Hagelskjær and Søren Kolind Hvid SEGES are acknowledged for providing and curating the data set. Preben Klarskov Hansen is acknowledged for the field experiment protocol, and Rasmus Hjortshøj, for his contribution to the scientific objectives and discussions.
Conflicts of Interest
The authors declare no conflict of interest.
References
- Manschadi, A.M.; Hammer, G.L.; Christopher, J.T.; deVoil, P. Genotypic variation in seedling root architectural traits and implications for drought adaptation in wheat (Triticum aestivum L.). Plant Soil 2008, 303, 115–129. [Google Scholar] [CrossRef]
- Ristova, D.; Busch, W. Natural Variation of Root Traits: From Development to Nutrient Uptake. Plant Physiol. 2014, 166, 518–527. [Google Scholar] [CrossRef] [PubMed]
- Guo, X.; Svane, S.F.; Füchtbauer, W.S.; Andersen, J.R.; Jensen, J.; Thorup-Kristensen, K. Genomic prediction of yield and root development in wheat under changing water availability. Plant Methods 2020, 16, 90. [Google Scholar] [CrossRef] [PubMed]
- Cooper, M.; Messina, C.D. Breeding crops for drought-affected environments and improved climate resilience. Plant Cell 2023, 35, 162–186. [Google Scholar] [CrossRef]
- Ratnadass, A.; Fernandes, P.; Avelino, J.; Habib, R. Plant species diversity for sustainable management of crop pests and diseases in agroecosystems: A review. Agron. Sustain. Dev. 2012, 32, 273–303. [Google Scholar] [CrossRef]
- Passioura, J.B. Phenotyping for drought tolerance in grain crops: When is it useful to breeders? Funct. Plant Biol. 2012, 39, 851–859. [Google Scholar] [CrossRef] [PubMed]
- Döringa, T.F.; Rosslenbroichc, D.; Giesea, C.; Athmanna, M.; Watsond, C.; Vágóf, I.; Kátaif, J.; Tállaif, M.; Brunsc, C. Disease suppressive soils vary in resilience to stress. Appl. Soil Ecol. 2020, 149, 103482. [Google Scholar] [CrossRef]
- Burbano-Erazo, E.; León-Pacheco, R.I.; Cordero-Cordero, C.C.; López-Hernández, F.; Cortés, A.J.; Tofiño-Rivera, A.P. Multi-Environment Yield Components in Advanced Common Bean (Phaseolus vulgaris L.) × Tepary Bean (P. acutifolius A. Gray) Interspecific Lines for Heat and Drought Tolerance. Agronomy 2021, 11, 1978. [Google Scholar] [CrossRef]
- Reynolds, M.P.; Hays, D.; Chapman, S. Breeding for Adaptation to Heat and Drought Stress; CABI Climate Change Series 2010; CABI International: Wallingford, UK, 2010. [Google Scholar] [CrossRef]
- Borlaug, N.E. Contributions of conventional plant breeding to food production. Science 1983, 219, 689–693. [Google Scholar] [CrossRef]
- Fu, Y.-B. Understanding crop genetic diversity under modern plant breeding. Theor. Appl. Genet. 2015, 128, 2131–2142. [Google Scholar] [CrossRef]
- Hammer, G.; Cooper, M.; Tardieu, F.; Welch, S.; Walsh, B.; van Eeuwijk, F.; Chapman, S.; Podlich, D. Models for navigating biological complexity in breeding improved crop plants. Trends Plant Sci. 2006, 11, 587–593. [Google Scholar] [CrossRef] [PubMed]
- van Eeuwijka, F.A.; Bustos-Kortsa, D.; Milleta, E.J.; Boera, M.P.; Kruijera, W.; Thompson, A.; Malosettia, M.; Iwatac, H.; Quirozd, R.; Kuppee, C.; et al. Modelling strategies for assessing and increasing the effectiveness of new phenotyping techniques in plant breeding. Plant Sci. 2019, 282, 23–39. [Google Scholar] [CrossRef] [PubMed]
- Messina, C.; Hammer, G.; Dong, Z.; Podlich, D.; Cooper, M. Modelling Crop Improvement in a GxExM Framework via Gene–Trait–Phenotype Relationships. In Crop Physiolog: Applications for Genetic Improvement and Agronomy; Academic Press: Cambridge, MA, USA, 2009; pp. 214–234. [Google Scholar]
- Anderson, R.L. Growth and Yield of Winter Wheat as Affected by Preceding Crop and Crop Management. Agron. J. 2008, 100, 977–980. [Google Scholar] [CrossRef]
- Smith, A.B.; Cullis, B.R.; Thomson, R. The analysis of crop cultivar breeding and evaluation trials: An overview of current mixed model approaches. J. Agric. Sci. 2005, 143, 449–462. [Google Scholar] [CrossRef]
- R Core Team. R: A Language and Environment for Statistical Computing. Vienna, Austria. 2022. Available online: https://www.r-project.org/ (accessed on 1 December 2022).
- Bates, D.; Mächler, M.; Bolker, B.; Walker, S. Fitting Linear Mixed-Effects Models Using lme4. J. Stat. Softw. 2014, 67, 1–48. [Google Scholar] [CrossRef]
- Hothorn, T.; Bretz, F.; Westfall, P. Simultaneous Inference in General Parametric Models. Biom. J. 2008, 50, 346–363. [Google Scholar] [CrossRef]
- Khush, G.S. Green revolution: The way forward. Nat. Rev. Genet. 2001, 2, 815–822. [Google Scholar] [CrossRef]
- Fischer, R.A.; Edmeades, G.O. Breeding and cereal yield progress. Crop Sci. 2010, 50, 86–98. [Google Scholar] [CrossRef]
- Mackay, I.; Horwell, A.; Garner, J.; White, J.; McKee, J.; Philpott, H. Reanalyses of the historic series of UK variety trials to quantify the contributions of genetic and environmental factors to trends and variability in yield over time. Theor. Appl. Genet. 2011, 22, 225–238. [Google Scholar] [CrossRef]
- Hall, A.J.; Richards, R.A. Prognosis for genetic improvement of yield potential and water-limited yield of major grain crops. Field Crops Res. 2013, 143, 18–33. [Google Scholar] [CrossRef]
- Mulla, D.J.; McBrantney, A.B. Soil Spatial Variability. In Soil Physics Companion; Warrick, A.W., Ed.; CRC Press: Boca Raton, FL, USA, 2001; 400p. [Google Scholar]
- Batchelor, W.D.; Basso, B.; Paz, J.O. Examples of strategies to analyze spatial and temporal yield variability using crop models. Eur. J. Agron. 2002, 18, 141–158. [Google Scholar] [CrossRef]
- Kirkegaard, J.; Christen, O.; Krupinsky, J.; Layzell, D. Break crop benefits in temperate wheat production. Field Crops Res. 2008, 107, 185–195. [Google Scholar] [CrossRef]
Disclaimer/Publisher’s Note: The statements, opinions and data contained in all publications are solely those of the individual author(s) and contributor(s) and not of MDPI and/or the editor(s). MDPI and/or the editor(s) disclaim responsibility for any injury to people or property resulting from any ideas, methods, instructions or products referred to in the content. |
© 2023 by the authors. Licensee MDPI, Basel, Switzerland. This article is an open access article distributed under the terms and conditions of the Creative Commons Attribution (CC BY) license (https://creativecommons.org/licenses/by/4.0/).