Abstract
Sandy soil, one of the most abundant soil types in the world, often has lower crop productivity because of poor water and fertilizer retention capacity. The objective of this study was to investigate the effects of the new soil conditioner DewEco (fermented organic material consisted mainly of salt of L-lysine and citric acid) on sandy soil quality and plant growth. Serial dosages of DewEco and nitrogen (N) fertilizer were mixed into sandy soils and planted maize in a greenhouse. DewEco application increased large soil particle composition and decreased small soil particle composition. Soil porosity and the liquid phase increased as the DewEco dosage increased. DewEco also decreased soil pH and increased soil electrical conductivity, soil organic matter content, total nitrogen and available potassium. DewEco significantly enhanced the soil water-holding capacity and soil effective water content although it also increased the wilting coefficient. Finally, DewEco markedly promoted maize growth while improving water use efficiency (WUE) and nitrogen use efficiency (NUE). In addition, there was an interaction effect between DewEco and nitrogen fertilizer, such that the combined effects of DewEco and N exceeded the sum of their respective effects promoting plant growth. Thus, DewEco application can significantly enhance soil water content and nutrient levels by alleviating sandy soil’s physical and chemical properties, thereby promoting plant growth, WUE and NUE. This study indicates that DewEco is a useful eco-friendly sandy soil conditioner for arid and semi-arid regions.
1. Introduction
Land degradation is a global development and environmental issue that could decrease the amount of arable land, threaten food production and influence water security, economic development and environmental integrity [1,2]. Sandy soils are widely distributed, covering more than 900 million hectares worldwide [3]. In recent years, with changes in global climate and increased human activities, more and more arable lands have become sandy soil [4,5]. Soil sandification not only decreases plant productivity but in severe cases also leads to land abandonment and even desertification [6].
Land sandification occurs worldwide, particularly in arid and semi-arid regions, which cover about 41% of the total land surface of the earth [7]. In China, land has desertified rapidly due to high-intensity utilization in the past three decades. The area of land affected by desertification and sandification has already reached 7.1 × 10⁵ km2 [3]. Although the inappropriate development and utilization of sandy soils are likely to lead to further sandification and desertification, sandy soils are still widely used in agricultural production due to increasing food demand [3]. Therefore, discovering ways to improve sandy soil’s properties, prevent sandification and increase plant productivity is important to enable sandy soil utilization and sustainable agricultural production.
Sandy soil is characterized by high large-sediment concentrations, large soil particles and large soil interparticle pores [8]. Because of these distinctive properties, sandy soils are not optimally conducive to agricultural production because they have limited the ability to retain water and fertilizer as well as low organic matter content, imbalanced nutrients and large temperature variations [8,9]. They do offer some advantages, however, including good gas permeability and tillage for agricultural production [9,10]. Previous studies and practices have shown that improving sandy soils can permit high crop yields and effectively prevent soil sandification [11]. The key to improving sandy soils is enhancing soil water and fertilizer retention capacity through improving certain soil properties including soil texture, organic matter content, and nutrient levels [12].
At present, there are three main categories of methods to improve sandy soil, namely, physical, chemical and biological methods [13]. Physical improvement methods consist mainly of engineering strategies, i.e., soil replacement, preloading and sand drains [13,14]. Engineering strategies do improve sandy soil quality quickly and effectively, but they can have a significant negative effect on environmental conditions as well as huge costs [13]. Biological improvement methods typically increase soil organic matter content and nutrients by planting certain crops at certain times, but these methods take a long time and diminish the area’s food production capacity during the improvement process [15]. Chemical improvement methods mainly focus on using synthetic soil conditioners (i.e., polyacrylamide, hydrogels, industrial/municipal solid waste), which can efficiently improve soil physical and chemical properties and increase water and fertilizer retention capacity. Although soil conditioners have the advantages of convenience and effectiveness, it remains uncertain how long these improvements can last, and whether the intermediate or final products of soil conditioners are harmful to soils, plants, groundwater and human health [16,17,18].
People have consistently worked to produce new effective soil conditioners to improve sandy soils [19,20]. The components of most soil conditioners can be divided into three classes: natural organic materials, inorganic or mineral materials, and synthetic materials, which consist primarily of chemical polymers and surfactants [21]. Organic conditioners such as manure, peat, crop residues, and biochar have been widely used to increase soil infiltration and retention, promote aggregation, and provide a substrate for micro- and mesobiological activity [21]. Many organic conditioners increase soil infiltration and soil water retention evidently and immediately, whereas it can take weeks or months to promote aggregation through chemical and biological processes [21]. Inorganic or mineral materials such as bentonite, zeolite, and gypsum or lime can modify soil chemical or physical processes [22]. Synthetic materials mainly include surfactants, superabsorbent hydrogels (SH), and polyacrylamide (PAM) [21,23]. PAM is widely used as a soil conditioner for improving sandy soils; it effectively improves soil water content because PAM itself has a strong water retention capacity [24]. Yet, previous studies have shown that PAM has weaker effects on soil texture, organic matter content and nutrient levels [21]. Moreover, PAM’s cost is too high to allow it to be widely used in agricultural production, and its environment harmfulness, including its impacts on soils, plants, and even human health, remains unknown [16].
To date, there have been few sandy soil conditioners that are simultaneously efficient, economical and eco-friendly, and even fewer that meet those criteria and can also be used in arid and semi-arid regions. Soil conditioners intended for sandy soils should have strong water and fertilizer retention capacity and should improve soil nutrient profiles, boost micro- and mesobiological activity, improve soil texture, and prevent further sandification [10]. Thus, the development of new sandy soil conditioners that can effectively enhance sandy soil’s water and fertilizer retention and its soil organic matter content at low dosages without harm to environment is urgently needed.
DewEco is a liquid-type product consisting of the low molecular weight of organic materials produced through fermentation, invented by CJ (CJ CheilJedang Corp.; Seoul, Rep. of Korea). The main component of DewEco is the salt of L-Lysine and Citric acid, and it contains 50% organic matter and 4% N. DewEco can provide the soil particle adhesion, i.e., their aggregation at the surface and inside the soil structure. Thus, DewEco is located between soil particles at the surface of the soil and/or inside the soil to bind them to improve the soil. Its strong water retention capacity, strong capacity for cementation, relatively high amino acid contents and environmentally friendly impact give it potential as a soil conditioner for use on sandy soils, especially in arid and semi-arid regions. In this study, the effects of DewEco as a soil conditioner for sandy soils were evaluated according to the following metrics: (1) the effects of DewEco on sandy soil’s physical and chemical properties, (2) the effects of DewEco on water retention ability, (3) the effects of DewEco on fertilizer use efficiency (NUE) and water use efficiency (WUE), and (4) the effects of DewEco on plant growth and development. Soil pH, electrical conductivity (EC), soil porosity, soil particle composition, WUE, NUE, plant growth and biomass were investigated in pot experiments using maize seedlings.
2. Materials and Methods
2.1. The Experimental Condition and Materials
The experiments were carried out in 2018 in a glass greenhouse at the Institute of Soil and Water Conservation, Chinese Academy of Sciences, Yangling, Shaanxi Province, China (34°12’ to 34°20’ north latitude and 108°0’ to 108°7’ east longitude). The day/night temperatures of the greenhouse were controlled at 28/22 ± 5 °C and a natural photoperiod (approximately 14 h light a day) was in place during the experimental period. Serial dosages of DewEco which is prepared according to the manufacturing method of Patent no. PCT/KR2019/011181, including 0, 0.4, 0.6, and 0.8 g·kg−1 soil (equivalent to 0, 300, 600, and 900 kg·ha−1 in the field), were applied in this study. The basic properties of the sandy soils were measured before the experiment was started; the contents of clay, silt, and sand particles in the soil were 10% (<0.002 mm), 19% (0.02~0.002 mm), and 71% (2~0.02 mm), respectively. Soil pH, available phosphorus, available potassium, and organic matter content were 8.02, 3.46 mg·kg−1, 106.7 mg·kg−1, 0.72 g·kg−1, respectively.
2.2. The Effect of DewEco on Soil Properties and Soil Water Parameters
Different dosages (0, 0.4, 0.6 and 0.8 g·kg−1) of DewEco were mixed into sandy soils, and 1 kg of uniformly mixed soil was placed in each pot. Each dosage was tested in ten replications (ten pots per dosage). All pots were placed in a greenhouse and soil moisture was maintained at 80% of the field water-holding capacity by measuring pot weight and supplying water every two days. After 15, 20 and 25 days, soil samples were collected, air-dried and passed through a 1 mm sieve to measure soil physical and chemical properties and soil water parameters.
(1) Soil particle size distribution and soil porosity measurement
The sieving and specific gravity tests were conducted to measure soil particle size distribution [25]. A sample of 100 g (accurate to 0.01 g) air-dried soil was passed through a 2 mm sieve, then weighed and placed in a 500 mL conical flask. A total of 50 mL of 0.5 M hexametaphosphate and water were added to a final volume of 250 mL, then lightly boiled for 1 h. Samples larger than 0.25 mm were then measured by the sieving method, while those smaller than 0.25 mm were measured by the specific gravity method.
The ring knife method was used to measure soil porosity [26]. Specifically, soil was sampled with a ring knife, and the quality of the soil and ring knife were recorded as W0. The soil and ring knife were then placed in a basin for wetting overnight, and the weight of water saturated was recorded as W1. After natural drying (without water leaking from the pot bottom), the soil and ring knife were then dried at 105 °C for 24 h, and the quality of the soil and ring knife was recorded as W2. Soil porosity was calculated by the following equations:
where V refers to the volume of the ring knife.
Soil porosity = (W1 − W2)/V × 100%
Soil bulk density = (W2 − W0)/V × 100%
(2) Soil pH and soil electrical conductivity (EC) measurements
Soil pH was measured according to Wilke (2005)’s electrode method (1:2.5 soil/water ratio). A sample of 10 g air-dried soil was passed through a 1 mm sieve, then placed in a 150 mL triangular bottle. An amount of 25 mL distilled water was added and the bottle was shaken for 30 min at 180–200 r/min; pH was then measured with an acidimeter. Soil electrical conductivity was measured according to Wilke [27]’s conductivity method (1:5 soil/water ratio). A sample of 5 g air-dried soil was passed through a 1 mm sieve, then placed in a 150 mL triangular bottle. An amount of 25 mL distilled water was added and the bottle was shaken for 5 min at 180–200 r/min. The filtered supernatant was then used for measuring EC with a conductivity meter. Each soil sample was measured three times and each treatment had three replicates.
(3) Soil organic matter content, total nitrogen, available phosphorous and available potassium measurement
Soil organic matter content was measured according to Walkley and Black [28]. A sample of 0.5 g soil was placed in a 250 mL conical flask, to which 10 mL of 0.17M K2Cr2O7 was added with a pipette. The soil and dichromate were mixed by gently swirling the flask, followed by the addition of 20 mL H2SO4. The flask was again swirled gently to allow the soil to have good contact with the reagent. The contents of the flask were allowed to stand for 30 min, then diluted with 200 mL of water and titrated with 1M FeSO4 and three or four drops of O-phenanthrolineas indicator. Each soil sample was measured three times and each treatment had three replicates.
Soil total N was measured according to the Kjeldahl method [29]. A sample of 0.5 g soil was placed in a digestive glass tube and wet with water; 10 mL H2SO4 was then added. After resting overnight, H2O2 was added as a catalyst and digested at 38.5 °C for 3 h; the total N content was then measured with a Kjeldahl meter. Available phosphorous was measured according to the Olsen method [30]. A sample of 0.5 g soil was placed in a 150 mL Erlenmeyer flask to which 50 mL of 0.5 M NaHCO3 was added. The flask was then shaken at 180–200 r/min for 30 min and the sample was filtered through phosphorus-free filter paper. Then, 10 mL of the solution was placed in a 50 mL volumetric flask to which 5 mL molybdate and 1 mL ascorbic acid solution were added, followed by distilled water for a final volume of 50 mL. Available potassium was measured according to the flame photometer method [31]. A sample of 5 g soil was placed in a 150 mL triangular bottle and shaken at 180-200 r/min with 50 mL of 1 M NH4OAc for 1 h at 25 °C. The phosphorus and potassium contents in the extractant were determined using a flame photometer. Each soil sample was measured three times and each treatment had three replicates.
(4) Soil water-holding capacity, wilting coefficient and soil effective water content measurement
Soil water-holding capacity (WHC) was measured according to [32]. A sample of experimental soil was placed in a pot with a hole to allow unabsorbed water to escape. Soil quality was recorded as V0 and the soil was then wetted overnight. After natural drying (without water leaking from the pot bottom), the quality of the soil and pot were recorded as V1. The soil and pot were then dried at 105 °C for 24 h, and the quality of the soil and pot were recorded as V2. Soil WHC was calculated according to the following equation:
Soil water-holding capacity (%) = [(V2 − V1)/(V2 − V0)] × 100
The wilting coefficient was calculated according to Briggs and Shantz [33] by the following equation:
The soil effective water content calculated according to Rawls et al. [34] using the following equation:
(5) Soil three phase ratio (TPR) was calculated from soil porosity and soil water content [35] as follows:
Solid phase (%) = 1 − soil porosity
Liquid phase (%) = soil porosity − soil water content
Gas phase (%) = 1 − solid phase − liquid phase
2.3. The Effect of DewEco on Plant Growth, Water Use Efficiency and Nitrogen Use Efficiency
For further investigation of the effect of DewEco on plant growth, a complete randomized pot experiment was carried out with four DewEco and four nitrogen dosages (Figure 1) during June and July 2018. A combined series of dosages of DewEco (0, 0.4, 0.6 and 0.8 g·kg−1 soil, equivalent to 0, 300, 600 and 900 kg·ha−1 in field application) and N (0, 0.029, 0.058 and 0.087 g·kg−1 soil, equivalent to 0, 20, 40 and 60 kg·ha−1 in field application) were included in this study. In addition, all treatments were supplied with 60 kg P2O5·ha−1 and 60 kg K2O·ha−1. Urea (46% N), superphosphate (12% P2O5) and potassium chloride (60% K2O) were used as the N, P and K fertilizer sources. The various dosages of DewEco and nitrogen fertilizer were mixed with 8 kg sandy soil and placed into a plastic pot (20 cm height by 11 cm inner diameter). Seeds of a maize cultivar (‘Zhengdan 958’) were sown on June 1 and the plant was sampled on 25 July. Each treatment had six pots and each pot contained three plants. During the experimental period, soil water content was maintained at 80% of the field water-holding capacity as confirmed by weighing each pot every two days. At the end of the experiment, the fifth leaf of each maize plant (from bottom to top) was used to assess photosynthesis (Pn) and chlorophyll content (SPAD index). Maize roots were washed, then each whole plant was separated into root, stem and leaves and dried to measure the biomass.
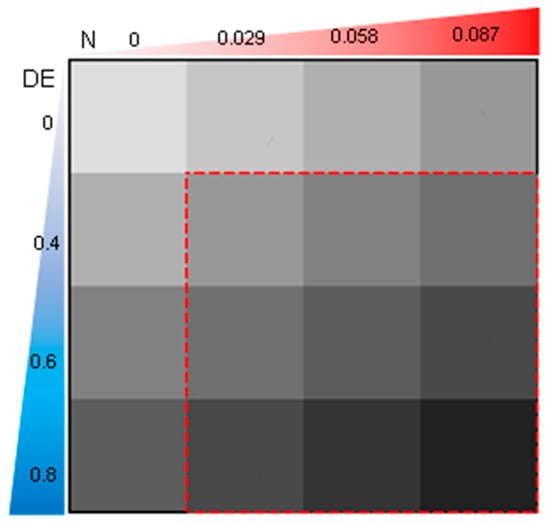
Figure 1.
Experimental design of DewEco (DE) and N treatment. Red box indicates treatments with DewEco and N mixed application. Darker blue shading represents increasing dosages of DewEco, and darker red shading represents increasing dosages of N.
After measuring the biomass, the N content in plant tissue was measured by the Kjeldahl acid-digestion method [36]. The nitrogen use efficiency (NUE) was calculated according to the following equation [37]:
where N0 is the nitrogen content of the whole plant without N application, N1 is the nitrogen content of the whole plant with N application, and N2 is the amount of N applied. N0, N1 and N2 are expressed in grams N per kilogram soil.
NUE (%) = (N1 − N0)/N2 × 100%
During the experimental period, the amount of water consumption was recorded, and water use efficiency (WUE) was measured and calculated according to the following equation [38]:
WUE (%) = (biomass/total water consumption) × 100%
2.4. The Analysis of Interaction Effects between DewEco and Nitrogen Fertilizer
Based on the biomass parameter, the interaction effects between DewEco and N for maize growth were analyzed using the following equations [39]:
where μ = , ai = ∑Zij/4, bj = ∑Zij/4 and (ab)ij = Zij − ai − bj, where i = 1, 2, 3, 4; j = 1, 2, 3, 4; k = 1. Zij represents the difference between yij and yij. ai represents the main effect of DewEco. bj represents the main effect of N fertilizer. (ab)ij represents the interaction between DewEco and N. yijk represents the kth observation, and ε represents the value of error.
yijk = μ + ai + bj + (ab)ij + εijk
2.5. Statistical Analysis
All data were subjected to statistical analysis using SPSS version 22 (IBM Company, Chicago, IL, USA). Analysis of variance (ANOVA) was used to compare the mean values of different parameters in the different treatments. Significant means at 5% probability level were detected by least significant deference testing (LSD). All treatments included three replications.
3. Results
3.1. The Effect of DewEco on Sandy Soil Properties
The soil particle composition was affected by DewEco application (Figure 2). The particle sizes in sandy soils were mainly distributed between 0.01 and 0.25 mm. As DewEco dosage increased, the proportion of large soil particles (>0.05 mm) increased while that of small soil particles gradually decreased. Under 0.8 g kg−1 DewEco application, for example, large soil particles were increased by 27%, and small soil particles were correspondingly reduced by 27% (Figure 2d).
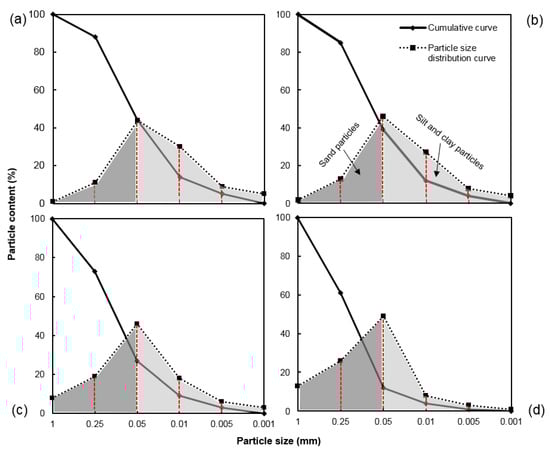
Figure 2.
Effects of different dosages of DewEco (DE) on sandy soil particle composition. (a) control: without DewEco. (b) 0.4 g DewEco kg1 sandy soil (DE 0.4). (c) 0.6 g DewEco·kg−1 sandy soil (DE 0.6). (d) 0.8 g DewEco·kg−1 sandy soil (DE 0.8). Note. The size of the shaded area represents the proportions of soil particles, where dark gray represents sand particles and light gray represents silt and clay particles. The cumulative curve indicates the sum of soil particles below or equal to a certain particle size.
Soil porosity (SP) and soil three-phase ratio (TPR) also reflected soil physical properties. SP increased significantly from 46.11% to 49.02% when the DewEco dosage was increased from 0 to 0.8 g/kg soil. The TPR was also affected by DewEco application. Compared with control, the solid phase was decreased by 2.81% under 0.8 g DewEco application; correspondingly, the liquid and gas phases were increased by 0.45% and 2.46%, respectively (Figure 3).
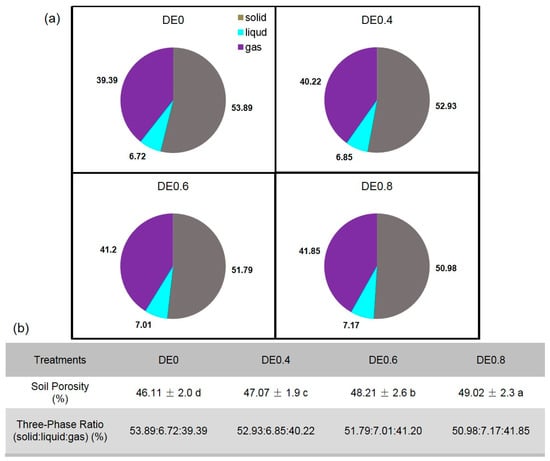
Figure 3.
Effects of different dosages of DewEco (DE) on three-phase ratio (a) and sandy soil porosity (b). DE 0, 0.4, 0.6 and 0.8 refer to DewEco dosages of 0, 0.4, 0.6 and 0.8 g·kg−1 sandy soil, respectively. Values within a row followed by different letters are significantly different at p ≤ 0.05.
3.2. The Effect of DewEco on Soil pH, EC, Organic Matter and Nutrient Contents
As DewEco dosage increased, soil pH gradually decreased from 8.02 to 7.74. EC, on the other hand, gradually increased from 53.3 µS/cm to 73.7 µS/cm. EC was 38.2% greater under 0.8g·kg−1 DewEco treatment than under control conditions. Soil total nitrogen, available phosphorus, available potassium and organic matter were all increased with DewEco application (Table 1). Under 0.8 g·kg−1 DewEco application, for example, soil total nitrogen, available phosphorus, available potassium and organic matter increased by 0.1 g·kg−1, 2.4 mg·kg−1, 20.2 mg·kg−1 and 0.1 g·kg−1, respectively, relative to the control.

Table 1.
Effects of different dosages of DewEco on soil pH, EC, organic matter and nutrient contents.
3.3. The Effect of DewEco on Soil Water-Holding Capacity, Wilting Coefficient and Effective Soil Water Content
At a dosage of 0.4 g·kg−1, DewEco significantly increased the water-holding capacity (WHC); at a dosage of 0.8 g·kg−1, it increased the WHC by 16%. Meanwhile, the wilting coefficient (WC) also increased from 2.47 to 3.03% as the DewEco dosage increased. Thus, the effective soil water content was increased from 7.91% to 8.99%, rising by 3%, 8% and 14% under DewEco dosages of 0.4, 0.6 and 0.8 g·kg−1, respectively.
3.4. The Effect of DewEco on Maize Growth, WUE and NUE
Maize plant height, chlorophyll level (SPAD), photosynthetic ability (Pn) and biomass were significantly enhanced with DewEco or N application (Table 2). Under N60 treatment combined with 0.8 g·kg−1 DewEco, plant height, biomass, SPAD and Pn were increased by 42.83%, 151.8%, 26.26% and 47.23%, respectively, compared to control values (Table 2).
Table 2.
Effects of different dosages of DewEco and N application on maize growth, chlorophyll level (SPAD value) and photosynthesis rate (Pn).
WUE increased as the DewEco or N fertilizer dosage increased (Figure 4). Holding the N dosage constant at 0.087g N, 0.8g DewEco application increased WUE by 51.18% compared to the control value. The N contents of maize roots, stems and leaves were all increased as the DewEco and N dosages increased (Figure 5). Holding the DewEco dosage constant at 0.8 g, for example, the N content in whole plants increased from 5.88 (0 N application) to 7.86 (0.087 g N application). Meanwhile, under 0.087 g N application, 0.8 g DewEco application increased the N content by 49.43% compared to no DewEco. NUE also gradually increased as DewEco dosage increased. The highest NUE value of 64.89% was found under 0.8g DewEco and 0.029 g N treatment; this value was 51.12% higher than that recorded in the absence of DewEco (DewEco 0 and N 0.029). This shows that DewEco application dramatically increases NUE and saves N fertilizer.
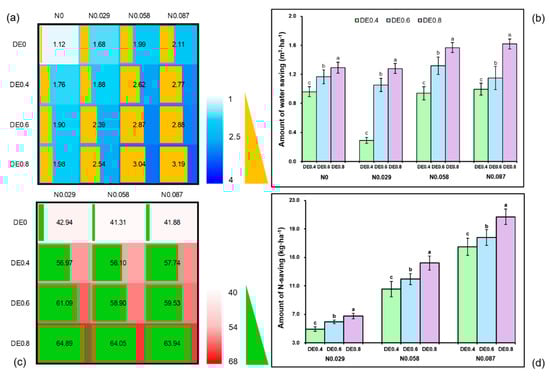
Figure 4.
Effects of DewEco (DE) and N application on water and N use efficiency. (a) Changes in water use efficiency (WUE) after DewEco and N application. Darker blue shading represents better WUE, and the size of the yellow area (from 1 to 4) represents the value of WUE. (b) The amount of water saved when DE and N were added to sandy soils. (c) Changes in N use efficiency (NUE), darker red shading represents better NUE, and the size of the green area (from 40 to 68) represents the value of NUE. (d) The amount of N saved when DE and N were added to sandy soils. Values with different letters are significantly different at p ≤ 0.05.
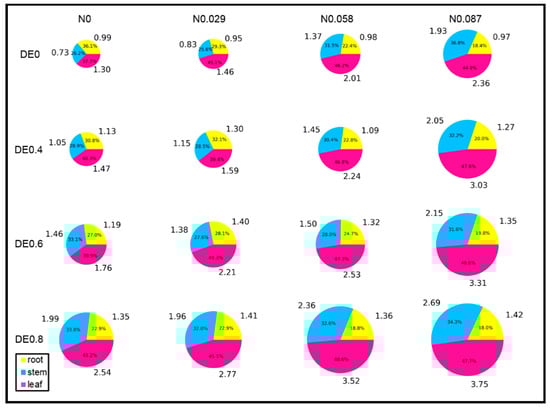
Figure 5.
Effects of DewEco (DE) and N fertilizer on N content in the roots, stems and leaves of maize plants. Values inside the pie chart indicate the percentage of N content in each tissue as a percentage of whole plant level, and values outside the pie chart indicate the exact N contents in each plant part as mg g−1 dry weight. The area of the pie chart represents the total N content of the whole plant under different DewEco and N dosages. Note that, during the drawing process, the experimental data was divided by 4.
3.5. The Interaction Effects between DewEco and N
Z values could be positive or negative as an intermediate parameter for calculating interaction effect values (Table 3). The magnitude of Z values reflected the distance between yij and the corresponding . The interaction effects between DewEco and N are shown in Figure 6. We calculated the interaction effect values (abij) according to Formula (l). The data show that all abij values are not equal to 0, indicating that the different dosages of DewEco and N admixed into sandy soils have an interaction effect on the biomass of maize seedlings, and that the size of this interaction effect can be calculated from the size of the abij values. The interaction effect of DewEco 0.6 and N 0.058 treatment is the largest, with a value of 4.65.
Table 3.
Z values calculated from biomass.
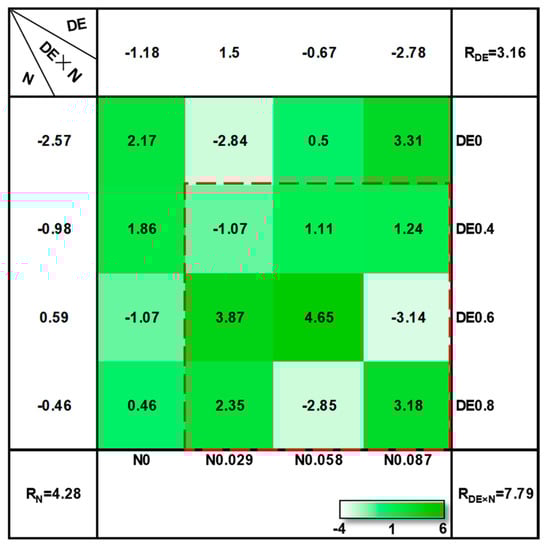
Figure 6.
The size of interaction effect values between DewEco (DE) and N. The first column’s data refer to ai, which is the average value of the corresponding Z value of various DewEco dosages; the first-row’s data refer to bj, which is the average value of the Z values of various N dosages. RDE, RN and RDE×N refer to the range of ai, bj and abij. RDE, RN and RDE×N were calculated (12), and actual values were used to make heat maps. The red box represents the interaction effect between DewEco and N mixed application at each dosage.
4. Discussion
In this study, we tested the new soil conditioner DewEco and found that it can improve sandy soil’s properties and plant growth significantly, indicating that DewEco can be used as a novel soil conditioner in sandy soils to ensure sustainable agricultural development.
4.1. Application of DewEco Improves Sandy Soil’s Physical and Chemical Properties
Soil particle composition, which reflects the source of the mother matter and certain characteristics of the soil-forming process, is an important indicator of soil physical properties and has a great impact on fertility and water characteristics [40]. Our study showed that DewEco application increased the proportions of large particles and decreased the proportions of small particles. For example, the proportion of small soil particles (>0.02 mm) was improved by 225% under 0.8 g·kg−1 DewEco application compared to control (Figure 2). Moreover, the three-phase ratio was also changed by DewEco application (Figure 3). These results indicate that DewEco can markedly improve sandy soil’s physical properties.
In this study, the test soil was an alkaline sandy soil and the pH of the soil decreased as DewEco dosage increased (Table 1). Alkaline soil is adverse for plant growth and nutrient absorption; thus, the ability to neutralize alkalinity improves conditions for plant growth [41]. Other than the strong acidity of DewEco itself (its pH is about 4.4), which directly decreases soil pH, this neutralization is also due to the high level of organic compounds in DewEco, which decreases the pH through chelating metal ions such as K+, Ca2+ and Mg2+ [42]. Soil EC is a measure of the total ion conductance in the soil solution, which is closely correlated with crop growth and yield [43]. EC that is too low results in lower nutrient content in the soil, while EC that is too high causes salt stress and inhibits plant growth [44]. The application of DewEco significantly increased the EC of sandy soil, perhaps because of existing strong water absorbent -COO- groups forming a 3D structure in DewEco [45,46].
Soil organic matter and nutrient levels are important indicators of soil quality, and they are also affected by the application of soil conditioners [47,48,49]. In this study, DewEco application enhanced soil total N, available P and available K as well as organic matter contents (Table 1). The increased N and organic matter may have been directly caused by DewEco in part. The application of DewEco could transfer large amounts of amino acids into the soil, which could stimulate soil microbial activity and thereby lead to enhanced soil nutrient levels. On the other hand, it has been shown that some kinds of soil conditioners can decrease nutrient leakage by adsorbing inorganic ions and nutrients [50]. In addition, the enhanced EC and decreased pH associated with DewEco application could also contribute to enhanced soil nutrient levels. It has been reported that available P is increased ten times for every one-unit decrease in pH, and increased EC can also contribute to increased nutrient levels [43].
4.2. DewEco Improves Sandy Soil’s Water Retention
Previous studies have proved that soil conditioners such as PAM, illite and biochar can effectively increase the water-holding capacity, decrease deep percolation and reduce evaporation in sandy soils [51,52,53,54]. Improved water retention through soil conditioners will improve plant growth and increase plant water use efficiency [23] (Guilherme et al.; 2015). In our current study, application of DewEco increased the sandy soil’s water-holding capacity and the effective soil water content, although the wilting coefficient was also enhanced (Table 4, Figure 4). Although DewEco cannot create a gel in the soil as PAM does, the numerous -COO- groups in DewEco could also contribute to the soil’s ability to retain water [16,23,45,46] In addition, application of DewEco significantly increased the soil porosity and enhanced the liquid phase ratio (Figure 2 and Figure 3), each of which is also known to increase water retention.
Table 4.
Effects of different dosages of DewEco on soil water-holding capacity, wilting coefficient and effective soil water contents.
4.3. Application of DewEco Promotes Plant Growth, WUE and NUE
Plant growth and yield are the most reliable indicators for evaluating the performance of soil conditioners [55,56,57]. In this study, application of DewEco increased maize seedling height, biomass, photosynthetic rate (Pn) and chlorophyll level (SPAD) (Table 2), suggesting that DewEco has a great potential as a useful soil conditioner for sandy soils. Furthermore, our results show an interaction effect between DewEco and N fertilizer such that the combined effects of DewEco and N exceed the sum of their respective effects promoting plant growth (Table 3). In addition, the application of DewEco markedly enhanced WUE and NUE. The increase in WUE may be ascribed to the increase in water retention ability and the decrease in water leakage and evaporation. Meanwhile, DewEco application also enhanced soil and plant tissue N contents, leading to higher NUE, which in turn contributed to higher WUE.
5. Conclusions
Taking all our findings together, we conclude that DewEco application can improve soil texture, increase soil porosity, large particles content and water retention capacity, and enhanced soil fertility. The application of DewEco can also decrease soil pH and increase soil EC and nutrient contents, which together contribute to enhanced NUE. Therefore, the application of DewEco effectively enhances plant growth by enhancing soil water content and nutrient levels (Figure 7). In addition, compared with other commonly used organic conditioners such as manure, peat, crop residues and biochar, the necessary dosages of DewEco are far lower, while the beneficial effects on plant growth emerge far more quickly. Compared with existing synthetic soil conditioners such as polyacrylamide (PAM), DewEco excels at improving soil nutrient levels and soil texture. Overall, this study indicates that DewEco can be used as an eco-friendly sandy soil conditioner for improving sandy soil quality for sustainable agricultural production in arid and semi-arid regions.
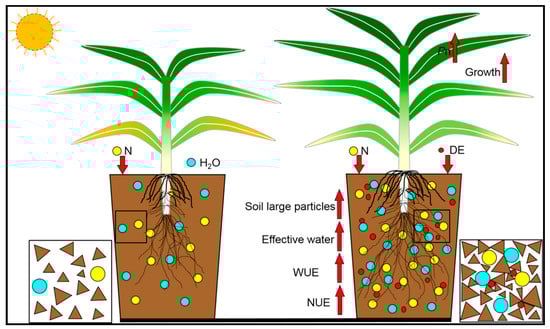
Figure 7.
A schematic model of DewEco application on sandy soil quality. DewEco application could improve soil texture, decrease particle pore size, increase content of large particles, increase capacity for water retention and improve fertility, decrease soil pH and increase soil EC and nutrient contents, which together contribute to enhancing plant growth.
Author Contributions
S.W. conceptualized and design the experiment; Y.L. performed the experiment and collect data; M.Y. helped with data analysis; K.N.; J.H.; S.S.; L.Y. and X.D. reviewed and edited the manuscript, and did project administration. All authors have read and agreed to the published version of the manuscript.
Funding
This work was supported by CJ CheilJedang Corp.
Institutional Review Board Statement
Not applicable.
Informed Consent Statement
Not applicable.
Data Availability Statement
All data generated or analysed during this study are included in this published article. All the methods were carried out in accordance with relevant guidelines and regulations.
Conflicts of Interest
The authors declare no conflict of interest.
References
- Gisladottir, G.; Stocking, M. Land degradation control and its global environmental benefits. Land Degrad. Dev. 2005, 16, 99–112. [Google Scholar] [CrossRef]
- D’Odorico, P.; Bhattachan, A.; Davis, K.F.; Ravi, S.; Runyan, C.W. Global desertification: Drivers and feedbacks. Adv. Water Resour. 2013, 51, 326–344. [Google Scholar] [CrossRef]
- Driessen, P.; Deckers, S.; Spaargaren, O.; Nachtergaele, F. Lecture Notes on the Major Soils of the World; FAO: Rome, Italy, 2001. [Google Scholar]
- Shi, P.J.; Shimizu, H.; Wang, J.A.; Liu, L.Y.; Li, X.Y.; Fan, Y.D.; Yu, Y.J.; Jia, H.K.; Zhao, Y.; Wang, L.; et al. Land degradation and blown-sand disaster in China. In Plant Responses to Air Pollution and Global Change; Springer: Tokyo, Japan, 2005; pp. 261–269. [Google Scholar] [CrossRef]
- Zhao, H.; Chen, X.; Zhang, Z.; Zhou, Y. Exploring an efficient sandy barren index for rapid mapping of sandy barren land from Landsat TM/OLI images. Int. J. Appl. Earth Obs. Geoinf. 2019, 80, 38–46. [Google Scholar] [CrossRef]
- Yu, X.; Grace, M.; Zou, Y.; Yu, X.; Lu, X.; Wang, G. Surface sediments in the marsh-sandy land transitional area: Sandification in the western Songnen Plain, China. PLoS ONE 2014, 9, e99715. [Google Scholar] [CrossRef][Green Version]
- Jafari, R.; Bakhshandehmehr, L. Quantitative mapping and assessment of environmentally sensitive areas to desertification in central Iran. Land Degrad. Dev. 2016, 27, 108–119. [Google Scholar] [CrossRef]
- Chen, L.H. Suggestion on aeolian sandy soil taxonomy. In Discussion on Soil Taxonomic Classification in China; Gong, Z., Ed.; Academic Press: Beijing, China, 1992; pp. 152–157. (In Chinese) [Google Scholar]
- Duan, Z.H.; Xiao, H.L.; Dong, Z.B.; Wang, G.; Drake, S. Morphological, physical and chemical properties of aeolian sandy soils in northern China. J. Arid Environ. 2007, 68, 66–76. [Google Scholar]
- Khresat, S.A.; Rawajfih, Z.; Mohammad, M. Morphological, physical and chemical properties of selected soils in the arid and semi-arid region in north-western Jordan. J. Arid Environ. 1998, 40, 15–25. [Google Scholar] [CrossRef]
- Keller, T.; Sutter, J.A.; Nissen, K.; Rydberg, T. Using field measurement of saturated soil hydraulic conductivity to detect low-yielding zones in three Swedish fields. Soil Tillage Res. 2012, 124, 68–77. [Google Scholar] [CrossRef]
- Al-Darby, A.M. The hydraulic properties of a sandy soil treated with gel-forming soil conditioner. Soil Technol. 1996, 9, 15–28. [Google Scholar] [CrossRef]
- Gaafer, M.; Bassioni, H.; Mostafa, T. Soil improvement techniques. Int. J. Sci. Eng. Res. 2015, 6, 217–222. [Google Scholar]
- Harada, K.; Ohbayashi, J. Development and improvement effectiveness of sand compaction pile method as a countermeasure against liquefaction. Soils Found. 2017, 57, 980–987. [Google Scholar] [CrossRef]
- Mishra, A.; Sharma, S.D.; Khan, G.H. Improvement in physical and chemical properties of sodic soil by 3, 6 and 9 years old plantation of Eucalyptus tereticornis: Biorejuvenation of sodic soil. For. Ecol. Manag. 2003, 184, 115–124. [Google Scholar] [CrossRef]
- Seybold, C.A. Polyacrylamide review: Soil conditioning and environmental fate. Commun. Soil Sci. Plant Anal. 1994, 25, 2171–2185. [Google Scholar] [CrossRef]
- Yamato, M.; Okimori, Y.; Wibowo, I.F.; Anshori, S.; Ogawa, M. Effects of the application of charred bark of Acacia mangium on the yield of maize, cowpea and peanut, and soil chemical properties in South Sumatra, Indonesia. Soil Sci. Plant Nutr. 2006, 52, 489–495. [Google Scholar] [CrossRef]
- Czaban, J.; Siebielec, G. Effects of bentonite on sandy soil chemistry in a long-term pot experiment (II); Effect on pH, CEC, and macro- and micronutrients. Pol. J. Environ. Stud. 2013, 22, 1669–1676. [Google Scholar]
- Al-Omran, A.M.; Al-Harbi, A.R.; Wallace, A.; Terry, R.E. Improvement of sandy soils with soil conditioners. In Handbook of Soil Conditioners: Substances That Enhance the Physical Properties of Soil; Marcel Dekker: New York, NY, USA, 1998; pp. 363–384. [Google Scholar]
- Singh, V. Combined effects of biocontrol agents and soil amendments on soil microbial populations, plant growth and incidence of charcoal rot of cowpea and wilt of cumin. Phytopathol. Mediterr. 2012, 51, 307–316. [Google Scholar] [CrossRef]
- Sojka, R.E.; Bjorneberg, D.L.; Entry, J.A.; Lentz, R.D.; Orts, W.J. Polyacrylamide in agriculture and environmental land management. Adv. Agron. 2007, 92, 75–162. [Google Scholar] [CrossRef]
- Vijay, S.; Jakkula, E.; Wani, S.P. Zeolites: Potential soil amendments for improving nutrient and water use efficiency and agriculture productivity. Sci. Rev. Chem. Commun. 2018, 8, 1–15. [Google Scholar]
- Guilherme, M.R.; Aouada, F.A.; Fajardo, A.R.; Martins, A.F.; Paulino, A.T.; Davi, M.F.; Rubira, A.F.; Muniz, E.C. Superabsorbent hydrogels based on polysaccharides for application in agriculture as soil conditioner and nutrient carrier: A review. Eur. Polym. J. 2015, 72, 365–385. [Google Scholar] [CrossRef]
- Bouranis, D.L.; Theodoropoulos, A.G.; Drossopoulos, J.B. Designing synthetic polymers as soil conditioners. Commun. Soil Sci. Plant Anal. 1995, 26, 1455–1480. [Google Scholar] [CrossRef]
- Gee, G.W.; Bauder, J.W. Particle Size Analysis. In Methods of Soil Analysis. Part I-Physical and Mineralogical Methods, 2nd ed.; Klute, A., Ed.; American Society of Agronomy: Madison, WI, USA; Soil Science Society of America: Madison, WI, USA, 1986; pp. 383–412. [Google Scholar]
- Al-Shammary, A.A.G.; Kouzani, A.Z.; Kaynak, A.; Khoo, S.Y.; Norton, M.; Gates, W. Soil bulk density estimation methods: A Review. Pedosphere 2018, 4, 581–596. [Google Scholar] [CrossRef]
- Wilke, B.M. Determination of Chemical and Physical Soil Properties. In Monitoring and Assessing Soil Bioremediation; Soil Biology; Springer: Berlin/Heidelberg, Germany, 2005; Volume 5, pp. 47–95. [Google Scholar] [CrossRef]
- Walkley, A.; Black, I.A. An examination of the Degtjareff method for determining soil organic matter, and a proposed modification of the chromic acid titration method. Soil Sci. 1934, 37, 29–38. [Google Scholar] [CrossRef]
- Bremner, J.M. Determination of nitrogen in soil by the Kjeldahl method. J. Agric. Sci. 1960, 55, 11–33. [Google Scholar] [CrossRef]
- Olsen, S.R. Estimation of available phosphorus in soils by extraction with sodium bicarbonate. In USDA Circular No.939; USA Government Print Office: Washington, DC, USA, 1954; pp. 1–19. [Google Scholar]
- Knudsen, D.; Peterson, G.A.; Pratt, P.F. Lithium, Sodium, and Potassium. In Methods of Soil Analysis: Part 2 Chemical and Microbiological Properties, 9.2.2, 2nd ed.; American Society of Agronomy: Madison, WI, USA, 1983. [Google Scholar]
- Rowell, D.L. Soil Science: Methods and Applications; Longman Group UK Ltd.: London, UK, 1994. [Google Scholar]
- Briggs, L.J.; Shantz, H.L. The wilting coefficient and its indirect determination. Bot. Gaz. 1912, 53, 20–37. Available online: https://www.jstor.org/stable/2467365 (accessed on 12 February 2020). [CrossRef]
- Rawls, W.J.; Brakensiek, D.L.; Saxton, K.E. Estimation of soil water properties. Trans. ASES 1982, 25, 1316–1320. [Google Scholar] [CrossRef]
- Yong, R.N.; Warkentin, B.P. Soil Properties and Behaviour; Elsevier: Amsterdam, The Netherlands, 1975; Volume 11. [Google Scholar]
- Muñoz-Huerta, R.F.; Guevara-Gonzalez, R.G.; Contreras-Medina, L.M.; Torres-Pacheco, I.; Prado-Olivarez, J.; Ocampo-Velazquez, R.V. A review of methods for sensing the nitrogen status in plants: Advantages, disadvantages and recent advances. Sensors 2013, 13, 10823–10843. [Google Scholar] [CrossRef]
- Vitousek, P. Nutrient cycling and nutrient use efficiency. Am. Nat. 1982, 119, 553–572. Available online: https://www.jstor.org/stable/2461143 (accessed on 12 February 2020). [CrossRef]
- French, R.J.; Schultz, J.E. Water use efficiency of wheat in a Mediterranean-type environment. I. The relation between yield, water use and climate. Aust. J. Agric. Res. 1984, 35, 743–764. [Google Scholar] [CrossRef]
- Yuan, Z.F.; Wang, N.X. Data analysis of multifactorial experiments with additive effects. J. Northwest A. F. Univ. 1980, 3, 17–26. (In Chinese) [Google Scholar]
- Saxton, K.E.; Rawls, W.J. Soil Water Characteristic Estimates by Texture and Organic Matter for Hydrologic Solutions. Soil Sci. Soc. Am. J. 2006, 70, 1569–1578. [Google Scholar] [CrossRef]
- Shrivastava, P.; Kumar, R. Soil salinity: A serious environmental issue and plant growth promoting bacteria as one of the tools for its alleviation. Saudi J. Biol. Sci. 2014, 22, 123–131. [Google Scholar] [CrossRef] [PubMed]
- Himes, F.L.; Barber, S.A. Chelating Ability of Soil Organic Matter. Soil Sci. Soc. Am. J. 1957, 21, 368–373. [Google Scholar] [CrossRef]
- Kitchen, N.R.; Sudduth, K.A.; Drummond, S.T. Soil electrical conductivity as a crop productivity measure for claypan soils. J. Prod. Agric. 1999, 12, 607–617. [Google Scholar] [CrossRef]
- Corwin, D.L.; Lesch, S.M. Apparent soil electrical conductivity measurements in agriculture. Comput. Electron. Agric. 2005, 46, 11–43. [Google Scholar] [CrossRef]
- Li, X.Y.; Wu, W.H.; Liu, W.Q. Synthesis and properties of thermo-responsive guar gum/poly (N-isopropylacrylamide) interpenetrating polymer network hydrogels. Carbohydr. Polym. 2008, 71, 394–402. [Google Scholar] [CrossRef]
- Huang, Y.W.; Zeng, M.; Ren, J.; Wang, J.; Fan, L.R.; Xu, Q.Y. Preparation and swelling properties of graphene oxide/poly (acrylic acid-co-acrylamide) super-absorbent hydrogel nanocomposites. Colloids Surf. A Physicochem. Eng. Asp. 2012, 401, 97–106. [Google Scholar] [CrossRef]
- Kabirinejad, S.; Kalbasi, M.; Khoshgoftarmanesh, A.H.; Hoodaji, M.; Afyuni, M. Effect of incorporation of crops residue into soil on some chemical properties of soil and bioavailability of copper in soil. Int. J. Adv. Biol. Biomed. Res. 2014, 2, 2819–2824. [Google Scholar] [CrossRef]
- McGuire, E.; Carrow, R.N.; Troll, J. Chemical soil conditioner effects on sand soils and turfgrass growth. Agron. J. 1978, 70, 317–321. [Google Scholar] [CrossRef]
- Bouranis, D.L.; Vlyssides, A.G.; Drossopoulos, J.B.; Karvouni, G. Some characteristics of a new organic soil conditioner from the co-composting of olive oil processing wastewater and solid residue. Commun. Soil Sci. Plant Anal. 1995, 26, 2461–2472. [Google Scholar] [CrossRef]
- Asghari, S.; Abbasi, F.; Neyshabouri, M.R. Effects of soil conditioners on physical quality and bromide transport properties in a sandy loam soil. Biosyst. Eng. 2011, 109, 90–97. [Google Scholar] [CrossRef]
- Al-Omran, A.M.; Mustafa, M.A.; Shalaby, A.A. Intermittent evaporation from soil columns as affected by gel-forming conditioners. Soil Sci. Soc. Am. J. 1987, 51, 1593–1599. [Google Scholar] [CrossRef]
- Chan, K.Y.; Van, Z.L.; Meszaros, I.; Downie, A.; Joseph, S.D. Agronomic values of greenwaste biochar as a soil amendment. Aust. J. Soil Res. 2007, 45, 629–634. [Google Scholar] [CrossRef]
- Choi, J.S.; Cho, S.W.; Kim, T.S.; Cho, K.; Han, S.S.; Kim, H.K.; Woo, S.H.; Chung, K.Y. Proteome analysis of greenhouse-cultured lettuce with the natural soil mineral conditioner illite. Soil Biol. Biochem. 2008, 40, 1370–1378. [Google Scholar] [CrossRef]
- Lepore, B.J.; Thompson, A.M.; Petersen, A. Impact of polyacrylamide delivery method with lime or gypsum for soil and nutrient stabilization. J. Soil Water Conserv. 2009, 64, 223–231. [Google Scholar] [CrossRef]
- Ahmed-El-Sayed, H.E.S. Influence of salinity stress on growth parameters, photosynthetic activity and cytological studies of Zea mays, L. plant using hydrogel polymer. Agric. Biol. J. N. Am. 2011, 2, 907–920. [Google Scholar] [CrossRef]
- Liu, W.; Ji, H.L.; Kerr, P.; Wu, Y.H.; Fang, Y.M. The application of soil amendments benefits to the reduction of phosphorus depletion and the growth of cabbage and corn. Environ. Sci. Pollut. Res. 2015, 22, 16772–16780. [Google Scholar] [CrossRef]
- Das, P.; Barua, S.; Sarkar, S.; Karak, N.; Bhattacharyya, P.; Raza, N.; Bhattacharya, S.S. Plant extract-mediated green silver nanoparticles: Efficacy as soil conditioner and plant growth promoter. J. Hazard. Mater. 2018, 346, 62–72. [Google Scholar] [CrossRef]
Publisher’s Note: MDPI stays neutral with regard to jurisdictional claims in published maps and institutional affiliations. |
© 2022 by the authors. Licensee MDPI, Basel, Switzerland. This article is an open access article distributed under the terms and conditions of the Creative Commons Attribution (CC BY) license (https://creativecommons.org/licenses/by/4.0/).