Abstract
Knowledge of the mineralisation and nutrient release of organic fertilisers is essential to ensure plant nutrient demand and availability, to increase N use efficiency and to minimise environmental risks. In 2018–2020, two similar field experiments were carried out on clay loam Cambisol with winter wheat (Triticum aestivum L.) grown without N application and applying liquid anaerobic digestate (LD), pig slurry (PS) and ammonium nitrate (AN) fertilizer with and without additional fertilization (N120 and N120+50). The aim of the research was to compare the effect of organic and mineral fertilizers on the variation of soil mineral nitrogen forms in the 0–30, 30–60 cm soil layers and N accumulation in wheat yield. Fertilizers applied during the previous growing season increased the nitrate and ammonium nitrogen (N-NO3 and N-NH4) content after the resumption of winter wheat vegetation. The dry period in spring (2019) had a negative impact on winter wheat N uptake. In a year of normal moisture content (2020), PS and LD fertilizers and the fertilizer application of the previous year (2019) significantly increased the N-NO3 content in the topsoil, while all applied fertilizers increased it in the deeper soil layer (by a factor of between 3.6 and 12.3), compared to unfertilized soil.
1. Introduction
Agriculture in Lithuania is one of the important sectors of the country’s economy and income for rural areas. The gross domestic product (GDP) share of agriculture in Lithuania for 2020 was 3.29% (the GDP average based on Eurozone 19 countries was 1.93%) [1]. Intensive cereal–rapeseed production farms predominate, given the rational use of natural and human resources. Wheat accounts for more than 90% of all grain purchased [2]. Winter wheat production is twice as high as for other crops. As a result, the lack of good preceding crops means that it is often necessary to monocrop. Failure to comply to phytosanitary intervals increases the use of pesticides. Farmers are using increasingly high rates of nitrogen (N) fertilizer to avoid yield losses. However, the yields are not increasing. Meanwhile, the efficiency of synthetic N fertilizers is declining worldwide, with only 47% of mineral N fertilizer being converted into products [3]. This shows that large amounts of N are being lost and pose a risk to air, water, soil and biodiversity [4,5]. The overuse of N, high accumulation of soil mineral nitrogen (SMN) and low efficiency of N use are problems of the current intensive winter wheat production system [6]. Farms with a high proportion of winter wheat in the crop structure face problems related to yields being affected by adverse climatic conditions [7] and incomes reduced by price decreases.
The future climate will remain favourable for wheat production, but yield variability will increase due to predicted extreme weather events and the long-term effects of climate change [8]. Fertilizer efficiency has been found to be affected by relative/absolute water scarcity and the limited availability of nutrients (especially N). Recurrent dry periods and high average daily temperatures increase evaporation from soil, especially in spring and early summer. Increased temperatures in a changing climate extend the growing season without plants. This promotes microbial mineralisation of the soil biomass, increasing nitrogen in the late autumn-winter-early spring period [9]. High and unevenly distributed rainfall reduces the number of air-filled soil pores and the availability of nutrients, and increases the leaching of nitrogen outside of the growing season.
The EU’s restrictions on mineral fertilizer application (Farm to Fork strategy) could reduce cereal yields and quality. It is therefore necessary to find ways to increase the efficiency of nitrogen fertilization. Innovative crop production and fertilizer technologies should be introduced to avoid a decline in agricultural production. Adequate nitrogen supply can meet crop needs and reduce environmental impacts [10]. As an increasing focus on the interaction between sustainable economic development, sustainable farming and the natural environment (European Green Deal) has recently gained significant attention.
The intensification of agricultural production does not sufficiently contribute to the biological capacity to regenerate and to promote the application of bioeconomy and the latest bioenergy developments in agriculture. Livestock slurry and various digestates are used throughout Europe as valuable organic fertilizers [11]. Anaerobic digestate (LD), a by-product of biogas production resulting from the anaerobic digestion of animal waste and crop residues, has the potential to substitute for mineral fertilizers and the use of bioactive products to reduce the consumption of mineral fertilizers. As a cheap source of organic matter and plant nutrients, it can improve soil and crop yields [12]. It has been found that organic fertilizers can be an effective way to reduce nitrogen losses compared to mineral fertilizers by using the same N amounts [13], however, yields may not always differ significantly [13,14]. Studies in Germany show that fertilization regimes with high shares of organic fertilizers produce higher nitrogen surpluses in soil [15]. The effect of organic fertilizers is stable compared to that of mineral fertilizers, therefore, the beneficial effects of these fertilizers on soil and plants are felt for several years [16]. Digestate is considered an alternative source of nutrients for crops in sustainable agriculture. Organic fertilizers, which include organic carbon, plant nutrients and bioactive substances, contribute to improving plant nutrition, yield and stability. This allows farmers to reduce the additional use of bioactive products and energy inputs [17].
The availability of nutrients (especially N) and potential losses from liquid organic fertilizers vary between soils with different texture, water and nutrient regimes. They are influenced by soil nutrient migration, transformation, and sorption processes, which act in complex ways to alter the mobility of nutrients in soil and the ability of plants to take up nutrients [18]. The aim of this study was to determine the influence of liquid organic fertilizers: anaerobic digestate, pig slurry and ammonium nitrate on the variation of mineral N forms in clay loam Cambisol and nitrogen accumulation in winter wheat yield.
2. Materials and Methods
2.1. Experimental Site and Soil
The study was carried out at the Joniškelis Experimental Station of the Lithuanian Research Centre for Agriculture and Forestry, situated in the northern part of Central Lithuania’s lowland region (56°21′ N, 24°10′ E) during the period 2018–2020. The soil of the experimental site is Endocalcari–Endohypogleyic Cambisol (CMg-n-w-can), with a clay loam texture (27% clay, 50% silt, 23% sand). The topsoil (0–30 cm) pH was close to neutral (pHKCl 6.8), moderate in phosphorus (P2O5 141 mg kg−1), high in potassium (K2O 387 mg kg−1) and moderate in humus (28.1 g kg−1) and total nitrogen (Ntot 1.83 g kg−1). The experimental plots were laid out in a complete one-factor randomized block design with four replicates. The individual plot size was 75 m2 (15 × 5 m).
2.2. Experimental Design and Details
Winter wheat was fertilized after the resumption of spring vegetation on March 25, 2019 (I experiment) and on 24 March, 2020 (II experiment); at the BBCH 23–25 growth stage. Additional fertilization (N50) was performed during the grain growing stage BBCH 37. The experiments included seven fertilization treatments:
- Control (N0).
- N120 mineral fertilizer–ammonium nitrate (AN120).
- N120 pig slurry (PS120).
- N120 liquid anaerobic digestate (LD120).
- N120 ammonium nitrate and N50 ammonium nitrate (AN120 + 50).
- N120 pig slurry and N50 ammonium nitrate (PS120 + 50).
- N120 liquid anaerobic digestate and N50 ammonium nitrate (LD120 + 50).
In the autumn pre-sowing, complex mineral fertilizers N32P32K32 were applied to the experimental field. Fertilizer rates were chosen according to the status of soil available phosphorus and potassium. Ammonium nitrate was used for mineral fertilization. The nitrogen (N 344 g kg−1) composition in the fertilizer was 50% N-NH4 and 50% N-NO3. The liquid fertilizers were pig slurry and anaerobic digestate, obtained under the controlled biological decomposition of pig slurry and residues of agriculture crops. Both liquid fertilizers were based on ammonium. The 3,4-dimethylpyrazole phosphate (DMPP) base product Vizura® (BASF, Germany) was used as a nitrification inhibitor. It was mixed with liquid fertilizers at a rate of 2 L ha−1. A detailed nutrient composition of the applied fertilisers is provided in Table 1. A winter wheat cultivar, Patras, was sown at a rate of 4.5 million seeds ha−1. The preceding crop was winter wheat. For fertilization PK rates were chosen according to the status of soil available phosphorus and potassium, N used as 120 kg ha−1 rate. In the field experiment, the crops were grown according to conventional farming standards.
Table 1.
Characteristics of liquid organic fertilizers.
2.3. Composition of Organic Fertilizers
The pH of the organic fertilizers was measured by the potentiometric method immediately after the homogenization of the fresh sample (Table 1). Dry matter (DM) content, also named as total solids, was measured by drying to a constant weight at 105 °C in a forced-air oven. The organic carbon (Corg) content was determined in the same way as in soil samples (see above). Ammonium and nitrate nitrogen were analysed spectro-photometrically using LCK 302 and LCK 339 cuvette tests (DR3900, HACH Lange, Düsseldorf, Germany) by the standard procedure. Before the determination of total nitrogen, phosphorus and potassium, the samples were wet digested: for nitrogen and phosphorus, with sulphuric acid (H2SO4); and for potassium, with nitric acid (HNO3) plus hydrogen peroxide (H2O2). The content of Ntot was determined by the Kjeldahl method using a spectrophotometric measurement at 655 nm (UV/Vis Cary 50, Varian Inc., Palo Alto, CA, USA) of the blue colour compound formed by reaction with salicylate and hypochlorite ions in alkaline solution in the presence of sodium nitroferricyanide [19]. Total phosphorus concentrations were quantified spectrophotometrically by a colour reaction with ammonium molybdate vanadate reagent [20] at a wavelength of 430 nm (UV/Vis Cary 50, Varian Inc., Palo Alto, CA, USA). The total potassium content was determined by flame atomic absorption (AAnalyst 200, Perkin Elmer, Waltham, MA, USA) in accordance with the manufacturer’s instructions.
2.4. Soil and Plant Analyses
Soil samples for agrochemical characterisation were taken from the 0–30 cm soil layer prior the experiment installation. The content of humus was calculated using an organic carbon conversion factor of 1.72, while after wet combustion organic carbon was determined by a spectrophotometric measurement at 590 nm (UV/Vis Cary 50, Varian Inc., Palo Alto, CA, USA) with glucose as a standard [21]. The content of Ntot was determined after the wet digestion process with sulfuric acid (H2SO4) by the Kjeldahl method, using a spectrophotometric measuring procedure (UV/Vis Cary 50, Varian Inc., Palo Alto, CA, USA) at the 655 nm wavelength [19].
Soil samples for the analysis of soil nitrate (N-NO3) and ammonium (N-NH4) nitrogen concentrations (mg kg−1 of soil) were collected from the 0–30 and 30–60 cm soil layers three times during the experimental period: in spring before winter wheat growth resumed (BBCH 25) (Assessment 1); during vegetation (~one and a half months after fertilization, BBCH 34–35) (Assessment 2) and after harvest (Assessment 3) (Table 2). Five cores were randomly collected from each plot, crushed, and stored in a deep freezer (−18 °C) until analysis. The concentrations of nitrate (N-NO3) nitrogen were determined by the potentiometric method (CyberScan 2100, Eutech Instruments, Vernon Hills, IL, USA) in a 1% extract of KAl (SO4)2×12H2O (1:2.5, w:v), and ammonium (N-NH4) nitrogen using a spectrophotometric measurement (UV/Vis Cary 50, Varian Inc., Palo Alto, CA, USA) procedure at a wavelength of 655 nm in a 1M KCl extract (1:2.5, w:v). The content of soil mineral nitrogen (SMN) and its forms (kg ha−1) was calculated by multiplying the concentration by coefficients of 3.5 and 3.7 (for the 0–30 and 30–60 cm of soil layers, respectively). Soil mineral nitrogen content was calculated as the sum of N-NH4 and N-NO3. Change in soil mineral nitrogen (CSMN, kg ha−1) was calculated using the following formula:
CSMN = SMN (Assessment 3) − SMN (Assessment 2).
Table 2.
Dates of fertilization and soil sampling for soil mineral nitrogen (SMN).
All soil concentrations of elements and compounds are expressed on DM basis after samples were dried to a constant weight at 105 °C in a forced-air oven.
Winter wheat grain was harvested when most plants had reached the BBCH 87 stage. The straw and grain yields were measured by weighing. Samples (1 kg) were taken from each plot for the determination of DM content by drying for 24 h to a constant weight at 105 °C in a forced-air oven. All samples were dried and ground by an ultracentrifugal mill ZM 200 (Retch, Haan, Germany) using sieves of 1 mm mesh size. Grain and straw concentrations of N were evaluated in the sulphur acid digestates. Total nitrogen (N) was analysed using the Kjeldahl method using a spectrophotometric measuring procedure at the 655 nm wavelength [19] (UV/Vis Cary 50, Varian Inc., Palo Alto, CA, USA), as described previously. Data are expressed in g kg−1 on a DM basis. The nitrogen content accumulated in the winter wheat crop (NG+S) was calculated by summing the N stored in the winter wheat grain and straw yields according to the following formula:
where NGC and NSC are the N concentration in grain and straw in %, and YG and YS are the grain and straw yields in DM kg ha−1, respectively.
NG+S = (NGC ∗ YG)/100) + (NSC ∗ YS)/100)
All chemical analyses of soil, liquid fertilizers, wheat straw and grain were conducted at the Chemical Research Laboratory of the Institute of Agriculture, Lithuanian Research Centre for Agriculture and Forestry.
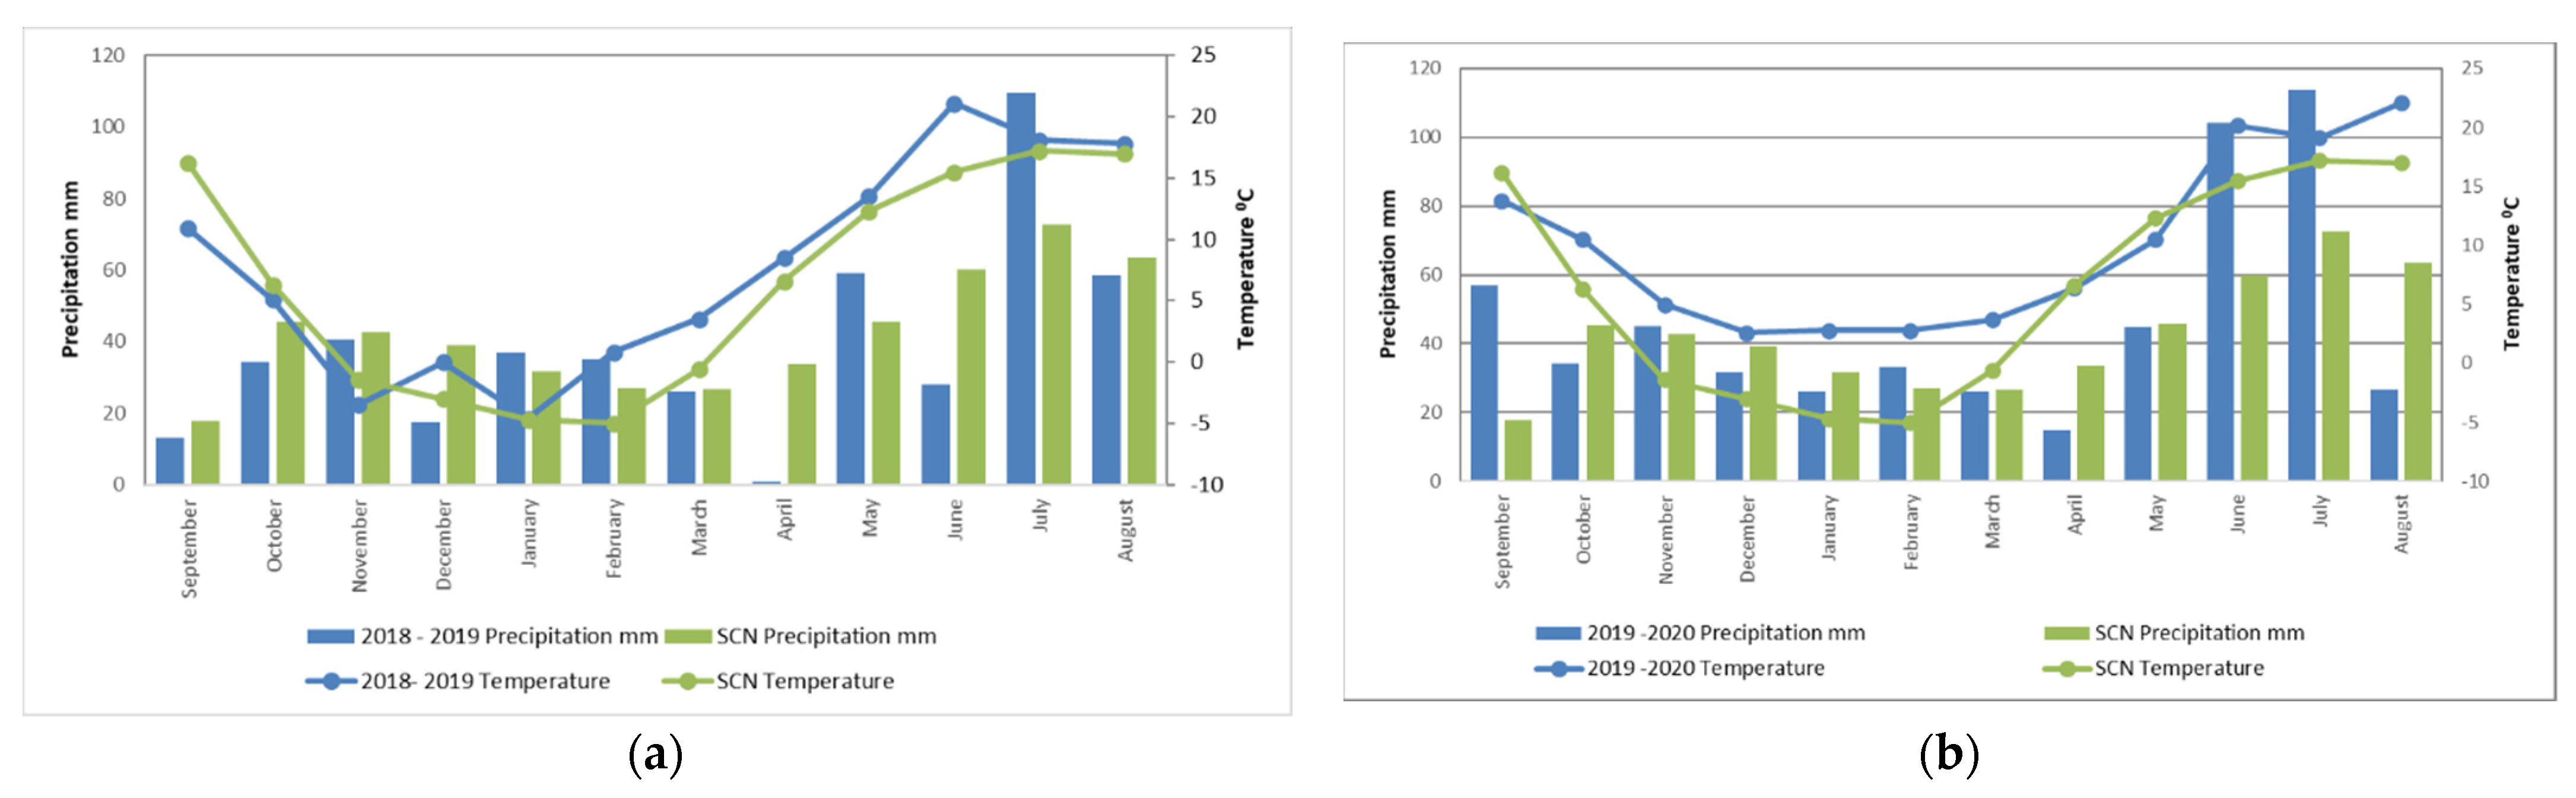
2.5. Meteorological Conditions
The weather data were obtained from the meteorological station located 0.5 km away from the experimental site (Figure 1). The weather in autumn of 2018 was slightly cooler and drier as compared to the standard climate norms (SCN). Conditions for seed germination and plant tillering were favorable. There were no significant deviations in temperature and precipitation during the winter season. April was an exceptionally dry month (with more abundant rainfall only at the end of May). During the summer season of 2018, the amount of precipitation was unevenly distributed, as June was drier and July was over-irrigated. The lack of humidity was exacerbated by a warm month of June when the average daily temperature was 5.6 °C warmer as compared to the SCN.
Figure 1.
Meteorogical conditions during the vegetative period of winter wheat, 2018–2019 (a) and 2019–2020 (b) at Joniškelis Experimental Station of the Lithuanian Research Centre for Agriculture and Forestry (SCN–standard climate norm).
In September of 2019, an excess rainfall resulted in the difficulty to sow winter wheat. However, a slightly drier and warmer October resulted in the good germination and tillering of winter wheat. The winter season was warm, with little rainfall and an absence of frost. In spring, the amount of precipitation was close to the SCN, except in April. As compared to the SCN, the month of May stood out as being cooler, while June and July were warm and rainy; excess precipitation amounted to 44.2 and 40.9 mm, repsectively, and was unevenly distributed.
2.6. Statistical Analysis
The research data are reported as average values of field replications and standard errors. The data were statistically processed with the SELEKCIJA software package [22]. Significant differences between the samples (Duncan’s test) were calculated according to one-way analysis of variance (ANOVA). The results with p ≤ 0.05 were considered significant. Interrelationships among nitrogen (or its forms) accumulation in soil, winter wheat yield and CSMN values during vegetation in separate years were estimated, and a simple linear regression was applied to the data.
3. Results
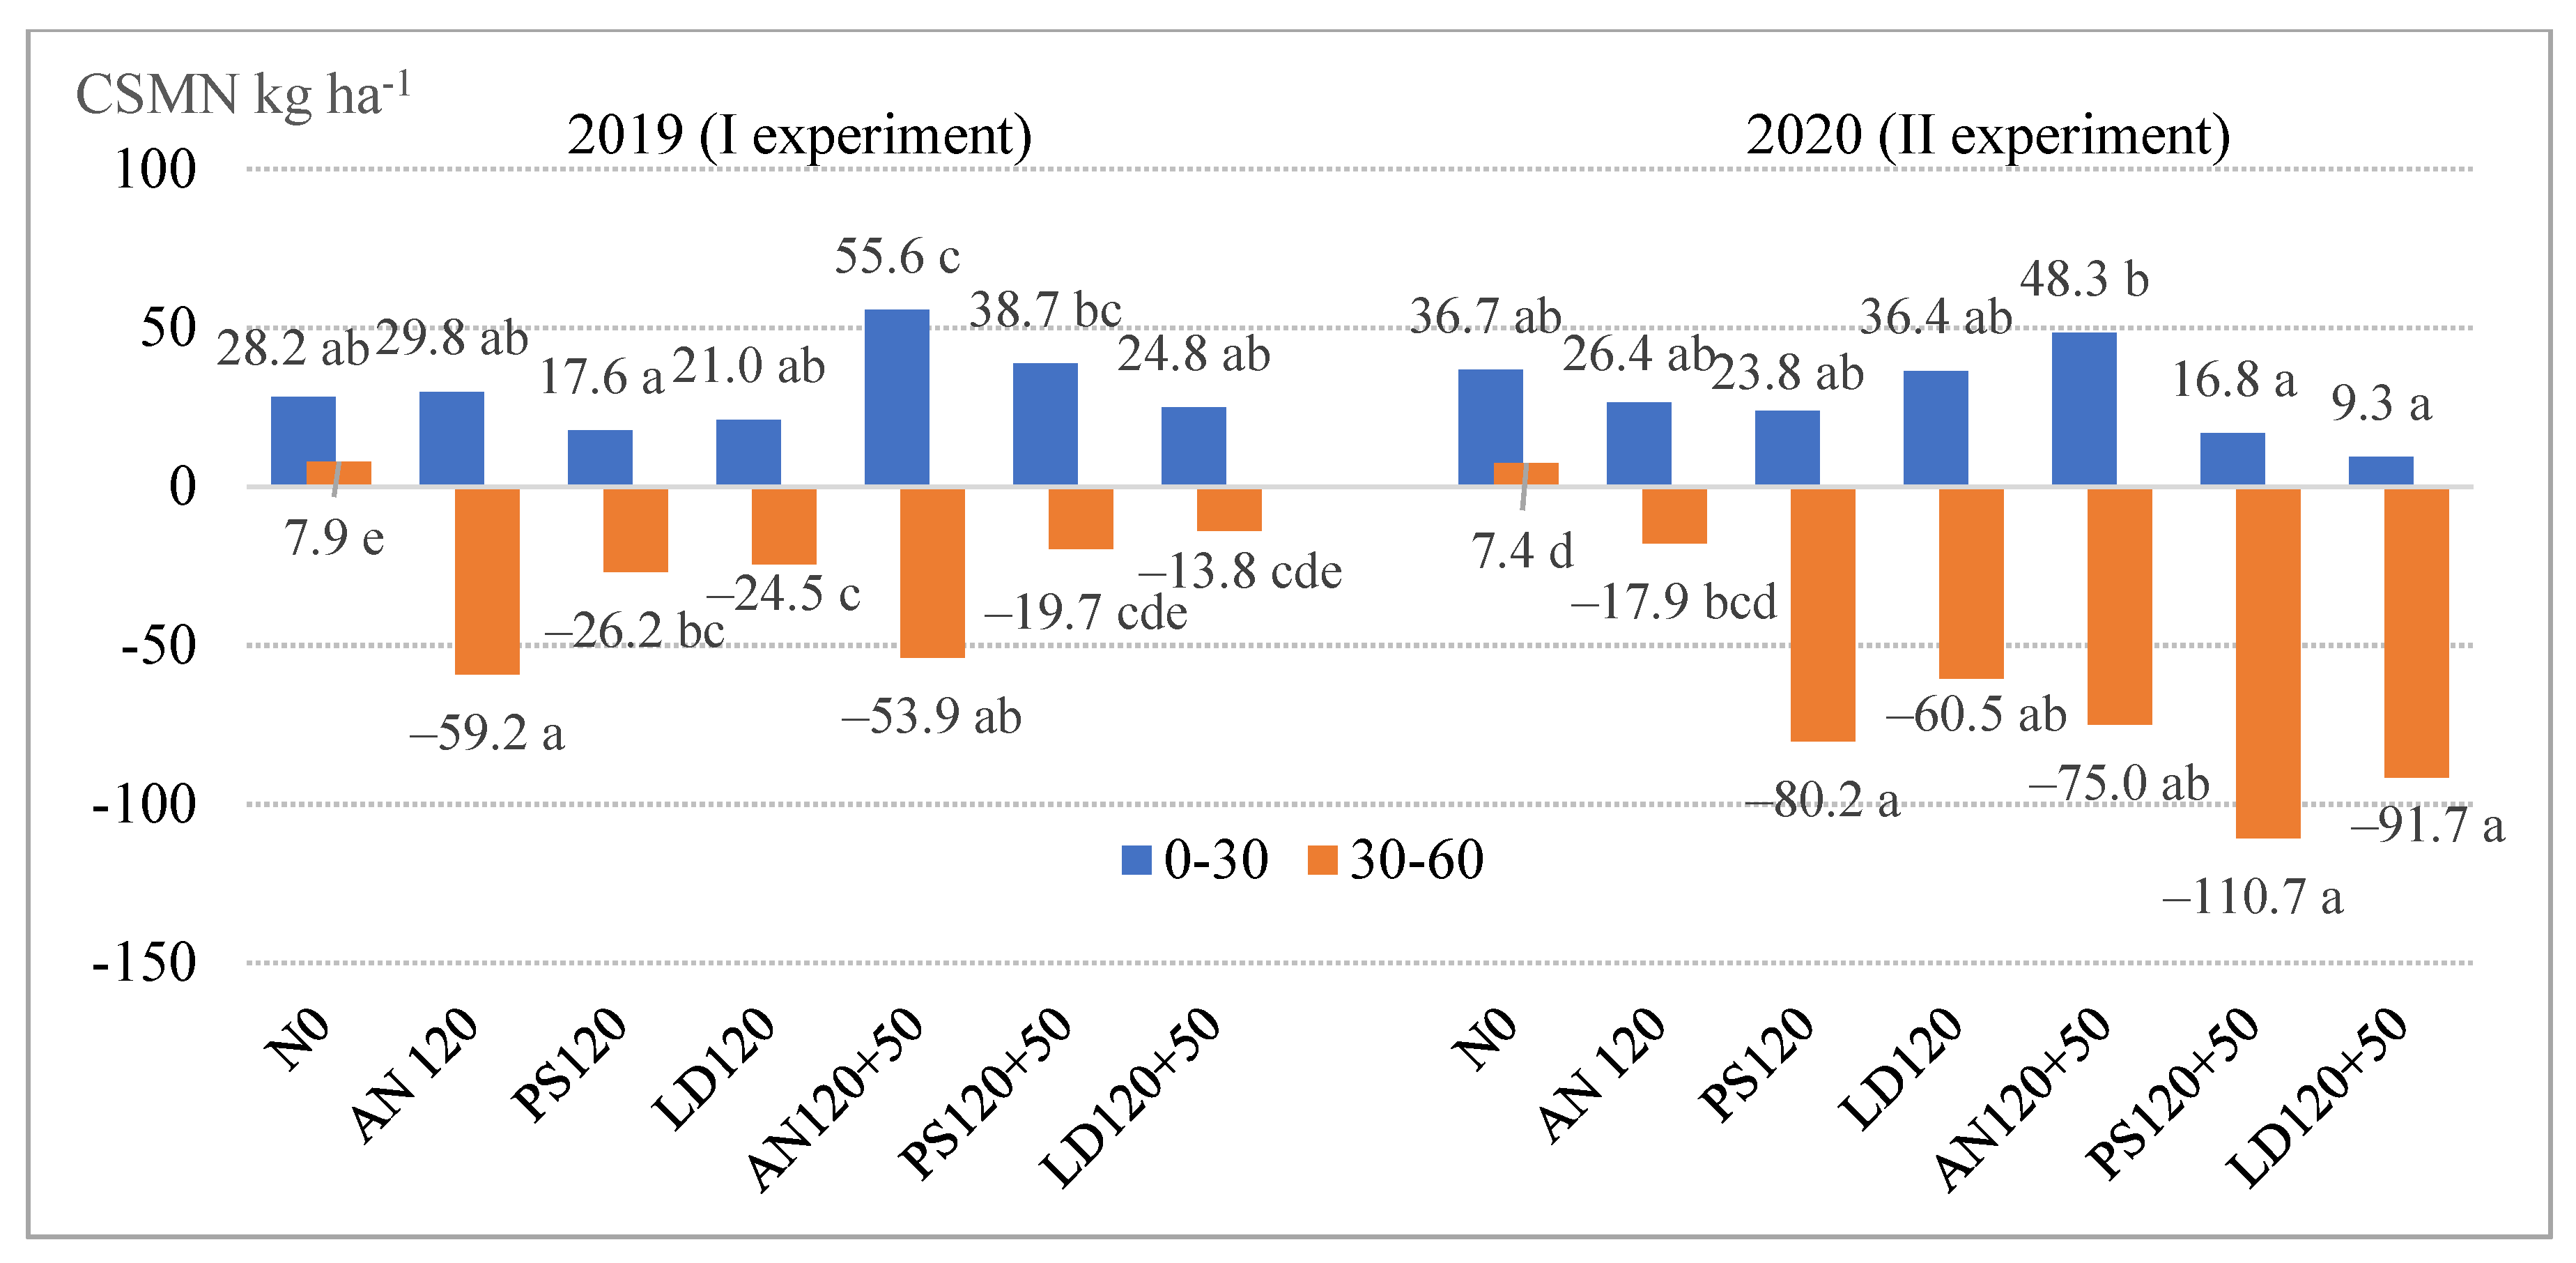
3.1. Soil Mineral Nitrogen Forms
In our study, SMN concentrations in pig slurry accounted for 80.6 and 70.7%, and were also lower in digestate concentrations, at 74.6 and 61.1% of the total N fertilizer (in 2019 and 2020, respectively) (Table 1). Almost all of fertilizer SMN was in the N-NH4 form. Differences between fertilizer N-NH4 concentrations were only presented in 2019, and they were higher in pig slurry (20.3%).
After the resumption of winter wheat vegetation. Before the installation of Experiment I (2019), NO3-N content was 17.0 kg ha−1 in the 0–30 cm soil layer and 1.8 times higher in the deeper layer (30–60 cm). The ammonium N content did not differ significantly between the two soil layers (Table 3). One year after Experiment I, winter wheat was grown again on the same area (Experiment II). The effect of the fertilizer applied in the previous year (2019) on the variation of SMN forms was determined after the resumption of winter wheat vegetation. The fertilizers AN120 and LD120 determined a significantly higher N-NO3 content in the 0–30 cm soil layer compared to the unfertilized soil layer. During the winter period, some N migrated into the deeper soil layer. Here, the differences between the treatments were more pronounced. N-NO3 content increased significantly (2.2 to 3.6-fold) in the deeper layer (30–60 cm), irrespective of the fertilizer form and N rate (except LD120), as compared to the unfertilized layer.
Table 3.
Nitrate and ammonium N variation in soil after the resumption of winter wheat vegetation before fertilizer application (Assessment 1).
At the beginning of vegetation in 2020, it was found that the application of organic fertilizers in the previous year (2019), combined with mineral nitrogen fertilizer application (PS120 + 50 and LD120 + 50), significantly increased N-NH4 content in both the top and deeper soil layers compared to the control. Mineral nitrogen fertilizer (AN120 + 50) alone significantly increased N-NH4 only in the deeper soil layer.
During vegetation of winter wheat. Following a period of 1.5 months after fertilizer application, N-NO3 levels increased in both experiments compared to pre-fertilizer data. In 2019 (Experiment I), a statistically significant NO3-N increase (0–30 cm) was obtained by fertilization with liquid organic and mineral N fertilizer compared to the unfertilized plot (Table 4). However, the highest N-NO3 content in both soil layers was obtained due to mineral N fertilizer. The crops fertilized with ammonium nitrate had significantly higher N-NO3 contents in the 30–60 cm soil layer (2.2 to 3.3 times) than those fertilized with PS and LD fertilizers.
Table 4.
Nitrate and ammonium N variation in soil during winter wheat vegetation (Assessment 2).
In 2020 (Experiment II), when winter wheat was grown again, most of N-NO3 was in the deeper soil layer. That fact was determined by several reasons, such as N uptake by the plants and the meteorological conditions of a dry April and the main May rainfall at the beginning of the month. A significantly higher N-NO3 content in the 0–30 cm soil layer was found in the PS120 + 50 and LD120 + 50 treatment plots, although no additional fertilization had yet been applied. That was likely the effect of the fertilizer applied in the previous year (2019). All fertilizers (except AN120) increased N-NO3 content significantly in the 30–60 cm soil layer (from 3.6 to 12.3 times) compared to the unfertilized field. The highest N-NO3 content, as in the top layer, remained in the plots with PS120 + 50 and LD120 + 50 treatments.
According to the data of 2019, the application of LD fertilizer in both the topsoil and deeper soil layers resulted in a significant increase in N-NH4 by a factor of 1.6 and 8.1, respectively, compared to the unfertilized plots. Mineral N fertilizers produced a significant N-NH4 increase only in the deeper soil layer. In 2020, no differences in N-NH4 content were found between the fertilizer applications. However, N-NH4 tended to increase where the highest N fertilizer rates had been applied in 2019.
After harvesting winter wheat. In 2019, significantly more N-NO3 was detected in the topsoil where mineral nitrogen fertilizer had been applied (1.8–2.4-fold) compared to the unfertilized plots and the ones fertilized with liquid organic fertilizers (Table 5). Excess rainfall and torrential rains in July led to a significant increase in N-NO3 (AN120 + 50) in the 30–60 cm soil layer of the plots fertilized with mineral nitrogen. The liquid fertilizers PS and LD did not have any significant effect on N-NO3 levels compared to the unfertilized plots. The results of the correlation analysis showed statistically significant strong, linear relationships between N-NO3 content (0–30 cm layer) after fertilization (Assessment 2) and N-NO3 content (0–30 cm layer) after crop harvesting (r = 0.75, p < 0.05). The deeper layer N-NO3 dependence relationship was also very strong (r = 0.82, p < 0.01). It is likely that, due to the dry period in spring, part of the mineral fertilizer N was not assimilated by the plants.
Table 5.
Nitrate and ammonium N variation in soil after winter wheat harvest (Assessment 3).
In 2020, the N-NO3 content observed in the topsoil was 9.2% lower than in 2019. There were no significant differences between the treatments. The lowest N-NO3 levels in the deeper soil layer were observed after the application of the PS and LD fertilizers (120 kg N ha−1), as in 2019. The increase in nitrate N in the deeper layer was determined by the additional fertilization with ammonium nitrate (+50 kg N ha−1). In structured and heavy-textured soils, N is used more efficiently from fertilizers applied in the early stages of the crop.
In 2019, a significantly higher N-NH4 content was found in the topsoil after the application of PS with additional fertilization (120 + 50 kg N ha−1), while in the other plots, only increasing trends were observed compared to the unfertilized plot (Table 4). The N-NH4 content was independent of fertilization in the deeper soil layer.
In 2020, the significant increase of N-NH4 in the deeper soil layer was determined by additional fertilization with ammonium nitrate (+50 kg N ha−1) compared to the unfertilized one (30–60 cm layer). An inverse linear relationship was found between the N-NH4 concentrations in the top and bottom soil layers (r = –0.67, p <0.05).
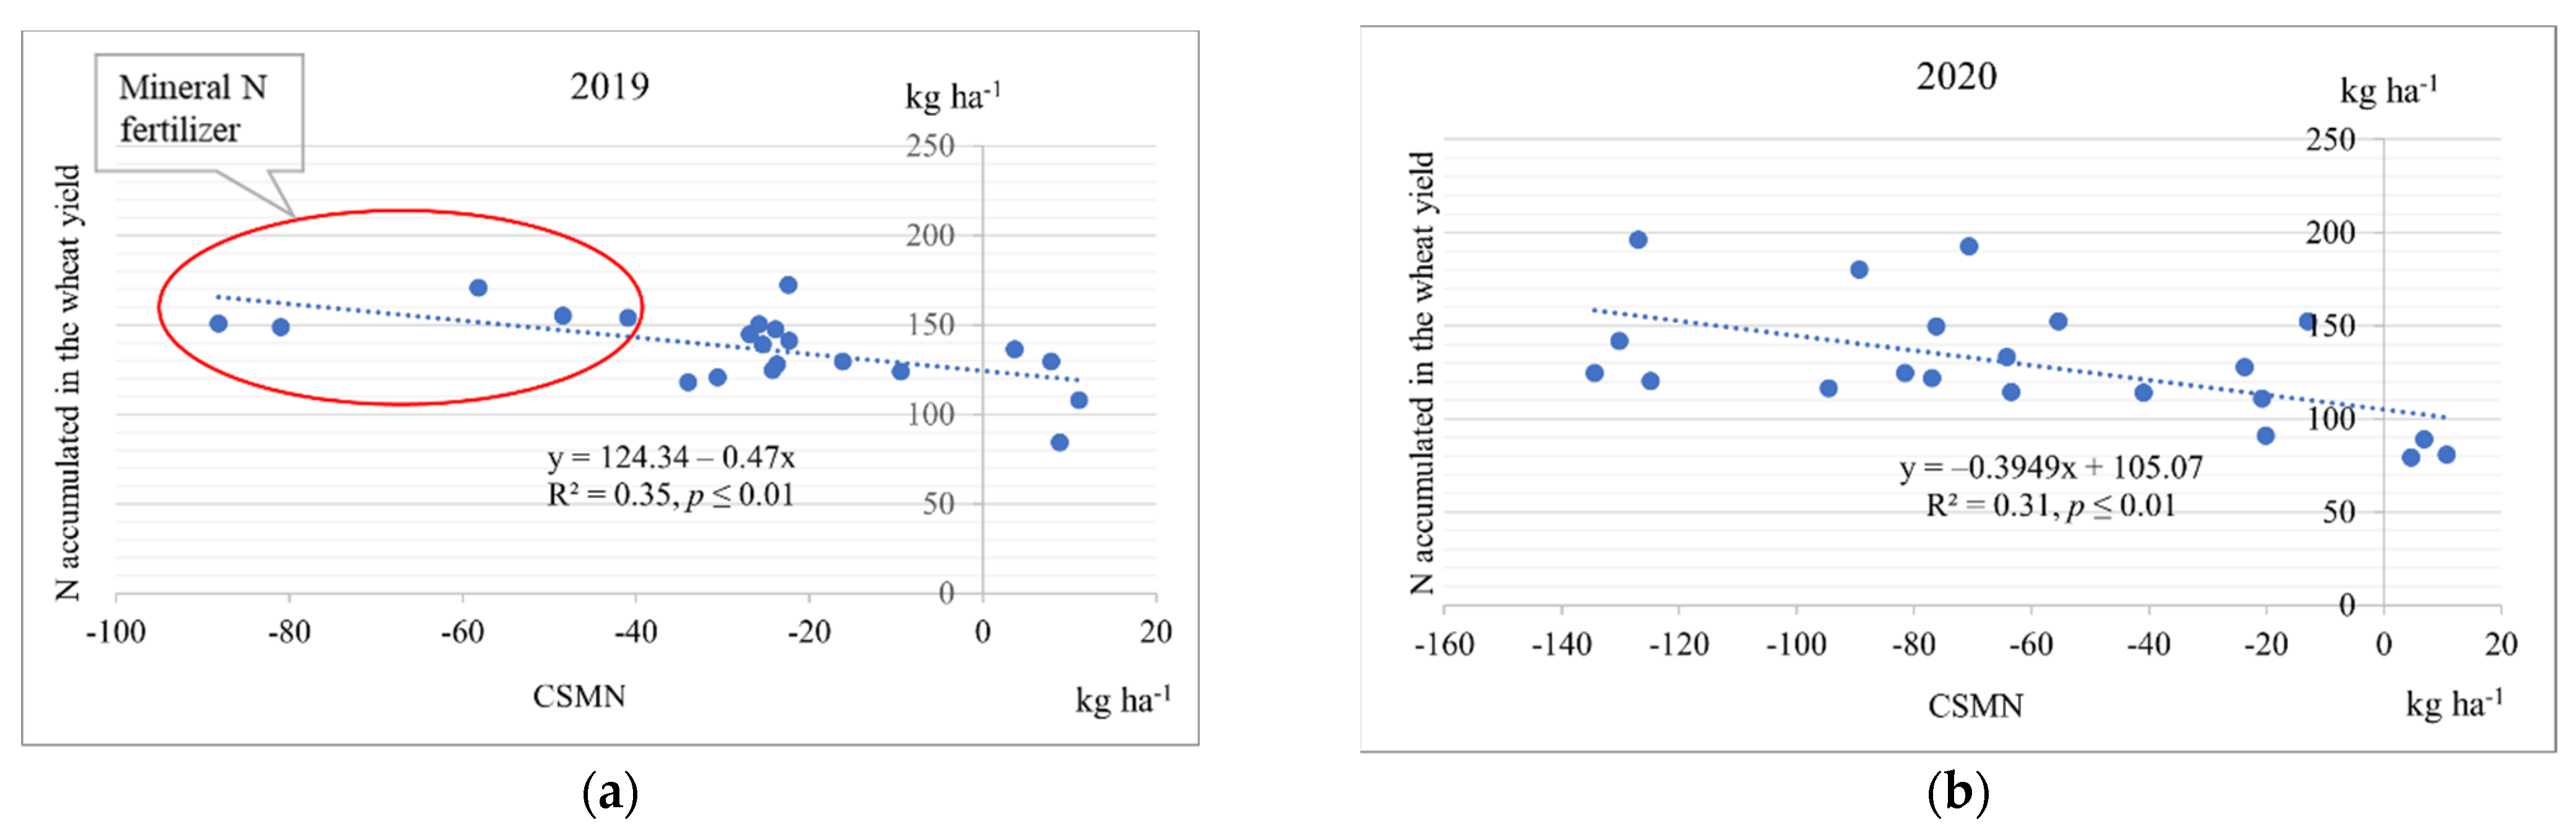
3.2. Nitrogen Uptake by Plants
Change in soil mineral nitrogen (CSMN) during wheat vegetation. During vegetation, CSMN (the difference between SMN Assessment 3 and SMN Assessment 2) was more influenced by N-NO3 than by N-NH4. According to the data of 2019, a positive CSMN was observed in the topsoil and a negative CSMN was found in the deeper soil layer (Figure 2). The application of mineral N fertilizer (120 + 50 kg N ha−1) resulted in a significant increase in CSMN of 27.4 kg ha−1, or a twofold increase, compared to the unfertilized plot. Only CSMN variation trends were observed in other plots. The greatest reduction in mineral N in the 30–60 cm soil layer (61.8–67.1 kg ha−1) was observed with mineral N fertilizer application. Significantly lower CSMN values (34.8 and 32.4 kg ha−1) were also found when the fields had been fertilized with liquid organic fertilizers (PS 120 and LD 120, respectively) compared to the unfertilized plot. However, the application of liquid organic fertilizer in combination with mineral N fertilizer resulted in smaller and insignificant variations in CSMN.
Figure 2.
Change in soil mineral nitrogen (CSMN) during wheat vegetation. (Fertilizers: AN—ammonium nitrate, PS—pig slurry, LD—liquid digestate; rates calculated by N—nitrogen; values followed by the same letter at separate year and depth are not significantly different at p ≤ 0.05.).
In 2020, the CSMN values in the topsoil did not differ significantly between the treatments. The CSMN in the deeper soil layer of the fertilized plots ranged from −60.5 to −110.7 kg ha−1 (except AN120) and differed significantly from the control plot. The highest negative CSMN values were found with the liquid organic fertilizer, PS and LD and the additional fertilization (120 + 50 kg N ha−1) compared to the unfertilized plot.
Nitrogen accumulation in winter wheat yields. In 2019, the N concentration in the winter wheat grain for all fertilization treatments increased significantly by 8.2–21.03% compared to the control (Table 6). The highest N concentrations were observed when the wheat had been fertilized with mineral N fertilizer at the beginning of vegetation, while the lowest one was observed when the wheat had been fertilized with liquid organic fertilizer (120 kg N ha−1) at the beginning of vegetation. In 2020, a significant increase in grain N concentration of 22.9–40.5% was obtained with two fertilization treatments (at the beginning of vegetation and additionally) compared to the unfertilized plot (irrespective of the type of fertilizer). The highest grain N concentration was obtained with liquid organic fertilizer at the beginning of vegetation and additional mineral N fertilizer application. Straw N concentrations also increased significantly in the mentioned treatments.
Table 6.
N accumulation in winter wheat yields.
In 2019, fertilization with 120 kg N ha−1 resulted in additional 13.2–43.9 kg N ha−1 and fertilization with 120 + 50 kg N ha−1 resulted in additional 29.0–54.5 kg N ha−1. The highest N accumulation in the winter wheat crop was obtained with mineral N fertilizers. Liquid organic fertilizers increased N accumulation in the wheat crop, but not significantly. The additional fertilization was less effective compared to the main fertilization.
In 2020, in the winter wheat growth using pig slurry (120 kg N ha−1), N accumulation increased in the wheat significantly compared to the unfertilized plot. There was no difference in terms of N accumulation in the yield between mineral N fertilizer and DL (120 kg N ha−1). The organic fertilizers PS, LD and additional mineral N fertilization increased N accumulation in the yield significantly (37.2 and 35.1%) compared to the corresponding organic fertilizers without additional fertilization. Totals of 51.8% (PS120 + 50) and 44.2% (LD120 + 50) of fertilizer N were applied for winter wheat yield.
According to the first experiment data, the N content accumulated in the yield (84.2–172.4 kg ha−1) increased with a decreasing value of the CSMN indicator, i.e., the SMN content used (+3.06–88.13 kg ha−1) (Figure 3a).
Figure 3.
Dependence of nitrogen accumulation in winter wheat yield on changes to soil mineral nitrogen (CSMN) values during vegetation 2019 (a) and 2020 (b).
The relationship was statistically significant, inverse and moderate. The data show that the dry period in spring resulted in a better uptake of mineral N fertilizer compared to PS and LD during the intensive growth of winter wheat biomass. The limited N uptake from liquid organic fertilizers may have been determined by the disturbance to soil microbial activity (during the mentioned period). According to the data of Experiment II, the N content accumulated in the crops varied between 79.4 and 196.1 kg ha−1 as the CSMN values varied between +4.66 and –134.42 kg ha−1. The correlation between these parameters is described by a moderate inverse linear equation (Figure 3b). Due to a wider data distribution, the advantage of a certain fertilizer type was not apparent. However, organic fertilizer applied in combination with mineral N fertilizer resulted in the greatest reduction in SMN and a higher N content in the yield.
4. Discussion
Depending on environmental conditions, N-NH4 is converted to N-NO3 [23] in soil. It has been reported that digestates differ from pig slurry in terms of ammonia content, pH and C/N ratio [3]. A number of studies have shown that digestate contain more mineralised plant-available nutrients compare to manure [11,24,25]. Our research confirms previous results, as the pig slurry in our experiment contained 19.4–29.3% and digestate 25.4–38.9% organic matter in total N (Table 1). Of course, the chemical composition of anaerobic digestates determines their influence on soil processes [26] and N emissions after application in the field [27].
The results of our study show that during the warmer and drier (compared to SCN) autumn-winter-spring period of 2019–2020, which is not typical for Lithuania, soil N-NO3 and N-NH4 contents decreased by 64.6 kg ha−1 (72.4%) and 4.2 kg ha−1 (23.3%), respectively (Table 3). Ploughing before repeated sowing of winter wheat and organic matter mineralisation increased SMN content and its migration to deeper soil layers during the non-growing season [28]. Part of the SMN was used for the decomposition of winter wheat straw when N had been immobilised in microbial biomass. According to Holub (2020), the use of stable forms of organic carbon reduces N leaching and improves N uptake [29]. Part of the SMN was absorbed by the wheat. However, N is not taken up from the deeper soil layers until wheat roots have formed [30]. The unusually warm winter was likely to have contributed to SMN losses. As N-NO3 is mobile, it is not absorbed by soil and is therefore more easily leached than N-NH4 [31]. Leaching is dependent on rainfall [29] and usually takes place outside the plant growing season [28].
In our research, April of 2019 was unusually dry and warm, with the maximum daily temperature (tmax) of 15.0–26.5 °C during the last ten-day period. It is known that wheat yields to be more affected by meteorological variables in spring (especially May) compared to other growing periods [32]. Testing soil nitrogen 1.5 months after fertilization, the highest N-NO3 contents were found when AN had been applied, especially in the deeper soil layers (Table 4). Liquid organic fertilizers resulted in a twofold lower N-NO3 content, compared to AN. However, digestate increased the N-NH4 contents. Other researchers have reported that the highest N-NH4 content was found at 15 °C, with a decrease at 20 °C due to nitrification and possibly more intensive evaporation of NH3 [33]. It has been suggested that the N-NH4 content in soil is dependent on fertilizer form and temperature, with negligible migration to the deeper soil layer [34], contrary to our study. In our study, the main N-NH4 content was found in the 30–60 cm soil layer. The chemical composition of anaerobic digestate, i.e., an increase in pH and N-NH4 concentration, promotes N loss through NH3 volatilization [27,35,36]. Most studies show that digestates reduce N2O emissions from soil compared to the original stock, however, this is determined by soil water content, soil type and soil organic matter content [27,37].
In 2020, when the weather conditions in April and May were close to SCN (average daily temperature of 6.4 and 10.5 °C and precipitation of 14.9 and 44.8 mm, respectively), the nitrification processes after 1.5 months after fertilization were intense. During winter wheat vegetation, the highest N-NO3 contents were observed after the application of liquid organic fertilizers. A higher N-NO3 content was observed in the plots with AN120 + 50, PS120 + 50 and LD120 + 50, where no additional N fertilizer had been applied (+50). That could be explained by the remineralisation of immobilised N (from wheat straw decomposition in 2019). In addition, organic compounds in liquid organic fertilizers stimulated soil biological activity, partially immobilising inorganic N [38,39].
In the unfavourable year 2019, after wheat harvesting, there were apparent N losses from liquid organic fertilizers in the heavy-textured soils. Microbial nitrification and denitrification processes are responsible for N oxide (N2O) and GHG (greenhouse gas) losses. According to Kudeyarov [37], N2O emissions depend on a number of factors, including soil and climatic conditions, type of mineral fertilizer, organic additives and N-containing wastes. Therefore, liquid organic fertilizers are recommended for incorporation into soil [27]. The additional post-harvest application of mineral N fertilizer (BBCH37–39) to winter wheat in 2020 increased SMN contents in the soil. The repeated torrential rains in July increased its migration into the deeper soil layer. A high compensatory capacity of the yield components of modern varieties makes it possible to apply N fertilizer either once or twice [40]. SMN content in soil after harvesting depends also on the rate of the N fertilizer applied before. Fertilization with high rates of N fertilizer (180–240 kg N ha−1) leaves a large content of N unabsorbed by plants in the soil (0–60 cm) after harvesting [41]. High SMN levels accelerate the decomposition of light carbon fractions and further stabilise more difficult to decompose soil carbon compounds [42,43]. Reduced rainfall and drought can alter the decomposition processes of post-harvest residues and lead to N losses [44]. Yergeau et al. [45] suggest that a quantitative and qualitative assessment of the soil microbiome could explain many of the quantitative and qualitative parameters of winter wheat.
It is known that the N fertilizer rate plays a key role [3,14,46,47]. According to other researchers, the highest nitrogen uptake efficiency was obtained with 150 kg N ha−1 [14]. The results obtained in Latvia show that winter wheat grain yield depended on variety and pedoclimatic conditions, while the effect of nitrogen fertilizer was low. Identifying N fertilizer rates should take into account N requirements for winter wheat, available mineralised soil N and straw N, while at the same time expecting that the environmental impact will be reduced [48,49]. An environmentally safe fertilizer rate is 120 kg N ha−1 [41]. Other researchers have shown that reducing the N fertilizer rate by one third provided an efficient use of N, however, it reduced grain quality [50]. Liquid organic fertilizers increase N use efficiency while providing other nutrients to the plants [14]. Other researchers reported that N concentrations in grain increased and then decreased with increasing fertilizer application or decreasing irrigation. Grain yield and grain N concentration show a positive correlation [51]. Studies show the importance of random variations in the growing environment of plants and their response to fertilizer application and N efficiency [52]. Increasing fertilizer application increases susceptibility to drought stress [53].
In a changing climate, the frequency and severity of adverse weather events are considered a major threat to wheat production [8]. Precipitation, relative humidity, sunshine and air temperature have been found to have the greatest impact on grain yield [32]. Rainfall amounts directly influence nutrient cycling, transformation in soil and availability to plants [54]. Prolonged water stress reduces leaf surface area and photosynthetic efficiency and accelerates leaf senescence [55]. Short-term droughts slow down wheat production [8] and reduce yields. Low water deficit and adequate fertilization improve NPK uptake by grain and productivity [51]. Adequate N supply can meet the needs of plants [49] and produce high yields with high quality, while ensuring economic profit and minimising environmental risks [14]. Möller and Müller [55] argue that anaerobic digestates do not guarantee better N uptake but increase the total amount of organic matter in the farming system, resulting in an increase in N use efficiency.
5. Conclusions
After the resumption of winter wheat vegetation in clay loam Cambisol, the positive effect of fertilizers (applied the year before) on the N-NO3 content in soil was found. During the dry vegetation of winter wheat (2019), only mineral N fertilizer determined significantly higher N-NO3 contents in both (0–30 and 30–60 cm) soil layers. All fertilizers increased the N-NH4 in the deeper soil layer. The liquid organic fertilizers, pig slurry (PS) and digestate (LD), were effective in a favourable year (2020) for wheat growth. A significant increase of N-NO3 (from 3.6 to 12.3 times) was observed in the deeper soil layer of the fertilized plots compared to the unfertilized plot.
After the winter wheat harvest, the residual mineral N content in the soil depended on meteorological conditions and fertilizer efficiency. Additional fertilization (+50 kg N ha−1) could increase the amount of nitrogen not used by the plants.
During both experimental years, positive change in soil mineral nitrogen (CSMN) values were found in the topsoil and negative values were found in the deeper layer. The highest negative CSMN value in 2019 was observed while applying mineral N fertilizer, and in 2020 the highest negative CSMN value was observed while applying liquid organic fertilizer and additional fertilization with mineral N fertilizer. The winter wheat fertilized with PS fertilizer consumed the highest amount of SMN. In both experimental years, a statistically significant, inverse and moderate relationship was found between CSMN values and N accumulation in winter wheat yields in clay loam Cambisol.
Author Contributions
Conceptualization, A.A.; methodology, D.P., A.A. and J.C.; software, D.P.; validation, D.P., A.A. and J.C.; formal analysis, D.P.; investigation, D.P.; resources, J.C.; data curation, D.P., A.A. and J.C.; writing—original draft preparation, D.P., A.A. and J.C.; writing—review and editing, D.P., A.A. and J.C.; visualization, D.P. and A.A.; supervision, A.A. and J.C.; project administration, J.C.; funding acquisition, D.P. All authors have read and agreed to the published version of the manuscript.
Funding
This research was part of the long-term program ‘Biopotential and quality of plants for multifunctional use’ implemented by the Lithuanian Research Centre for Agriculture and Forestry.
Institutional Review Board Statement
Not applicable.
Informed Consent Statement
Not applicable.
Data Availability Statement
Our institution does not have a data collection database.
Acknowledgments
We acknowledge the technical personnel and other contributors for support in fieldworks and laboratory analyses.
Conflicts of Interest
The authors declare no conflict of interest.
References
- GDP Share of Agriculture in the European Union. Available online: https://www.theglobaleconomy.com/rankings/share_of_agriculture/European-union/ (accessed on 31 January 2022).
- Lietuvos Socialinių Mokslų Centro Ekonomikos Ir Kaimo Vystymo Institutas. Available online: https://www.laei.lt/?mt=leidiniai&straipsnis=1817&metai=2020 (accessed on 1 September 2021).
- Ladha, J.K.; Tirol-Padre, A.; Reddy, C.K.; Cassman, K.G.; Verma, S.; Powlson, D.S.; Van Kessel, C.; De Richter, D.B.; Chakraborty, D.; Pathak, H. Global nitrogen budgets in cereals: A 50-year assessment for maize, rice, and wheat production systems. Sci. Rep. 2016, 6, 19355. [Google Scholar] [CrossRef] [PubMed] [Green Version]
- Godinot, O.; Carof, M.; Vertès, F.; Leterme, P. SyNE: An improved indicator to assess nitrogen efficiency of farming systems. Agric. Syst. 2014, 127, 41–52. [Google Scholar] [CrossRef] [Green Version]
- Lassaletta, L.; Billen, G.; Grizzetti, B.; Anglade, J.; Garnier, J. 50 year trends in nitrogen use efficiency of world cropping systems: The relationship between yield and nitrogen input to cropland. Environ. Res. Lett. 2014, 9, 105011. [Google Scholar] [CrossRef]
- Dobers, E.S. Anpassungsbedarf bei der Nährstoffversorgung. In Kühlen Kopf Bewahren—Anpassung der Landwirtschaft an den Klimawandel; KTBL Kuratorium für Technik u. Bauwesen i. d. Landwirtschaft e.V.: Darmstadt, Germany, 2019; pp. 75–89. [Google Scholar]
- Esaulko, A.N.; Pismennaya, E.V.; Azarova, M.Y. Effect of weather and climatic conditions on the yield of winter wheat cultivated using No-Till technology. IOP Conf. Ser. Earth Environ. Sci. 2021, 839, 022010. [Google Scholar] [CrossRef]
- Harkness, C.; Semenov, M.A.; Areal, F.; Senapati, N.; Trnka, M.; Balek, J.; Bishop, J. Adverse weather conditions for UK wheat production under climate change. Agric. For. Meteorol. 2020, 282–283, 107862. [Google Scholar] [CrossRef]
- Haberle, J.; Kusá, H.; Svoboda, P.; Klír, J. The changes of soil mineral nitrogen observed on farms between autumn and spring and modelled with a simple leaching equation. Soil Water Res. 2009, 4, 159–167. [Google Scholar] [CrossRef] [Green Version]
- Artyszak, A.; Gozdowski, D. Is It Possible to Maintain the Quantity and Quality of Winter Wheat Grain by Replacing Part of the Mineral Nitrogen Dose by Growth Activators and Plant Growth-Promoting Rhizobacteria (PGPR)? Sustainability 2021, 13, 5834. [Google Scholar] [CrossRef]
- Insam, H.; Gómez-Brandón, M.; Ascher, J. Manure-based biogas fermentation residues—Friend or foe of soil fertility? Soil Biol. Biochem. 2015, 84, 1–14. [Google Scholar] [CrossRef]
- Xu, W.; Zhu, Y.; Wang, X.; Ji, L.; Wang, H.; Yao, L.; Lin, C. The effect of biogas slurry application on biomass production and forage quality of lolium multiflorum. Sustainability 2021, 13, 3605. [Google Scholar] [CrossRef]
- Verdi, L.; Kuikman, P.J.; Orlandini, S.; Mancini, M.; Napoli, M.; Dalla Marta, A. Does the use of digestate to replace mineral fertilizers have less emissions of N2O and NH3? Agric. For. Meteorol. 2019, 269–270, 112–118. [Google Scholar] [CrossRef]
- Tabak, M.; Lepiarczyk, A.; Filipek-Mazur, B.; Lisowska, A. Efficiency of nitrogen fertilization of winter wheat depending on sulfur fertilization. Agronomy 2020, 10, 1304. [Google Scholar] [CrossRef]
- Klages, S.; Heidecke, C.; Osterburg, B. The Impact of Agricultural Production and Policy on Water Quality during the Dry Year 2018, a Case Study from Germany. Water 2020, 12, 1519. [Google Scholar] [CrossRef]
- Cavalli, D.; Cabassi, G.; Borrelli, L.; Fuccella, R.; Degano, L.; Bechini, L.; Marino, P. Nitrogen fertiliser value of digested dairy cow slurry, its liquid and solid fractions, and of dairy cow slurry. Ital. J. Agron. 2014, 9, 71–78. [Google Scholar] [CrossRef]
- Bhowmik, A.; Fortuna, A.M.; Cihacek, L.J.; Bary, A.I.; Cogger, C.G. Use of biological indicators of soil health to estimate reactive nitrogen dynamics in long-term organic vegetable and pasture systems. Soil Biol. Biochem. 2016, 103, 308–319. [Google Scholar] [CrossRef] [Green Version]
- Berthrong, S.T.; Buckley, D.H.; Drinkwater, L.E. Agricultural Management and Labile Carbon Additions Affect Soil Microbial Community Structure and Interact with Carbon and Nitrogen Cycling. Microb. Ecol. 2013, 66, 158–170. [Google Scholar] [CrossRef] [PubMed] [Green Version]
- Sáez-Plaza, P.; Navas, M.J.; Wybraniec, S.; Michałowski, T.; Asuero, A.G. An Overview of the Kjeldahl Method of Nitrogen Determination. Part II. Sample Preparation, Working Scale, Instrumental Finish, and Quality Control. Crit. Rev. Anal. Chem. 2013, 43, 224–272. [Google Scholar] [CrossRef]
- Motsara, M.R.; Roy, R.N. Guide to Laboratory Establishment for Plant Nutrient Analysis; Food and Agriculture Organization of the United Nations: Rome, Italy, 2008; ISBN 9789251059814. [Google Scholar]
- Nikitin, B.A. A method for soil humus determination. Agric. Chem. 1999, 3, 156–158. [Google Scholar]
- Tarakanovas, P.; Raudonius, S. Agronominių Tyrimų Duomenų Statistinė Analizė Taikant Kompiuterines Programas ANOVA, STAT, SPLIT-PLOT from the Package SELEKCIJA and IRRISTAT; Lithuanian University of Agriculture: Akademija, Lithuania, 2003; p. 58. [Google Scholar]
- Barłóg, P.; Hlisnikovský, L.; Kunzová, E. Effect of Digestate on Soil Organic Carbon and Plant-Available Nutrient Content Compared to Cattle Slurry and Mineral Fertilization. Agronomy 2020, 10, 379. [Google Scholar] [CrossRef] [Green Version]
- Risberg, K.; Cederl, H.; Pell, M.; Arthurson, V.; Schnürer, A. Comparative characterization of digestate versus pig slurry and cow manure—Chemical composition and effects on soil microbial aktivity. Waste Manag. 2017, 61, 529–538. [Google Scholar] [CrossRef]
- Šimon, T.; Kunzová, E.; Friedlová, M. The effect of digestate, cattle slurry and mineral fertilization on the winter wheat yield and soil quality parameters. Plant, Soil Environ. 2015, 62, 522–527. [Google Scholar] [CrossRef] [Green Version]
- Brozyna, M.A.; Petersen, S.O.; Chirinda, N.; Olesen, J.E. Effects of grass-clover management and cover crops on nitrogen cycling and nitrous oxide emissions in a stockless organic crop rotation. Agric. Ecosyst. Environ. 2013, 181, 115–126. [Google Scholar] [CrossRef]
- Möller, K. Effects of anaerobic digestion on soil carbon and nitrogen turnover, N emissions, and soil biological activity. A review. Agron. Sustain. Dev. 2015, 35, 1021–1041. [Google Scholar] [CrossRef]
- Arlauskienė, A.; Gecaitė, V.; Toleikienė, M.; Šarūnaitė, L.; Kadžiulienė, Ž. Soil nitrate nitrogen content and grain yields of organically grown cereals as affected by a strip tillage and forage legume intercropping. Plants 2021, 10, 1453. [Google Scholar] [CrossRef] [PubMed]
- Holub, P.; Klem, K.; Tůma, I.; Vavříková, J.; Surá, K.; Veselá, B.; Urban, O.; Záhora, J. Application of organic carbon affects mineral nitrogen uptake by winter wheat and leaching in subsoil: Proximal sensing as a tool for agronomic practice. Sci. Total Environ. 2020, 717, 137058. [Google Scholar] [CrossRef]
- Watros, A.; Lipińska, H.; Lipiński, W.; Tkaczyk, P.; Krzyszczak, J.; Baranowski, P. Mineral nitrogen content in hydrographic areas of Poland depending on land use. Int. Agrophysics 2019, 33, 481–491. [Google Scholar] [CrossRef]
- Courty, P.E.; Smith, P.; Koegel, S.; Redecker, D.; Wipf, D. Inorganic Nitrogen Uptake and Transport in Beneficial Plant Root-Microbe Interactions. CRC. Crit. Rev. Plant Sci. 2015, 34, 4–16. [Google Scholar] [CrossRef]
- Faghih, H.; Behmanesh, J.; Rezaie, H.; Khalili, K. Climate and rainfed wheat yield. Theor. Appl. Climatol. 2021, 144, 13–24. [Google Scholar] [CrossRef]
- Dromantienė, R.; Pranckietienė, I.; Jodaugienė, D.; Paulauskienė, A. The influence of various forms of nitrogen fertilization and meteorological factors on nitrogen compounds in soil under laboratory conditions. Agronomy 2020, 10, 2011. [Google Scholar] [CrossRef]
- Smalstienė, V.; Pranckietienė, I.; Dromantienė, R.; Šidlauskas, G. Skirtingų azoto formų ir tręšimo laiko poveikis žieminiams kviečiams. Zemės Ūkio Mokslai 2017, 24, 81–90. [Google Scholar]
- Gericke, D.; Bornemann, L.; Kage, H.; Pacholski, A. Modelling ammonia losses after field application of biogas slurry in energy crop rotations. Water. Air. Soil Pollut. 2012, 223, 29–47. [Google Scholar] [CrossRef]
- Ni, P.; Lyu, T.; Sun, H.; Dong, R.; Wu, S. Liquid digestate recycled utilization in anaerobic digestion of pig manure: Effect on methane production, system stability and heavy metal mobilization. Energy 2017, 141, 1695–1704. [Google Scholar] [CrossRef] [Green Version]
- Kudeyarov, V.N. Nitrous Oxide Emission from Fertilized Soils: An Analytical Review. Eurasian Soil Sci. 2020, 53, 1396–1407. [Google Scholar] [CrossRef]
- Eickenscheidt, T.; Freibauer, A.; Heinichen, J.; Augustin, J.; Drösler, M. Short-term effects of biogas digestate and cattle slurry application on greenhouse gas emissions from high organic carbon grasslands. Biogeosciences Discuss. 2014, 11, 5765–5809. [Google Scholar] [CrossRef] [Green Version]
- Elste, B.; Tischer, S.; Christen, O. Einfluss von Biogasgärrückständen auf Abundanz und Biomasse von Lumbriciden. In Boden und Standortqualität-Bioindikation mit Regenwürmern; DBGPrints Repository: Osnabrück, Germany, 2010; Available online: https://eprints.dbges.de/id/eprint/491 (accessed on 1 September 2021).
- Makary, T.; Schulz, R.; Müller, T.; Pekrun, C. Simplified N fertilization strategies for winter wheat. Part 1: Plants: Compensation capacity of modern wheat varieties. Arch. Agron. Soil Sci. 2020, 66, 847–857. [Google Scholar] [CrossRef]
- Staugaitis, G.; Poškus, K.; Brazienė, Z.; Paltanavičius, V. Optimization of nitrogen fertilisation of winter wheat. Zemdirbyste 2021, 108, 203–208. [Google Scholar] [CrossRef]
- Neff, J.C.; Townsend, A.R.; Gleixner, G.; Lehman, S.J.; Turnbull, J.; Bowman, W.D. Variable effects of nitrogen additions on the stability and turnover of soil carbon. Nature 2002, 419, 915–917. [Google Scholar] [CrossRef]
- Potthoff, M.; Dyckmans, J.; Flessa, H.; Muhs, A.; Beese, F.; Joergensen, R.G. Dynamics of maize (Zea mays L.) leaf straw mineralization as affected by the presence of soil and the availability of nitrogen. Soil Biol. Biochem. 2005, 37, 1259–1266. [Google Scholar] [CrossRef]
- Mühlbachová, G.; Růžek, P.; Kusá, H.; Vavera, R.; Káš, M. Winter wheat straw decomposition under different nitrogen fertilizers. Agric. 2021, 11, 83. [Google Scholar] [CrossRef]
- Yergeau, É.; Quiza, L.; Tremblay, J. Microbial indicators are better predictors of wheat yield and quality than N fertilization. FEMS Microbiol. Ecol. 2020, 96, fiz205. [Google Scholar] [CrossRef]
- Pan, W.L.; Kidwell, K.K.; McCracken, V.A.; Bolton, R.P.; Allen, M. Economically Optimal Wheat Yield, Protein and Nitrogen Use Component Responses to Varying N Supply and Genotype. Front. Plant Sci. 2020, 10, 1790. [Google Scholar] [CrossRef]
- Hrivna, L.; Kotková, B.; Burešová, I. Effect of sulphur fertilization on yield and quality of wheat grain. Cereal Res. Commun. 2015, 43, 344–352. [Google Scholar] [CrossRef] [Green Version]
- Linina, A.; Ruza, A. The influence of cultivar, weather conditions and nitrogen fertilizer on winter wheat grain yield. Agron. Res. 2018, 16, 147–156. [Google Scholar] [CrossRef]
- Huang, S.; He, P.; Jia, L.; Ding, W.; Ullah, S.; Zhao, R.; Zhang, J.; Xu, X.; Liu, M.; Zhou, W. Improving nitrogen use efficiency and reducing environmental cost with long-term nutrient expert management in a summer maize-winter wheat rotation system. Soil Tillage Res. 2021, 213, 105117. [Google Scholar] [CrossRef]
- Mariem, S.B.; González-Torralba, J.; Collar, C.; Aranjuelo, I.; Morales, F. Durum wheat grain yield and quality under low and high nitrogen conditions: Insights into natural variation in low-and high-yielding genotypes. Plants 2020, 9, 1636. [Google Scholar] [CrossRef] [PubMed]
- Yan, S.; Wu, Y.; Fan, J.; Zhang, F.; Zheng, J.; Qiang, S.; Guo, J.; Xiang, Y.; Zou, H.; Wu, L. Dynamic change and accumulation of grain macronutrient (N, P and K) concentrations in winter wheat under different drip fertigation regimes. F. Crop. Res. 2020, 250, 107767. [Google Scholar] [CrossRef]
- Omara, P.; Aula, L.; Oyebiyi, F.B.; Eickhof, E.M.; Carpenter, J.; Raun, W.R. Biochar application in combination with inorganic nitrogen improves maize grain yield, nitrogen uptake, and use efficiency in Temperate Soils. Agronomy 2020, 10, 1241. [Google Scholar] [CrossRef]
- Heil, K.; Lehner, A.; Schmidhalter, U. Influence of climate conditions on the temporal development of wheat yields in a long-term experiment in an area with pleistocene loess. Climate 2020, 8, 100. [Google Scholar] [CrossRef]
- Jamieson, P.D.; Porter, J.R.; Goudriaan, J.; Ritchie, J.T.; Van Keulen, H.; Stol, W. A comparison of the models AFRCWHEAT2, CERES-Wheat, Sirius, SUCROS2 and SWHEAT with measurements from wheat grown under drought. F. Crop. Res. 1998, 55, 23–44. [Google Scholar] [CrossRef]
- Möller, K.; Müller, T. Effects of anaerobic digestion on digestate nutrient availability and crop growth: A review. Eng. Life Sci. 2012, 12, 242–257. [Google Scholar] [CrossRef]
Publisher’s Note: MDPI stays neutral with regard to jurisdictional claims in published maps and institutional affiliations. |
© 2022 by the authors. Licensee MDPI, Basel, Switzerland. This article is an open access article distributed under the terms and conditions of the Creative Commons Attribution (CC BY) license (https://creativecommons.org/licenses/by/4.0/).