Abstract
Alfalfa (Medicago sativa L.) is an important perennial legume forage that is cultivated in saline soil worldwide. This study aimed to clarify the effects of organic base fertilizer and inorganic topdressing on the productivity of alfalfa growing in saline soil. A three-year field study was conducted in which alfalfa was grown in the saline soil of the Huanghe River Delta with a control (no fertilizer) and three treatments: organic base fertilizer (Base), topdressing with urea fertilizer (Top), and combined base and topdressing fertilizers (BT). The productivity in the BT and Base treatments was 13.21 and 13.82 t·hm−2 in 3 years, significantly higher than that in the Top treatment and the control. The increased productivity in the BT and Base treatments were because organic matter promoted root growth of alfalfa seedlings in saline soil. The diversity of the soil bacterial community was not affected by the BT treatment, but the Base treatment increased the abundance of Acidobacteria, and the Top treatment increased the abundance of Gemmatimonadetes. Soil bacteria play an important role in improving the productivity of alfalfa growing in saline soil, and the mechanism by which soil microbes increase yield needs to be further studied.
1. Introduction
Alfalfa (Medicago sativa L.) is an important perennial legume forage that is widely grown around the world because of its high productivity and quality. In addition, alfalfa shows wide adaptability to various environmental conditions, and has the highest salt tolerance among legumes [1,2,3,4]. Consequently, alfalfa is largely cultivated in saline soils [5]. When alfalfa is cultivated in saline soils, the sodium (Na+) concentration increases in the shoot and plant growth is inhibited [6]. Salinity negatively affects alfalfa growth when the electrical conductivity of soil is above 2 dS·m−1, and alfalfa plants are particularly sensitive to salt stress at the germination and seedling stages [7,8,9]. Once successfully planted, the transpiration process of alfalfa changes, and the plants can effectively control and maintain the rootzone salinity at an acceptable level. The ability to control rootzone salinity is attributed to the high-yielding nature of the plant that allows it to remove large amounts of Na+ and Cl− ions, the strong root system that accesses deep soil moisture, the reduction in surface evaporation, and blocking of the pathway of salt particles in deep soil into the rootzone. Because alfalfa can fix atmospheric N, it can increase N inputs into ecosystems, while promoting carbon (C) and N accumulation in vegetation and soil [10,11], thereby increasing the soil organic matter content [12], Therefore, cultivation of alfalfa can improve the properties of saline soil.
Saline soil occupies more than 70% of the area of the Huanghe River delta because there is a shallow water table and seawater intrusion [13]. Salt stress can disrupt the ionic equilibrium of plants, causing excessive accumulation of Na+ and Cl− that lead to premature senescence of leaves [2,14]. Increased soil osmotic potential leads to water deficit, limited leaf area expansion and stomatal behavior, inhibition of photosynthesis, and stunted plant growth. In addition, ionic disequilibrium reduces the uptake of beneficial ions such as potassium, calcium, and manganese ions, resulting in poor mineral nutrition, and inhibition of photosynthesis and enzyme activities [15,16,17].
Organic matter improves the chemical, physiological, and biological properties of soil. The main components of soil organic matter are humin, humic acid, and fulvic acid. Organic fertilizer rich in organic matter has the effect of reducing plant stress, for example, application of seaweed extract resulted in a higher relative water content and proline content in alfalfa plants under salt stress. This extract also resulted in increased activities of catalase and superoxide dismutase, which led to reduced electrolyte leakage and increased shoot dry weight of alfalfa plants under salt stress [17]. Humic acid alleviates the effect of salinity stress in many plants [18,19], widely used in saline soil of the Huanghe River Delta to improve the soil structure and enhance the fertilizer utilization rate.
A challenge when explaining the response of soil microbes to soil salinity is that several other variables co-vary with salinity. Recently, Rath et al. identified specific bacterial taxa that can be used as bioindicators, in terms of their relative abundance, of salt stress [20]. In this study, we tested the effects of organic base fertilizer and inorganic topdressing (urea) on alfalfa productivity and the soil bacterial community structure in saline soil of the Huanghe River Delta in China and explored the relationships among alfalfa productivity, soil nutrients, and soil microbial composition. We addressed two questions: (1) do organic base fertilizer and inorganic topdressing reshape the composition and structure of the soil bacterial community; and (2) which bacteria are sensitive to organic base fertilizer and inorganic topdressing?
2. Materials and Methods
2.1. Experimental Site
The study was conducted at the Dongying Station (37°17′ N, 118°36′ E, 3 m above sea level), located at Agricultural High-tech Industrial Demonstration Area of the Yellow River Delta of Shandong Province, eastern China. This region has a semi-humid continental climate. From 1997 to 2016, the mean annual precipitation was 540 mm, and primarily distributed between May and September, the mean annual temperature was 13.9 °C and the mean maximum temperature in the hottest month (July) was 26.5 °C. The growing season was approximately 206 days long, from April to October (China Meteorological Data Service Centre, http://data.cma.cn/, accessed on 1 August 2018) The annual precipitation was 389.7 mm in 2014 and 566.7 mm in 2015. The precipitation in June 2015 was 42.6 mm, much lower than in June 2014 (82.7 mm) and June 2016 (117.3 mm). In 2016, the annual precipitation was 572.3 mm, with 415.5 mm precipitation falling between June and August. There was little variation in the annual temperature among the 3 years (Figure 1).
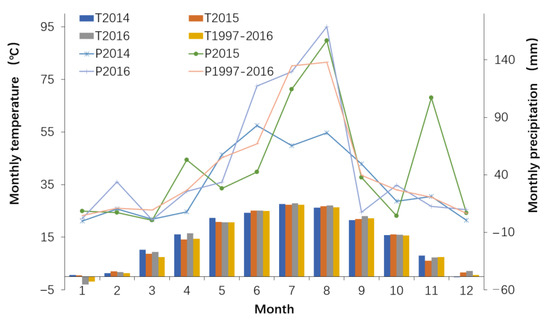
Figure 1.
Monthly precipitation and temperature distribution of experimental station from 2014 to 2016. T, mean annual temperature; P, mean annual precipitation.
The soil is a fluvo-aquic soil in the Chinese classification system and an Entisols in the US system, the underground water level is 2 m, the soil pH is higher than 8.5, and the total salt concentration in soil is approximately 3 g·kg−1, belongs to the moderately saline, and Cl− and Na+ account for more than 80% of salt-based ions [21,22].
2.2. Treatments and Experimental Design
In this study, there were three fertilization treatments: base fertilizer (Base), topdressing fertilizer (Top), and combined base fertilizer and topdressing fertilizer (BT), as well as a control (no fertilizer). The soil in the base treatment received a total 2250 kg·hm−2 humic acid organic fertilizer (organic matter content, 60%; N, 1.8%; P2O5, 4.6%), which was applied as base fertilizer and mixed with a top layer of 20 cm surface soil before sowing alfalfa, supplied by Tianjin Jitian Environment Co., Ltd. (Tianjin, China) The soil in the Top and BT treatments received urea (46% N) at an annual dose of 90 kg·hm−2, which was applied superficially to soil beginning in spring with a 20 mm irrigation for all the plots, in order to reduce ammonia volatilization (Table 1). The three treatments and control were arranged in a randomized complete block design and replicated three times. There was a total of 12 plots, each plot size was 10 m × 6.5 m (65 m2) and the spacing between plots was 50 cm.

Table 1.
Fertilizer type and nutrition content of different treatments (kg·hm−2).
Alfalfa seeds were sown by hand on 10 April 2014 in rows with between-row spacing of 25 cm and seeding depth of 1–2 cm. Prior to alfalfa green-up in the spring of each subsequent year, N was broadcast onto each plot at the same rate as in the sowing year. The alfalfa cultivar Lumu, obtained from the Shandong Academy of Agricultural Sciences, was used in this study.
2.3. Meteorological Data, Productivity Calculations, and Soil Properties
Details of precipitation and temperature from 2014 through 2016, and the long-term monthly average precipitation and temperature data were obtained from Dongying Ranch Meteorological Station located 30 km from the experimental site.
The above-ground net primary production (ANPP) was measured each year from 2014 to 2016. Alfalfa was harvested three times in the sowing year, beginning on 14 June, and four times each subsequent year, beginning in mid-May and then at 35- to 40-d harvest intervals that corresponded to approximately 10% of alfalfa bloom. Before harvesting, forage composition was determined in the field by hand by harvesting a 1 m × 1 m plot. The vegetation in the plot was cut to 5 cm residual height so that more than 90% of the biomass was collected. Three samples of approximately 250 g fresh forage were taken from each plot, oven-dried at 65 °C for 24 h to a constant weight, and weighed to obtain the dry matter yield.
The below-ground net primary production (BNPP) was measured in June and September of the sowing year. The roots and soil were dug out from a 50 m × 50 cm area per plot to 20 cm depth and separated into the root and soil components. The roots were washed gently with water, then oven-dried at 65 °C for 24 h to a constant weight and weighed to obtain the dry matter yield.
Soil samples of total 12 plots were collected after the last harvest in October 2016. In each plot, 10 randomly distributed soil cores (up to a depth of 30 cm and 3.2 cm in diameter) were taken with a sampling probe and pooled. Soil samples were sieved through a 2 mm mesh at the sampling site and separated into two parts. One part was used to determine soil moisture content (by weighing soil, oven drying at 105 °C for 48 h, and then reweighing), soil pH, and salt content. The other part was used to estimate soil available N (AN, the sum of extractable soil ammonium (NH4+-N) and nitrate (NO3−-N) concentrations), soil available P (AP), soil available K (AK), and soil organic matter (OM). The soil pH value was determined in a 1:2.5 soil-water suspension and salinity was determined in a 1:5 soil-water mixture using a Multiparameter Pocket Sensor (SKW500, Palintest, Tyne & Wear, UK). NH4+-N was extracted with 1 M KCl, NO3−-N was extracted with 1 M NH4Cl, soil available P was extracted with 0.5 M NaHCO3, soil available K was extracted with MgOAc, and all the parameters were determined with a complete Soil Kit (SKW500, Palintest). The extractable NH4+-N, NO3−-N, AP, and AK concentrations were converted to a dry mass basis using soil moisture data. The soil organic carbon (SOC) content was measured using an elemental analyzer (Vario TOC cube, Elementar, Hanau, Germany). The soil organic matter (OM) content was calculated from SOC, as follows: OM = 1.724 × SOC.
2.4. Collection of Soil Samples for Bacterial Community Analyses
Soil bacterial samples were collected in June 2016 after the second harvest. In each plot, five soil cores (up to a depth of 10 cm and 1.2 cm in diameter) were taken from randomly selected sites with a sampling probe and pooled. Each soil bacterial sample was sieved through a mesh of 1 mm at the sampling site and placed into a sterilized polyethylene bottle of 50 mL. The bottles were kept in an insulation box with liquid nitrogen for transportation to the laboratory and stored at −80 °C until DNA extraction.
2.5. DNA Extraction and PCR Amplification
Total soil DNA was extracted from 0.25 g soil using a PowerSoil DNA Isolation Kit (MO BIO Laboratories, Carlsbad, CA, USA), according to the manufacturer’s instructions. The concentration and purity of DNA were determined using a NanoDrop ND-1000 spectrophotometer (NanoDrop Technologies, Wilmington, DE, USA). The primer set 338F 5′-ACTCCTACGGGAGGCAGCAG-3′ and 806R 5′-GGACTACHVGGGTWTCTAAT-3′ was used amplify the V3–V4 region of the bacterial 16S rRNA gene. The PCR analyses were performed in triplicate with 25-µL mixtures containing 12.5 µL of 2×Taq PCR MasterMix, 3 µL BSA (2 ng/µL), 1 µL (5 µM) of each primer and 30 ng template DNA. The thermal cycling conditions were as follows: 95 °C for 5 min, followed by 28 cycles of 95 °C for 45 s, 55 °C for 50 s, and 72 °C for 45 s, with a final extension at 72 °C for 10 min, hold at 4 °C at the end of the cycle. After amplification, PCR products were detected on 2% (w/v) agarose gels, and the size of each amplicon was no smaller than 550 bp.
2.6. Illumina MiSeq Platform Sequencing
The PCR amplicons were extracted from 2% w/v agarose gels and purified using an AxyPrep DNA gel extraction kit (Axygen Biosciences, Union City, CA, USA), then quantified using QuantiFluor™-ST (Promega, Madison, WI, USA). The purified amplicons were pooled in equimolar amounts, and then paired-end sequenced (2 × 250) by the Allwegene Co., Ltd. (Beijing, China) using the MiSeq PE300 platform (Illumina, San Diego, CA, USA).
2.7. Gene Sequence Analysis
Raw reads were first demultiplexed and quality-filtered using USEARCH Version 8.1 [23]. This procedure eliminated sequences with fewer than three consecutive bases, those with quality scores lower than 20, and those with chimera. Then, the optimized reads were clustered into operational taxonomic units (OTUs) using UPARSE 7.1 at a threshold of 97% sequence similarity [24]. To compare the all samples at the same sequencing level, the minimum read number was used to compare subsamples of all sequences from all samples. The sequences were aligned against the SILVA database (http://www.arb-silva.de, accessed on 18 October 2016) and then identified at the phylum, class, order, family, and genus levels using the Ribosomal Database Project (RDP, http://rdp.cme.msu.edu/, accessed on 18 October 2016) Bayesian classifier at 70% threshold. On the basis of OTUs information, alpha diversity indices for community diversity (Shannon’s and Simpson’s), community richness (Sobs and Chao’s), and sequencing depth (Good’s Coverage) were calculated by Mothur (http://www.mothur.org/wiki, accessed on 28 October 2016). A heatmap was generated to show the relative abundance of OTUs using the Vegan Package in R 2.4 (https://cran.r-project.org/web/packages/vegan/, accessed on 29 October 2016). Column charts reflecting community structures were drawn using Microsoft Excel 2016. To detect potential biomarkers, the linear discriminant analysis (LDA) effect size (LEfSe) method (http://huttenhower.sph.harvard.edu/lefse/, accessed on 18 October 2016) was used based on a normalized relative abundance matrix. The LEfSe method uses the Kruskal–Wallis test to identify features with significant differences among different treatments and performs LDA to evaluate the effect size of each feature [25]. Biomarkers were detected with an LDA threshold score of 3.5 and a significant α value of 0.05. To compare the communities of functional genera among the four treatments, the sequencing dataset from each OTU was further mapped and classified according to the MiDAS database [26], and the functional genera were screened for comparison. Phylogenetic Investigation of Communities by Reconstruction of Unobserved States (PICRUSt) was used to predict main KEGG categories and functional enzymes in each community [27].
2.8. Statistical Analyses
Univariate analysis of variance (ANOVA) followed by least significant difference (LSD) test were used to detect significant differences in ANPP, BNPP, soil chemical properties, metabolic pathways, and functional enzymes, three fertilization treatments (Base, Top and BT) and control (no fertilizer) were treated as 4 factors. Bivariate correlation (2-tailed) analyses including Pearson’s correlation analysis were performed to explain the correlation between ANPP and BNPP in different years. Spearman’s correlation analyses were conducted to explore the relationship between the relative abundance of top 20 bacterial phylum and soil chemical properties/ANPP. All statistical analyses were performed using SPSS 19.0, with differences considered significant at p < 0.05.
3. Results and Analysis
3.1. Effect of Fertilizer Treatments on Soil Chemical Properties
The soil parameters were not strongly influenced by a short-term application of inorganic and organic fertilizers (Table 2). The soil pH was highest in the BT treatment (8.93) and lowest in the Base treatment (8.78). The OM was highest in the Top treatment (12.67 g·kg−1) and lowest in the BT treatment (11.90 g·kg−1. The AN was highest in the control (30.98 mg·kg−1) and lowest in the BT treatment (21.52 mg·kg−1). The AP was highest in the BT treatment (3.89 mg·kg−1) and lowest in the Base treatment (3.72 mg·kg−1). The AK was highest in the Top treatment (166.50 mg·kg−1) and lowest in the BT treatment (142.17 mg·kg−1).
Table 2.
Soil chemical properties in different treatments.
3.2. Effect of Fertilizer Treatments on ANPP and BNPP
In the BT treatment, the ANPP was 11.67, 16.50, and 13.30 t·hm−2 in 2014, 2015, and 2016, respectively, and the average yield across the 3-year field experiment was 13.82 t·hm−2, higher than that in the Top treatment (10.72 t·hm−2) and the control (10.21 t·hm−2). In the Base treatment, the ANPP was 10.20, 16.60, and 12.80 t·hm−2 in 2014, 2015, and 2016, respectively, and the average yield over the three-year field experiment was 13.21 t·hm−2, similar to that in the BT treatment. In the Top treatment, the ANPP was 9.27, 10.90, and 12.00 t·hm−2 in 2014, 2015, and 2016, respectively, and the average yield across the three-year experiment was 10.72 t·hm−2, similar to that in the control (Table 3).
Table 3.
Above-ground net primary production and below-ground net primary production in different treatments and the control from 2014 to 2016.
The ANPP in the BT treatment was 11.67 t·hm−2 in the sowing year, higher than that in the control. Significant differences in ANPP were detected in 2015, with 16.60 t·hm−2 in the Base treatment, which was 52.3% higher than that in the Top treatment and 45.2% higher than that in the control. There were no significant differences in ANPP among the treatments and control in 2016 (Table 3).
The BNPP in June of the sowing year was higher in the BT treatment (2.47 t·hm−2) than in the Top treatment (1.87 t·hm−2) and the control (1.67 t·hm−2) but did not differ significantly between the BT and Base treatments or between the Top treatment and the control. In the sowing year, the BNPP increased from 1.67–2.47 t·hm−2 in June to 3.08–4.22 t·hm−2 in September but did not differ significantly among the three treatments and the control in September (Table 3).
The BNPP in June of the sowing year was significantly correlated with yield in 2014, yield in 2015, and total yield (Pearson’s correlation coefficients of 0.655, 0.796 and 0.753, respectively). There was no significant relationship between BNPP in September of the sowing year and ANPP (Table 4).
Table 4.
Relationships between above-ground net primary production and below-ground net primary production.
3.3. Bacterial Community Composition and Structure
The 16S bacterial raw reads were obtained from 12 soil samples (4 treatments × 3 replicates). After quality-filtering steps and the removal of singletons, doubletons, and tripletons, 134,592 bacterial high-quality reads were recovered. Sequences were clustered into 5091 bacterial OTUs. The number of raw sequence reads per sample ranged from 11,869 to 32,757, and the lowest number (11,869) was used to compare subsamples at the same sequencing level.
Bacterial sequences were affiliated to 41 phyla, 95 classes, 195 orders, 393 families, and 761 genera. Proteobacteria was the most abundant phylum, accounting for approximately 35.2% of the reads across all samples (1472 OTUs), followed by Actinobacteria (16.2% of reads; 452 OTUs), Acidobacteria (15.4% of reads; 417 OTUs), Chloroflexi (8.5% of reads; 550 OTUs), Bacteroidetes (6.4% of reads; 421 OTUs), and Gemmatimonadetes (6.1% of reads; 291 OTUs). The phyla accounting for smaller proportions of total reads included Planctomycetes (2.0% of reads; 404 OTUs), Tectomicrobia (2.0% of reads; 27 OTUs), Firmicutes (1.6% of reads; 189 OTUs), Verrucomicrobia (1.6% of reads; 203 OTUs), Nitrospirae (1.0% of reads; 25 OTUs), Saccharibacteria (1.0% of reads; 138 OTUs), Cyanobacteria (0.9% of reads; 101 OTUs). There were no significant differences in bacterial diversity (p = 0.22, Shannon’s index) and richness (p = 0.49, observed richness) among the three treatments and the control (Table 5).
Table 5.
Bacterial community diversity indexes in different treatments and the control.
In the BT treatment, the six phyla with the highest proportions in the bacterial community were Proteobacteria, Acidobacteria, Actinobacteria, Chloroflexi, Gemmatimonadetes, and Bacteroidetes (32.0%, 19.5%, 15.1%, 9.39%, 6.00%, and 5.55%, respectively). In the Base treatment, the six most abundant phyla were Proteobacteria, Acidobacteria, Actinobacteria, Chloroflexi, Bacteroidetes, and Gemmatimonadetes (34.4%, 16.5%, 13.3%, 8.60%, 7.36%, and 6.28%, respectively). Compared with BT, the positions of the fifth and sixth phyla were reversed in the Base treatment. In the Top treatment, the six most abundant phyla were Proteobacteria, Actinobacteria, Acidobacteria, Chloroflexi, Gemmatimonadetes, and Bacteroidetes (36.7%, 18.1%, 13.5%, 8.79%, 5.76%, and 5.65%, respectively). Compared with the BT and Base treatments, in the Top treatment the positions of the second and third phyla were reversed. In the control, the six most abundant phyla were Proteobacteria, Actinobacteria, Acidobacteria, Chloroflexi, Bacteroidetes, and Gemmatimonadetes (38.4%, 18.1%, 11.9%, 7.48%, 7.05%, and 6.54%, respectively) (Figure 2).
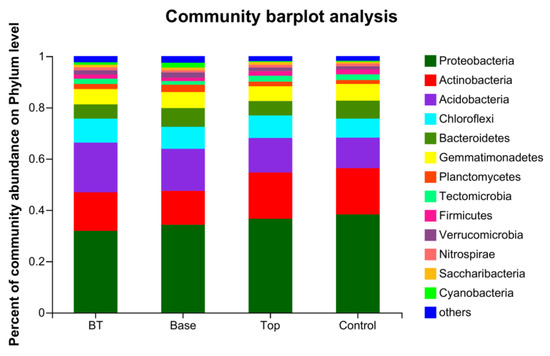
Figure 2.
Composition of bacterial communities at the phylum level in three treatments and the control. BT, combined base fertilizer and topdressing fertilizer; Top, topdressing fertilizer; Base, base fertilizer; Control, no fertilizer.
To determine the classified bacterial taxa showing significant differences in abundance among the BT, Top, Base, and control soil samples, we performed biomarker analysis using the LEfSe method. Twelve bacterial clades showed statistically significant differences in abundance, as judged with a LDA score threshold of 3.5. The BT samples were enriched with Blastocatellaceae__Subgroup_4 (family) and Blastocatellales (order). The Base samples were enriched with Cyanobacteria (phylum, class) and norank_c_Gemmatimonadetes (order, family, genus). The control samples were enriched with Actinobacteria (phylum, class) and Solirubrobacterales (order). The Top samples were enriched with Micrococcaceae (family) and Pseudarthrobacter (genus) (Figure 3).
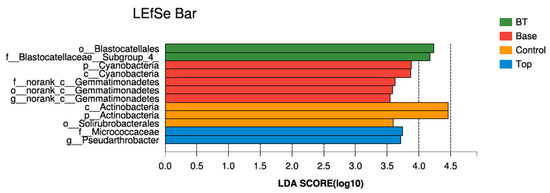
Figure 3.
LEfSe bar chart of bacterial clades in different treatments. BT, combined base fertilizer and topdressing fertilizer; Top, topdressing fertilizer; Base, base fertilizer; Control, no fertilizer.
3.4. Relationships among Soil Variables, NPP, and Bacterial Community Structure
The yield in 2016 was significantly positive correlated with SBR1093 and Latescibacteria, and negatively correlated with Proteobacteria. The AN was significantly negatively correlated with SBR1093 and Saccharibacteria, and AP was significantly positively correlated with Chlorobi. The soil OM content was significantly negatively correlated with Armatimonadetes, and soil pH was significantly negatively correlation with Parcubacteria (Figure 4).
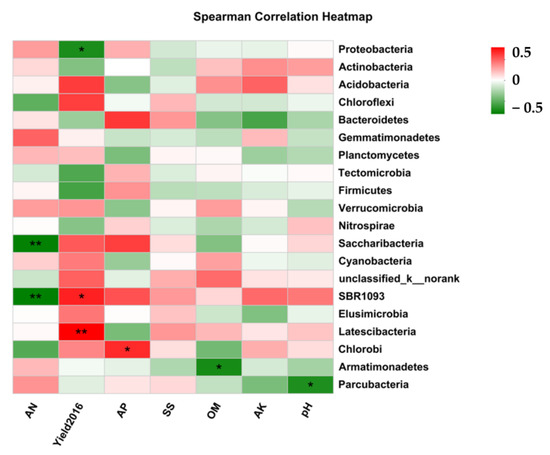
Figure 4.
Correlation analyses among soil variables, NPP, and bacterial community structure. OM, organic matter; AN, available nitrogen; AP, available phosphorus; AK, available potassium; SS, soil salinity. Yield2016, the above net primary productivity in year2016. *, significant (p < 0.05); **, significant (p < 0.01); ns, not significant.
3.5. Predicted Microbial Functions in Soils
We compared the abundance of several predicted enzyme genes in soil among the three treatments and the control. The abundance of enoyl-CoA hydratase genes was significantly higher in the Top treatment (3.89%) and the control (3.93%) than in the BT treatment (3.49%) and Base treatment (3.59%) (p < 0.05). Similarly, the abundance of acetyl-CoA C-acetyltransferase genes was significantly higher in the Top treatment (2.05%) and the control (2.04%) than in the BT treatment (1.92%) and Base treatment (1.94%) (p < 0.05). The abundance of aldehyde dehydrogenase (NAD+) genes was higher in the Top treatment (1.74%) and the control (1.77%) than in the BT treatment (1.66%). The abundance of ATP-dependent RNA helicase DHX58 genes in the BT and Base treatments was the same (1.44%), and was higher than that in the Top treatment (1.38%) and the control (1.37%). The abundance of NADH dehydrogenase I subunit B/C/D genes was higher in the BT treatment (0.96%) and the Base treatment (0.93%) than in the Top treatment (0.88%) and the control (0.87%) (Figure 5).
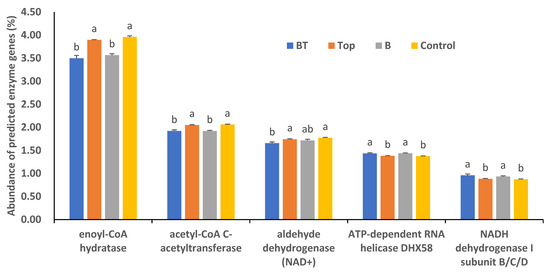
Figure 5.
Abundance of several predicted enzyme genes in different treatments and the control. BT, combined base fertilizer and topdressing fertilizer; Top, topdressing fertilizer; Base, base fertilizer; Control, no fertilizer. Different lowercase letters indicate significant differences at p < 0.05.
Next, we compared the abundance of genes mapped to various metabolic pathways among the three treatments and the control. The abundance of predicted genes linked to purine metabolism in both the BT and Base treatments was 1.90%, higher than that in the Top treatment and the control (both 1.88%). The abundance of predicted genes linked to the ribosome pathway was higher in the BT and base treatments (both 1.76%) than in the Top treatment and the control (both 1.71%). The abundance of predicted genes linked to oxidative phosphorylation was higher in the BT treatment (1.59%) and the Base treatment (1.58%) than in the Top treatment (1.52%) and the control (1.51%). The abundance of predicted genes linked to peptidases was 1.58% in both the BT and Base treatments, higher than in the Top treatment (1.52%) and the control (1.52%). The abundance of predicted genes linked to pyrimidine metabolism was 1.30% in both the BT and Base treatments, higher than in the Top treatment (1.27%) and the control (1.27%) (Figure 6).
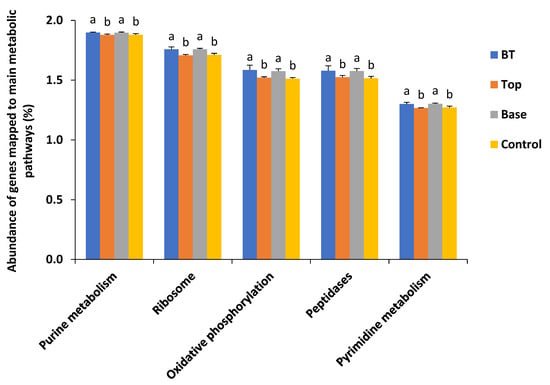
Figure 6.
Abundance of genes mapped to main metabolic pathways among the three treatments and the control. BT, combined base fertilizer and topdressing fertilizer; Top, topdressing fertilizer; Base, base fertilizer; Control, no fertilizer. Different lowercase letters indicate significant differences at p < 0.05.
4. Discussion
4.1. Fertilizer Increases Alfalfa Productivity in Saline Soil
The predominant anion of the Huanghe River Delta saline soil is Cl−, which accounted for 85% of the total anion, and the predominant cation is Na+, which accounted for 86% of the total cation. Salt ions accumulated toward the surface with soil evaporation [21,22,28], which limited rhizobia activity [29], leading to nitrogen deficiency in the alfalfa plants. The urea treatment (Top) improved the ANPP of alfalfa in the sowing year and the third year. However, in the drought condition, the ANPP was lower in the Top treatment than in the control in 2015, since the drought stress in spring (Figure 1). Therefore, topdressing with urea had the potential to increase ANPP in saline soil, but the effect was not stable (Table 3).
Organic fertilizer has been shown to increase the productivity and quality of alfalfa [30,31,32]. In this study, the ANPP of the BT and Base treatments were 16.6 and 16.5 t·hm−2, which are the high level of production in this region, even with a severe drought in the spring of 2015, and the average yields over 3 years were 13.21 and 13.82 t·hm−2, respectively, significantly higher than in the Top treatment and the control, which were 10.72 and 10.21 t·hm−2 (Table 3). On the one hand, the total nutrients of N and P increased in BT and Base treatments, and on the other hand, organic fertilizer promoted root growth in the seedling period (Table 3), and the rapid growth of the root system allowed the alfalfa plants to obtain nutrients and grow rapidly. We found that the root productivity in June of the planting year was significantly correlated with ANPP in both the current and following year (Table 4). Rapid growth of the root system in the early stages of plant growth is essential for alfalfa productivity, but further research is required to explore the specific mechanisms and processes involved [33].
4.2. Fertilizer Reshapes Soil Bacteria Composition, Enzymes, and Metabolic Pathways
Soil bacteria are the most abundant and diverse organisms on Earth [34,35,36,37]. They play an important role in maintaining biogeochemical cycling, net primary productivity, carbon sequestration, OM formation and decomposition, and multiple other functions in terrestrial ecosystems [38,39,40,41,42]. Soil microbial communities are influenced by soil pH [34,43], nutrient availability [44,45], temperature [46], soil water content [47], and vegetation types [48,49].
In this study, neither organic fertilizer nor chemical fertilizer significantly changed the final physicochemical properties of the soil (Table 2) or the diversity of soil bacteria. However, the application of organic fertilizer increased the abundance of Acidobacteria and reduced the abundance of Actinobacteria, consistent with the results of another study [50]. Acidobacteria play an important ecological role in the formation of soil OM. In this study, urea applied as topdressing increased the abundance of Gemmatimonadetes and decreased the abundance of Bacteroidetes in soil.
The abundance of Actinobacteria differed significantly between the control and the fertilizer treatments in this study. In soil, Actinobacteria tend to have neutral interactions with other co-occurring microorganisms, especially under oligotrophic conditions. Our results indicate that Actinobacteria can help alfalfa plants to obtain nutrients (Figure 4). Proteobacteria are the largest of the bacterial domains and are related to a wide range of functions related to carbon, nitrogen, and sulfur cycling. This group also includes many pathogenic bacteria, which explains why it was significantly negatively correlated with yield (Figure 5).
According to the abundance of predicted enzyme genes, the application of organic fertilizer decreased the activities of enoyl-CoA hydratase, acetyl-CoA C-acetyltransferase, and aldehyde dehydrogenase (NAD+), and promoted those of ATP-dependent RNA helicase DHX58 and NADH dehydrogenase I subunit B/C/D. Although the differences among the treatments were significant, the absolute differences were not very large. Similarly, the application of organic fertilizer increased the abundance of predicted genes linked to purine metabolism, ribosome, oxidative phosphorylation, peptidase, and pyrimidine metabolism pathways, but the increases were small and did not match the 30% yield increase. The bacterial communities in saline soils are very complex and competitive. In addition, environmental factors such as temperature and moisture vary greatly among seasons. Therefore, the bacterial population sampled at a certain time cannot fully reflect the overall situation during alfalfa growth. Further research is required to evaluate the complex changes in soil bacterial communities associated with alfalfa over time under field conditions.
5. Conclusions
Our results show that organic fertilizer can increase the ANPP of alfalfa by promoting root growth at the seedling stage in saline soil. Neither organic base fertilizer nor inorganic topdressing fertilizer changed the diversity of the soil bacterial community, but organic fertilizer increased the abundance of Acidobacteria and decreased the abundance of Actinobacteria. Urea applied as topdressing increased the abundance of Gemmatimonadetes and decreased the abundance of Bacteroidetes. Soil bacteria play an important role in improving the productivity of alfalfa in saline soils, but further research is required to explore the mechanism by which soil microbes enhance yield.
Author Contributions
Conceptualization, X.L. and F.H.; methodology, F.H., G.W. and L.W.; investigation, F.H., Z.T. and Y.W.; data curation, F.H. and Z.L.; writing—original draft preparation, F.H. Z.T. and Y.W.; writing—review and editing, F.H. and X.L.; and funding acquisition, F.H. and X.L. All authors have read and agreed to the published version of the manuscript.
Funding
This research was funded by the earmarked fund for CARS (CARS-34) and the Agricultural Science and Technology Innovation Program (ASTIP-IAS14).
Data Availability Statement
All data supporting the findings of this study are included in the article.
Acknowledgments
We thank Zhao Ma, Hongyu Xu, and Bao Wei for their assistance with field data collection and Jennifer Smith for editing a draft of this manuscript. We also thank the anonymous reviewers and editors for their comments to improve our manuscript.
Conflicts of Interest
The authors declare no conflict of interest. The funders had no role in the design of the study; in the collection, analyses, or interpretation of data; in the writing of the manuscript; or in the decision to publish the results.
References
- Rumbaugh, M.D.; Pendery, B.M. Germination salt resistance of alfalfa (Medicago sativa L.) germplasm in relation to subspecies and centers of diversity. Plant Soil 1990, 124, 47–51. [Google Scholar] [CrossRef]
- Munns, R.; Tester, M. Mechanisms of Salinity Tolerance. Annu. Rev. Plant Biol. 2008, 59, 651–681. [Google Scholar] [CrossRef] [PubMed]
- Bertrand, A.; Dhont, C.; Bipfubusa, M.; Chalifour, F.O.P.; Drouin, P.; Beauchamp, C.J. Improving salt stress responses of the symbiosis in alfalfa using salt tolerant cultivar and rhizobial strain. Appl. Soil Ecol. 2015, 87, 108–117. [Google Scholar] [CrossRef]
- Yu, X.; Li, L.; Li, C.; Song, Y.; Xu, Z.; Zhang, J.; Guan, C. Assessing alfalfa (Medicago sativa L.) tolerance to salinity at seedling stage and screening of the salinity tolerance traits. Plant Biol. 2021, 23, 664–674. [Google Scholar] [CrossRef]
- Anower, M.R.; Mott, I.W.; Peel, M.D.; Wu, Y. Characterization of physiological responses of two alfalfa half-sib families with improved salt tolerance. Plant Physiol. Biochem. 2013, 71, 103–111. [Google Scholar] [CrossRef]
- Sun, J.; Zhao, J.; Zhang, T.; Yu, L.; Jin, K. Effects of a Furrow-Bed Seeding System on Stand Establishment, Soil Bacterial Diversity, and the Yield and Quality of Alfalfa Under Saline Condition. Front. Plant Sci. 2022, 13, 919912. [Google Scholar] [CrossRef]
- Allen, S.G.; Dobrenz, A.K.; Schonhorst, M.H.; Stoner, J.E. Heritability of Nacl tolerance in germinating alfalfa seeds. Agron. J. 1985, 77, 99–101. [Google Scholar] [CrossRef]
- Ashraf, M.; Mcneilly, T.; Bradshaw, A.D. Selection and heritability of tolerance to sodium-chloride in four forage species. Crop. Sci. 1987, 27, 232–234. [Google Scholar] [CrossRef]
- Esechie, H.A.; Al-Barhi, B.; Al-Gheity, S.; Al-Khanjari, S. Root and shoot growth in salinity-stressed alfalfa in response to nitrogen source. J. Plant Nutr. 2002, 25, 2559–2569. [Google Scholar] [CrossRef]
- Vitousek, P.M.; Menge, D.N.L.; Reed, S.C.; Cleveland, C.C. Biological nitrogen fixation: Rates, patterns and ecological controls in terrestrial ecosystems. Philos. Trans. R. Soc. B-Biol. Sci. 2013, 368, 20130119. [Google Scholar] [CrossRef]
- Hu, G.Z.; Liu, H.Y.; Yin, Y.; Song, Z.L. The role of legumes in plant community succession of degraded grasslands in Northern China. Land Degrad. Dev. 2016, 27, 366–372. [Google Scholar] [CrossRef]
- Song, X.; Fang, C.; Yuan, Z.Q.; Li, F.M. Long-Term Growth of Alfalfa Increased Soil Organic Matter Accumulation and Nutrient Mineralization in a Semi-Arid Environment. Front. Environ. Sci. 2021, 9, 649346. [Google Scholar] [CrossRef]
- Lin, Y.; Chong, H.; LIU, G.H.; LIU, J.; ZHU, A.X. Mapping Soil Salinity Using a Similarity-based Prediction Approach: A Case Study in Huanghe River Delta, China. Chin. Geogra. Sci. 2015, 25, 283–294. [Google Scholar]
- Roy, S.J.; Negrão, S.; Tester, M. Salt Resistant Crop Plants. Curr. Opin. Biotechnol. 2014, 26, 115–124. [Google Scholar] [CrossRef] [PubMed]
- Hasegawa, P.M.; Bressnan, R.A.; Zhu, J.K.; Bohnert, H.J. Plant Cellular and Molecular Responses to High Salinity. Annu. Rev. Plant Physiol. Plant Mol. Biol. 2000, 51, 463–499. [Google Scholar] [CrossRef] [PubMed]
- Muchate, N.S.; Nikalje, G.C.; Rajurkar, N.S.; Suprasanna, P.; Nikam, T.D. Plant Salt Stress: Adaptive Responses, Tolerance Mechanism and Bioengineering for Salt Tolerance. Bot. Rev. 2016, 82, 371–406. [Google Scholar] [CrossRef]
- El-Sharkawy, M.; El-Beshsbeshy, T.; Al-Shal, R.; Missaoui, A. Effect of Plant Growth Stimulants on Alfalfa Response to Salt Stress. Agric. Sci. 2017, 8, 267–291. [Google Scholar] [CrossRef][Green Version]
- Khaled, H.; Fawy, H.A. Effect of different levels of humic acids on the nutrient content, plant growth, and soil properties under conditions of salinity. Soil Water Res. 2011, 6, 21–29. [Google Scholar] [CrossRef]
- Aydin, A.; Kant, C.; Turan, M. Humic acid application alleviate salinity stress of bean (Phaseolus vulgaris L.) plants decreasing membrane leakage. Afr. J. Agric. Res. 2012, 7, 1073–1086. [Google Scholar] [CrossRef]
- Rath, K.M.; Fierer, N.; Murphy, D.V.; Rousk, J. Linking bacterial community composition to soil salinity along environmental gradients. ISME J. 2019, 13, 836–846. [Google Scholar] [CrossRef]
- Fu, T.F.; Zhang, Y.; Gao, J.W.; Chen, G.Q.; Liu, W.Q.; Su, Q. Study on spatio-temporal variability of saline soil salinity in the Yellow River delta. Period. Ocean Univ. China 2017, 47, 50–60. [Google Scholar]
- Weng, Y.L.; Gong, P. Soil Salinity Measurements on the Yellow River Delta. J. Nanjing Univ. (Nat. Sci.) 2006, 42, 602–610. [Google Scholar]
- Caporaso, J.G.; Lauber, C.L.; Walters, W.A.; Berg-Lyons, D.; Huntley, J.; Fierer, N.; Owens, S.M.; Betley, J.; Fraser, L.; Bauer, M.; et al. Ultra-High-Throughput Microbial Community Analysis on the Illumina HiSeq and MiSeq Platforms. ISME J. 2012, 6, 1621–1624. [Google Scholar] [CrossRef] [PubMed]
- Edgar, R.C. Search and clustering orders of magnitude faster than BLAST. Bioinformatics 2010, 26, 2460–2461. [Google Scholar] [CrossRef] [PubMed]
- Segata, N.; Abubucker, S.; Goll, J.; Schubert, A.M.; Izard, J.; Cantarel, B.L.; Rodriguez-Mueller, B.; Waldron, L.; Zucker, J.; Thiagarajan, M.; et al. Microbial community function and biomarker discovery in the human microbiome. Genome Biol. 2011, 12 (Suppl. 1), 47. [Google Scholar] [CrossRef]
- McIlroy, S.J.; Lapidus, A.; Thomsen, T.R.; Han, J.; Haynes, M.; Lobos, E.; Huntemann, M.; Pati, A.; Ivanova, N.N.; Markowitz, V.; et al. High quality draft genome sequence of Meganema perideroedes str. Gr1T and a proposal for its reclassification to the family Meganemaceae fam. nov. Stand. Genom. Sci. 2015, 10, 23. [Google Scholar] [CrossRef]
- Langille, M.G.I.; Zaneveld, J.; Caporaso, J.G.; McDonald, D.; Knights, D.; Reyes, J.A.; Clemente, J.C.; Burkepile, D.E.; Thurber, R.L.V.; Knight, R.; et al. Predictive functional profiling of microbial communities using 16S rRNA marker gene sequences. Nat. Biotechnol. 2013, 31, 814–821. [Google Scholar] [CrossRef]
- Yu, J.B.; Li, Y.Z.; Han, G.X.; Zhou, D.; Fu, Y.Q.; Guan, B.; Wang, G.M.; Ning, K.; Wu, H.F.; Wang, J.H. The spatial distribution characteristics of soil salinity in coastal zone of the Yellow River Delta. Environ. Earth Sci. 2014, 2, 589–599. [Google Scholar] [CrossRef]
- Wang, Y.F.; Zhang, Z.Q.; Zhang, P.; Cao, Y.M.; Hu, T.M.; Yang, P.Z. Rhizobium symbiosis contribution to short-term salt stress tolerance in alfalfa (Medicago sativa L.). Plant Soil 2016, 402, 247–261. [Google Scholar] [CrossRef]
- Hakl, J.; Kunzová, E.; Konečná, J. Impact of long-term organic and mineral fertilization on lucerne forage yield over an 8-year period. Plant Soil Environ. 2016, 62, 36–41. [Google Scholar] [CrossRef]
- Hakl, J.; Kunzová, E.; Tocauerová, Š.; Menšík, L.; Mrázková, M.; Pozdíšek, J. Impact of long-term manure and mineral fertilization on yield and nutritive value of lucerne (Medicago sativa) in relation to changes in canopy structure. Eur. J. Agron. 2021, 123, 126219. [Google Scholar] [CrossRef]
- Holík, M.; Kunzová, E.; Ludvíková, V.; Hakl, J. Impact of Long-Term Manure and Mineral Fertilization on Accumulation of Non-Structural Carbohydrates in Lucerne Forage. Agronomy 2022, 12, 639. [Google Scholar] [CrossRef]
- Li, Z.; Wan, L.; Li, S.; Li, X.; He, F.; Tong, Z. Plastic response of Medicago sativa L. root system traits and cold resistance to simulated rainfall events. PeerJ 2021, 9, e11962. [Google Scholar] [CrossRef] [PubMed]
- Fierer, N.; Jackson, R.B. The diversity and biogeography of soil bacterial communities. Proc. Nat. Acad. Sci. USA 2006, 103, 626–631. [Google Scholar] [CrossRef] [PubMed]
- Lauber, C.L.; Hamady, M.; Knight, R.; Fierer, N. Pyrosequencing-based assessment of soil pH as a predictor of soil bacterial community structure at the continental scale. Appl. Environ. Microbiol. 2009, 75, 5111–5120. [Google Scholar] [CrossRef] [PubMed]
- Nemergut, D.R.; Costello, E.K.; Hamady, M.; Lozupone, C.; Jiang, L.; Schmidt, S.K.; Fierer, N.; Townsend, A.R.; Cleveland, C.C.; Stanish, L.; et al. Global patterns in the biogeography of bacterial taxa. Environ. Microbiol. 2011, 13, 135–144. [Google Scholar] [CrossRef] [PubMed]
- Yang, Y.; Lee, S.; Jang, I.; Kang, H. Soil bacterial community structures across biomes in artificial ecosystems. Ecol. Eng. 2020, 158, 106067. [Google Scholar] [CrossRef]
- Angel, R.; Soares, M.I.M.; Ungar, E.D.; Gillor, O. Biogeography of soil archaea and bacteria along a steep precipitation gradient. ISME J. 2010, 4, 553–563. [Google Scholar] [CrossRef]
- Fierer, N.; Leff, J.W.; Adams, B.J.; Nielsen, U.N.; Bates, S.T.; Lauber, C.L.; Owens, S.; Gilbert, J.A.; Wall, D.H.; Caporaso, J.G. Cross-biome metagenomic analyses of soil microbial communities and their functional attributes. Proc. Nat. Acad. Sci. USA 2012, 109, 21390–21395. [Google Scholar] [CrossRef]
- Trivedi, P.; Anderson, I.C.; Singh, B.K. Microbial modulators of soil carbon storage: Integrating genomic and metabolic knowledge for global prediction. Trends Microbiol. 2013, 21, 641–651. [Google Scholar] [CrossRef]
- Wagg, C.; Bender, S.F.; Widmer, F.; van der Heijden, M.G.A. Soil biodiversity and soil community composition determine ecosystem multifunctionality. Proc. Nat. Acad. Sci. USA 2014, 111, 5266–5270. [Google Scholar] [CrossRef] [PubMed]
- Kim, S.; Lee, S.; McCormick, M.; Kim, J.G.; Kang, H. Microbial community and greenhouse gas fluxes from abandoned rice paddies with different vegetation. Microb. Ecol. 2016, 72, 692–703. [Google Scholar] [CrossRef] [PubMed]
- Griffiths, R.I.; Thomson, B.C.; James, P.; Bell, T.; Bailey, M.; Whiteley, A.S. The bacterial biogeography of British soils. Environ. Microbiol. 2011, 13, 1642–1654. [Google Scholar] [CrossRef] [PubMed]
- Fierer, N.; Strickland, M.S.; Liptzin, D.; Bradford, M.A.; Cleveland, C.C. Global patterns in belowground communities. Ecol. Lett. 2009, 12, 1238–1249. [Google Scholar] [CrossRef]
- Lee, S.H.; Kang, H. Elevated CO2 causes a change in microbial communities of rhizosphere and bulk soil of salt marsh system. Appl. Soil Ecol. 2016, 108, 307–314. [Google Scholar] [CrossRef]
- Sharp, C.E.; Brady, A.L.; Sharp, G.H.; Grasby, S.E.; Stott, M.B.; Dunfield, P.F. Humboldt’s spa: Microbial diversity is controlled by temperature in geothermal environments. ISME J. 2014, 8, 1166–1174. [Google Scholar] [CrossRef]
- Wang, D.; Rui, Y.C.; Ding, K.; Cui, X.Y.; Hao, Y.B.; Tang, L.; Pang, Z.; Zhang, B.; Zhou, S.T.; Wang, K.; et al. Precipitation drives the biogeographic distribution of soil fungal community in Inner Mongolian temperate grasslands. J. Soils Sediments 2018, 18, 222–228. [Google Scholar] [CrossRef]
- Prober, S.M.; Leff, J.W.; Bates, S.T.; Borer, E.T.; Firn, J.; Harpole, W.S.; Lind, E.M.; Seabloom, E.W.; Adler, P.B.; Bakker, J.D. Plant diversity predicts beta but not alpha diversity of soil microbes across grasslands worldwide. Ecol. Lett. 2015, 18, 85–95. [Google Scholar] [CrossRef]
- Leff, J.W.; Bardgett, R.D.; Wilkinson, A.; Jackson, B.G.; Pritchard, W.J.; De Long, J.R.; Oakley, S.; Mason, K.E.; Ostle, N.J.; Johnson, D.; et al. Predicting the structure of soil communities from plant community taxonomy, phylogeny, and traits. ISME J. 2018, 12, 1794–1805. [Google Scholar] [CrossRef]
- Liu, T.; Wu, X.H.; Lia, H.W.; Alharbic, H.; Wang, J.; Dang, P.; Chen, X.Y.; Kuzyakova, Y.; Yan, W.D. Soil organic matter, nitrogen and pH driven change in bacterial community following forest conversion. For. Ecol. Manag. 2020, 477, 118473. [Google Scholar] [CrossRef]
Publisher’s Note: MDPI stays neutral with regard to jurisdictional claims in published maps and institutional affiliations. |
© 2022 by the authors. Licensee MDPI, Basel, Switzerland. This article is an open access article distributed under the terms and conditions of the Creative Commons Attribution (CC BY) license (https://creativecommons.org/licenses/by/4.0/).