Abstract
Farmers need to know the actual nutrient concentrations in organic manures in order to enable optimal crop nutrition and to avoid nutrient losses into the environment. Physicochemical quick tests offer a way to estimate nutrient concentrations on a farm but require statistical calculation models to be applied by the farmer. A total of 391 pig slurries, were sampled from practical farms in northwest Germany and ammonium nitrogen (AN), total nitrogen (TN), total phosphorus (TP), total potassium (TK) concentrations, and dry matter were analysed in a laboratory. Furthermore, on-farm quick tests were used to determine electrical conductivity and specific density (SG) and the ammonium concentration with a Quantofix-N-Volumeter. Simple and multiple linear regression models for all lab analysed nutrients and on-farm determined parameters were calculated. The best regression models for all slurries were found for AN based on Quantofix-N-Volumeter (R2 = 0.92), TN based on Quantofix-N-Volumeter, and dry matter (R2 = 0.95), TP based on dry matter (R2 = 0.88), and TK based on Quantofix-N-Volumeter (R2 = 0.70). An application for mobile devices is being developed that will allow farmers to use these statistical models in a user-friendly way. Future regression models from other studies might be integrated into the app database so that farmers can calculate nutrient concentrations in pig slurries based on regionalised data.
1. Introduction
Nutrient emissions into terrestrial and aquatic ecosystems, as well as air pollution, pose a threat to human health and the environment. One of the largest contributors to these pollutions are agriculture activities [1]. Over-fertilization, i.e., nutrient application above crops’ needs, causes leaching into water bodies, resulting in eutrophication, as well as increased gaseous emissions into the atmosphere [2,3]. At the same time, food security relies on crop yields that suffice human energy and protein requirements. A demand-oriented fertilization of agricultural crops that ensures high production levels without environmental pollution is key to sustainably feeding the growing world population.
Particularly, in agricultural systems that include livestock production, farm-based organic fertilisers, such as slurries and manures, are valuable components of the farmers’ fertilization strategies. In addition to cattle and poultry production, pig husbandry is the most important livestock-breeding sector globally. In 2021 about 750 million pigs were reared worldwide [4]. Unfortunately, the nutrient composition of pig slurries can vary considerably depending on climate, husbandry systems, feeding components, water management, and slurry storage [5,6]. However, for responsible nutrient management on the farm, it is essential to utilise reliable data on the nutrient concentration of the available organic fertiliser right before they are applied to the land.
Since mostly laboratory measurements take quite some time before their results are reported to the farmer, research on rapid, on-site methods to obtain data on slurry nutrient concentrations re-gained much attention. One important field of research is near-infrared (NIR) spectroscopy, however, work on the accuracy of NIR systems used at the farm level needs to be continued [7,8]. Due to the high costs of NIR sensors, this technology is yet to find its way into farm practice. Furthermore, under farm conditions, these NIR sensors are exposed to very harsh conditions (e.g., temperature and humidity variability, dust, and vibrations). Overall, it should be noted that the comparability between laboratory results and NIR measurements (and also between different NIR sensors, but identical in construction from the same manufacturer) is sometimes rather unsatisfactory. Therefore, further work is needed on alternative measurement methods.
Physicochemical methods, which moved out of the focus of research, offer great potential in nutrient determination and can still be further developed. These methods were already carried out in the 1970s [9,10]. Such physicochemical parameters (e.g., dry matter, specific gravity, and electrical conductivity) are used to create regression models for deriving nutrient concentrations [10]. Many models were published that are based on dry matter concentration because it is rather straight forward to weigh in the slurry sample and measure the residual weight after drying [11,12,13]. Specific gravity, which is determined by the immersion depth of a hydrometer was also proposed as an indicator for nutrient concentrations [11,14,15]. Measuring the ionic strength of the liquid slurry phase [16,17,18] or the pH [19] using an electrode is yet another rather simple physicochemical method to derive information on nutrient concentrations in slurries.
In addition to these indirect methods, rapid tests for direct ammoniacal nitrogen (AN) measurement, such as the Quantofix-N-Volumeter (Quantofix), were developed, which convert the ammonium in the slurry into N2 by a hypochlorite reaction and the resulting gas pressure is determined [20,21].
Despite the good fit of many of these regression models, physicochemically based models fell out of the research focus in the last 10 years. Furthermore, feeding strategies for pigs in particular changed drastically, leading to feedstuff with much lower N and P concentrations, and regression models based on older sample sets might not be valid today.
For the successful implementation of regression models based on physicochemical methods at the farm level, three criteria need to be fulfilled. First, the farmer must have knowledge that such regression models exist at all (including access to scientific literature to look up the relevant regression equations). Second, the farmer must have the statistical understanding of how to interpret these models and to select the most appropriate model. Thirdly, it is necessary to evaluate if the particular slurry sample from the farm fits to the data set used to create the regression model. An application with an interface adapted to farmers’ needs could circumvent these problems and simplify the use of such regression models.
To get an up-to-date dataset for the development of such an application, a survey was initiated to collect slurry samples from different pig farms. The objectives of this study were (i) to check whether AN, TN, TP, and TK concentrations can be estimated based on regressions with the rapid test parameters dry matter, specific gravity, electrical conductivity, and Quantofix, and (ii) to implement the best regressions from these physicochemical tests in a user-friendly way through an application for mobile devices.
2. Materials and Methods
2.1. Slurry Sample Collection
In order to obtain a representative sample set, a total of 391 slurries were collected from pig farms in northwestern Germany. As this region is one of the most important pig farming regions in Germany, the sample set can be considered representative for the range of pig production conditions in Germany. Samples originated from 3 different production systems: pregnant and lactating sows with piglets weighing up to 8 kg (n = 110; subset “Sows”), piglets weighing 8–28 kg (n = 49; subset “Piglets”), and fattening pigs weighing 28–125 kg (n = 232; subset “Pigs”). The samples were taken from the storage tanks by the farmers in the same way as samples are taken for a standard laboratory analyses. After arrival at the laboratory, each sample was intensively homogenised using a stainless steel mixer (Blender CB15VXE, Waring Commercial, Torrington, CT, USA), split up into 0.5-litre portions, filled into plastic bottles and immediately frozen at −18 °C.
2.2. Sample Analyses
For each slurry, one subsample was analysed in an accredited commercial lab (LUFA Nord-West, Hameln, Germany) according to the standard procedures used in Germany for animal slurries. Total nitrogen (TN) was analysed via a modified Kjeldahl method [22]. Ammoniacal nitrogen (AN) was determined by making up 5 g of the sample to 100 mL with 0.0125 molar calcium chloride solution. After filtration, the solution was measured based on a procedure using a continuous flow analysis method with a spectrometric detection [23]. For total phosphorous (TP) and total potassium (TK), slurry samples were digested and nutrient concentrations were determined by inductively coupled plasma optical emission spectrometry [24]. Dry matter determination was performed gravimetrically after drying at 105 °C [25].
On-farm quick tests were not conducted under lab conditions but at the experimental farm of Osnabrueck University, simulating an on-farm situation. Electric conductivity measurement was performed at 25 °C, using a TetraCon 325 connected to a portable conductivity meter (ProfiLine Cond 3110, Xylem Analytics Germany Sales GmbH & Co. KG, Weilheim, Germany). A 50 mL portion of the homogenised slurry sample was measured taking care that the electrode was not in contact with the wall of the sample container. For determination of specific gravity, 500 mL homogenised slurry was filled into a graduated cylinder and subsequently a hydrometer (Dichte-Aräometer DIN 12791, series M 100, Geco Gering, Hofgeismar, Germany) was immersed in the slurry. In cases where the hydrometer did not sink into the slurry sample because the density was too high, the slurry was diluted 1:1 or 1:2 (v/v). For quantification of AN, the Quantofix-N-Volumeter (Terraflor GmbH, Iserlohn, Germany) was used. Measurements were carried out according to the operating instructions: 100 mL slurry was diluted 1:2 with distilled water and 150 mL sodium hypochlorite was added. The N2 originating from the conversion of NH4+ increased the pressure in its airtight reaction vessel, leading to a raise of the water column, which can then be read, directly from the calibrated scale of the instrument.
2.3. Statistical Analyses and Selection Procedure for Regression Models
Simple descriptive statistical indicators (mean, median, minimum, and maximum) for the total sample set and the three subsets were calculated for all parameters mentioned above. Single linear regression and multiple linear regression analyses were calculated to estimate TN, AN, TP, and TK of the pig slurries based on the easily on-farm assessable parameters dry matter, specific gravity, electrical conductivity, and Quantofix-N-Volumeter. To assess the quality of the obtained models, the coefficient of determination (R2) and the root mean square error (RMSE) were calculated. While the model fit improves when R2 approaches 1, the numeric value of RMSE must be considered individually for each model, as it depends on the level of the measured value [26]. All statistical evaluations were conducted using the R software packages [27]. In the Supplementary Material, all models for the subsets piglets, fattening pigs and sows are given in Table S1. In addition, the graphs of the regressions from Table 2 are shown in Figure S1.
2.4. Development of the Smartphone Application
A smartphone application is being developed by the software company iotec GmbH (Osnabrück, Germany) for the use of the physicochemical models on farms. The cross-platform “Flutter framework” from Google (Dublin, Ireland) was used. An interface prototype was created and tested on internal users. The formulas and data tables of this study were programmed and implemented in the app software code.
3. Results and Discussion
3.1. Sample Origin and Nutrient Concentrations
Based on the data reported by farmers on the specific characteristics of their pig production systems, the complete data set [n = 391] can be divided into three different subgroups: “Sow” [n = 110], “Piglet” [n = 49], and “Fattening pig” [n = 232]. Nutrient concentrations analysed in the laboratory for all slurries and those of the three different subgroups are shown in Figure 1.
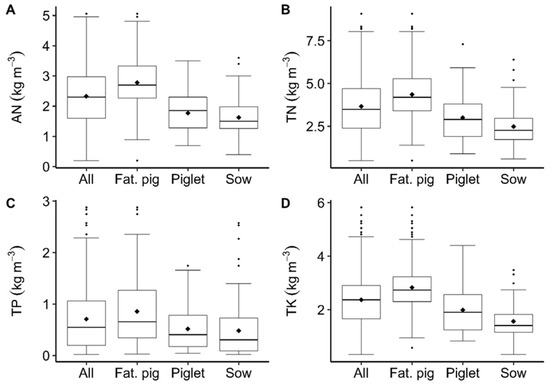
Figure 1.
Slurry nutrient concentrations of AN (A), TN (B), TP (C), and TK (D). “All” (n = 391), “Fattening pig” (n = 232), “Piglet” (n = 49) and “Sow” (n = 110) denote either the entire data set or the respective subsets contained therein. Mean values shown by diamonds.
The mean values of our total sample set (diamonds in the boxplots) for the nutrients are 2.33 kg m−3 for ammonium nitrogen, 3.66 kg m−3 for total nitrogen, 0.71 kg m−3 for total phosphorus, and 2.37 kg m−3 for total potassium. For all four nutrient parameters analysed, very large ranges result for the total sample set. A subdivision of the sample set into the three production sectors “Sow”, “Piglet”, and “Fattening pig” results in the lowest mean values of the respective sample set and smaller ranges for the subgroup “Sow”. The mean values for the nutrient parameters of the total sample set are well comparable with the data published by Martínez-Suller et al. [28] and Yagüe et al. [6], which were based on 83 and 126 pig manure samples, respectively, and, similar to our sample set, were divided into different production systems. In addition, with respect to the mean values of the four nutrients analysed in the subgroup “Fattening pig”, a good agreement was found of these two studies. For the subgroup “Sow”, however, the mean values for ammonium nitrogen, total potassium, and total phosphorus are below the values given by Martínez-Suller et al. [28] and Yagüe et al. [6]. In both studies, piglet slurry was assigned to the subgroup sow slurry, whereas in the present study, “Piglet” represents a separate subgroup with higher mean values compared to the subgroup “Sow” for all four nutrients. Therefore, the mean values for “Sow” are lower than the mean values reported by Martínez-Suller et al. [28] and Yagüe et al. [6].
In the past five decades some physicochemical properties of liquid farm manures, which can be determined directly on the farm using quick methods, were already tested as a basis for the calculation of nutrient concentrations.
For the pig slurries sampled in our study, the mean values for the entire sample set are slightly below 24 mS cm−1 for electrical conductivity and 3.65% for dry matter (Table 1). For the subgroups “Fattening pig”, higher mean values were found for both electrical conductivity and dry matter than for the subgroup “Sow”. Overall, the values for both parameters for the whole sample set, as well as for the subgroups, are within the range reported by Martínez-Suller et al. [28] and Yagüe et al. [6].

Table 1.
Physicochemical slurry properties of “All” (n = 391), “Fattening pig” (n = 232), “Piglet” (n = 49), and “Sow” (n = 110).
The mean value of the specific gravity of 1020 g cm−1 (Table 1) roughly corresponds to the data of Moral et al. [11] (1006–1022 g cm−1; n = 36) and Suresh and Choi [29] (1016 g cm−1; n = 41), the two most recent studies with data on this parameter. The overall low measurement range of 1.002–1.064 g cm−1 has to be kept in mind. No remarkable differences were found in the specific gravity values for the three subgroups.
Using the Quantofix quick test method, a mean value of 2.26 kg m−3 (with a range of 0.00–6.35 kg m−3) was determined for the pig slurries sampled in this survey. The mean values of the Quantofix ammonium nitrogen concentrations for the three subgroups show noticeable differences: The values for the subgroup “Fattening pig” are almost twice as high compared to the subgroup “Sow”. The deviation of the mean value for ammonium nitrogen measured by Quantofix compared to the laboratory was less than 0.1 kg m−3 for the whole sample set. Only for the sow slurries, a slightly higher deviation of the mean value could be found with 0.16 kg m−3.
3.2. Assessing Nutrient Concentrations in Slurries Based on Quick Tests
3.2.1. Determination of the Ammonium Nitrogen Concentration Using Quick Tests and Physical Parameters
Two on-site quick tests for the determination of the ammonium concentration in pig slurry were tested in the present study: (a) the Quantofix, based on the reaction of ammonium nitrogen with hypochlorite according to Klasse and Werner [20], and (b) the electrical conductivity. With R2 of 0.92 (Table 2), a very close relationship was shown between the Quantofix quick test values and the ammonium concentrations analysed in the laboratory. The coefficient of determination was thus only slightly smaller than in comparable studies conducted by Piccinini and Bortone [30] and Williams et al. [31], who, however, only used very small sample sets (n < 20). The Quantofix quick test can therefore be used with great reliability for an extensive, heterogeneous sample set of pig slurry collected under practical conditions to derive the ammonium nitrogen concentration.
Table 2.
Regression models for the total dataset (n = 391) with coefficients of determination (R2) and RMSE (significance level for all regressions p < 0.001).
The calculation model for deriving the ammonium nitrogen concentration based on electrical conductivity, on the other hand, only yielded an R2 of 0.55 (Table 2). In other studies focusing on the calculation of ammonium nitrogen in pig slurry using EC measurements, however, R2 values of 0.84 [11], 0.91 [32], and even 0.95 [28] were determined. This is probably related to the selection of the respective sample set in those studies. Moral et al. [11] collected their pig slurry samples in Vega Baja, a small region near Valencia (Spain), and only used slurries from pellet and/or meal-fed pigs. They also limited the variability of the samples by using only slurry that was stored between 30 and 60 days. Suresh et al. [32] collected their slurry samples only from relatively large farms (2000–6000 pigs) and subdivided the pigs into two weight classes (35–70 kg and 70–100 kg). Martínez-Suller et al. [28] subdivided their data set into different housing systems and created several models with R2 values between 0.76 (fattening pigs, n = 30) and 0.95 (“integrated farrow to finish pig slurry”, n = 13).
The two quick tests for the determination of ammonium nitrogen levels in pig slurry have advantages and disadvantages in their application on-farm. Electrical conductivity is a simple measurement that takes little time. However, our results show that this quick test is significantly inferior in its predictive accuracy compared to the Quantofix test. If the variability of the sample set is reduced by the selection of the samples used, the R2 can be increased. However, the calculation method derived from such a very special sample set can then only be used for the samples that fit into the selection criteria. The Quantofix test, on the other hand, is suitable for use with pig slurry from very different pig production systems. However, measurement based on Quantofix needs slightly more time and the test requires very careful and conscientious handling, as very corrosive chemicals are involved.
3.2.2. Assessing the Total Nitrogen Concentration Using Quick Tests and Physical Parameters
The total nitrogen concentration of pig slurry is usually composed of ammonium and organically bound nitrogen compounds, whereby the organic nitrogen component can be mainly attributed to the dry matter. In the present study, three regression models were tested to assess the total nitrogen concentration: (a) the Quantofix method, which provides the best ammonium model, (b) the gravimetrically determined dry matter, and (c) a combination of the two aforementioned parameters. With an R2 of 0.87, the coefficient of determination of the Quantofix model was clearly higher than 0.72, the coefficient of determination of the dry matter model (Table 2). However, with 0.95, the highest coefficient of determination was achieved by the multiple model, in which both parameters were used for the regression.
In other studies, that calculated ammonium concentrations based on electrical conductivity, models were developed that also calculated total nitrogen concentrations based on electrical conductivity. Moral et al. [11] reported an R2 of 0.78, Suresh et al. [32] determined an R2 of 0.74, and Martínez-Suller et al. [28] calculated a maximum R2 of 0.90 for their partial data set (n = 13) of pig slurries from the “closed system”.
Total nitrogen concentration can also be assessed based on dry matter or specific gravity measurements. The coefficients of determination for regression models based on specific gravity measurements vary widely. While an R2 of 0.85 was reported for the model of Chescheir et al. [33], the fit of the model of Moral et al. [11] was significantly lower, with an R2 of 0.45. The model of Suresh et al. [32] had an R2 of 0.79. Thus, restricting sample variability does not always improve the total nitrogen models. The model of Tunney [9], in which dry matter measurements were used to estimate the total nitrogen concentration in pig slurries, had an R2 of 0.85, although it should be noted that only 25 slurry samples were examined in this study.
When using multiple linear regression, both values of the rapid determination methods for ammonium concentration and dry matter can be taken into the calculation at the same time. Moral et al. [11] were able to increase their model for calculating the total nitrogen concentration in pig slurry based on specific gravity data from an R2 of 0.45 to an R2 of 0.69 by adding values for “electrical conductivity” as the second parameter. By adding the parameter “dry matter”, the coefficients of determination of the calculation models based on electrical conductivity by Martínez-Suller et al. [28] were increased from 0.82 to 0.85 and from 0.74 to 0.88 by Suresh et al. [32]. When using multiple regressions, at least two measurements must always be conducted by the farmer. This additional effort should only be performed when it results in a substantial improvement of the model fit.
3.2.3. Determination of the Total Phosphorus Concentration Using Quick Tests and Physical Parameters
In pig slurry, only a small part of the total phosphorus is present as phosphate ion in the liquid phase. Most of the phosphorus is in organic bonding forms [34]. To date, no quick physico-chemical method is described for the direct measurement of the total phosphorus concentration of pig slurry. However, it can be assumed that phosphorus concentrations correlate with slurry dry matter and can thus be derived indirectly.
For the present data set, both the gravimetrically determined dry mass and the specific gravity determined with the hydrometer were tested as predictors of phosphorus concentrations. The dry mass model had an R2 of 0.88 (Table 2), which is close to values reported by Tunney [9] with 0.85 and Scotford et al. [13] with 0.90. Both studies used significantly smaller, undefined sample sets with 25 and 18 samples, respectively. Martínez-Suller et al. [28] calculated an R2 of 0.38 for their entire sample set (n = 83), however, they were able to increase the R2 to 0.84 for the subgroup “finisher pigs” (n = 30).
The calculation model for deriving the phosphorus concentration based on the measurements using a hydrometer for the specific gravity has an R2 of 0.69 (Table 2). Chescheir et al. [33] calculated an R2 of 0.60 for 11 pig slurries, Moral et al. [11] with 36 slurries an R2 of 0.65, and Suresh et al. [32] with 41 slurries an R2 of 0.75. Thus, the coefficient of determination for the regression model based on the very large sample set of the present study is on a comparable level of studies with a smaller sample set, which are also not further differentiated with respect to the pig production process. However, closer correlations, i.e., higher coefficients of determination can also be found in the literature. For example, Yang et al. [19] collected a total of 216 samples from only 21 farms and reached an R2 of 0.81. For this sample set, it can be assumed that the variability of the chemical and physical properties of the pig slurry was clearly limited by the repeated sampling on the same farms or production systems. Thus, with a simultaneous increase in the number of samples, there is an apparent improvement in the R2 values. In the study by Zhu et al. [12] samples were only taken from nine farms. Subsequently, the sample material was diluted with water under laboratory conditions for adjusting 10 different dry matter concentrations for each of the nine sample origins. After the resulting 90 samples were divided into three production levels, Zhu et al. [12] obtained R2 values of 0.95 for fattening pigs, 0.97 for pregnant sows, and 0.97 for piglets. The high coefficients of determination achieved in this way are certainly not transferable to sample sets from practical farms with very different husbandry systems or feeding regimes.
Based on the evaluations of our large sample set, it can be concluded that both quick tests are suitable for predicting phosphorus concentrations in pig slurries, whereby the gravimetric method was more suitable. However, the measurement of dry matter via water loss to constant weight can take up to 24 h. Therefore, this parameter, as described by Moral et al. [11], should be referred to as an easy-to-determine parameter rather than a quick test. The predictive accuracy of the model based on “specific gravity” (hydrometer) was lower, but this on-site measurement can be done in a few seconds. By limiting the regression calculations to subgroups of the sample set, the model quality can be improved. However, it must then be taken into account that this also limits the applicability of the total phosphorus concentrations calculated with the model to manure samples from the respective pig production systems.
3.2.4. Determination of Total Potassium Concentration Using Quick Tests and Physical Parameters
Potassium is present mainly in ionic form in slurries. Unlike ammonium, however, there is no established rapid method (such as the Quantofix for ammonium) for the direct determination of potassium concentrations. The most commonly employed physicochemical method reported in the literature is the measurement of the electrical conductivity. Based on the results of the electrical conductivity and measured potassium concentrations of the entire sample set of 391 pig slurries (Table 2), the coefficient of determination is only 0.58. In other studies, better correlations were reported for regression models that derived potassium levels in pig slurry based on on-site measurement of electrical conductivity. An R2 of 0.82 was reported for the model of Moral et al. [11] and 0.69 with the model of Suresh et al. [32]. However, the data sets of these two studies were quite limited in their representativeness, as the slurry samples of Suresh et al. [32] were sampled only from large farms (2000–6000 pigs from certain production phases (weight class 35–70 kg and 70–100 kg)) and Moral et al. [11] collected their pig slurry samples only in Vega Baja, a small region near Valencia (Spain) and only used slurry samples from pellet and/or meal-fed pigs.
For the sample set of Martínez-Suller et al. [28], with 83 pig slurries from different stages of pig production, the coefficient of determination was 0.52, which is similar to the coefficient of determination obtained in this study. The determination of potassium concentration based on the determination of electrical conductivity thus appears to be of limited suitability for practical sample sets covering a wide range of pig production systems. However, for their model with 13 samples from the “integrated farrow to finish pig slurry”, Martínez-Suller et al. [28] were able to improve the R2 significantly to 0.84.
The ammonium and potassium concentrations of pig slurries measured in the laboratory can be significantly correlated with each other [6,11]. This was also shown for the 391 slurry samples in our study (R2 = 0.72). In order to test whether or not, and if so, to what extent, it is possible to assess the potassium concentrations based on data on ammonium concentrations determined with the Quantofix test, a further model was created. This regression model resulted in an R2 of 0.70 (Table 2), and thus shows a better fit than the model based on the measurement of electrical conductivity. Overall, however, it remains to be noted that, compared to the other nutrients, the quality of the models for the determination of potassium concentrations using data from on-site quick tests must be classified as comparatively poor.
3.3. Implementation into Farm Practice
In this study, four rapid physicochemical test methods for on-farm use were evaluated on 391 pig slurries with the aim to achieve a reliable prediction of the levels of ammonium, total nitrogen, total phosphorus, and total potassium concentrations. Using either the gravimetric dry matter or ammonium determined with the Quantofix test, best-fit regression models were developed for each nutrient (Table 2). However, using these statistical equations in everyday farming practice is not a useful approach. Therefore, an application for smartphones and other mobile devices was programmed, allowing a user-friendly application of the statistical calculation models. Figure 2 shows the flow chart of the selection steps for the “beta” version of this application. In order to provide an application with high versatility, potential implementation of data models from other studies was already taken into account during its conception and programming. For example, the selection level’s country and region can be used to spatially allocate the farm (and thus the origin of the slurry samples). For the sample set of this study, the selection options “Germany” for country and “Northwest” for region from the dropdown menu are to be selected accordingly. Then the farmer should select the type of slurry (in this case “pig slurry”). Based on the data models that were selected in this way, quick tests that are suitable for the prediction of the nutrient concentration will be suggested to the farmer. In this exemplary selection procedure, the user receives the recommendation to carry out the quick methods “Quantofix” and “Dry matter”, and to enter the measured quick test values via the input masks. The calculated nutrient concentrations of the pig slurry will be shown on the display and stored on a memory chip. For the final version of the smartphone app it is further intended that the data can be exported as a PDF file for documentation or archiving.
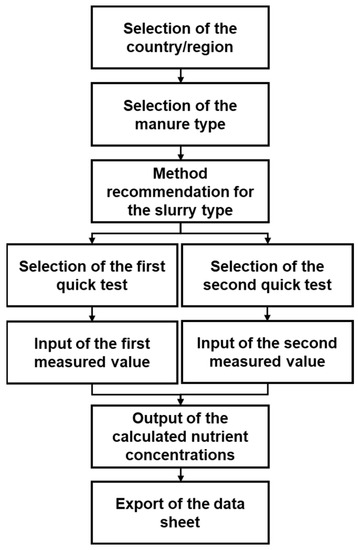
Figure 2.
Flow chart for the mobile device application.
The final version of the developed application will also offer possibilities to integrate further statistical calculation formulas from other studies. According to the details of Martínez-Suller et al. [28], the calculation algorithms can also be differentiated for users in Italy (or the region “Lombardy”). When selecting the type of slurry, a further distinction can be made between the different pig production systems (“fattening pigs”, “piglets”, and “closed system”) and feeding systems (“liquid” and “dry”). The application would then limit the selection of rapid methods to the measurement of electrical conductivity and dry matter, as only these methods were investigated by Martínez-Suller et al. [28]. As another option, creating specific calculation models for individual farms would also be conceivable. In this case, the approach of Zhu et al. [12] could be modified, in which a few slurry samples were taken from a farm or production branch, possibly creating an additional variation by adding different amounts of water, and then analysed using existing quick tests (e.g., measurement using the Quantofix and recording of electrical conductivity). After laboratory measurement of these samples, the data collected in this way can be transferred to the application, stored with the specific calibrations for the respective farm, and used for later determination of nutrient levels based on quick test measurements of new samples from the farm. With these models, a very accurate, farm-specific prediction would be possible. However, these calculation models can then only be used on these farms.
4. Conclusions
Our results reveal that the estimation of nutrient concentrations in pig slurries based on regression models, in combination with the results obtained by using on-farm quick tests, is a reliable alternative for farmers compared to sending slurry samples to an agro-chemistry lab. In contrast to lab-based analyses, quick tests can be used for on-site nutrient assessment of highly heterogeneous liquid animal manures immediately before their field application. However, it is important that these quick tests are calibrated on lab-analysed pig slurries produced under similar production conditions, hence showing comparable properties. Our study has two important implications for future research and agricultural practice. First, prediction models using data of quick tests should be accompanied by a user interface/application that allows user-friendly handling in practice. Second, our proposed approach offers substantial improvement for the estimation of the nutrient concentrations compared to the current farm practice where the nutrient concentration is calculated based on table values. Consequently, using an application for mobile devices for accessing regression models is an option for reducing nutrient oversupply and thus the environmental footprint of the livestock-based food production system.
Supplementary Materials
The following supporting information can be downloaded at: https://www.mdpi.com/article/10.3390/agronomy12112809/s1, Figure S1: Relationships for the laboratory measurements versus the quick tests and easy determinable parameters of the total sample set; Table S1: Regression models for the total dataset (n = 391) and the subsets piglet (n = 49), pig (n = 232) and sow (n = 110) with coefficients of determination (R²) and RMSE (significance level for all regressions p < 0.001).
Author Contributions
Conceptualization, M.-F.P. and H.-W.O.; methodology, M.-F.P.; software, M.-F.P.; validation, M.-F.P., K.D. and H.-W.O.; formal analysis, M.-F.P.; investigation, M.-F.P.; resources, M.-F.P. and H.-W.O.; data curation, M.-F.P.; writing—original draft preparation, M.-F.P.; writing—review and editing, M.-F.P., K.D. and H.-W.O.; visualization, M.-F.P.; supervision, K.D. and H.-W.O.; project administration, H.-W.O.; funding acquisition, H.-W.O. All authors have read and agreed to the published version of the manuscript.
Funding
This work was supported by the Deutsche Bundesstiftung Umwelt (Grant number 33702/01).
Data Availability Statement
The data presented in this study are available on request from H.-W.O.
Acknowledgments
The authors acknowledge the software developers at iotec GmbH for their helpful cooperation in the app development.
Conflicts of Interest
The authors declare no conflict of interest.
References
- Bowles, T.M.; Atallah, S.S.; Campbell, E.E.; Gaudin, A.C.M.; Wieder, W.R.; Grandy, A.S. Addressing agricultural nitrogen losses in a changing climate. Nat. Sustain. 2018, 1, 399–408. [Google Scholar] [CrossRef]
- Crippa, M.; Solazzo, E.; Guizzardi, D.; Monforti-Ferrario, F.; Tubiello, F.N.; Leip, A. Food systems are responsible for a third of global anthropogenic GHG emissions. Nat. Food 2021, 2, 198–209. [Google Scholar] [CrossRef]
- Padilla, F.M.; Gallardo, M.; Manzano-Agugliaro, F. Global trends in nitrate leaching research in the 1960-2017 period. Sci. Total Environ. 2018, 643, 400–413. [Google Scholar] [CrossRef] [PubMed]
- FAS USDA. Livestock and Poultry: World Market and Trade. Available online: https://apps.fas.usda.gov/psdonline/circulars/livestock_poultry.pdf (accessed on 5 October 2022).
- Chen, L.; Xing, L.; Han, L.J.; Yang, Z. Evaluation of physicochemical models for rapidly estimating pig manure nutrient content. Biosyst. Eng. 2009, 103, 313–320. [Google Scholar] [CrossRef]
- Yagüe, M.R.; Bosch-Serra, À.D.; Boixadera, J. Measurement and estimation of the fertiliser value of pig slurry by physicochemical models: Usefulness and constraints. Biosyst. Eng. 2012, 111, 206–216. [Google Scholar] [CrossRef]
- Morvan, T.; Gogé, F.; Oboyet, T.; Carel, O.; Fouad, Y. A dataset of the chemical composition and near-infrared spectroscopy measurements of raw cattle, poultry and pig manure. Data Brief 2021, 39, 107475. [Google Scholar] [CrossRef]
- Finzi, A.; Oberti, R.; Negri, A.S.; Perazzolo, F.; Cocolo, G.; Tambone, F.; Cabassi, G.; Provolo, G. Effects of measurement technique and sample preparation on NIR spectroscopy analysis of livestock slurry and digestates. Biosyst. Eng. 2015, 134, 42–54. [Google Scholar] [CrossRef]
- Tunney, H. Dry matter, specific gravity and nutrient relationships of cattle and pig slurry. In Engineering Problems with Effluents from Livestock; Hawkins, J.C., Ed.; EEC: Luxembourg, 1979; pp. 430–447. [Google Scholar]
- van Kessel, J.S.; Reeves, J.B.; Thompson, R.B. Rapid on-farm analysis of manure nutrients using quick tests. J. Prod. Agric. 1999, 12, 215–224. [Google Scholar] [CrossRef]
- Moral, R.; Perez-Murcia, M.D.; Perez-Espinosa, A.; Moreno-Caselles, J.; Paredes, C. Estimation of nutrient values of pig slurries in Southeast Spain using easily determined properties. Waste Manag. 2005, 25, 719–725. [Google Scholar] [CrossRef] [PubMed]
- Zhu, J.; Zhang, Z.; Ndegwa, P.M. Using a soil hydrometer to measure the nitrogen and phosphorus contents in pig slurries. Biosyst. Eng. 2003, 85, 121–128. [Google Scholar] [CrossRef]
- Scotford, I.M.; Cumby, T.R.; Han, L.J.; Richards, P.A. Development of a prototype nutrient sensing system for livestock slurries. J. Agric. Eng. Res. 1998, 69, 217–228. [Google Scholar] [CrossRef]
- Suresh, A.; Choi, H.L. Estimation of nutrients and organic matter in Korean swine slurry using multiple regression analysis of physical and chemical properties. Bioresour. Technol. 2011, 102, 8848–8859. [Google Scholar] [CrossRef]
- Scotford, I.M.; Cumby, T.R.; White, R.P.; Carton, O.T.; Lorenz, F.; Hatterman, U.; Provolo, G. Estimation of the nutrient value of agricultural slurries by measurement of physical and chemical properties. J. Agric. Eng. Res. 1998, 71, 291–305. [Google Scholar] [CrossRef]
- Provolo, G.; Martínez-Suller, L. In situ determination of slurry nutrient content by electrical conductivity. Bioresour. Technol. 2007, 98, 3235–3242. [Google Scholar] [CrossRef]
- Bietresato, M.; Sartori, L. Technical aspects concerning the detection of animal waste nutrient content via its electrical characteristics. Bioresour. Technol. 2013, 132, 127–136. [Google Scholar] [CrossRef] [PubMed]
- Thygesen, O.; Triolo, J.M.; Sommer, S.G. Indicators of physical properties and plant nutrient content of animal slurry and separated slurry. Biol. Eng. Trans. 2012, 5, 123–135. [Google Scholar] [CrossRef]
- Yang, Z.; Han, L.J.; LI, Q.; PIAO, X. Estimating nutrient contents of pig slurries rapidly by measurement of physical and chemical properties. J. Agric. Sci. 2006, 144, 261–267. [Google Scholar] [CrossRef]
- Klasse, J.; Werner, W. Method for rapid determination of ammonia nitrogen in animal slurries and sewage sludge. In Agricultural Waste Management and Environmental Protection. 4th International CIEC Symposium; Welte, E., Szabolcs, I., Eds.; FAL: Braunschweig-Volkenrode, Germany, 1987; pp. 119–123. [Google Scholar]
- van Kessel, J.S.; Reeves, J.B. On-farm quick tests for estimating nitrogen in dairy manure. J. Dairy Sci. 2000, 83, 1837–1844. [Google Scholar] [CrossRef]
- ISO 11261:1995; DIN ISO. Soil Quality—Determination of Total Nitrogen—Modified Kjeldahl Method. Beuth Verlag GmbH: Berlin, Germany, 1997.
- EN ISO 11732:2005; DIN EN ISO. Water Quality—Determination of Ammonium Nitrogen—Method by Flow Analysis (CFA and FIA) and Spectrometric Detection. Beuth Verlag GmbH: Berlin, Germany, 2005.
- EN ISO 11885:2009; DIN EN ISO. Water Quality—Determination of Selected Elements by Inductively Coupled Plasma Optical Emission Spectrometry (ICP-OES). Beuth Verlag GmbH: Berlin, Germany, 2009.
- EN 12880:2000; DIN EN. Characterization of Sludges—Determination of Dry Residue and Water Content. Beuth Verlag GmbH: Berlin, Germany, 2001.
- Tedeschi, L.O. Assessment of the adequacy of mathematical models. Agric. Syst. 2006, 89, 225–247. [Google Scholar] [CrossRef]
- R Core Team. R: A Language and Environment for Statistical Computing; R Foundation for Statistical Computing: Vienna, Austria, 2021. [Google Scholar]
- Martínez-Suller, L.; Azzellino, A.; Provolo, G. Analysis of livestock slurries from farms across Northern Italy: Relationship between indicators and nutrient content. Biosyst. Eng. 2008, 99, 540–552. [Google Scholar] [CrossRef]
- Suresh, A.; Choi, H.L. In situ rapid estimation of nutrients and organic matter in swine slurry by a hydrometer. Appl. Eng. Agric. 2012, 28, 935–942. [Google Scholar] [CrossRef]
- Piccinini, S.; Bortone, G. The fertilizer value of agricultural manure: Simple rapid methods of assessment. J. Agric. Eng. Res. 1991, 49, 197–208. [Google Scholar] [CrossRef]
- Williams, J.R.; Chambers, B.J.; Smith, K.A.; Brookman, S.; Chadwick, D.; Pain, B.F. The Development of User Friendly Systems for on-Farm Estimation of the Available Nitrogen Content in Solid Manures and Slurries; MAFF Open Contract CSA 2849; ADAS: Mansfield, UK, 1996. [Google Scholar]
- Suresh, A.; Choi, H.L.; Oh, D.I.; Moon, O.K. Prediction of the nutrients value and biochemical characteristics of swine slurry by measurement of EC-electrical conductivity. Bioresour. Technol. 2009, 100, 4683–4689. [Google Scholar] [CrossRef] [PubMed]
- Chescheir, G.M.; Westerman, P.W.; Safley, L.M. Rapid methods for determining nutrients in livestock manures. Trans. ASAE 1985, 28, 1817–1824. [Google Scholar] [CrossRef]
- Sánchez, M.; González, J.L. The fertilizer value of pig slurry. I. Values depending on the type of operation. Bioresour. Technol. 2005, 96, 1117–1123. [Google Scholar] [CrossRef] [PubMed]
Publisher’s Note: MDPI stays neutral with regard to jurisdictional claims in published maps and institutional affiliations. |
© 2022 by the authors. Licensee MDPI, Basel, Switzerland. This article is an open access article distributed under the terms and conditions of the Creative Commons Attribution (CC BY) license (https://creativecommons.org/licenses/by/4.0/).