
Pre-Breeding Prospects of Lablab (Lablab purpureus (L.) Sweet) Accessions in Tanzania: Morphological Characterization and Genetic Diversity Analysis

 ,
,
Abstract
1. Introduction
2. Materials and Methods
2.1. Site Description
2.2. Experimental Design and Layout
2.3. Data Collection
2.4. Statistical Analysis
3. Results
3.1. Morphological Characterization of Qualitative Characters
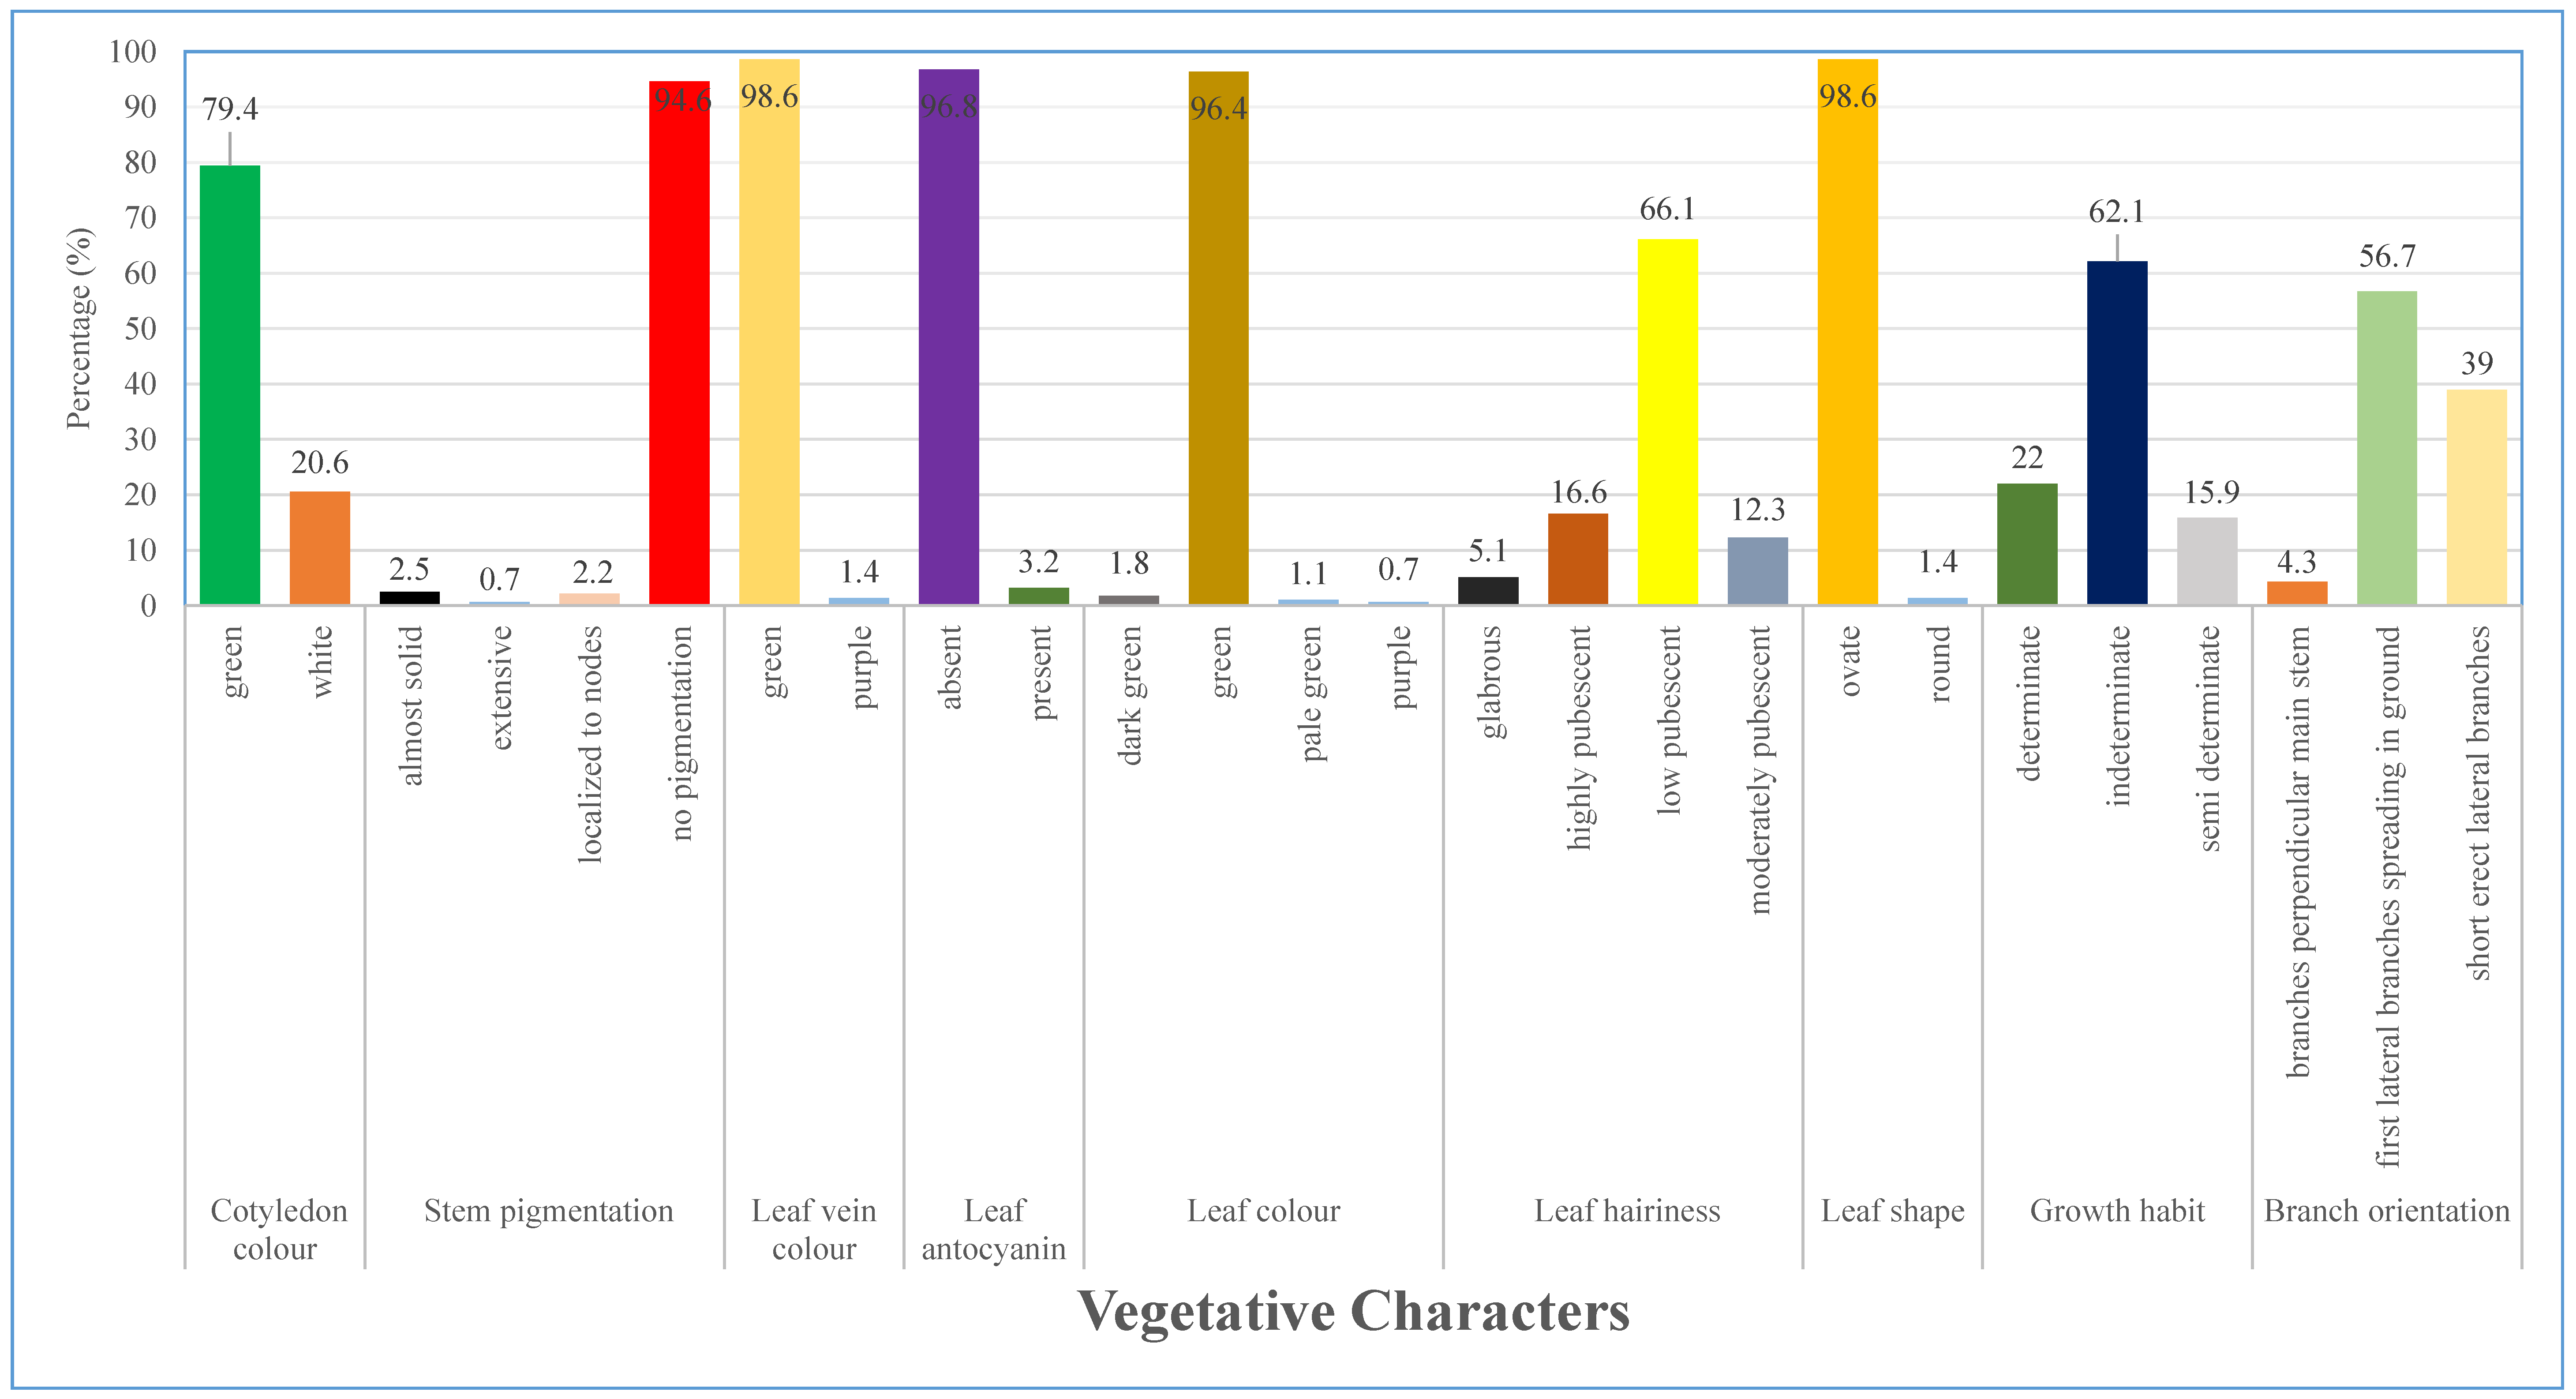
3.1.1. Variation of Characters at Vegetative Stage
3.1.2. Variation of Characters at Flowering Stage
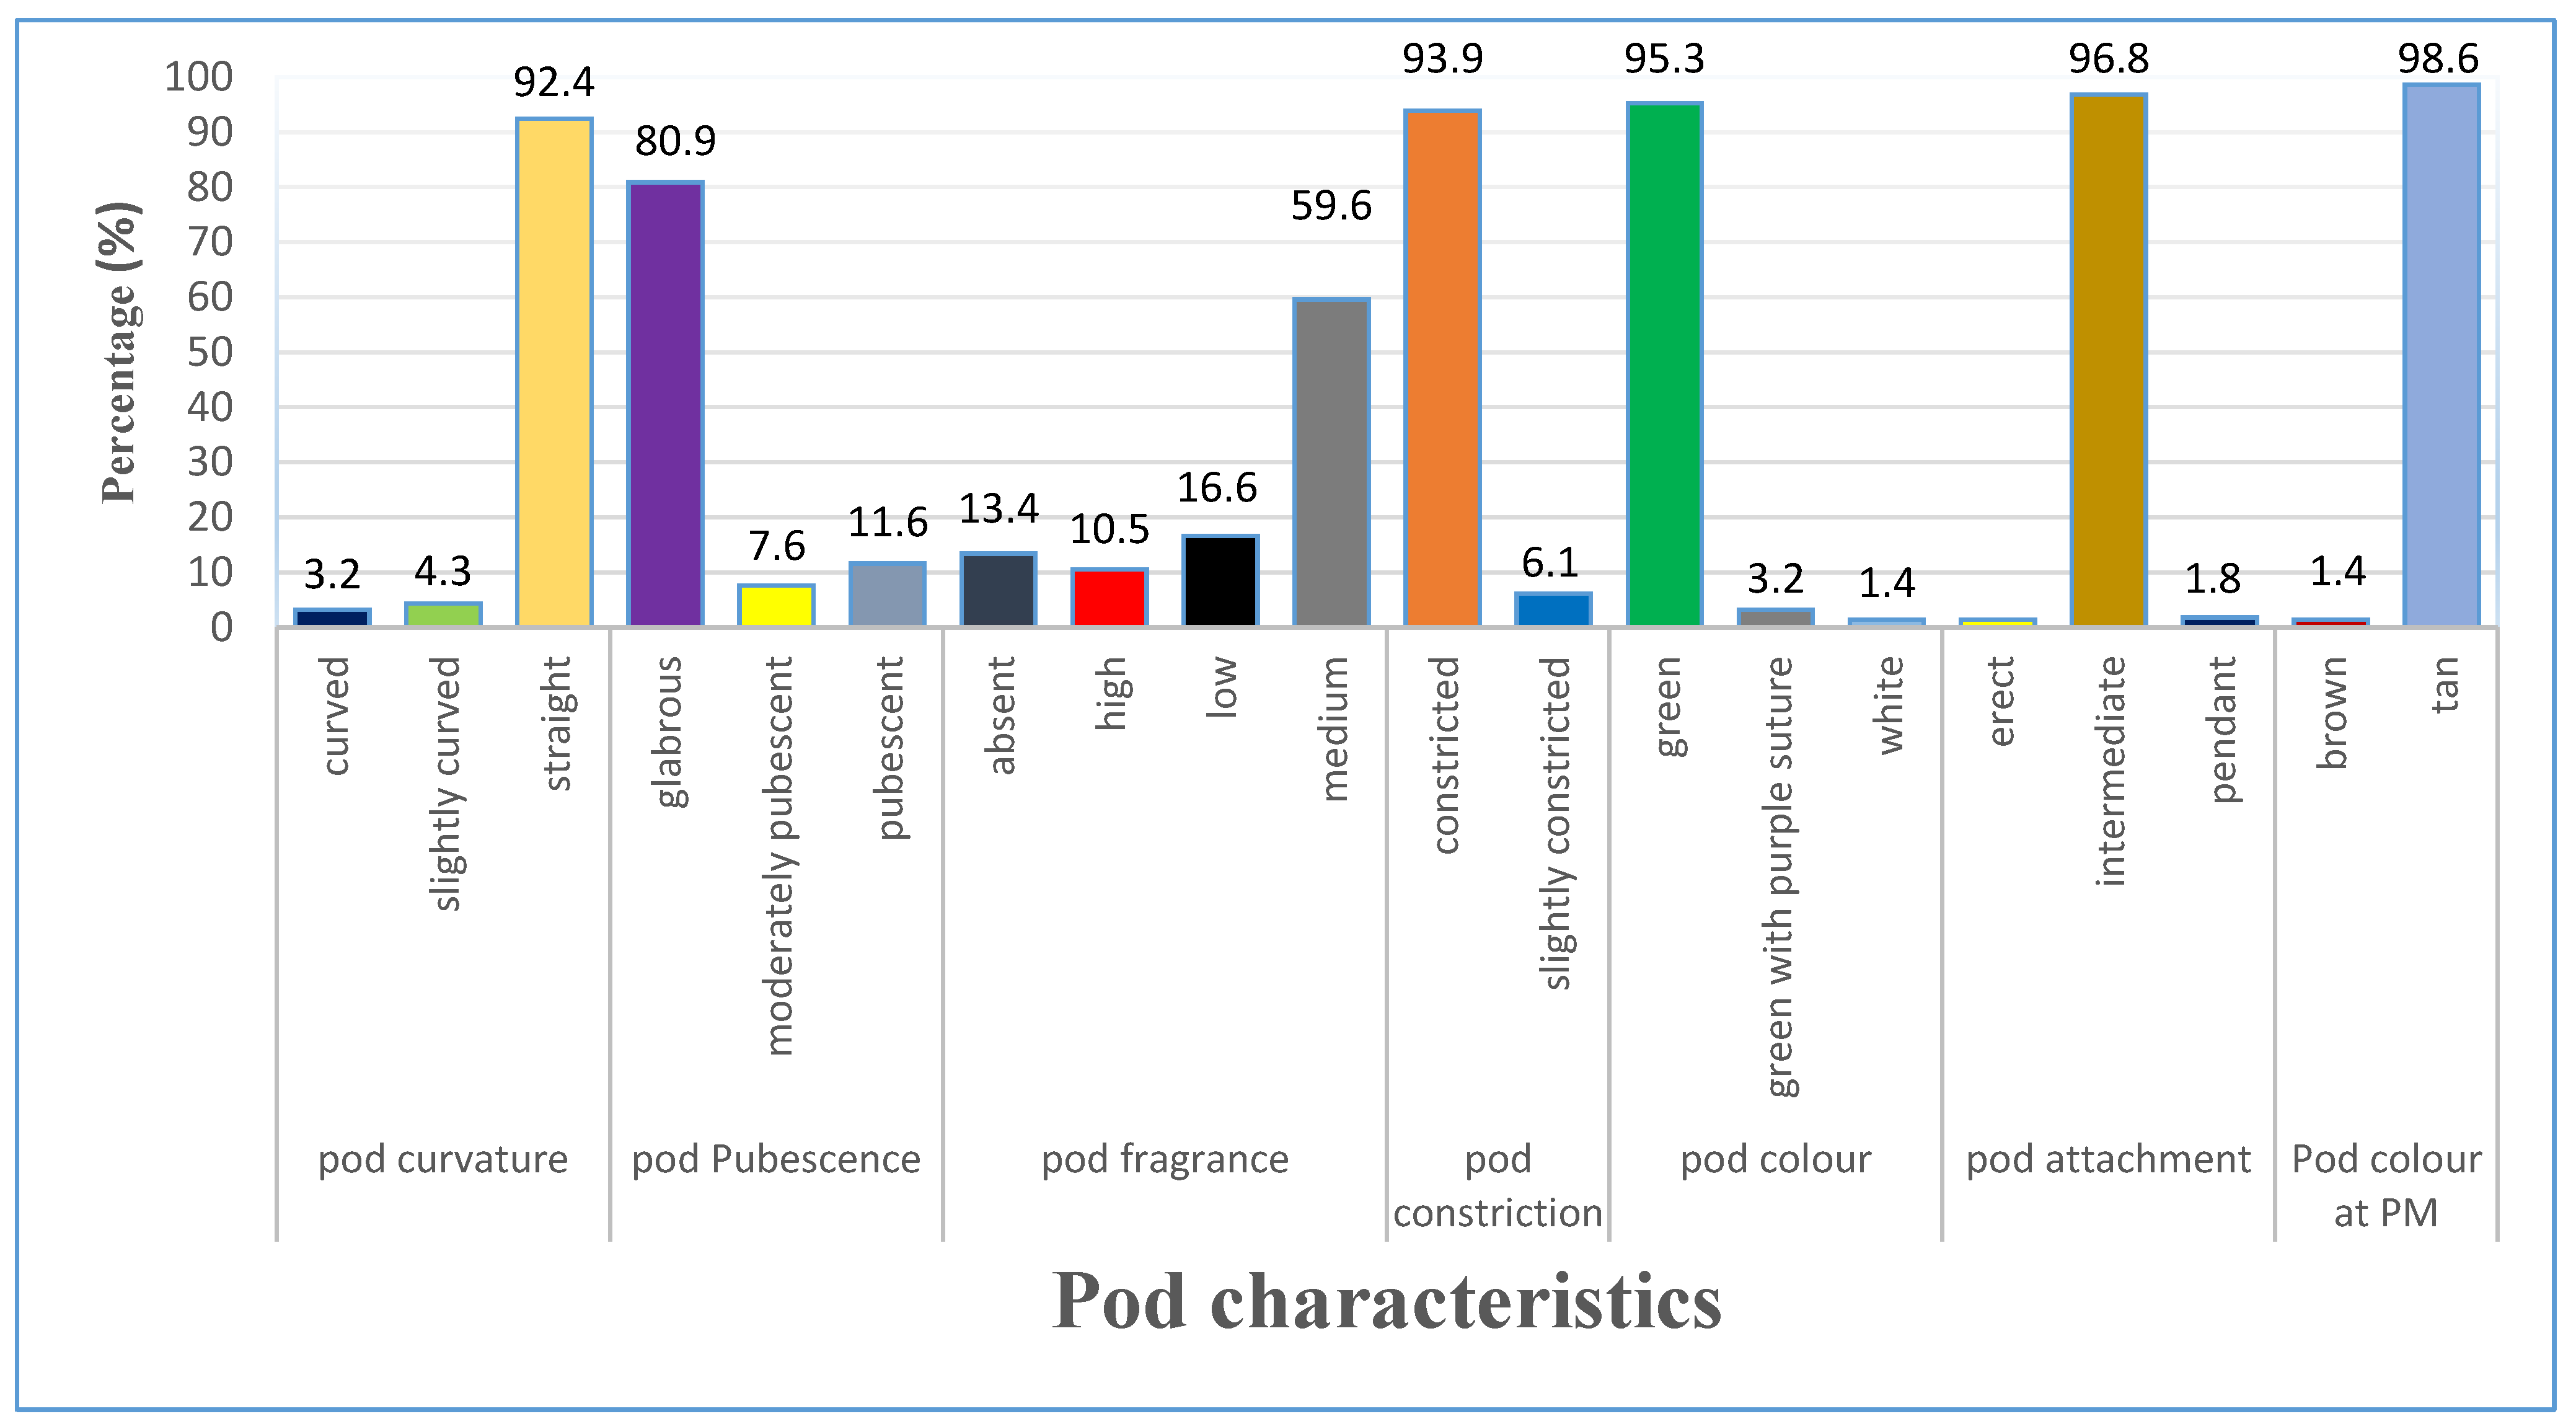
3.1.3. Variation of Pod Characteristics
3.1.4. Variation of Seed Characters
3.2. Diversity in Quantitative Characters of Lablab Accessions
3.2.1. Descriptive Analysis, Genetic Variability, and Heritability of Quantitative Traits of Lablab Accessions
3.2.2. Analysis of Variance of the Quantitative Traits across the Two Cropping Seasons
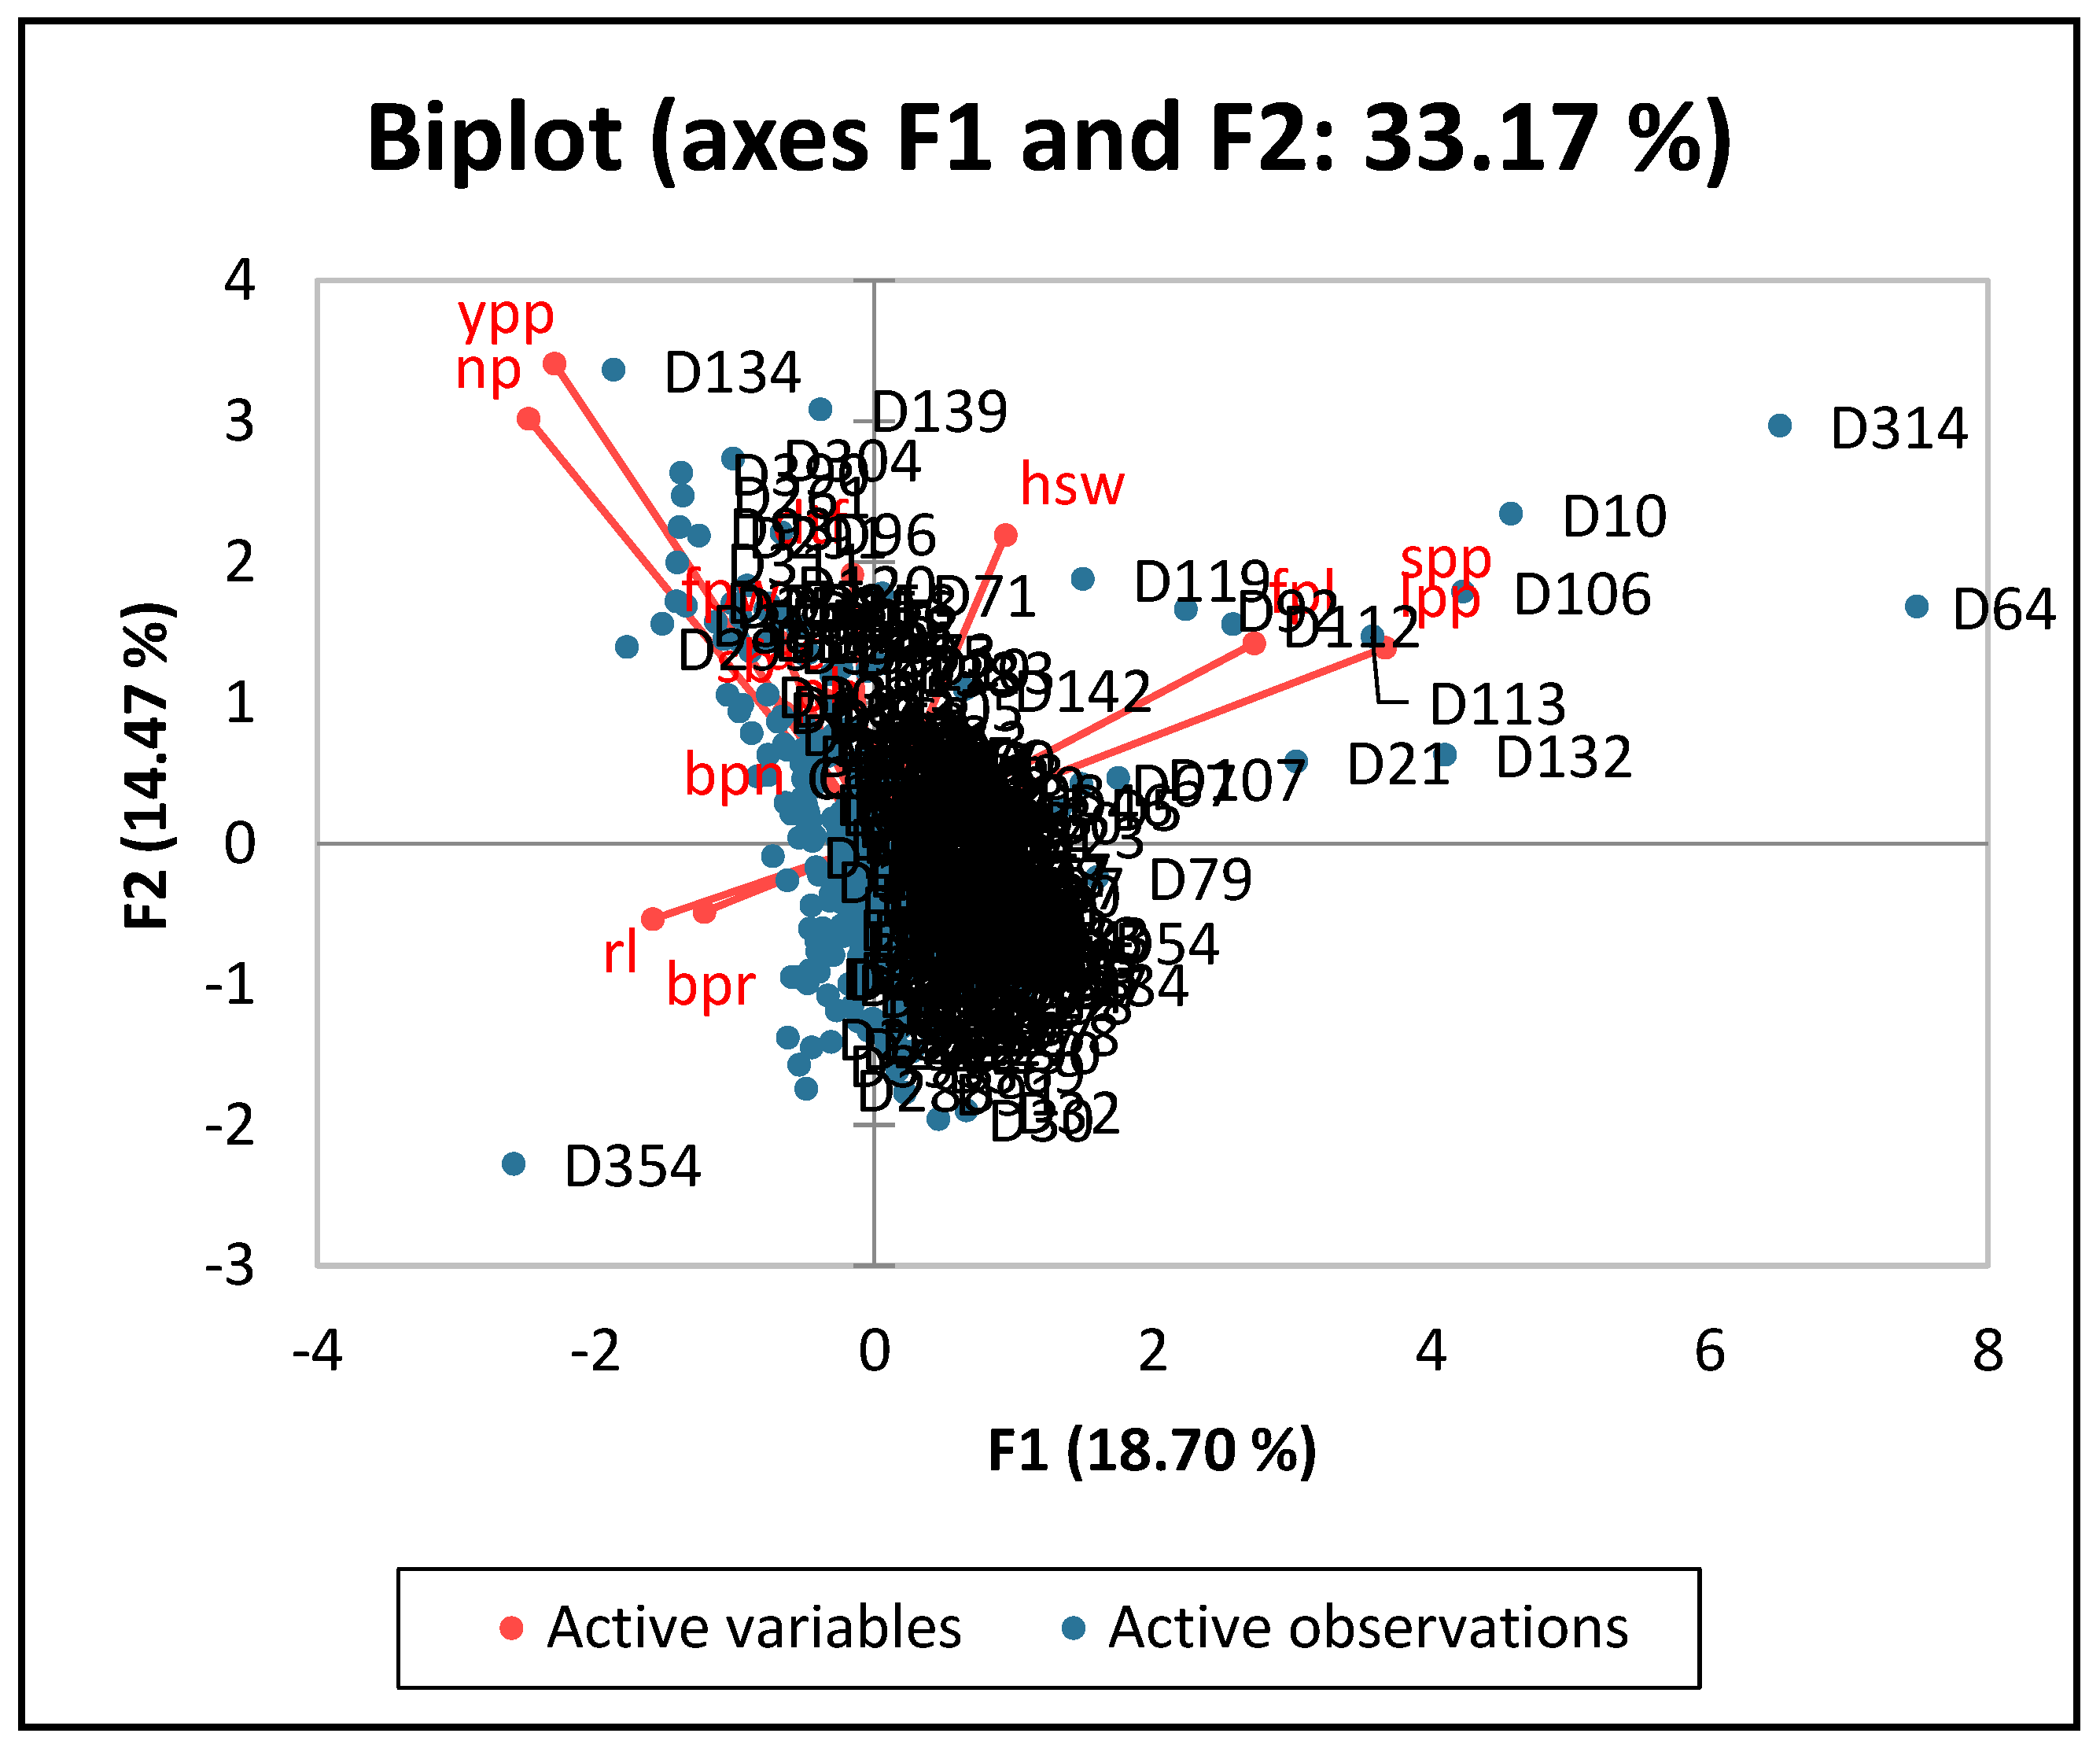
3.2.3. Principal Component Analysis of the Quantitative Traits of Lablab Accessions
3.2.4. Cluster Analysis of Selected Quantitative Traits of Lablab Accessions
4. Discussion
4.1. Qualitative Traits
4.2. Quantitative Characters
5. Conclusions
Author Contributions
Funding
Institutional Review Board Statement
Informed Consent Statement
Data Availability Statement
Acknowledgments
Conflicts of Interest
Appendix A

| 1. Vegetative | |
| 1.1 Emerging cotyledon | 1 = White 2 = Green 3 = Purple |
| 1.2 Hypocotyl colour | 1 = Green 2 = Purple |
| 1.3 Stem pigmentation | 0 = No pigment 3 = Localized to nodes 5 = Extensive 7 = solid |
| 1.4 Leaf vein colour | 1 = Green 2 = Purple |
| 1.5 Leaf colour | 1 = Pale green 3 = Green 5 = Dark green 7 = Purple 9 = Dark Purple |
| 1.6 Leaf hairiness | 0 = Glabrous 3 = Low pubescent 5 = Moderately pubescent 7 = Highly pubescent |
| 1.7 Leaf shape | 1 = Round 3 = Ovate |
| 1.8 Growth habit | 1 = Determinate 2 = Semi determinate 3 = Indeterminate |
| 1.9 Primary branches | Average from 5 randomly chosen plants |
| 1.10 Secondary branches | Average from 5 randomly chosen plants |
| 1.11 Branch orientation | 3 = Short and erect lateral branches 5 = Branches tending to be perpendicular to main stem 7 = First lateral branches long and spreading over ground |
| 2. Inflorescence | |
| 2.1 Days to 50% flowering | Days from sowing to 50 % of the plant produce flower |
| 2.2 Flower bud colour | 1 = white 2 = Cream 3 = Light Yellow 4 = Pink 5 = Purple |
| 2.3 Standard petal colour | 1 = white 2 = Cream 3 = Light Yellow 4 = Pink 5 = Purple |
| 2.4 Wing petal colour | 1 = white 2 = Cream 3 = Light Yellow 4 = Pink 5 = Purple |
| 2.5 Keel petal colour | 1 = white 2 = Cream 3 = Light Yellow 4 = Pink 5 = Purple |
| 2.6 Number of flower buds/raceme | Average of 5 randomly chosen plants |
| 2.7 Number of buds/node | Average of 5 randomly chosen plants |
| 2.8 Number of racemes/plant | Average of 5 randomly chosen plants |
| 2.9 Raceme length | Average of 5 randomly chosen plants (cm) |
| 2.10 Raceme position/emergence | 3 = Within foliage 5 = Intermediate 7 = complete emergence from leaf canopy |
| 3. Fruit | |
| 3.1 Fresh pod curvature | 0 = Straight 3 = Slightly curved 5 = Curved |
| 3.2 Fresh pod pubescence | 0 = Glabrous 3 = Moderately pubescent 5 = Pubescent |
| 3.3 Fresh pod fragrance | 0 = Absent 1 = Low 2 = Medium 3 = high |
| 3.4 Fresh pod length | Average of 5 randomly chosen pods (cm ) |
| 3.5 Fresh pod width | Average of 5 randomly chosen pods (cm ) |
| 3.6 Fresh pod constriction | 0 = No constriction 3 = Slightly constricted 5 = constricted |
| 3.7 Fresh pod colour | 1 = White 2 = Cream 3 = Green 4 = Green with purple suture 5 = Purple 6= Dark Purple 7 = Red |
| 3.8 Fresh pod attachment | 1 = Erect, 2 = Intermediate, 3 = Pendant |
| 3.9 Number of fresh pods/plant | Average number of pods from 10 randomly chosen plants |
| 3.10 Number of locules/ fresh pod | Average of 5 randomly chosen pods |
| 3.11 Number of seeds/fresh pod | Average of 5 randomly chosen pods |
| 3.12 Pod color at physiological maturity | 3 = Tan 5 = Brown 7 = others (specify) |
| 4. Seed | |
| 4.1 Dry seed colour | 1 = White 2 = Green 3 = Cream 3 = Purple 5 = Brown 6 = Black |
| 4.2 Dry seed hilum colour | 1 = White 2 = Tan 3 = Others (specify) |
| 4.3 Dry seed shape | 1 = Round 2 = Oval 3 = Flat 4 = Others (specify) |
| 4.4 Dry 100 seed weight | Average weight of 100 seeds chosen at random (g) |
| 4.5 Dry seed yield/plant | Average of 5 plants chose (g) |
Appendix B
| S/N | Accession | Place of Origin | S/N | Accession | Place of Origin |
|---|---|---|---|---|---|
| 1 | D139 | Australia | 42 | D350 | China |
| 2 | D56 | Australia | 43 | D68 | China |
| 3 | D61 | Australia | 44 | D165 | Columbia |
| 4 | D62 | Australia | 45 | D112 | Denmark |
| 5 | D73 | Australia | 46 | D353 | ECHO Collection |
| 6 | D74 | Australia | 47 | D354 | ECHO Collection |
| 7 | D75 | Australia | 48 | D355 | ECHO Collection |
| 8 | D76 | Australia | 49 | D356 | ECHO Collection |
| 9 | D77 | Australia | 50 | D358 | ECHO Collection |
| 10 | D78 | Australia | 51 | D359 | ECHO Collection |
| 11 | D79 | Australia | 52 | D360 | ECHO Collection |
| 12 | D80 | Australia | 53 | D361 | ECHO Collection |
| 13 | D81 | Australia | 54 | D362 | ECHO Collection |
| 14 | D83 | Australia | 55 | D363 | ECHO Collection |
| 15 | D84 | Australia | 56 | D365 | ECHO Collection |
| 16 | D85 | Australia | 57 | D367 | ECHO Collection |
| 17 | D128 | Bangladesh | 58 | D368 | ECHO Collection |
| 18 | D28 | Bangladesh | 59 | D369 | ECHO Collection |
| 19 | D30 | Bangladesh | 60 | D370 | ECHO Collection |
| 20 | D31 | Bangladesh | 61 | D371 | ECHO Collection |
| 21 | D32 | Bangladesh | 62 | D372 | ECHO Collection |
| 22 | D34 | Bangladesh | 63 | D373 | ECHO Collection |
| 23 | D35 | Bangladesh | 64 | D374 | ECHO Collection |
| 24 | D37 | Bangladesh | 65 | D375 | ECHO Collection |
| 25 | D38 | Bangladesh | 66 | D376 | ECHO Collection |
| 26 | D39 | Bangladesh | 67 | D377 | ECHO Collection |
| 27 | D40 | Bangladesh | 68 | D378 | ECHO Collection |
| 28 | D41 | Bangladesh | 69 | D379 | ECHO Collection |
| 29 | D43 | Bangladesh | 70 | D381 | ECHO Collection |
| 30 | D45 | Bangladesh | 71 | D382 | ECHO Collection |
| 31 | D46 | Bangladesh | 72 | D383 | ECHO Collection |
| 32 | D47 | Bangladesh | 73 | D384 | ECHO Collection |
| 33 | D48 | Bangladesh | 74 | D385 | ECHO Collection |
| 34 | D49 | Bangladesh | 75 | D387 | ECHO Collection |
| 35 | D50 | Bangladesh | 76 | D390 | ECHO Collection |
| 36 | D51 | Bangladesh | 77 | D142 | Ethiopia |
| 37 | D55 | Cambodia | 78 | D143 | Ethiopia |
| 38 | D64 | Cambodia | 79 | D144 | Ethiopia |
| 39 | D65 | Cambodia | 80 | D145 | Ethiopia |
| 40 | D127 | China | 81 | D146 | Ethiopia |
| 41 | D347 | China | 82 | D147 | Ethiopia |
| 83 | D148 | Ethiopia | 126 | D131 | India |
| 84 | D150 | Ethiopia | 127 | D132 | India |
| 85 | D152 | Ethiopia | 128 | D133 | India |
| 86 | D164 | Ethiopia | 129 | D134 | India |
| 87 | D58 | Ethiopia | 130 | D188 | India |
| 88 | D290 | Farmers collection(Tanzania) | 131 | D193 | India |
| 89 | D291 | Farmers collection(Tanzania) | 132 | D194 | India |
| 90 | D292 | Farmers collection(Tanzania) | 133 | D197 | India |
| 91 | D293 | Farmers collection(Tanzania) | 134 | D199 | India |
| 92 | D294 | Farmers collection(Tanzania) | 135 | D201 | India |
| 93 | D295 | Farmers collection(Tanzania) | 136 | D206 | India |
| 94 | D296 | Farmers collection(Tanzania) | 137 | D212 | India |
| 95 | D297 | Farmers collection(Tanzania) | 138 | D215 | India |
| 96 | D298 | Farmers collection(Tanzania) | 139 | D220 | India |
| 97 | D299 | Farmers collection(Tanzania) | 140 | D229 | India |
| 98 | D300 | Farmers collection(Tanzania) | 141 | D240 | India |
| 99 | D302 | Farmers collection(Tanzania) | 142 | D241 | India |
| 100 | D303 | Farmers collection(Tanzania) | 143 | D242 | India |
| 101 | D304 | Farmers collection(Tanzania) | 144 | D243 | India |
| 102 | D305 | Farmers collection(Tanzania) | 145 | D244 | India |
| 103 | D306 | Farmers collection(Tanzania) | 146 | D245 | India |
| 104 | D308 | Farmers collection(Tanzania) | 147 | D246 | India |
| 105 | D310 | Farmers collection(Tanzania) | 148 | D247 | India |
| 106 | D311 | Farmers collection(Tanzania) | 149 | D248 | India |
| 107 | D312 | Farmers collection(Tanzania) | 150 | D249 | India |
| 108 | D313 | Farmers collection(Tanzania) | 151 | D250 | India |
| 109 | D314 | Farmers collection(Tanzania) | 152 | D251 | India |
| 110 | D315 | Farmers collection(Tanzania) | 153 | D252 | India |
| 111 | D391 | Farmers collection(Tanzania) | 154 | D253 | India |
| 112 | D392 | Farmers collection(Tanzania) | 155 | D254 | India |
| 113 | D393 | Farmers collection(Tanzania) | 156 | D255 | India |
| 114 | D397 | Farmers collection(Tanzania) | 157 | D256 | India |
| 115 | D166 | Germany | 158 | D257 | India |
| 116 | D167 | Germany | 159 | D258 | India |
| 117 | HA3-1 | India | 160 | D259 | India |
| 118 | HA3-2 | India | 161 | D260 | India |
| 119 | HA-4-1 | India | 162 | D261 | India |
| 120 | HA-4-2 | India | 163 | D262 | India |
| 121 | D111 | India | 164 | D263 | India |
| 122 | D119 | India | 165 | D264 | India |
| 123 | D120 | India | 166 | D265 | India |
| 124 | D122 | India | 167 | D266 | India |
| 125 | D126 | India | 168 | D267 | India |
| 169 | D268 | India | 212 | D26 | Lao People’s Democratic Republic |
| 170 | D269 | India | 213 | D69 | Malaysia |
| 171 | D270 | India | 214 | D70 | Malaysia |
| 172 | D271 | India | 215 | D21 | Philippines |
| 173 | D135 | India | 216 | D22 | Philippines |
| 174 | D181 | India | 217 | D24 | Philippines |
| 175 | D272 | India | 218 | D116 | South Africa |
| 176 | D273 | India | 219 | D117 | South Africa |
| 177 | D274 | India | 220 | D104 | Tanzania |
| 178 | D275 | India | 221 | D105 | Tanzania |
| 179 | D276 | India | 222 | D106 | Tanzania |
| 180 | D277 | India | 223 | D107 | Tanzania |
| 181 | D278 | India | 224 | D108 | Tanzania |
| 182 | D279 | India | 225 | D109 | Tanzania |
| 183 | D280 | India | 226 | D156 | Tanzania |
| 184 | D281 | India | 227 | D158 | Tanzania |
| 185 | D282 | India | 228 | D159 | Tanzania |
| 186 | D283 | India | 229 | D160 | Tanzania |
| 187 | D284 | India | 230 | D161 | Tanzania |
| 188 | D285 | India | 231 | D162 | Tanzania |
| 189 | D286 | India | 232 | D163 | Tanzania |
| 190 | D287 | India | 233 | D169 | Tanzania |
| 191 | D288 | India | 234 | D170 | Tanzania |
| 192 | D289 | India | 235 | D172 | Tanzania |
| 193 | D52 | India | 236 | D173 | Tanzania |
| 194 | D53 | India | 237 | D71 | Tanzania |
| 195 | D54 | India | 238 | D72 | Tanzania |
| 196 | D130 | Indonesia | 239 | D95 | Tanzania |
| 197 | D25 | Indonesia | 240 | D1 | Thailand |
| 198 | D174 | Japan | 241 | D10 | Thailand |
| 199 | D176 | Japan | 242 | D11 | Thailand |
| 200 | D183 | Japan | 243 | D13 | Thailand |
| 201 | D185 | Japan | 244 | D14 | Thailand |
| 202 | ELDO-KT-1 | Kenya | 245 | D15 | Thailand |
| 203 | ELDO-KT-2 | Kenya | 246 | D16 | Thailand |
| 204 | D129 | Kenya | 247 | D17 | Thailand |
| 205 | D138 | Kenya | 248 | D19 | Thailand |
| 206 | D168 | Kenya | 249 | D2 | Thailand |
| 207 | D346 | Kenya | 250 | D20 | Thailand |
| 208 | D348 | Kenya | 251 | D3 | Thailand |
| 209 | D349 | Kenya | 252 | D4 | Thailand |
| 210 | D351 | Kenya | 253 | D5 | Thailand |
| 211 | D352 | Kenya | 254 | D6 | Thailand |
| 255 | D7 | Thailand | |||
| 256 | D8 | Thailand | |||
| 257 | D9 | Thailand | |||
| 258 | D319 | TPRI Collection | |||
| 259 | D343 | TPRI Collection | |||
| 260 | D121 | Uganda | |||
| 261 | D113 | Ukraine | |||
| 262 | D102 | Unknown | |||
| 263 | D86 | Unknown | |||
| 264 | D88 | Unknown | |||
| 265 | D89 | Unknown | |||
| 266 | D90 | Unknown | |||
| 267 | D91 | Unknown | |||
| 268 | D92 | Unknown | |||
| 269 | D93 | Unknown | |||
| 270 | D94 | Unknown | |||
| 271 | D96 | Unknown | |||
| 272 | D98 | Unknown | |||
| 273 | D66 | Uzbekistan | |||
| 274 | D67 | Vietnam | |||
| 275 | D124 | Zambia | |||
| 276 | D125 | Zambia | |||
| 277 | D123 | Zimbabwe |
References
- FAO; UNICEF; WFP; WHO. Transforming Food Systems for Affordable Healthy Diets; FAO: Rome, Italy, 2021; p. 240.
- Li, X.; Yadav, R.; Siddique, K.H.M. Neglected and Underutilized Crop Species: The Key to Improving Dietary Diversity and Fighting Hunger and Malnutrition in Asia and the Pacific. Front. Nutr. 2020, 7, 593711. [Google Scholar] [CrossRef] [PubMed]
- Kilonzi, S.M. Physicochemical and Functional Characterisation of Three Lablab Bean (Lablab purpureus L.(Sweet)) Varieties Grown in Kenya. Ph.D. Dissertation, Jomo Kenyatta University of Agriculture and Technology, Nairobi, Kenya, 2020. Available online: http://localhost/xmlui/handle/123456789/5409 (accessed on 4 September 2022).
- Purwanti, E.; Prihanta, W.; Fauzi, A. Nutritional Content Characteristics of Dolichos lablab L. Accessions in Effort to Investigate Functional Food Source. In Proceedings of the 6th International Conference on Community Development (ICCD 2019), Bandar Seri Begawan, Indonesia, October 2019; Available online: https://www.atlantis-press.com/proceedings/iccd-19/125919047 (accessed on 4 September 2022).
- Letting, F.K.; Venkataramana, P.B.; Ndakidemi, P.A. Breeding potential of lablab [Lablab purpureus (L.) Sweet]: A Review on Characterization and Bruchid Studies towards Improved Production and Utilization in Africa. Genet. Resour. Crop Evol. 2021, 68, 3081–3101. [Google Scholar] [CrossRef]
- Kimno, S.; Kinyua, M.; Pkania, K.; Emmy, C. Evaluation of Proximate and Mineral Composition of Mutant Dolichos Lablab (Lablab purpureus L. Sweet) Accessions in Kenya. J. Exp. Agric. Int. 2021, 43, 72–80. [Google Scholar] [CrossRef]
- Sulaiman, A.; Lawal, A. A proximate, mineral composition and anti-nutritional factors of the aerial parts of Lablab purpureus (L.) sweet. Bayero J. Pure Appl. Sci. 2018, 11, 37–40. [Google Scholar] [CrossRef]
- Naeem, M.; Shabbir, A.; Ansari, A.A.; Aftab, T.; Khan, M.M.A.; Uddin, M. Hyacinth bean (Lablab purpureus L.)–An underutilised crop with future potential. Sci. Hortic. 2020, 272, 109551. [Google Scholar] [CrossRef]
- Kilonzi, S.M.; Makokha, A.O.; Kenji, G.M. Physical characteristics, proximate composition and anti-nutritional factors in grains of lablab bean (Lablab purpureus) genotypes from Kenya. J. Appl. Biosci. 2017, 114, 11289–11298. [Google Scholar] [CrossRef]
- Morrison, M.M. Nutrient Composition of Cooked Lablab Bean Varieties for Improving Nutrition and Food Security in Tanzania. Ph.D. Dissertation, Sokoine University of Agriculture, Morogoro, Tanzania, 2019. Available online: https://www.suaire.sua.ac.tz/handle/123456789/3045 (accessed on 4 September 2022).
- Tulu, A.; Yadav, K.R.; Geleti, D. Supplementary value of two Lablab purpureus cultivars and concentrate mixture to natural grass hay basal diet based on feed intake, digestibility, growth performance and net return of Horro sheep. Int. J. Livest. Prod. 2018, 9, 140–150. [Google Scholar] [CrossRef]
- Ishiaku, Y.; Hassan, M.; Tanko, R.; Abdu, S.; Musa, A. Feed Quality of Silage made fromForage Sorghum (Sorghum almum Parodi) and Lablab (Lablab purpureus L. Sweet) in Shika, Nigeria. Niger. J. Anim. Sci. Technol. 2020, 3, 91–95. [Google Scholar]
- Wangila, A.J.; Gachuiri, C.K.; Muthomi, J.W.; Ojiem, J.O. Biomass yield and quality of fodder from selected varieties of lablab. Online J. Anim. Feed. Res. 2021, 11, 28–35. [Google Scholar] [CrossRef]
- Bekele, B.; Ademe, D.; Gemi, Y.; Habtemariam, T. Evaluation of Intercropping Legume Covers with Maize on Soil Moisture Improvement in Misrak Azerinet Berbere woreda, SNNPR, Ethiopia. Water Conserv. Sci. Eng. 2021, 6, 145–151. [Google Scholar] [CrossRef]
- Nord, A.; Miller, N.R.; Mariki, W.; Drinkwater, L.; Snapp, S. Investigating the diverse potential of a multi-purpose legume, Lablab purpureus (L.) Sweet, for smallholder production in East Africa. PLoS ONE 2020, 15, e0227739. [Google Scholar] [CrossRef] [PubMed]
- Rai, K.K.; Rai, N.; Pandey-Rai, S. Unlocking Pharmacological and Therapeutic Potential of Hyacinth Bean (Lablab purpureus L.). In Role of OMICS Based Biology, Biotic and Abiotic Elicitors; IntechOpen: London, UK, 2021. [Google Scholar] [CrossRef]
- Liu, Y.-M.; Shahed-Al-Mahmud, M.; Chen, X.; Chen, T.-H.; Liao, K.-S.; Lo, J.M.; Wu, Y.-M.; Ho, M.-C.; Wu, C.-Y.; Wong, C.-H. A carbohydrate-binding protein from the edible Lablab beans effectively blocks the infections of influenza viruses and SARS-CoV-2. Cell Rep. 2020, 32, 108016. [Google Scholar] [CrossRef] [PubMed]
- Jibat, G.; Gerkabo, H. Effects of green manure legumes and their termination time on yield of maize and soil chemical properties. Arch. Agron. Soil Sci. 2021, 67, 1–13. [Google Scholar] [CrossRef]
- Okumu, O.O.; Muthomi, J.; Ojiem, J.; Narla, R.; Nderitu, J. Effect of Lablab Green Manure on Population of Soil Microorganisms and Establishment of Common Bean (Phaseolus vulgaris L.). Am. J. Agric. Sci. 2018, 5, 44–54. [Google Scholar]
- Missanga, J.S.; Venkataramana, P.B.; Ndakidemi, P.A. Recent developments in Lablab purpureus genomics: A focus on drought stress tolerance and use of genomic resources to develop stress-resilient varieties. Legume Sci. 2021, 3, e99. [Google Scholar] [CrossRef]
- Grotelüschen, K. Lablab purpureus (L.) Sweet: A Promising Multipurpose Legume for Enhanced Drought Resistance and Improved Household Nutritional Status in Smallholder Farming Systems of Eastern Kenya. Ph.D. Dissertation, Georg-August University, Göttingen, Germany, 2014. [Google Scholar]
- Forsythe, C. Exploring the Viability of Re-Introducing Lablab purpureus (L.) Sweet as a Multifunctional Legume in Northern Tanzania. Ph.D. Dissertation, Swedish University of Agricultural Sciences, Alnarp, Sweden, 2019. [Google Scholar]
- Letting, F.K.; Venkataramana, P.B.; Ndakidemi, P.A. Farmers’ Participatory Plant Selection of Lablab [Lablab purpureus (L.) Sweet] in Tanzania. Front. Plant Sci. 2022, 13, 1429. [Google Scholar] [CrossRef]
- Miller, N.; Mariki, W.; Nord, A.; Snapp, S. Cultivar selection and management strategies for Lablab purpureus (L.) Sweet in Africa. In Handbook of Climate Change Resilience; Filho, W.L., Ed.; Springer Nature Switzerland AG: Gewerbestrasse, Switzerland, 2018; Volume 2, pp. 1–14. [Google Scholar]
- Morris, J.B. Morphological and Reproductive Characterization in Hyacinth Bean, Lablab purpureus (L.) Sweet Germplasm with Clinically Proven Nutraceutical and Pharmaceutical Traits for Use as a Medicinal Food. J. Diet. Suppl. 2009, 6, 263–279. [Google Scholar] [CrossRef] [PubMed]
- Islam, M.S.; Rahman, M.M.; Hossain, T. Physico-morphological variation in hyacinth bean [Lablab purpureus (L.) Sweet]. Bangladesh J. Agric. Res. 2010, 35, 431–438. [Google Scholar] [CrossRef][Green Version]
- Shrikrishna, P.; Ramesh, S. Visually assayable morphological descriptors-based establishment of distinctiveness [D], uniformity [U] and stability [S] of dolichos bean (Lablab purpureus L. Sweet var. Lignosus) genotypes. Plant Genet. Resour. 2020, 18, 1–4. [Google Scholar] [CrossRef]
- Kumar, A. Quantitative analysis of some germplasms of lablab bean in Uttar Pradesh. Int. J. Environ. Agric. Biotechnol. 2017, 2, 238643. [Google Scholar] [CrossRef]
- Vishnu, V.S.; Radhamany, P.M. Assessment of variability in Lablab purpureus (L.) Sweet germplasm based on quantitative morphological and biochemical traits. Genet. Resour. Crop Evol. 2022, 69, 1535–1546. [Google Scholar] [CrossRef]
- Ram, K.C.; Joshi, B.; Dahal, S. Diversity Analysis and Physico-Morphlogical Characteritics of Indigenous Germplasm of Lablab Bean. J. Nepal Agric. Res. Counc. 2016, 2, 15. [Google Scholar] [CrossRef][Green Version]
- Ngure, D.; Kinyua, M.; Kiplagat, O. Morphological and microsatellite characterization of improved Lablab purpureus genotypes. J. Plant Breed. Crop Sci. 2021, 13, 23–34. [Google Scholar]
- Chawe, K. Morphological Screening and Farmers’ Acceptability of Selected Lablab Bean (Lablab purpureus) Accessions in Moshi District, Tanzania. Ph.D. Dissertation, NM-AIST, Arusha, Tanzania, 2019. Available online: https://dspace.nm-aist.ac.tz/bitstream/handle/20.500.12479/245/MSc_LiSE_Kissa_Chawe_2019.pdf?sequence=1&isAllowed=y (accessed on 4 September 2022).
- Massawe, P.I.; Mtei, K.M.; Munishi, L.K.; Ndakidemi, P.A. Improving soil fertility and crops yield through maize-legumes (common bean and Dolichos lablab) intercropping systems. J. Agric. Sci. 2016, 8, 148–163. [Google Scholar] [CrossRef]
- Meya, A.; Ndakidemi, P.; Mtei, K.; Swennen, R.; Merckx, R. Optimizing Soil Fertility Management Strategies to Enhance Banana Production in Volcanic Soils of the Northern Highlands, Tanzania. Agronomy 2020, 10, 289. [Google Scholar] [CrossRef]
- International FertilizerI Development Centre IFDC. Tanzania Fertilizer Assessment; International FertilizerI Development Centre IFDC: Dar es Salaam, Tanzania, 2012. [Google Scholar]
- IASRI. Augmented Block Designs. Available online: http://www.iasri.res.in/design/AugmentedDesigns/ (accessed on 6 June 2019).
- Byregowda, M.; Girish, G.; Ramesh, S.; Mahadevu, P.; Keerthi, C. Descriptors of Dolichos bean (Lablab purpureus L.). J. Food Legumes 2015, 28, 203–214. [Google Scholar]
- R Core Team. R: A Language and Environment for Statistical Computing; R Core Team: Vienna, Austria, 2013. [Google Scholar]
- Sarif, H.; Rafii, M.; Ramli, A.; Yusuff, O.; Musa, H.; Rahim, H.; Mohd, Z.; Chukwu, S.; Samuel, Z. Genetic diversity and variability among pigmented rice germplasm using molecular marker and morphological traits. Biotechnol. Biotechnol. Equip. 2020, 34, 747–762. [Google Scholar] [CrossRef]
- Mat Sulaiman, N.N.; Rafii, M.; Duangjit, J.; Izan, S.; Phumichai, C.; Yusuff, O.; Datta, D.; Musa, I. Genetic Variability of Eggplant Germplasm Evaluated under Open Field and Glasshouse Cropping Conditions. Agronomy 2020, 10, 436. [Google Scholar] [CrossRef]
- Govindaraj, M.; Vetriventhan, M.; M, S. Importance of Genetic Diversity Assessment in Crop Plants and Its Recent Advances: An Overview of Its Analytical Perspectives. Genet. Res. Int. 2015, 2, 431487. [Google Scholar] [CrossRef]
- Fu, Y.-B. Understanding crop genetic diversity under modern plant breeding. Theor. Appl. Genet. 2015, 128, 2131–2142. [Google Scholar] [CrossRef]
- Vaijayanthi, P.V.; Ramesh, S.; Gowda, M.; Mohan Rao, A.; Gowda, J.; Ramappa, H.K.; Keerthi, C.M.; Rajendra Prasad, B.S. Development and Validation of a Core Set of Dolichos Bean Germplasm. Int. J. Veg. Sci. 2014, 21, 150527094502000. [Google Scholar] [CrossRef]
- Jennings, J.; Foster, J. Legume Structure and Morphology. In Forages: The Science of Grassland Agriculture, 7th ed.; Kenneth, M.C., Moore, J., Nelson, C.J., Redfearn, D.D., Eds.; John Wiley and Sons Ltd: Hoboken, NJ, USA, 2020; Volume 2, pp. 51–64. [Google Scholar]
- Vaijayanthi, P.; Ramesh, S.; Gowda, M.B.; Rao, A.M.; Keerthi, C.; Reena, G. Genetic variability for morpho-metric traits in Dolichos bean (Lablab purpureus L. Sweet) germplasm. J. Food Legumes 2015, 28, 5–10. [Google Scholar] [CrossRef][Green Version]
- Jagadeesh, B.; CS, B.M.; Girish, G. Screening of Dolichos germplasm for pod borers and bruchids. Environ. Ecol. 2008, 26, 2288–2290. [Google Scholar]
- Keerthi, C.; Ramesh, S.; Byregowda, M.; Rao, A.M.; Prasad, B.R.; Vaijayanthi, P. Genetics of growth habit and photoperiodic response to flowering time in dolichos bean (Lablab purpureus (L.) Sweet). J. Genet. 2014, 93, 203–206. [Google Scholar] [CrossRef] [PubMed]
- Whitbread, A.; Ayisi, K.; Mabapa, P.; Odhiambo, J.; Maluleke, N.; Pengelly, B.C. Evaluating Lablab purpureus (L.) Sweet germplasm to identify short-season accessions suitable for crop and livestock farming systems in southern Africa. Afr. J. Range Forage Sci. 2011, 28, 21–28. [Google Scholar] [CrossRef]
- Krylova, E.; Khlestkina, E.; Burlyaeva, M.; Vishnyakova, M. Determinate growth habit of grain legumes: Role in domestication and selection, genetic control. Ecol. Genet. 2020, 18, 43–58. [Google Scholar] [CrossRef]
- Keerthi, C.; Ramesh, S.; Byregowda, M.; Rao, A.M.; Rajendra Prasad, B.S.; Vaijayanthi, P.V. Further evidence for the genetic basis of qualitative traits and their linkage relationships in dolichos bean (Lablab purpureus L.). J. Genet. 2016, 95, 89–98. [Google Scholar] [CrossRef]
- Kamau, E.; Kinyua, M.; Waturu, C.; Karanja, D. Genotypic variability, heritability and path analysis of yield components of determinate lablab (Lablab purpureus (L.) Sweet) inbred lines in Kenya. Afr. J. Plant Sci. 2021, 15, 266–276. [Google Scholar] [CrossRef]
- Ewansiha, S.; Chiezey, U.F.; Tarawali, S.; Iwuafor, E. Morpho-phenological variation in Lablab purpureus. Trop. Grassl. 2007, 41, 277–284. [Google Scholar]
- Uday, K.H.R.; Gowda, B.M.; Ramesh, S.; Vasundhara, M. Characterization and Identification of Dolichos Bean (Lablab purpureus L. sweet) Recombinant Inbred Lines (RIL) with High Pod Yield and High Pod Fragrance. Int. J. Pure Appl. Biosci. 2017, 5, 428–436. [Google Scholar] [CrossRef]
- Patil, A.S.; Popovsky, S.; Levy, Y.; Chu, Y.; Clevenger, J.; Ozias-Akins, P.; Hovav, R. Genetic insight and mapping of the pod constriction trait in Virginia-type peanut. BMC Genet 2018, 19, 93. [Google Scholar] [CrossRef] [PubMed]
- Chang, H.-X.; Hartman, G.L. Characterization of Insect Resistance Loci in the USDA Soybean Germplasm Collection Using Genome-Wide Association Studies. Front. Plant Sci. 2017, 8, 670. [Google Scholar] [CrossRef] [PubMed]
- War, A.R.; Paulraj, M.G.; Ahmad, T.; Buhroo, A.A.; Hussain, B.; Ignacimuthu, S.; Sharma, H.C. Mechanisms of plant defense against insect herbivores. Plant Signal Behav. 2012, 7, 1306–1320. [Google Scholar] [CrossRef] [PubMed]
- Singh, A.; Abhilash, P. Varietal dataset of nutritionally important Lablab purpureus (L.) sweet from Eastern Uttar Pradesh, India. Data Brief 2019, 24, 103935. [Google Scholar] [CrossRef] [PubMed]
- Maass, B.L.; Usongo, M.F. Changes in seed characteristics during the domestication of the lablab bean (Lablab purpureus (L.) Sweet: Papilionoideae). Aust. J. Agric. Res. 2007, 58, 9–19. [Google Scholar] [CrossRef]
- Serpico, D. Beyond quantitative and qualitative traits: Three telling cases in the life sciences. Biol. Philos. 2020, 35, 34. [Google Scholar] [CrossRef]
- Savitha, B.N.; Ravikumar, R.L.; Shinde, D.G. Characterization and genetic diversity analysis in field bean [Lablab purpureus (L.) Sweet] collections of Karnataka. J. Food Legumes 2012, 25, 18–24. [Google Scholar]
- Kumar, U.; Prasad, K.; Tiwari, R.; Ghosh, S.; Sinha, B.; Yadav, L. Estimation of Genetic Variability and Genetic Divergence in Dolichos Bean [Lablab purpureus (L.) Sweet.] Genotypes. Legume Res. Int. J. 2021, 44, 916–920. [Google Scholar] [CrossRef]
- Parmar, A.; Singh, A.; Dhillon, N.; Jamwal, M. Genetic variability of morphological and yield traits in Dolichos bean (Lablab purpureus L.). Afr. J. Agric. Res. 2013, 8, 1022–1027. [Google Scholar] [CrossRef]
- Hadavani, J.K.; Mehta, D.R.; Lata, J.R.; Ghetiya, K.P. Genetic Variability Parameters in Indian Bean (Lablab purpureus L.). Int. J. Pure Appl. Biosci. 2018, 6, 164–168. [Google Scholar] [CrossRef]
- Nkhata, W.; Shimelis, H.; Melis, R.; Chirwa, R.; Mzengeza, T.; Mathew, I.; Shayanowako, A. Population structure and genetic diversity analyses of common bean germplasm collections of East and Southern Africa using morphological traits and high-density SNP markers. PLoS ONE 2020, 15, e0243238. [Google Scholar] [CrossRef] [PubMed]
- Gadissa, F.; Abebe, M.; Bekele, T. Agro-morphological traits-based genetic diversity assessment in Ethiopian barley (Hordeum vulgare L.) landrace collections from Bale highlands, Southeast Ethiopia. Agric. Food Secur. 2021, 10, 58. [Google Scholar] [CrossRef]
- Singh, S.; Rajan, S.; Kumar, D.; Soni, V.K. Genetic Diversity Assessment in Dolichos Bean (Lablab purpureus L.) Based on Principal Component Analysis and Single Linkage Cluster Analysis. Legume Res. Int. J. 2021, 1, LR-4561. [Google Scholar] [CrossRef]
- Shibli, M.; Rasul, M.G.; Islam, A.; Saikat, M.; Haque, M.M. Genetic diversity of country bean (Lablab purpureus) genotypes collected from the coastal regions of Bangladesh. J. Hortic. Postharvest Res. 2021, 4, 93–104. [Google Scholar] [CrossRef]
- Ahmadizadeh, M.; Felenji, H. Evaluating Diversity among Potato Cultivars Using Agro-Morphological and Yield Components in Fall Cultivation of Jiroft Area. Am. Eurasian J. Agric. Environ. Sci. 2011, 11, 655–662. [Google Scholar]
- Chinnegowda, V.S.; Ganapathy, K.N.; Gowda, M.B.; Gowda, P.H.R.; Mahadevu, P.; Govindappa, G.; Chandrashekar, A. Variability and Genetic Structure among Lablab Bean Collections of India and their Relationship with Exotic Accessions. Vegetos Int. J. Plant Res. 2013, 26, 121. [Google Scholar] [CrossRef]
- Magalingam, V.; Yassin, M.; Selvan, R. Genetic Variability and Character Association in Dolichos Bean. SAARC J. Agric. 2014, 11, 161–171. [Google Scholar] [CrossRef]
- Raj, N.; Anitha, P.; Pradeepkumar, T.; Jose, D.; Beena, V.; Laly, C. Genetic Divergence Analysis in Dolichos Bean (Lablab purpureus var. typicus). Res. J. Agric. Sci. 2021, 12, 195–199. [Google Scholar]


| Trait | Range | Mean | GCV | PCV | hBS | GAM |
|---|---|---|---|---|---|---|
| Number of primary branches | 0.6 (D302)–3.02 (D67) | 1.7 ± 0.46 | 14.2 | 23.41 | 36.79 | 17.77 |
| Days to 50% flowering | 44.06 (D264)–180.56 (D113) | 111.1 ± 33.69 | 29.64 | 29.83 | 98.71 | 60.75 |
| Number of secondary branches | 6.94 (D117)–42.37 (D26) | 17.22 ± 5.61 | 29.62 | 35.01 | 71.61 | 51.72 |
| Number of buds per node | 1.57 (D107)–3.27 (D299) | 2.47 ± 0.47 | 14.88 | 18.73 | 63.14 | 24.4 |
| Number of buds per raceme | 6.03 (D54)–20.21 (D393) | 13.62 ± 2.1 | 4.46 | 14.3 | 9.72 | 2.87 |
| Number of Racemes | 4.07 (D148–23.13 (D229) | 11.88 ± 2.99 | 22.07 | 26.34 | 70.22 | 38.16 |
| Fresh pod length (cm) | 4.12 (D145)–11.65 (D119) | 5.55 ± 1.07 | 16.81 | 19.56 | 73.82 | 29.79 |
| Fresh pod width (cm) | 0.69 (D102)–2.8 (D119) | 1.82 ± 0.39 | 7.54 | 13.5 | 31.25 | 8.7 |
| Number of locules per pod | 3 (D354)–6 (D64) | 4.03 ± 0.23 | 5.79 | 5.79 | 100 | 11.94 |
| Raceme length (cm) | 6.37 (D77)–25.11(D281) | 15.35 ± 3.42 | 7.85 | 18.86 | 17.32 | 6.74 |
| Number of pods | 14.67 (D107)–334.34 (D134) | 102.14 ± 55.27 | 46.35 | 52.32 | 78.46 | 84.7 |
| Number of seeds per pod | 3 (D354)–6 (D64) | 4.03 ± 0.23 | 5.79 | 5.79 | 100 | 11.94 |
| Yield per plant (g) | 5.56 (D25)–413.16 (D134) | 112.88 ± 72.21 | 55.99 | 61.41 | 83.12 | 105.31 |
| Hundred seed weight (g) | 18.05 (D393)–47.52 (D92) | 28.79 ± 4.33 | 14.71 | 15.14 | 94.31 | 29.46 |
| Traits | Model (571) | Season (1) | Accessions (276) | Blocks (Season) (18) | Season*Accession (276) | R2 | CV |
|---|---|---|---|---|---|---|---|
| Number of primary branches | 2.08 *** | 153.69 *** | 3.40 *** | 3.27 *** | 0.12 ns | 0.93 | 19.52 |
| Days to 50% flowering | 121.41 *** | 51771.08 *** | 21 *** | 1.27 ns | 15.05 *** | 0.99 | 8.77 |
| Number of secondary branches | 420.85 *** | 4.54 ns | 588.14 *** | 635.08 *** | 56.03 ns | 0.96 | 21.64 |
| Number of buds per node | 0.06 *** | 12.22 *** | 0.06 *** | 0.04 *** | 0 ns | 0.95 | 11.59 |
| Number of buds per raceme | 12.70 *** | 2980.23 *** | 7.87 *** | 8.44 ns | 4.55 ns | 0.92 | 20.27 |
| Number of racemes | 15.83 *** | 64.58 *** | 21.94 *** | 18.28 *** | 6.23 *** | 0.96 | 17.25 |
| Fresh pod length (cm) | 1.16 *** | 3.62 *** | 2.28 *** | 0.05 ns | 0.01 ns | 0.99 | 5.48 |
| Fresh pod width (cm) | 0.04 ns | 6.63 *** | 0.03ns | 0.33 ns | 0.02 ns | 0.43 | 86.69 |
| No. of locules per pod | 0.05 *** | 0 *** | 0.1 *** | 0 ns | 0 *** | 1 | 0 |
| Raceme length (cm) | 1.62 *** | 32.41 *** | 2.18 *** | 2.47 *** | 0.86 ns | 0.91 | 17.94 |
| Number of pods per plant | 6.06 *** | 4.05 *** | 10.58 *** | 1.65 ns | 1.29 ns | 0.97 | 22.92 |
| Number of seeds per pod | 0.05 *** | 0 *** | 0.1 *** | 0 ns | 0 *** | 1 | 0 |
| Yield per plant (g) | 8.99 *** | 52.39 *** | 15.38 *** | 1.57 ns | 1.81 *** | 0.98 | 21.96 |
| Hundred seed weight (g) | 21.96 *** | 765.02 *** | 39.40 *** | 0.34 *** | 1.23 *** | 1 | 1.33 |
| Contrast | |||
|---|---|---|---|
| Traits | Among Accessions (270) | Among Checks (5) | Accessions vs Checks (1) |
| Number of primary branches | 3.11 *** | 3.25 *** | 82.14 *** |
| Days to 50% flowering | 14.60 *** | 36.36 *** | 1657.36 *** |
| Number of secondary branches | 537.86 *** | 340.89 * | 14765.49 *** |
| Number of buds per node | 0.05 *** | 0.13 *** | 0.16 ** |
| Number of buds per raceme | 1 ns | 1.15 ns | 20.29 *** |
| Number of racemes | 4.16 *** | 55.16 *** | 144.6 *** |
| Fresh pod length (cm) | 0.30 *** | 0.40 *** | 0.16 ** |
| Fresh pod width (cm) | 0.02 ns | 0.3 ns | 0.12 ns |
| Number of locules per pod | 0.01 *** | 0 ns | 0.01 *** |
| Raceme length (cm) | 2.01 *** | 5.17 ** | 32.41 *** |
| Number of pods per plant | 8.94 *** | 84.41 *** | 90.77 *** |
| Number of seeds per pod | 0.01 *** | 0 ns | 0.01 *** |
| Yield per plant (g) | 13.86 *** | 97.9 *** | 16.54 *** |
| Hundred seed weight (g) | 0.08 *** | 0.00 *** | 2 ** |
| Traits | PC1 | PC2 | PC3 | PC4 | PC5 |
|---|---|---|---|---|---|
| Number of primary branches | −0.01 | 0.11 | 0.45 | 0.04 | 0.39 |
| Days to 50% flowering | −0.02 | 0.3 | −0.02 | 0.46 | −0.07 |
| Number of secondary branches | −0.09 | 0.15 | 0.25 | 0.37 | 0.3 |
| Number of buds per node | −0.02 | 0.02 | −0.26 | 0.29 | −0.23 |
| Number of buds per raceme | −0.17 | −0.08 | −0.37 | 0.24 | 0.08 |
| Number of racemes | −0.05 | 0.16 | 0.17 | 0.55 | 0.11 |
| Fresh pod length (cm) | 0.38 | 0.22 | 0.13 | −0.14 | −0.18 |
| Fresh pod width (cm) | −0.09 | 0.23 | 0.37 | −0.32 | 0.17 |
| Number of locules per pod | 0.51 | 0.22 | −0.27 | −0.01 | 0.29 |
| Raceme length (cm) | −0.22 | −0.08 | −0.14 | −0.17 | 0.5 |
| Number of pods per plant | −0.35 | 0.48 | −0.27 | −0.17 | 0.04 |
| Number of seeds per pod | 0.51 | 0.22 | −0.27 | −0.01 | 0.29 |
| Yield per plant (g) | −0.32 | 0.54 | −0.19 | −0.17 | −0.04 |
| Hundred seed weight (g) | 0.13 | 0.35 | 0.27 | −0.02 | −0.44 |
| Eigen value | 2.62 | 2.02 | 1.57 | 1.4 | 1.06 |
| Variability (%) | 18.7 | 14.47 | 11.18 | 9.98 | 7.56 |
| Cumulative (%) | 18.7 | 33.17 | 44.35 | 54.33 | 61.89 |
Publisher’s Note: MDPI stays neutral with regard to jurisdictional claims in published maps and institutional affiliations. |
© 2022 by the authors. Licensee MDPI, Basel, Switzerland. This article is an open access article distributed under the terms and conditions of the Creative Commons Attribution (CC BY) license (https://creativecommons.org/licenses/by/4.0/).
Share and Cite
Letting, F.K.; Venkataramana, P.B.; Ndakidemi, P.A. Pre-Breeding Prospects of Lablab (Lablab purpureus (L.) Sweet) Accessions in Tanzania: Morphological Characterization and Genetic Diversity Analysis. Agronomy 2022, 12, 2272. https://doi.org/10.3390/agronomy12102272
Letting FK, Venkataramana PB, Ndakidemi PA. Pre-Breeding Prospects of Lablab (Lablab purpureus (L.) Sweet) Accessions in Tanzania: Morphological Characterization and Genetic Diversity Analysis. Agronomy. 2022; 12(10):2272. https://doi.org/10.3390/agronomy12102272
Chicago/Turabian StyleLetting, Fanuel Kiptoo, Pavithravani Bangalore Venkataramana, and Patrick Alois Ndakidemi. 2022. "Pre-Breeding Prospects of Lablab (Lablab purpureus (L.) Sweet) Accessions in Tanzania: Morphological Characterization and Genetic Diversity Analysis" Agronomy 12, no. 10: 2272. https://doi.org/10.3390/agronomy12102272
APA StyleLetting, F. K., Venkataramana, P. B., & Ndakidemi, P. A. (2022). Pre-Breeding Prospects of Lablab (Lablab purpureus (L.) Sweet) Accessions in Tanzania: Morphological Characterization and Genetic Diversity Analysis. Agronomy, 12(10), 2272. https://doi.org/10.3390/agronomy12102272