Article

An Evaluation of the Dough Rheology and Bread Quality of Replacement Wheat Flour with Different Quinoa Particle Sizes

by
Ionica Coţovanu
* and
Silvia Mironeasa
*
Faculty of Food Engineering, Stefan cel Mare University of Suceava, 720229 Suceava, Romania
*
Authors to whom correspondence should be addressed.
Agronomy 2022, 12(10), 2271; https://doi.org/10.3390/agronomy12102271
Submission received: 19 August 2022 / Revised: 14 September 2022 / Accepted: 16 September 2022 / Published: 22 September 2022
(This article belongs to the Special Issue Functional and Nutritional Properties of Agricultural Products)

Abstract

:
A way to improve the nutritional value of refined wheat flour with enhanced dough rheology is by substituting wheat flour with quinoa flour (QF) at different addition levels and particle sizes (PS). Experimental variation prediction of the flour α-amylase activity, dough rheological properties, and bread characteristics were estimated using mathematical models. A decrease in the falling number index, water absorption, speed of protein weakening, gas retention coefficient in the dough, maximum creep-recovery compliance, and bread volume and firmness was achieved with the increase of PS. When the QF addition level rose, the values of the following parameters decreased: dough stability, starch retrogradation, dough extensibility and deformation energy, viscosity factor, maximum gelatinization temperature, creep-recovery compliance, and bread quality parameters. Dough rheological properties are important for showing the behavior during processing, which impacts the bread quality. For each quinoa flour PS has identified the optimal addition level in wheat flour for improving bread quality. The best composite flours, regarding dough rheology and bread characteristics, contain 9.13% for large, 10.57% for medium, and 10.25% for small PS. These results may help to improve the quality of refined wheat bread or to range diversify the bread making products.

1. Introduction

Pseudocereals are recognized for their main functional components, such as dietary fiber, proteins, polyunsaturated fatty acids, vitamins, minerals, and various bioactive compounds. The biggest limitation of the functional properties is that pseudocereals do not contain gluten and therefore do not have dough-forming or baking properties. Due to the lack of gluten in pseudocereals, their addition, especially in large quantities, to wheat flour dough conducted to changes in the processing conditions and the quality of the final product [1,2]. However, up to a certain amount, pseudocereals can be added to wheat-based products, thus improving the nutritional properties of the finite product.
Particle size is an important parameter in food processing and size reduction is widely used in the milling industry to separate the endosperm from toxic components of the quinoa whole grain (quinoa saponins). Small particles improve the water and oil retention, enzyme release, and functional-technological properties by exposing a large surface area during processing (mixing, fermentation, or baking). Size reduction and size distribution of milled seed particles showed a significant difference in the nutritional profile, especially related to the content of ash, protein, and starch [3].
The effects of particle size on bread volume were different. Some studies [4,5] found that finer particles produced bread with a smaller volume, while other studies [6,7,8,9] reported opposite findings.
From a sensory point of view, consumers preferred the aroma of bread with small particles and the color of the crumb more uniform [4]. A possible reason for the darker color may be a more uniform distribution of fine bran particles in the flour and an increase in polyphenol oxidase [10,11].
The rheological properties of the dough were strongly influenced by the particle size and the composition of the fractions of these particles [12]. As shown by numerous studies, the dough with finer particles had a shorter mixing time, which can be attributed to the faster absorption of water by finer-sized flour [13,14,15]. Regarding the effects of particle size on dough strength, in the study of Noort et al. (2010) [5], it was observed that the dough stability increased when the particle size of wheat bran was reduced from 831 to 129 μm, but then decreased when the particle size was reduced to 48 μm. The researchers explained that this is probably due to the gluten–fiber interactions more than the diluting effect of gluten caused by the addition of bran. These results are consistent with those reported by Xiong et al. (2017) [16], which showed that when the particle size decreased, the polymerization of gluten proteins improved and a more compact structure, and a better resistance of the dough were obtained. However, the microstructure of the dough showed that the very fine fractions (smaller than 120 μm) were more evenly distributed in the dough and therefore contributed more to the development of the gluten network.
Remarkable differences were found between the coarse and fine particles of quinoa flour in terms of the dough rheological behavior, which was strongly influenced by the particle size and its composition. A lower value was obtained for the complex viscosity and mechanical rigidity of the dough with small particles compared to the large size of quinoa flour [17,18]. The finer particles had a higher maximum viscosity, which may be due to the presence of high protein content and low starch content. The small diameter of the starch granules results in a lower gelatinization temperature (similar to that of potato starch) and low stability of the dough and lower amylose content (11–12% compared to 28% of wheat and corn) [19] that could affect starch retrogradation [20]. This may limit the percentage of substitution that can be achieved with quinoa flour in conventional flours [19].
The reduction of quinoa seeds and sieving flour in order to obtain different particle sizes had a significant influence on the composition of the fractions due to the increase of the surface area per unit volume.
The use of pseudocereals in wheat flour matrices is becoming a useful strategy for obtaining cereal-based products with enhanced nutritional value or for designing innovative products. The qualitative profile of new cereal-based products in terms of added nutritional value, palatability, and easy handling during processing support pseudocereals as suitable in the technology of obtaining highly nutritious and innovative baked products.
Demin et al. (2013) [21] suggested that it would be necessary to make changes in the traditional bread-making technology to allow for the replacement of higher pseudocereals addition levels in bread, which would lead to new bread with increased nutritional and sensory value. The addition of whole meal pseudo-cereal flour, especially in big quantities, has led to technological changes, such as a decrease in yield, resulting in a lower dough volume, a decrease in fermentation tolerance, a less elastic crumb, and various flavor changes depending on pseudocereals and bread type, due to fiber content and gluten dilution [1,22].
The research aimed to investigate the influence of the two factors, particle size and addition level of quinoa flour in wheat flour, on the dough rheological parameters and bread quality.

2. Materials and Methods

2.1. Materials

Wheat flour with an extraction rate of 65% was purchased from a local company (Mopan S.R.L., Suceava, România) and was tested for gluten deformation (6.00 mm) and wet gluten (30.00%) through the Romanian standard method [23]. International Association for Cereal Chemistry (ICC) [24] methods were used to determine: 14.00% moisture (110/1), 1.40%, fat (ICC 136), 12.60% protein (ICC 105/2), 0.65% ash (ICC 104/1), and 312 s falling number index (ICC 107/1).
Quinoa seeds were acquired from Sanovita Company (Vâlcea, România) and presented the following proximate composition including moisture (13.28%), protein (14.12%), ash (2.00%), and fat (5.61%). The chemical composition of quinoa flour particle size was determined and reported in previous work [14].

2.2. Preparation of Flours

Quinoa seeds were milled in the Grain Research Laboratory (KitchenAid, Whirlpool Corporation, Benton Harbor, MI, USA), then sieved with a Retsch Vibratory AS 200 basic (Haan, Germany) for 30 min at 70 Hz amplitude in order to obtain three different particle sizes: large, L > 300 µm, medium, 180 µm < M < 300 µm, and small fractions, S < 180 µm. The next step was to obtain the composite flours by mixing for 30 min in a Yucebas Y21 mixer (Izmir, Turkey) each quinoa flour fraction (L, M, and S) at 5 addition levels (0, 5, 10, 15, and 20%) with wheat flour, resulting 15 formulations as a consequence of the full factorial design applied (Table S1 from the Supplementary Materials).

2.3. The Process of Bread Making

Improved bread with the addition of quinoa flour in refined wheat flour was obtained by the indirect (biphasic) method of dough preparation according to Coțovanu et al. (2021) [25]. The raw materials used in the manufacture of bread with the addition of quinoa flour were: wheat-quinoa composite flour (300 g), salt (1.8 g/100 g), and baking yeast Saccharomyces cerevisiae (3 g/100 g). The amount of water required to form the consistency of the dough was calculated based on the hydration capacity of the flour tested at Mixolab (Chopin, Tripetteet Renaud, Paris, France), which ranged from 57.30 to 59.60%, depending on the addition level and particle size. The biphasic procedure for preparing the dough samples consisted of mixing half of the composite flour with the entire amount of water and yeast. The leaven thus formed was left to ferment for two hours in a fermentation chamber (PL2008, Piron, Cadoneghe, Padova, Italy), at 30 ± 2 °C, and 85% relative humidity. When the first fermentation was finished, the other part of composite flour and salt was incorporated, kneaded for 10 min using the Kitchen Aid mixer (Whirlpool Corporation, Benton Harbor, MI, USA), and left to complete the fermentation of sugars for another hour, at 30 ± 2°C and 85% RH [25]. Then, the dough was divided into 400 g pieces, which were molded by hand and left to ferment in aluminum trays for one hour (30 ± 2°C and 85% RH). The leavened dough was baked in the oven (Caboto PF8004D, Cadoneghe, Padova, Italy) at a temperature of 220 ± 5 °C for 25 min.

2.4. Dough and Bread Characteristics Analysis

2.4.1. Dough Rheological Measurements

In order to determine the falling number index (FN), the falling number instrument (Perten Instruments AB, Stockholm, Sweden) was used for quantification of the α-amylase activity.
Mixolab equipment (Chopin, Tripette et Renaud, Paris, France) was used to perform complex analysis of flour and the rheological behavior of the dough (according to ICC 173, AACC 54–60.01) during the bread-making process in a single test [26]. The protocol used to determine the rheological properties of the dough includes: kneading at 80 rpm for 8 min (30 °C), increasing the heating rate by 4 °C/min to 90 °C, decreasing the cooling rate by 4 °C/min to 50 °C, the total analysis time being 45 min. Preliminary tests were required to determine the optimal level of flours hydration according to the maximum consistency of the dough (C1 = 1.1 N∙m) and then we determined the behavior of the dough during kneading: water absorption (WA), dough development time (DT), and dough stability (ST); heating: protein weakening (C1-2), starch gelatinization (C3-2), gel stability (C3-4), and cooling: starch retrogradation (C5-4).
The visco-elastic behavior of the dough during biaxial extension was measured using the Chopin Alveograph (La Garenne Cedex, Paris, France), according to the method described in the standard SR EN ISO 27971:2009. The alveogram provides data on the rheological properties of the dough, such as the maximum dough tenacity, P, dough extensibility, L, deformation energy, W, and the alveograph ratio, P/L.
The Chopin rheofermentometer (Villeneuve-La-Garenne Cedex, Paris, France) was used to assess rheological behavior during dough fermentation and development, by measuring the total volume of gas produced in the dough, related to the activity of the yeast and the volume of gas retained in the dough, associated with gluten resistance [27]. Real-time (3 h) measured parameters that were evaluated in this research include: the maximum dough height during gas formation and retention, H’m, the total volume of gas formed in the dough, VT, the volume of gas retained by the dough at the end of the test, VR, and gas retention coefficient in the dough, CR.
The fundamental dough rheological measurements were assessed with a Mars 40 rheometer (Thermo-Haake, Karlsruhe, Germany). Samples follow the standard preparation, without yeast and salt, at optimum water absorption (determined at Mixolab, until achieving the maximum consistency). The oscillation tests were performed in the plate-plate geometry with a 4-mm gap selected based on the viscosity range of the dough. The evaluation of the variation of the visco-elastic modulus with frequency was performed by applying a frequency range from 0.01 to 20 Hz and constant stress of 10 Pa (located in the viscoelastic linear region). After preparing the dough, samples were left for 5 min in order to allow relaxation and to stabilize the structure recovery; the test was accomplished three times for each sample at 20 °C.
The characteristics determined following the oscillatory rheological tests were elastic modulus, G′ (Pa), viscous modulus, G″ (Pa), and viscosity factor, tg δ = G″/G′.
The variation of the modulus with temperature was performed by applying the oscillating test at a constant frequency of 1 Hz, where the dough was heated from 20 to 100 °C at a speed of 4 ± 0.1 °C/min. The elastic and viscous moduli were recorded as a function of temperature using Rheowin software. The maximum gelatinization temperature (Tmax) was determined when the maximum value of the elastic modulus, G′ was reached.
For a better understanding of the stresses that may occur during the bread-making technology, the low-frequency oscillation test was supplemented with a creep and recovery dough evaluation test, by applying a shear stress of 50 Pa, which is in the linear viscoelastic domain, for 60 s, and after removing the tension being left 180 s for recovery [28]. Compliance (J) was measured, at a temperature of 20 °C, where the value recorded in the creep phase after 60 s represents the maximum compliance, (Jcmax), and the value recorded at the end of the recovery phase, Jrmax represents the maximum compliance at the end of the relaxation phase.

2.4.2. Bread Physical and Textural Parameters

After two hours of cooling at room temperature, the bread volume (BV) was determined using the Fornet apparatus, which is based on measuring the volume displaced by the bread in an environment consisting of rapeseed [23]. The evaluation of the bread firmness (BF) was performed using the Perten TVT-6700 texturometer (Perten Instruments, Hägersten, Sweden), according to the procedure proposed by Iuga et al. (2020) [29]. A 2.5 cm stainless steel cylinder was used to subject a sample of 50 g of bread to 20% of its depth to a double compression, with a speed of 1.0 mm/s and a force of 5 g. The time interval between the two compressions was 15 s [25]. Measurements were performed in triplicate for each sample.

2.5. Factorial Design and Statistics

The design of the experimental matrix was done using the Design Expert software version 12.00 (trial version, Stat-Ease, Inc., Minneapolis, MN, USA), which also allowed for mathematical modeling of the data, testing of the adequacy of the generated models, plotting of the graphs response surface type, and numerical optimization. The studied factors were three quinoa flour particle sizes (large, medium, and small) and five addition levels to wheat flour (0, 5, 10, 15, and 20%).
The values of the determined parameters for all formulations are evaluated by using a full factorial design.
By using multiple regression analysis, the fitting of the experimental results with various mathematical models was verified, and the degree of fitting was determined by the analysis of variance (ANOVA), at a significance level of 95%, by evaluating the value of the coefficient of determination (R2), the adjusted coefficient of determination (Adj.-R2), and the Fisher test (F).
In the numerical optimization of the variables considered, an importance category (3) was assigned to each variable, and criteria were applied to optimize the addition level of quinoa flour in refined flour. The constraints applied consisted of the maximization of the QF addition level, ST, C3-2, H’m, VT, VR, CR, W, Jrmax, BV, minimization of C1-2, C5-4, P/L, and maintaining of the FN, WA, DT, C3-4, P, L, G′, G″, tan δ, Jcmax, Tmax, and BF within the range.

3. Results

The results obtained for the studied parameters in according to the experimental design are shown in Table 1.

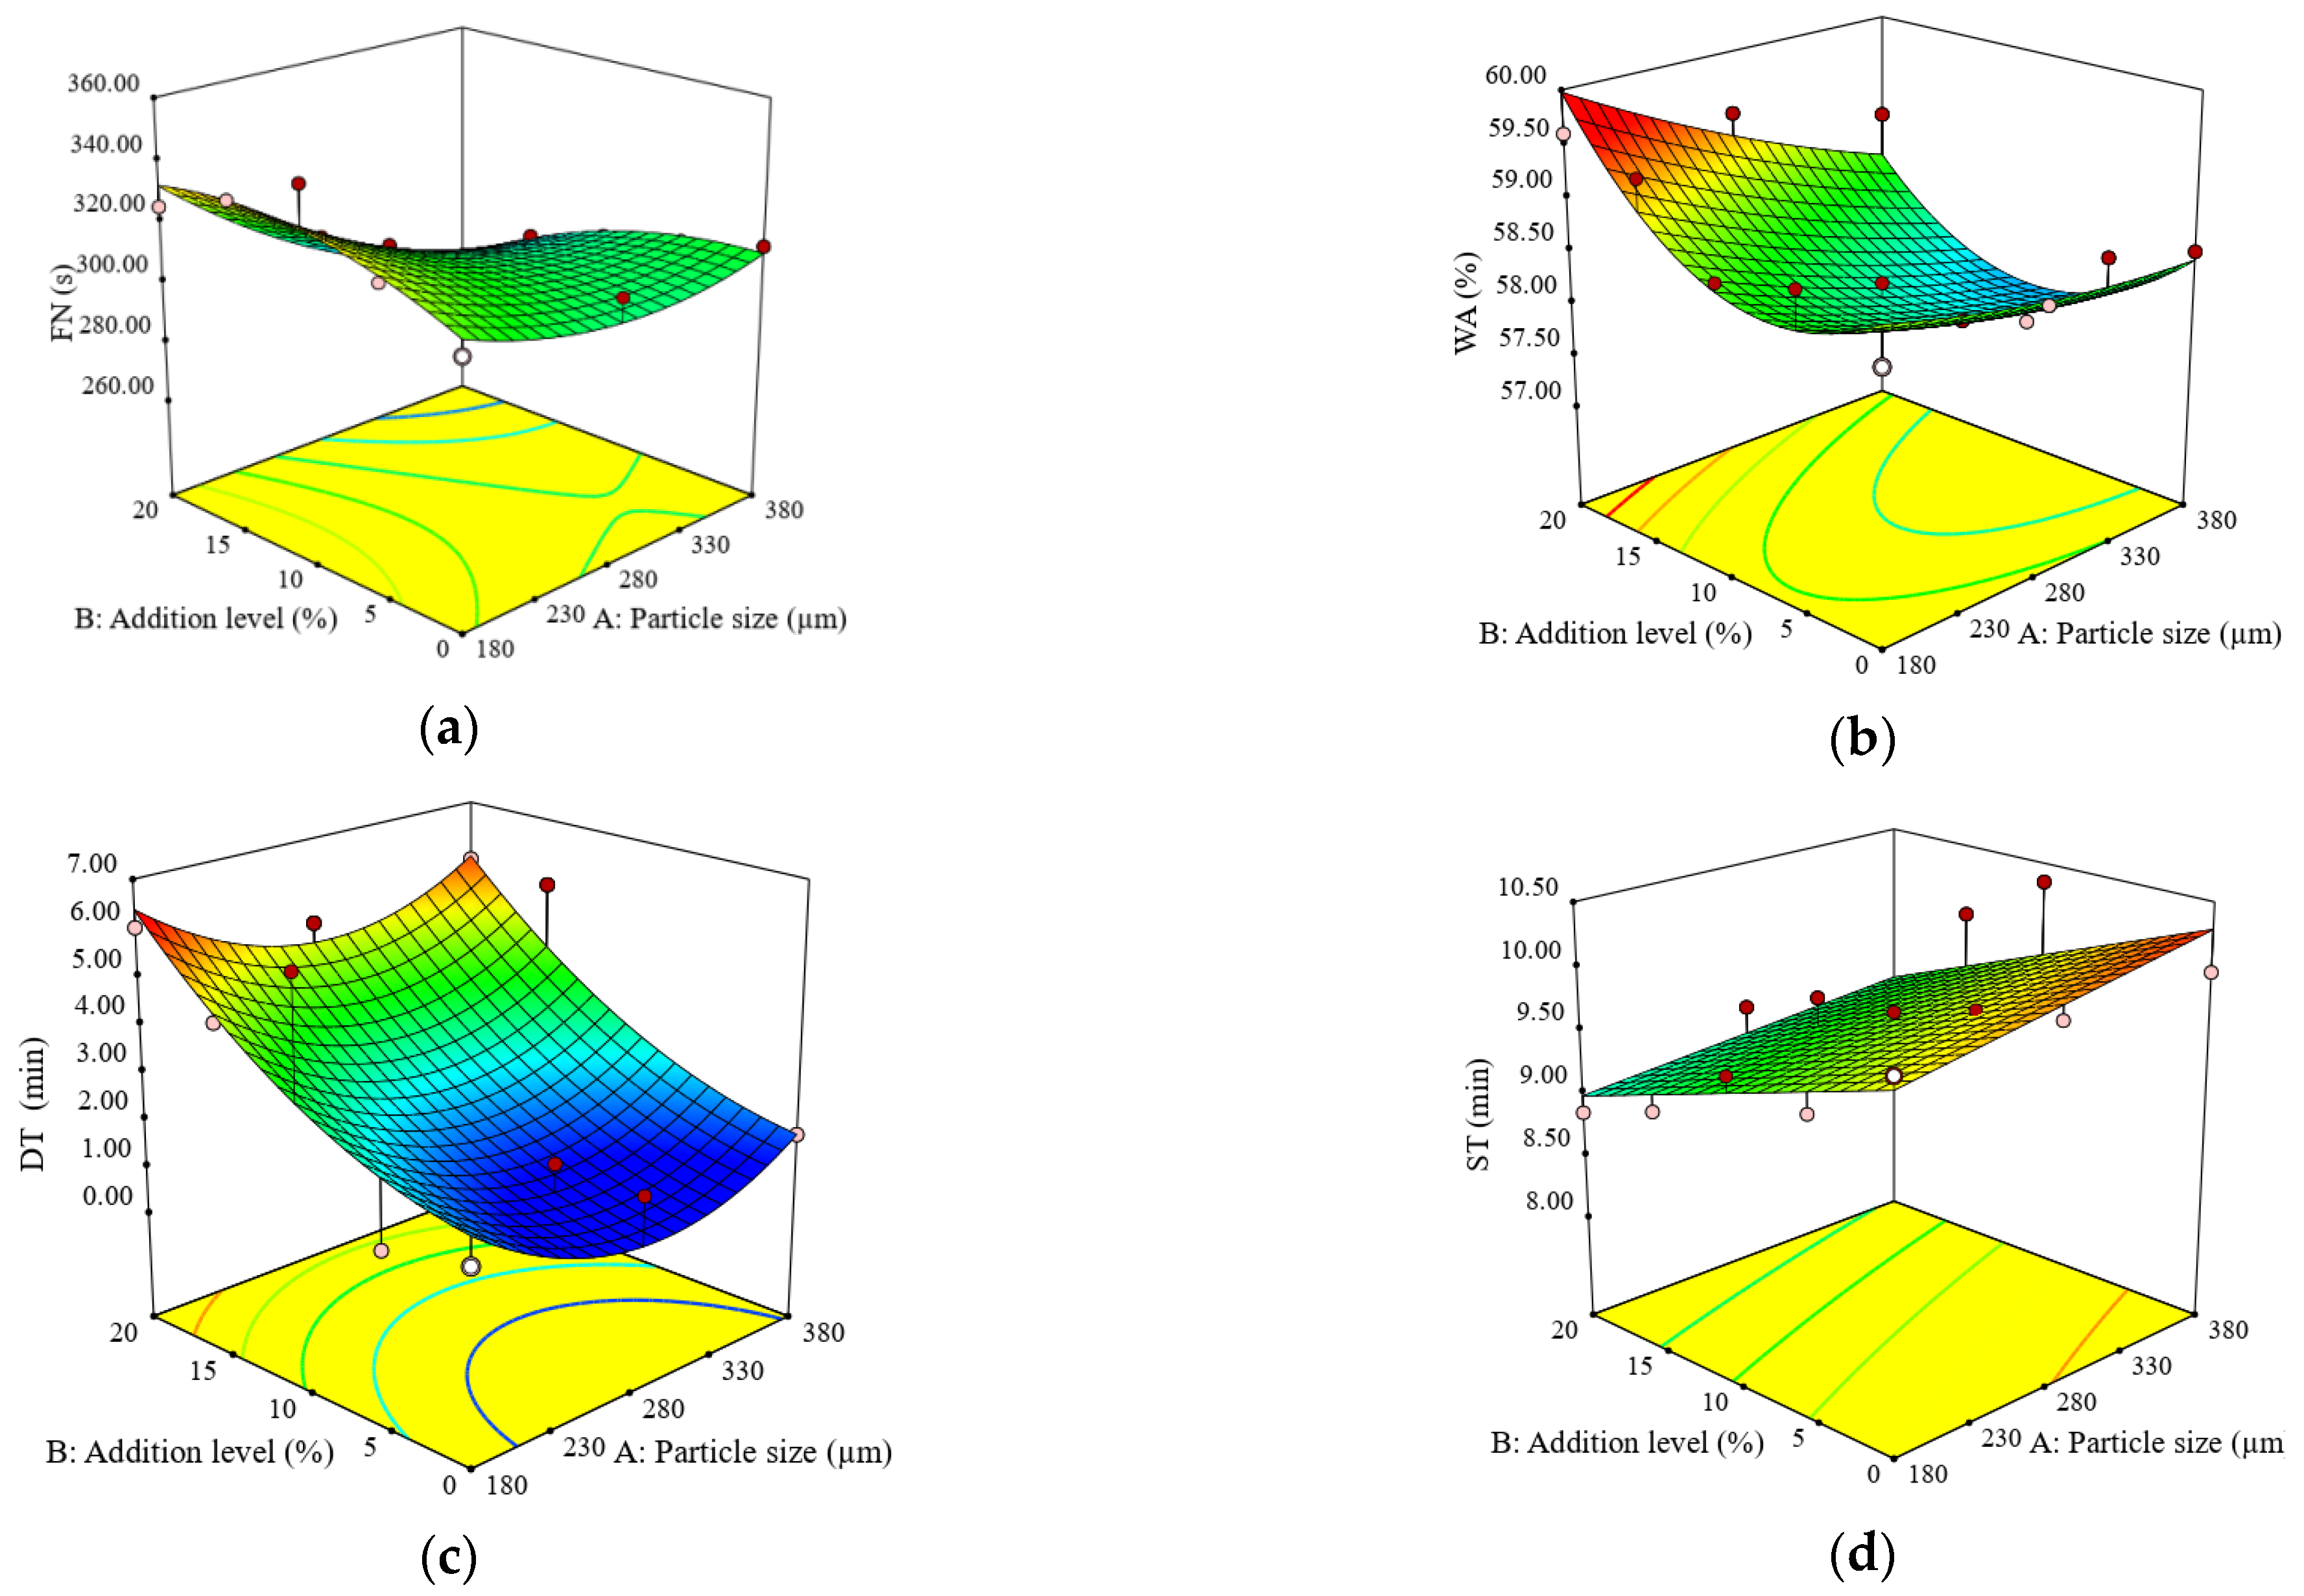
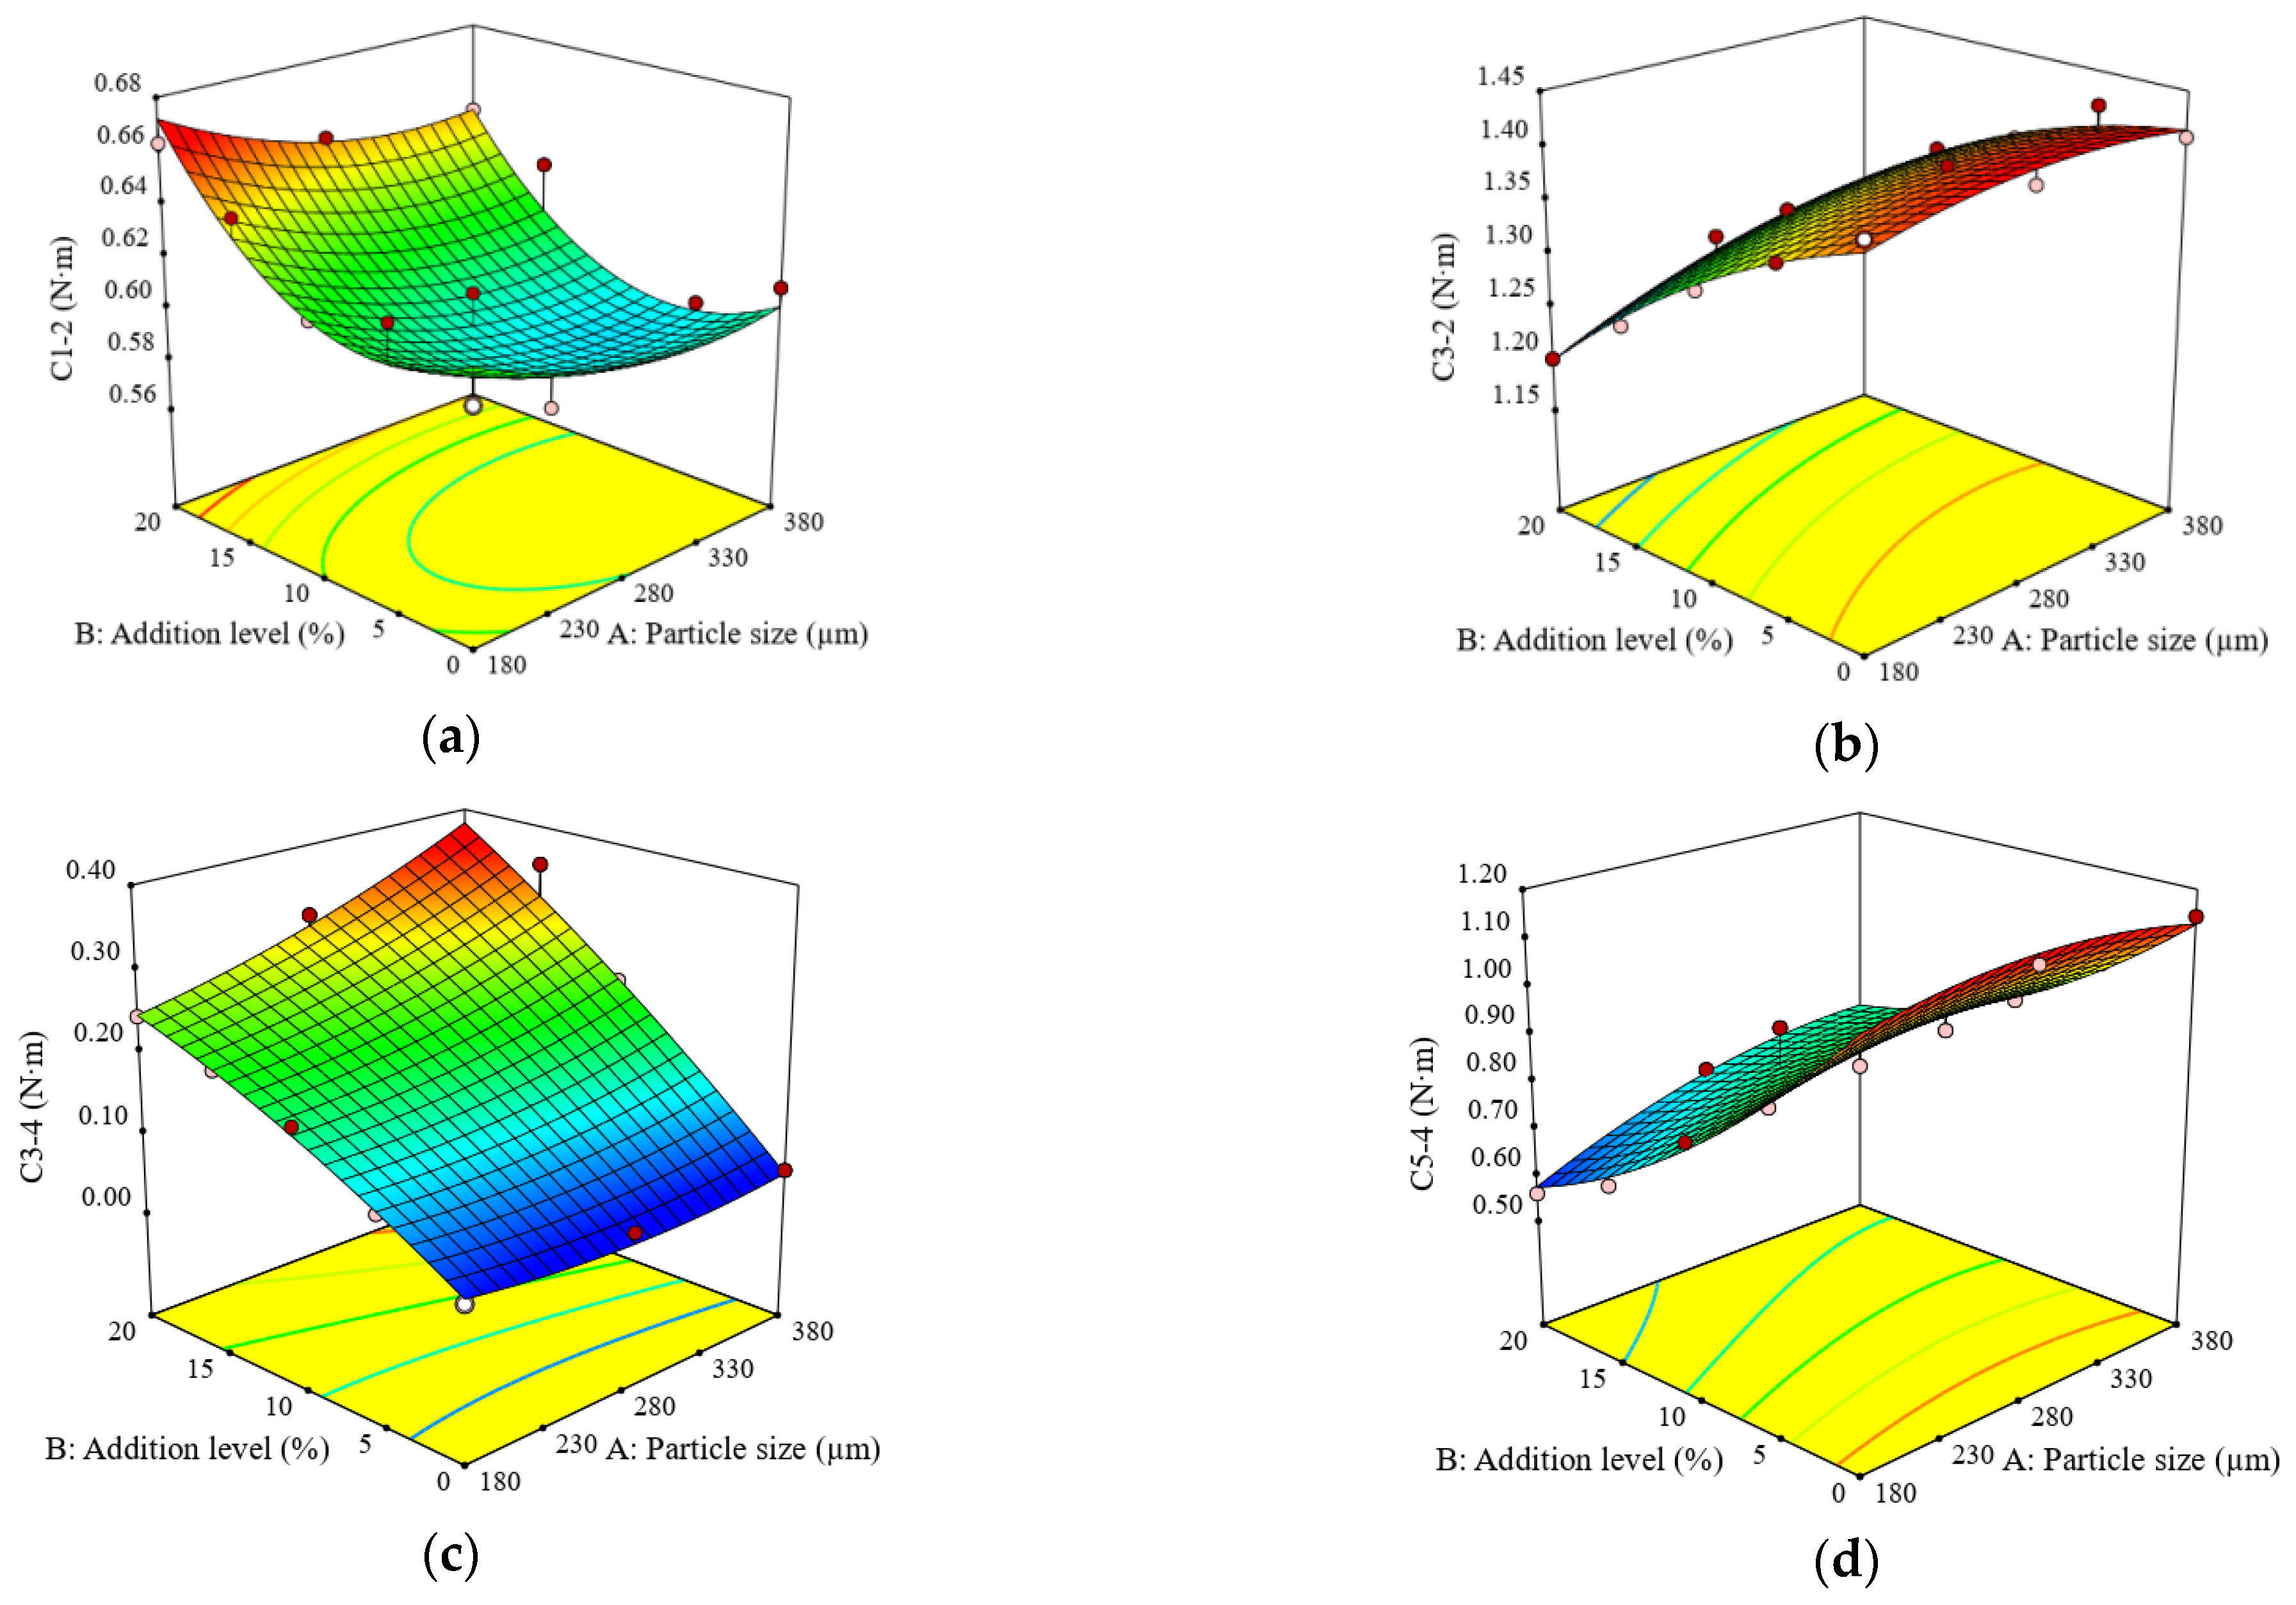
3.1. Impact of Particle Size and Addition Level of Quinoa Flour in Wheat Flour on FN Index, Dough Rheological Properties during Mixing and Heating-Cooling Cycle, and Dough Biaxial Extension

The falling number index (FN) values of the formulated wheat–quinoa composite flours ranged from 277 to 347 s. The results of the regression analysis for FN showed that the quadratic model defined adequately (R2 = 0.89) the real α-amylase activity of the composite flour (Table 2). The particle size of quinoa flour significantly (p < 0.05) influenced FN, which decreased with increasing of particle size and addition level (Figure 1a). The interaction between the two factors, the particle size and the addition level determined the decrease of FN. This fact suggesting an increase in α-amylase activity, the FN index being inversely proportional to α-amylase activity in flour [30]. Amylase was considered to be a key factor in determining starch digestibility [31]. In the process of digestion, A-type wheat starch was largely gelatinized, while B-type wheat starch and quinoa starch granules were wrapped in a protein-sugar-oil film after baking, forming a natural barrier, and its digestion rate was slower [18]. The presence of quinoa flour in bread formulations in this study can probably reduce starch digestibility and increase the resistant starch content. It was reported the starch digestibility of the crispy biscuits decreased with the increase of quinoa flour [32].
Water absorption (WA) of the formulated composite flour samples, depending on the simultaneous influence of the QF particle size and the addition level in wheat flour, was adequately predicted by the quadratic model (Table 2). Water absorption varied between 57.3 and 59.6%. The results of the regression analysis for WA indicated that the linear term of particle size and QF addition level had considerable effects on WA. The particle size and the interaction between the factors had a negative influence on the WA, which showed that the water absorption in the composite dough increased when the QF addition level increased and the particle size decreased. When the QF particle size is smaller, it has a larger surface area, which will absorb more water.
The graph of the response area showed the increase of WA with an increase in QF addition level in wheat flour (Figure 1b). The hydration capacity also depends on the particle size of the quinoa flour, the smaller size increasing the WA values in the dough. The results obtained are consistent with those reported by Ahmed et al. (2019) [17].
The dough development time (DT) varied between 1.28 and 6.13 min and was significantly influenced (p < 0.05) by the level of quinoa flour added to the wheat flour, while the particle size had a non-significant effect (p > 0.05) on DT, indicating a decreased trend with the rise of PS. The graph of the response area (Figure 1c) showed that the DT increased with an increasing level of QF, depending on the particle size. Compared to the control sample, DT increased approximately 2.7–3.5 times in the composite flour with small QF particle size.
The dough stability (ST) was significantly (p < 0.05) influenced by the level of QF added to the wheat flour (Table 2) and varied between 8.40 and 10.35 min for the formulated samples. Increasing the QF level markedly decreased ST (Figure 1d).
The strength of the protein network under the action of increasing temperature, represented by the difference between the peak C1 and C2 (C1-2), indicated that the particle size of QF and the addition level significantly influenced C1-2, while the interaction between factors had an insignificant effect (p > 0.05) on C1-2 (Table 2). With the increasing level of QF, the C1-2 torque increased, but the increase in particle size led to a decrease in C1-2 (Figure 2a).
Starch gelatinization (C3-2) represents the maximum consistency during the starch gelatinization process that occurs when the dough is heated above 60 °C. The difference between C3 and C2 (C3-2) was significantly influenced (p < 0.05) by the square term of the particle size and by the interaction between the particle size and the addition level of QF in wheat flour (Table 2). The effect of particle size and level of QF added to wheat flour indicated an increase in C3-2 as the particle size increased and the addition of quinoa flour decreased (Figure 2b).
The difference between C3 and C4 (C3-4) was considerably influenced by the particle size and the addition level of QF in wheat flour. The response surface graph for the combined effect of particle size and QF addition on C3-4 indicated an increase in C3-4 as particle size and QF level increased (Figure 2c). All samples with QF showed a high value for C3-4 compared to the control sample, depending on the particle size, even if the quinoa flour did not bring α-amylase into the dough system.
All dough formulations showed a lower value for C5-4 compared to the control sample. The response surface graph for the combined effect of factors on C5-4 showed that as the particle size decreased and the addition of QF increased, C5-4 decreased; the lowest value being at the addition 20% QF with small particles size (Figure 2d).
Replacing gluten-containing wheat flour with non gluten flour, such as quinoa flour, is a challenge for bread making technology because gluten is the essential protein in the formation of the porous matrix of the dough, being responsible for its elasticity and extensibility. The studied factors, the addition level, and the particle size had a significant effect (p < 0.01) on the dough alveographic parameters (Table 2).
The dough tenacity (P) showed the highest value for samples QM_20 (117.00 mm) and QM_15 (113.00 mm), and the weakest “dough” was obtained for sample QS_20 (80.50 mm) (Table 1). The dough extensibility (L) decreased with QF increasing level, depending on the size of the QF particles, and the lowest value was obtained for QM_20 (26.00 mm). The deformation energy (W) followed a decreasing trend with the increase of the QF addition level, depending on the particle size, and the lowest value (117.50 mm) was obtained for the QS_20 sample. Compared to the control sample, the alveograph ratio (P/L) followed an increasing trend that depends on the particle size and the level of QF added to the wheat flour.
The variation of the alveograph parameters of the dough depending on the particle size and the addition level of quinoa flour in wheat flour was adequately predicted by the quadratic model, at a significance level of p < 0.01. The results of the analysis of variance (ANOVA) show that the mathematical models obtained for the biaxial extension characteristics of the dough explained between 79 and 98% of the variation of the data (Table 2).
The dough tenacity (P) obtained from wheat–quinoa composite flour was significantly (p < 0.05) influenced by the addition level and the interaction between factors (Table 3). In addition, the square terms of the QF addition level and particle size significantly influenced (p < 0.05) the dough tenacity. Increasing the addition level of quinoa flour to refined wheat flour gradually increased P, while particle size did not substantially influence this parameter. A decrease in the dough extensibility (L) compared to the dough prepared from wheat flour (control), was observed with the increase of the quinoa flour addition in wheat flour. Large and medium-sized particles caused a decrease in extensibility with decreasing size, while the dough with small particles of quinoa flour showed higher extensibility, but it was not significant (p > 0.05). The increase of the addition level determined the increase of the tenacity and decrease of the dough elasticity, variations that were remarkable (Figure 3a,b). The addition level had an insignificant effect (p > 0.05) on dough tenacity and extensibility.
A decrease in deformation energy (W) was observed when the addition of QF increased (Figure 3c), while the particle size insignificantly (p > 0.05) influenced the parameter W.
With the increase in particle size and the addition of QF, the tenacity and extensibility of the dough decreased, which led to an increase in the alveograph ratio P/L (Figure 3d).

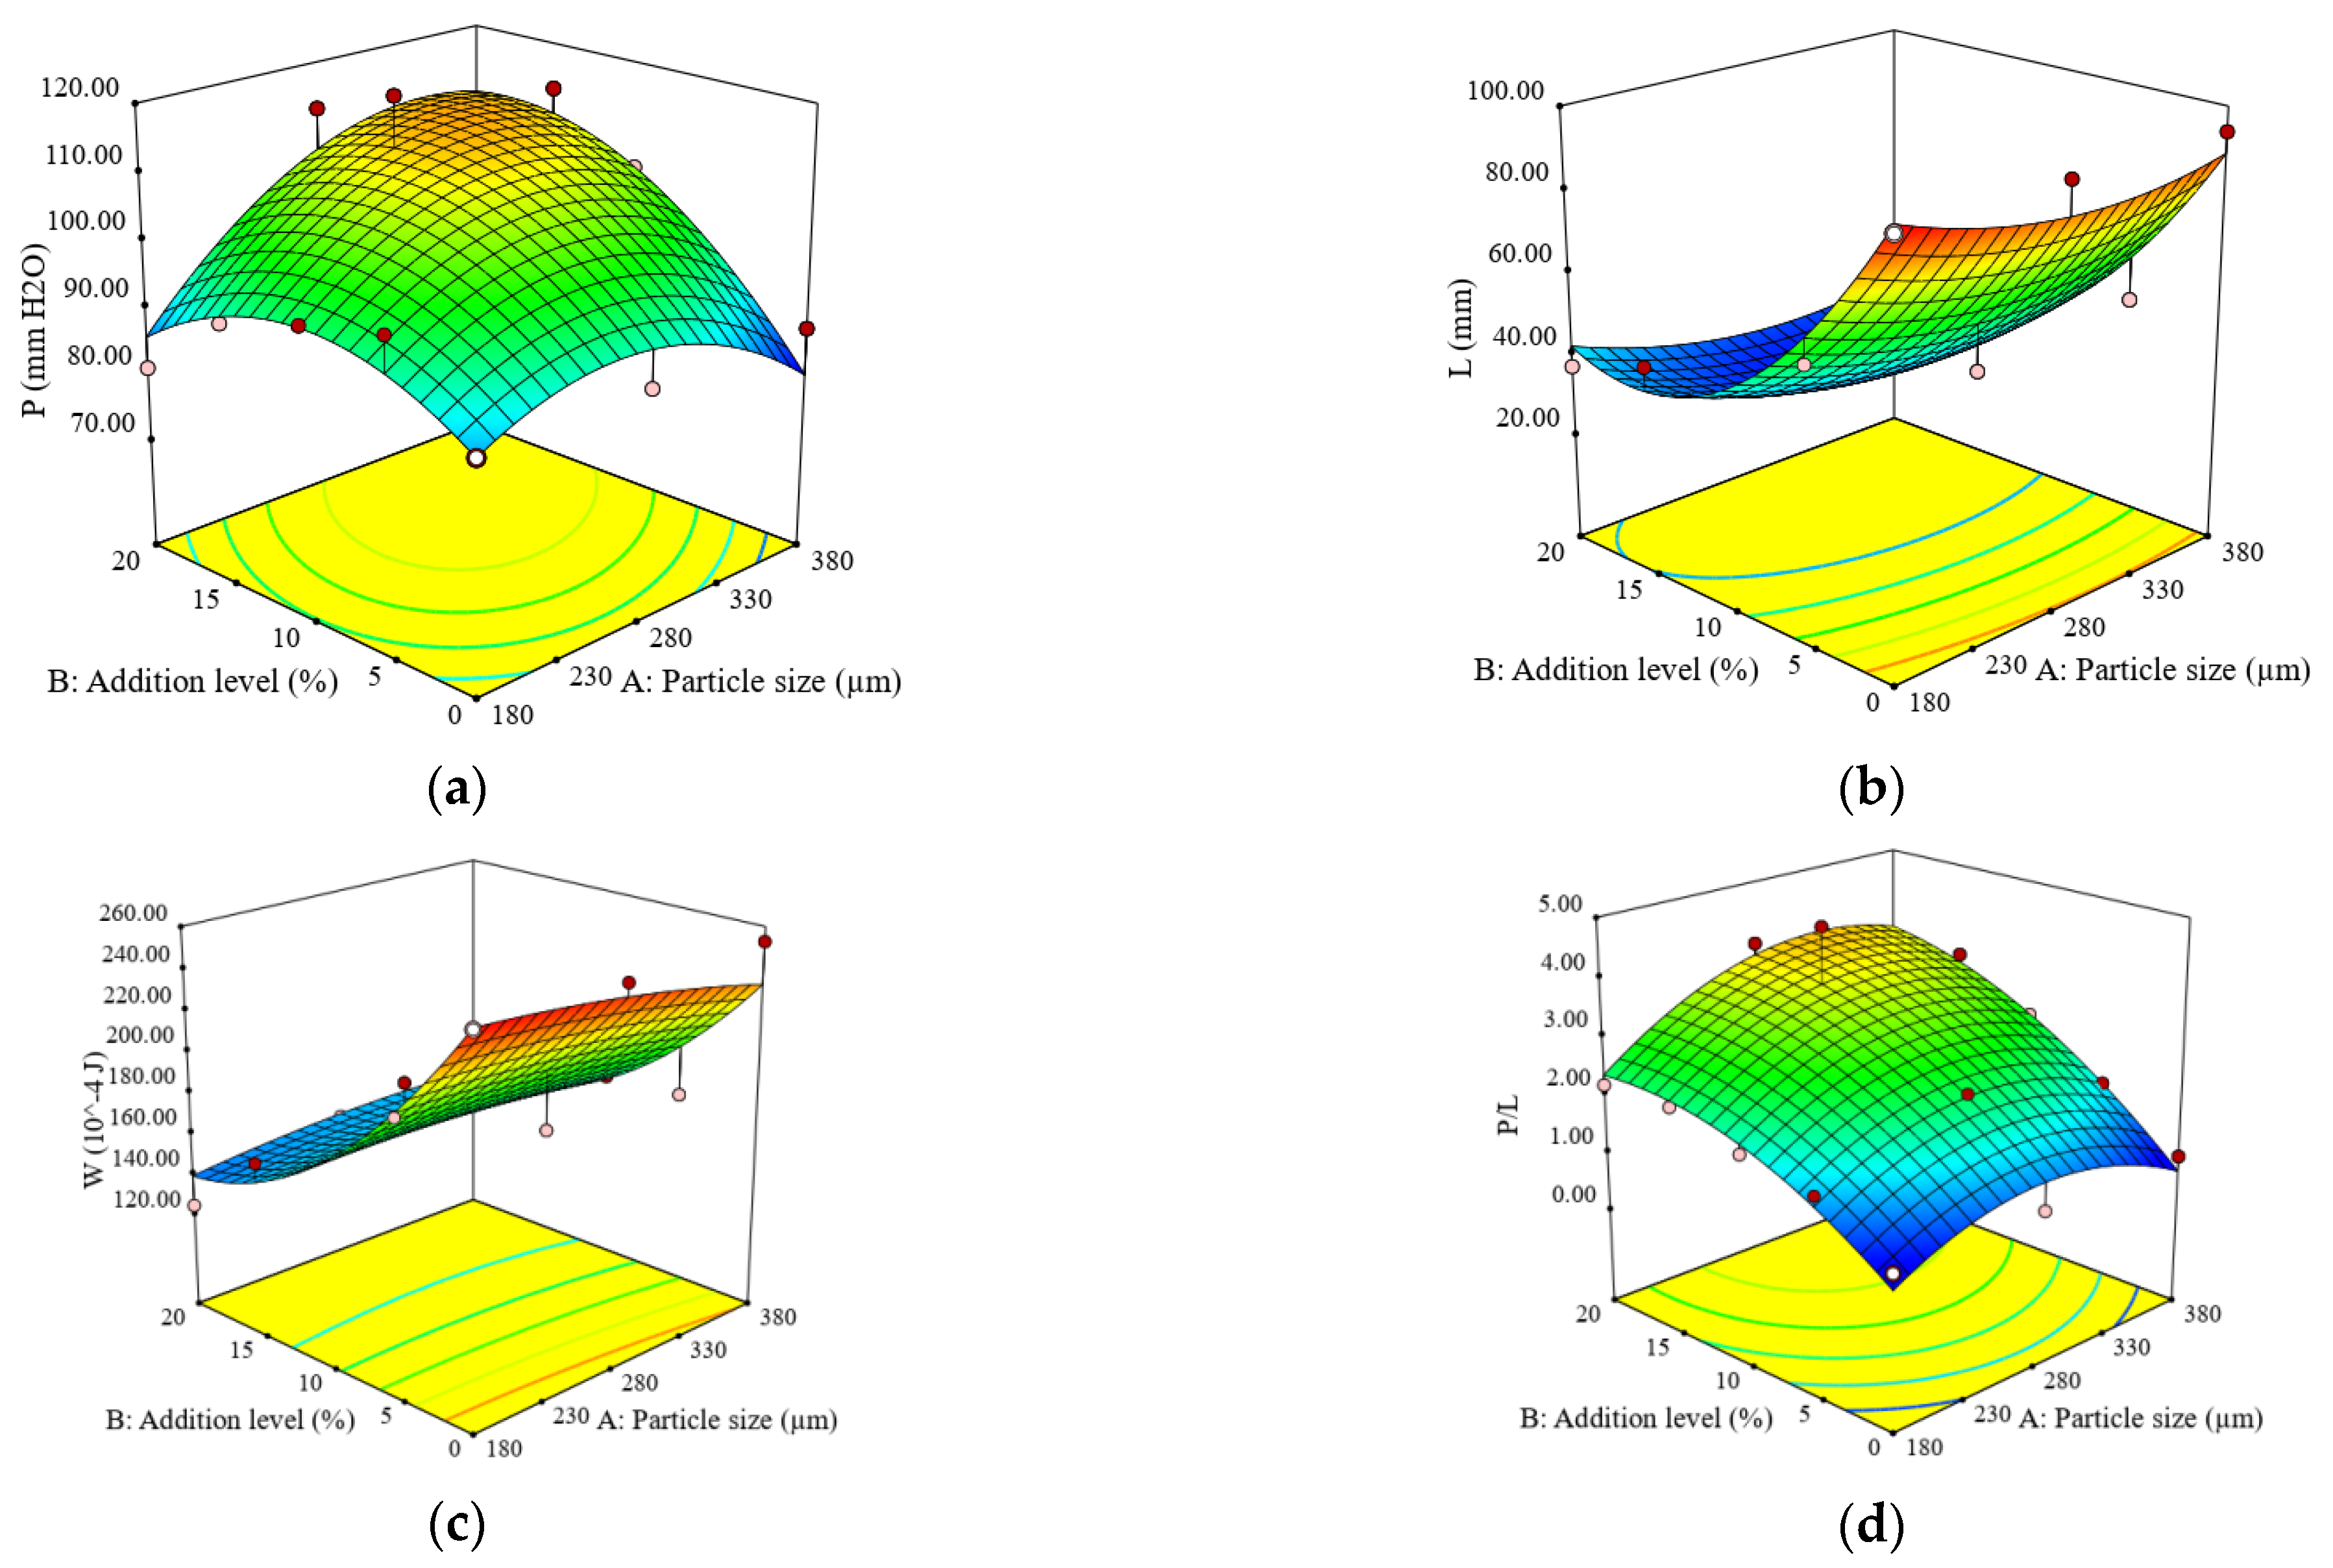
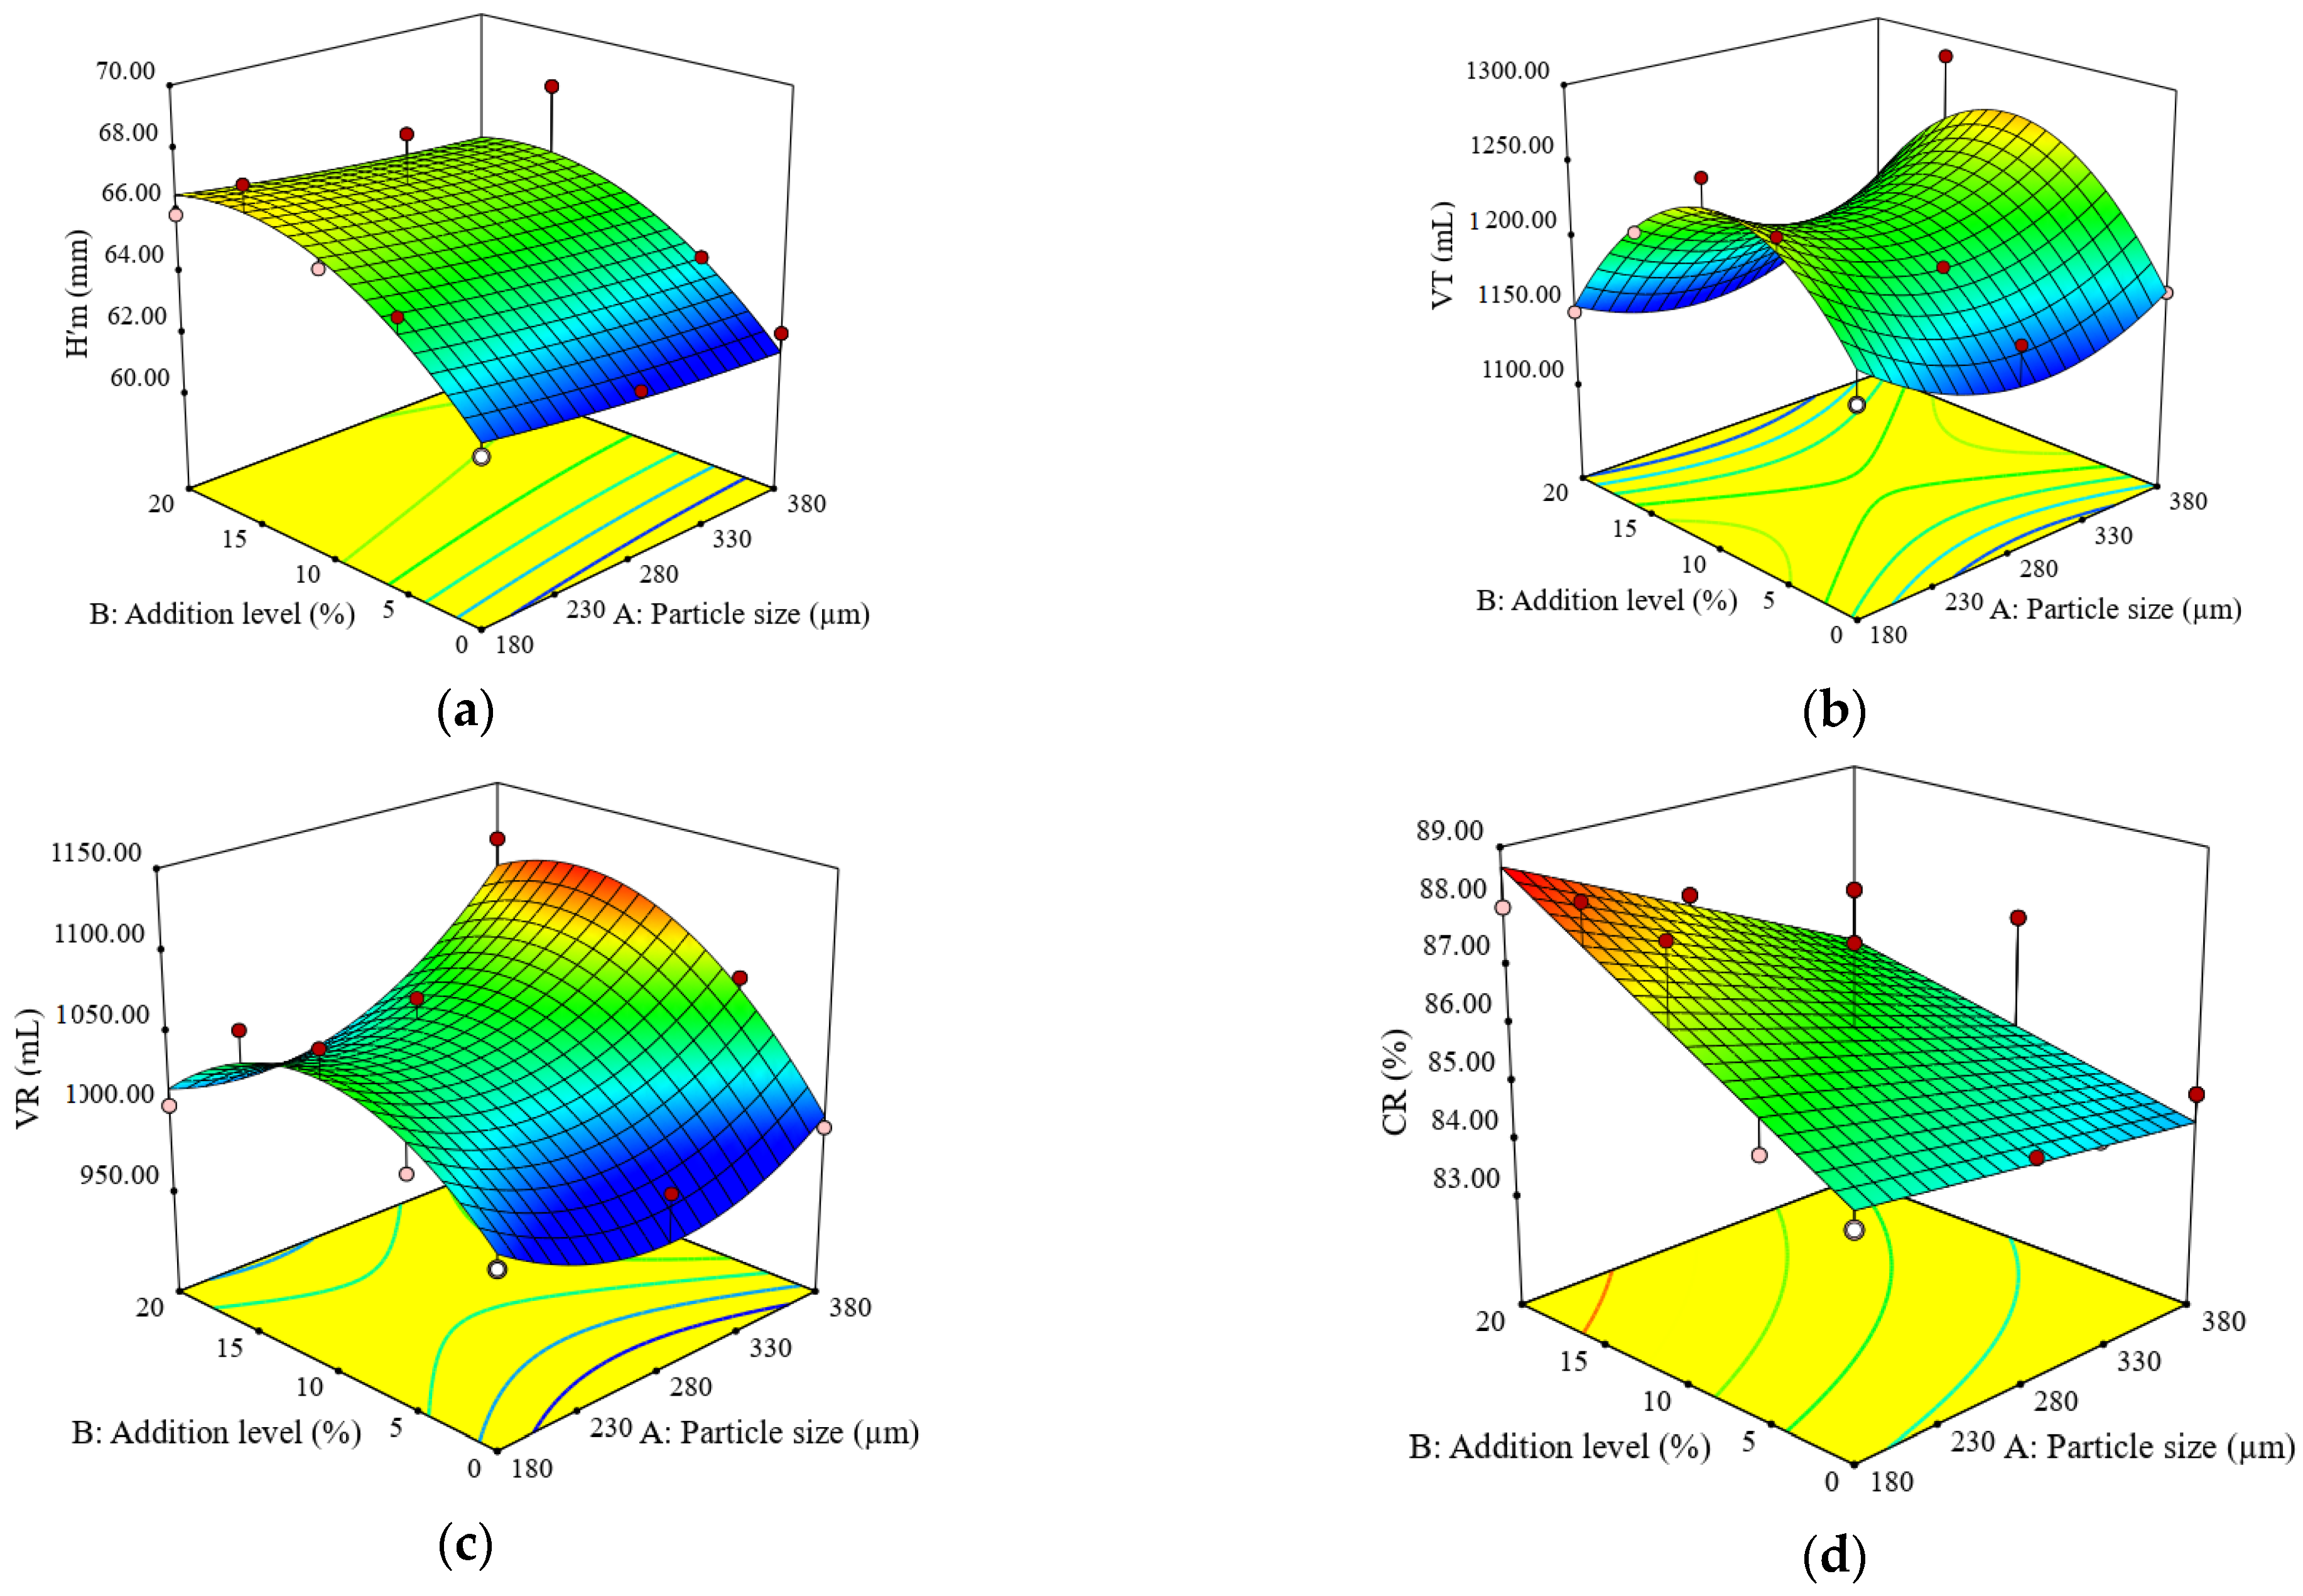
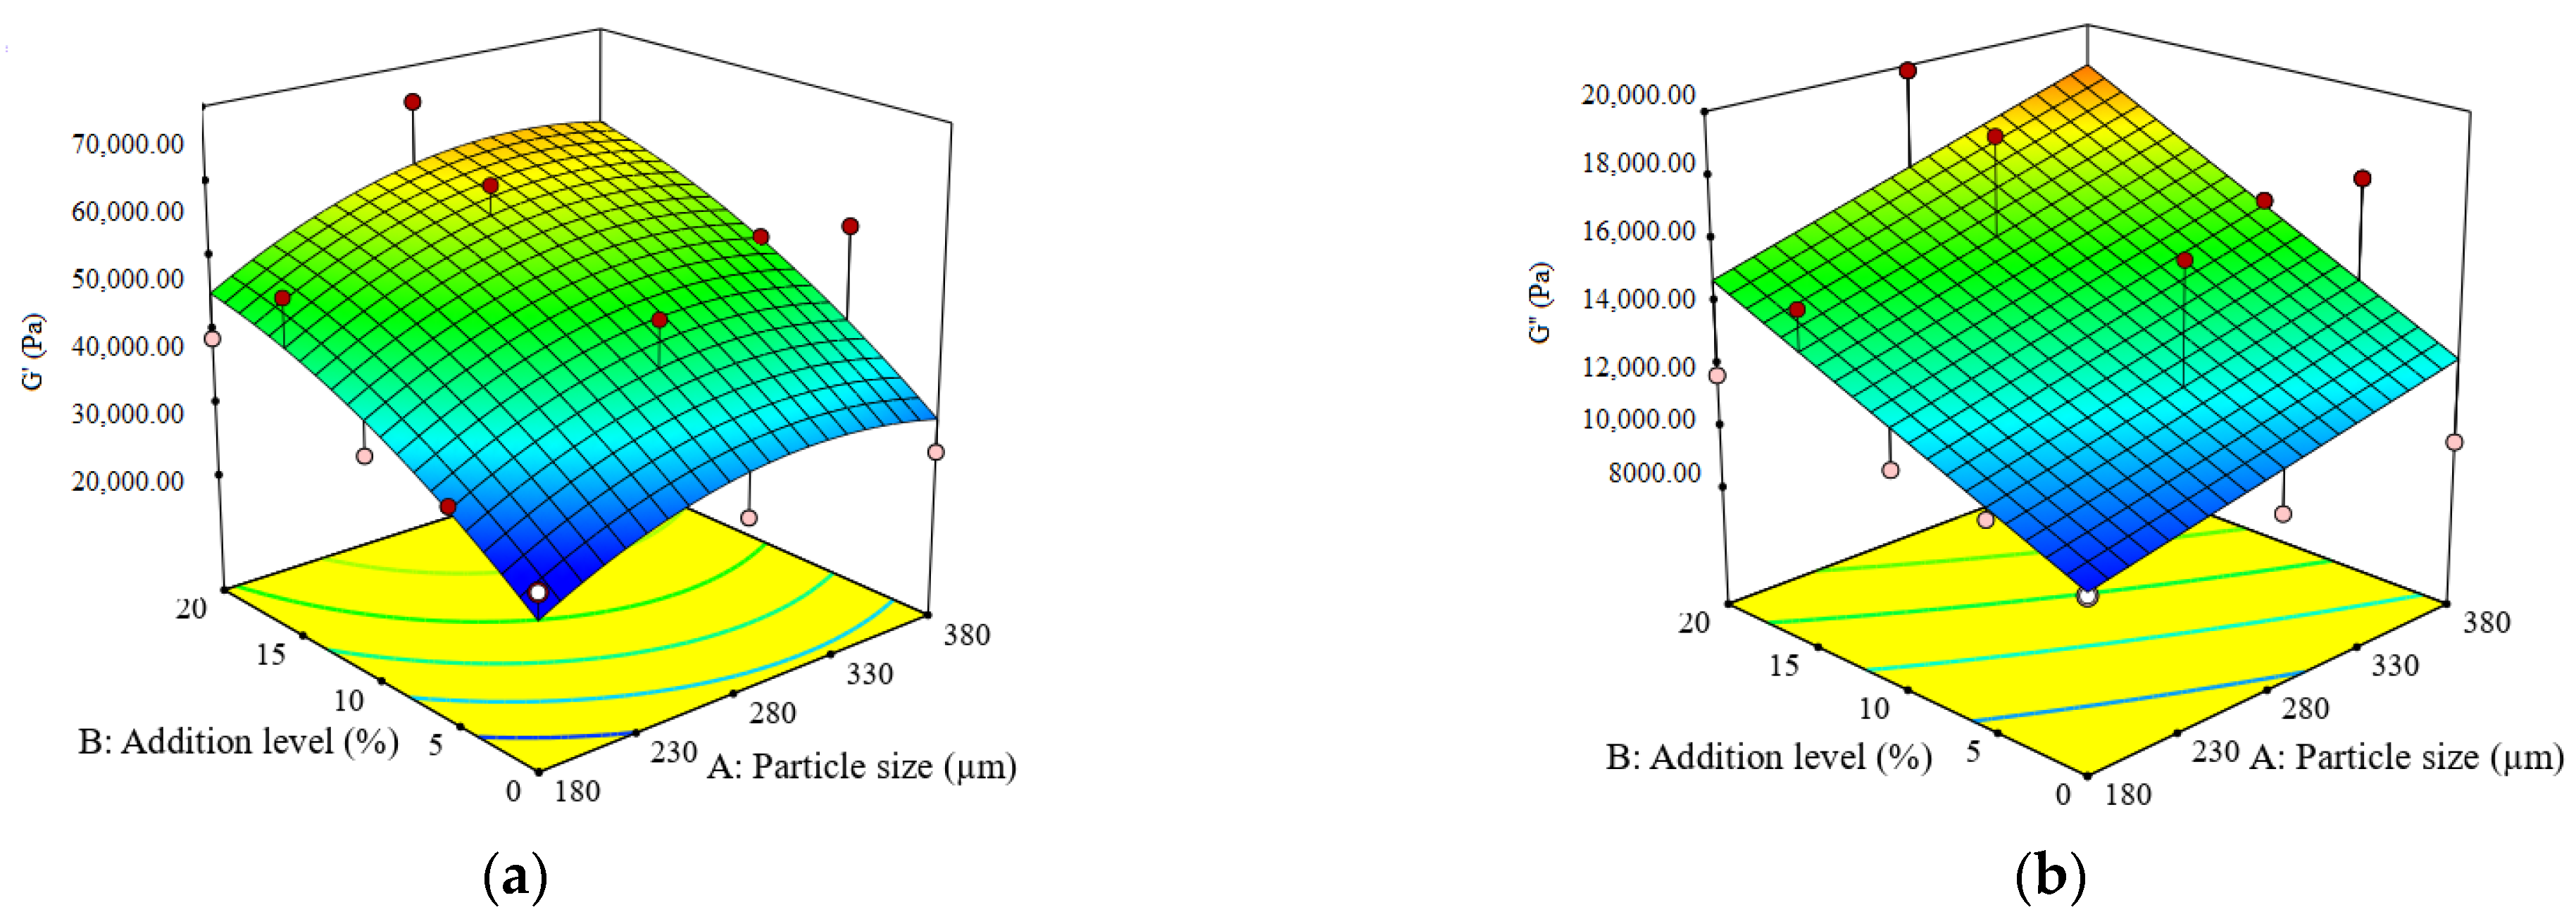
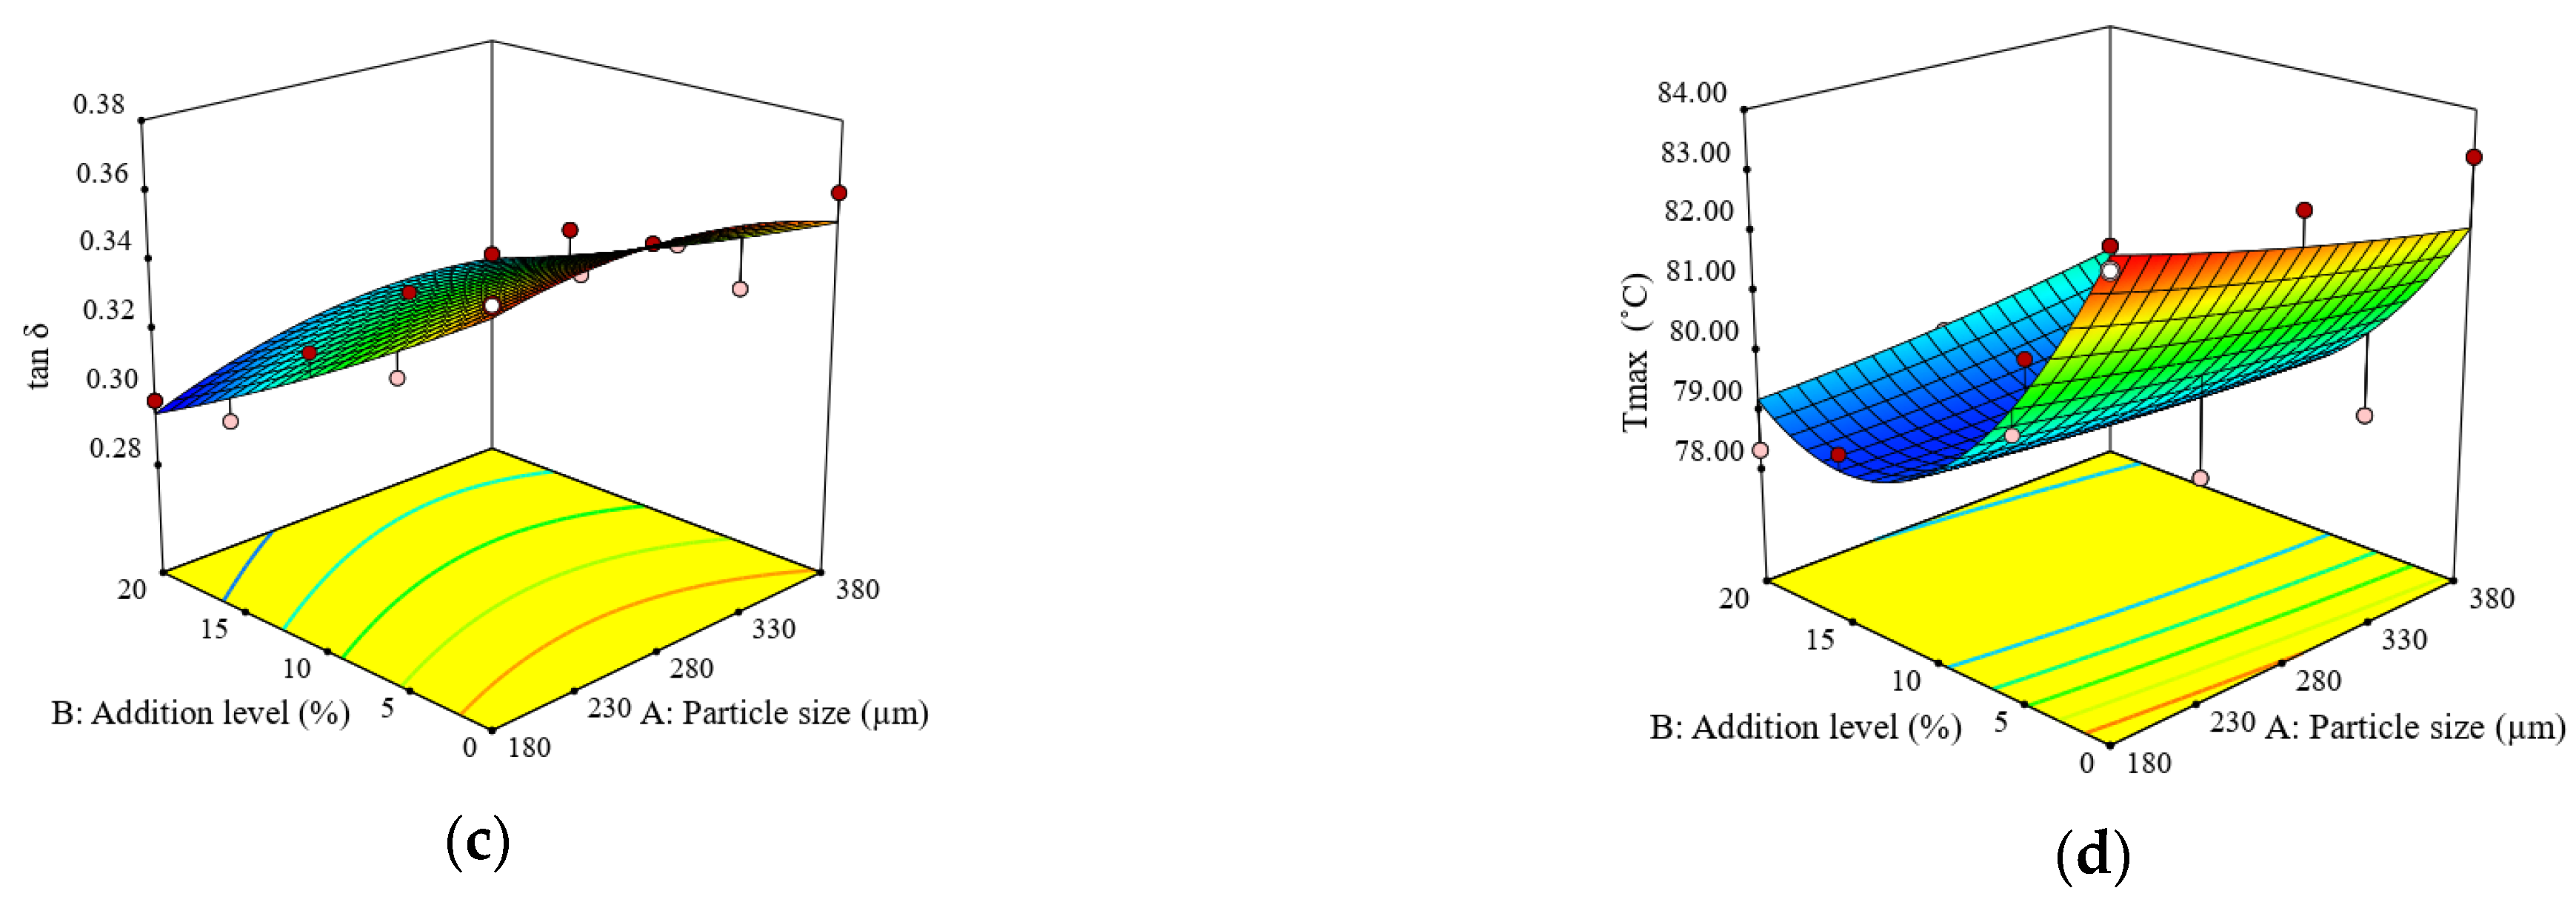
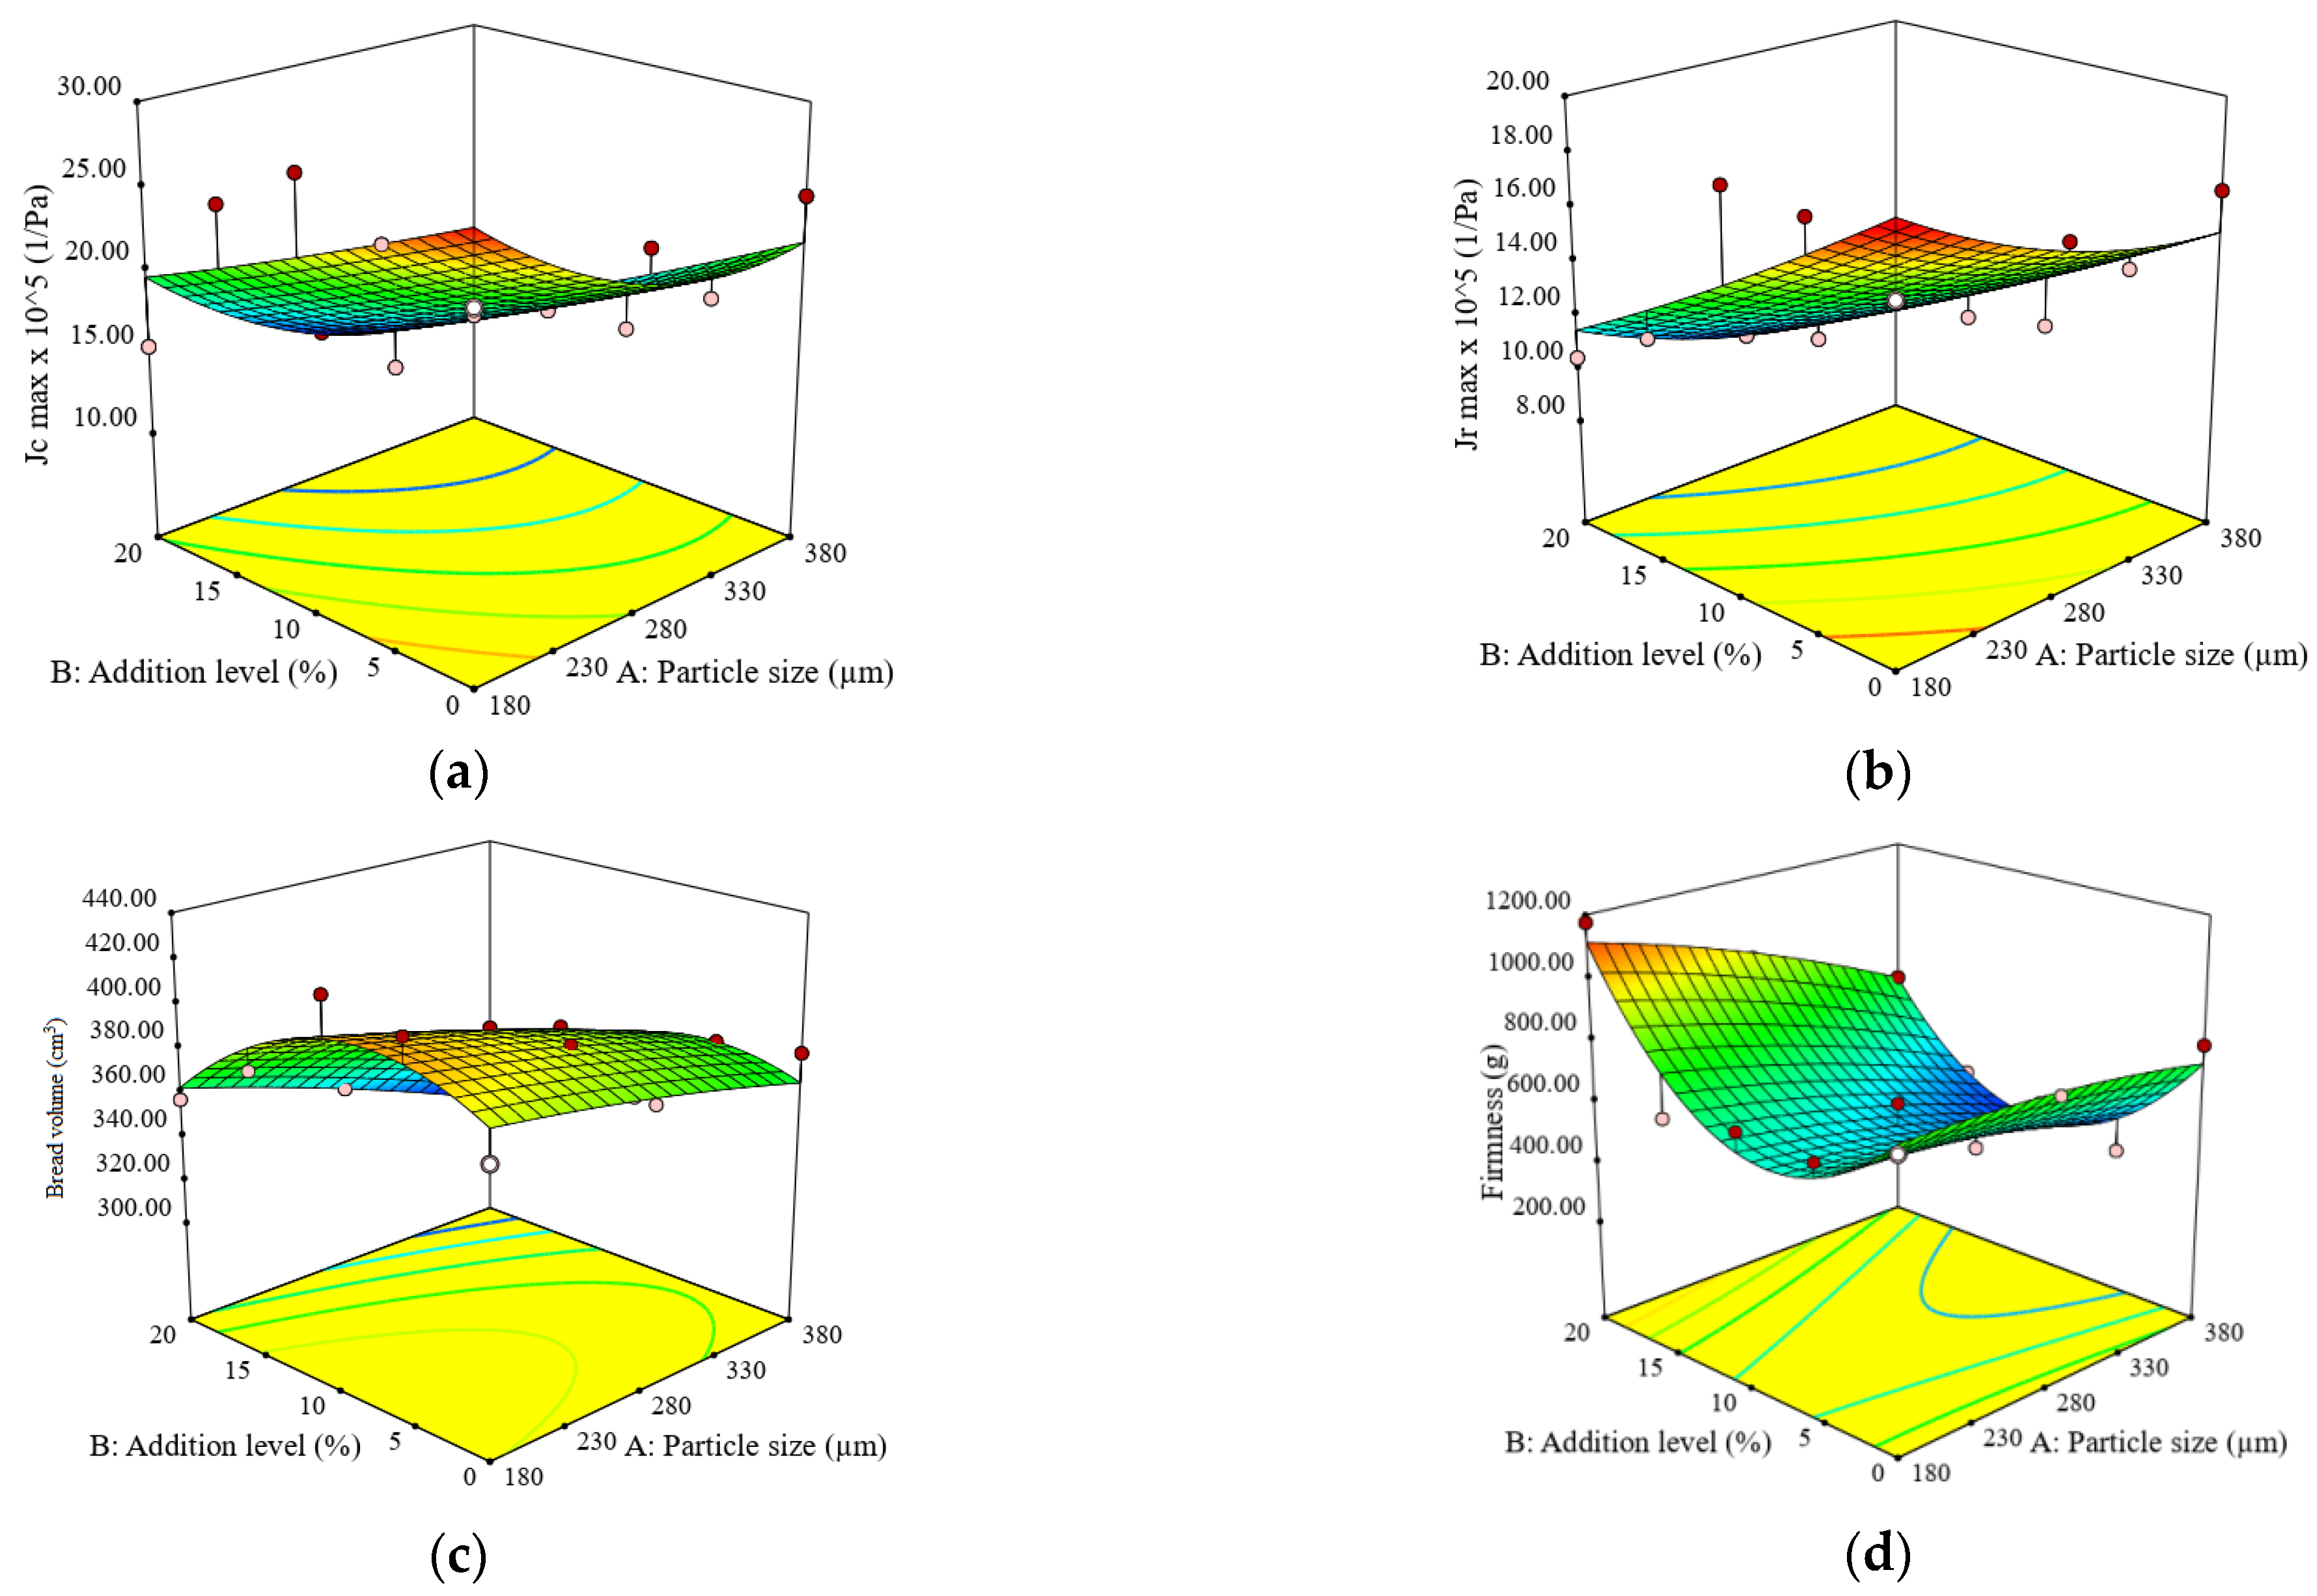
3.2. Impact of Particle Size and Addition Level of Quinoa Flour in Wheat Flour on Dough Fermentation, Dynamic Rheological Properties, and Bread Characteristics

The addition level and particle size had a remarkable effect on the fermentation parameters (Table 3). The quadratic regression model and the 2 FI model were suitable models to predict the variation of dough fermentation parameters depending on the quinoa flour particle size and the addition level and explained between 50 and 98% of data variation (Table 3).
The maximum height of the curve during gas formation and retention (H’m) was substantially associated with the QF addition level. The effect of formulation factors on gas formation and retention indicated an increase in this parameter with increasing in addition level. The particle size does not influence significantly (p > 0.05) the parameter H’m, but a decrease of H’m was observed with the increase of the particle size (Figure 4a). The total volume (TV) of gas formed in the dough was significantly positively influenced (p < 0.05) by the square term of the particle size, while the square term of the addition level determined a significant (p < 0.01) decrease in VT (Table 3). The volume of gas retained (VR) by the dough was considerably improved by the increase in QF addition level. Increasing the QF addition level and particle size resulted in an increase in VR (Figure 4c). The coefficient of gas retention in the dough (CR) decreased considerably when the particle size increased but increased with an increasing level of QF (Figure 4d). The gas retention properties depend on the viscoelastic characteristics of the dough.
The variation of the dynamic dough rheological parameters as a function of quinoa flour particle size, addition level, and the combined effect of the factors, at the frequency of 1 Hz, was accurately predicted by significant (p ˂ 0.05) mathematical models, which explained between 52 and 99% of the data variation (Table 3).
Elastic, G′ and viscous, G″ modulus increased when the quinoa flour addition level increased, while the quinoa particle size did not present a significant effect on the dynamic modulus (Figure 5a, b).
The increase of the QF addition level determined the decrease of the viscosity factor values (tan δ) (Figure 5c).
The maximum gelatinization temperature (Tmax) was significantly influenced (p < 0.01) by the addition level, which caused a decrease in Tmax when the addition level of quinoa flour to refined wheat flour increased (Figure 5d).
The maximum compliance reached in the creep (Jcmax) and recovery (Jrmax) phase was considerably influenced by the particle size and the addition level of quinoa flour in the refined wheat flour (Figure 6a,b). The highest contribution to the Jcmax and Jcmax parameters variation has the addition level (Table 3). Ahmed (2016) [12] specified that dough deformation could be used to characterize the strength of the dough and a harder dough requires more energy to obtain the same deformation compared to a softer dough.
The effect of quinoa flour particle size and addition level on the bread volume is shown in Figure 6c. The volume of bread samples decreased significantly (p < 0.01) with the increase of the addition and particle size of quinoa flour. Quinoa flour at different addition levels and particle sizes had significant effects on the texture profile parameters of the bread samples (Figure 6d). Increasing the addition level of quinoa flour to wheat flour significantly increased the firmness of the bread crumb. Bread with the addition of QF with large particles at 5% had a lower firmness value than wheat flour bread.

3.3. Optimization of the Addition Level for the Particle Sizes of the Studied Quinoa Flour and Evaluation of the Baking Characteristics of the Wheat-Quinoa Composite Flour and the Quality of the Bread

The optimal values of the addition level related to the evaluated particle sizes, for the formulation of the most suitable samples of wheat–quinoa composite flour in order to obtain bakery products with the desired quality attributes, were 9.13% for the large size fraction (L), 10,57% for the medium size fraction (M), and 10,25% for the small size (S) of the quinoa flour particles (Table 4).
The wheat–quinoa composite flours formulated with these optimal addition levels are aimed at obtaining the best technological and quality characteristics of the bread. The results indicated a slight increase in the falling number index in composite flour with small particles compared to the control sample. The values obtained for the water absorption capacity, the stability of the dough, and the C1-2 torque indicated a slight decrease compared to the values characteristic of the control sample. Alveograph parameters indicated an increase in tenacity and alveograph ratio P/L for optimal samples, while extensibility and deformation energy decreased compared to the control. The fermentation behavior of the doughs with quinoa flour was improved in terms of gas formation and retention capacity, compared to the dough obtained from wheat flour.
Elastic and viscous modulus of dough for the optimal samples showed higher values than those of the control sample, and the highest values were obtained for the optimal samples with a medium size (O_QM) and small (Q_QS) of the quinoa flour (Table 4). The addition of medium and small particles in the composite flour led to a firmer dough, this being possible due to the high protein content of the medium QF PS.
The optimal addition levels for each PS and the predicted values of the responses are presented in Table 4.
The variation of the viscosity factor (tan δ) indicated a substantial decrease in samples with small particle size (O_QS), followed by those with medium particle size (O_QM) compared to the control. The maximum gelatinization temperature decreased for all optimal samples compared to the control. A higher deformation resistance indicated by the decrease in compliance was obtained for the optimal samples with large and medium fractions (O_QL and O_QM) compared to the control sample.
In the case of samples with small fractions of quinoa flour (O_QS), the resistance to deformation is close to that of the control sample. The volume of bread decreased for samples with large fractions, while for medium and small fractions of composite flour, it increased, and the highest increase was obtained for composite flours with small fractions. The firmness of the bread crumb decreased compared to the control sample, and the lowest value was obtained for the optimal samples with the small particle size of the quinoa flour.

4. Discussion

The decrease in the FN index could probably be influenced by the phenolic acids present in small particles that bind to α-amylase, change their conformation, and reduces its hydrolytic activity. The increase in the α-amylase activity of composite flour is related to the fact that α-amylase is a metalloenzyme that depends on the presence of calcium ions in the molecule for its activity [33]. It is known that quinoa seeds contain a high level of calcium [19] and, therefore, an increased level of QF in the formulated composite flour will increase the α-amylase activity, improving the quality of the finished product.
The results revealed that fractions with medium particles, followed by those with small particles, absorbed more water compared to the large QF particle size. These results are consistent with the data obtained by Ahmed et al. (2019) [17] and Drakos et al. (2017) [34]. This trend can be influenced by various factors, especially by the composition of the particle size. According to Rao et al. (2016) [35], damaged starch could contribute to the increase of WA in wheat-quinoa composite flours due to the interaction between starch and non-starch components, such as proteins and cell walls. A decrease in WA that occurs with increasing particle size can be explained by the chemical structure of quinoa seeds, which is rich in fiber, and largely encompasses insoluble polysaccharides and cellulose [36], which is located mainly in the endosperm [37], while starch is found in the perisperm. Similar results were obtained by Coțovanu et al. (2020), Iuga et al. (2019), and Mironeasa et al. (2019) [2,28,38] who demonstrated that the small size of gluten-free flour particles increases WA values.
Development time increased remarkably in the composite flour as the level of QF has increased, showing that it takes a long time between the addition of water and the moment when the dough will reach the optimal rheological characteristics. The increase in development time can be explained by the addition of gluten-free flour that has diluted the gluten network. Because DT indicates the strength of the dough, when its value increases, the dough becomes stronger. Additionally, this increase in DT may be due to an increase in the amount of water when the level of quinoa flour is higher and therefore requires more mixing time. Larger particles, which are rich in dietary fiber, require more time for hydration and thus a longer dough development time.
Compared to the control sample, it appears that dough softening caused by the addition of QF is not excessive, probably due to the QF lipid content that is able to form lipids–protein complexes, leading to dough stabilization [39]. The decrease in ST value with increasing of QF level may be related to the lower availability of water in the dough system, as the water absorption capacity decreases with increasing QF level. In addition, the dilution of gluten, due to the addition [of gluten-free flour, decreased the viscoelastic properties of the dough [40] and, therefore, the ST decreased. At a high level of QF, gluten networks can occur with interruptions that can lead to the softening of the dough.
The decrease in C1-2 with increase of PS can be explained by the lower availability of water in the dough system because of an increase in the water absorption capacity of composite flour has been obtained when increasing the addition level or may be related to gluten dilution or increased proteolytic activity. The decrease in C1-2 may be mainly due to the composition of the particles. As shown in previous study, high carbohydrate content was obtained for the large particle size, which showed a low level of protein compared to the medium and small fractions [14]. Regarding the combined effect between particle size and the addition level of QF in refined wheat flour on the protein strength, it was observed that the protein network becomes weaker with increasing temperature. The addition of QF has decreased the protein weakening rate due to the increase of temperature, probably due to the changes in the protein structure that favor enzymatic points of attack and therefore there is an increase in the rate of softening of proteins at higher temperatures. The weakening of the protein network can be related to the increase of the dough proteolytic activity on the temperature range by 45–50 °C, where the enzymes have an optimal activity. This result can be associated with the specific surface area of quinoa starch, which is larger compared to that specific to wheat starch, being more sensitive to the hydrolysis of α-amylase than wheat starch [37].
Starch gelatinization became faster when both studied factors increased, behavior which may be related to the amylase activity of quinoa flour and the amylose–lipid complexes formed during the heating of starch suspensions. Similar results on the effect of particle size on the starch gelatinization process were reported by Martinez-Villaluenga et al. (2020) [41] and Haros and Sanz-Penella (2017) [37] for quinoa flour and may be due to the low amylose content.
In addition, medium and small size fractions had a lower carbohydrate content compared to large particle fractions [14]. The small particles have a large surface area and compete with the starch granules in wheat flour, contributing to a lower viscosity of the dough. An opposite trend was reported by Ahmed et al. (2019) [17] for larger QF particles, which led to a higher viscosity, explained by the smaller surface with a lower swelling capacity. The difference between the particles sizes studied is influenced by their composition and may also be due to the microstructure of quinoa starch particles that support water absorption and gelatinization. This behavior may be due to the combined effect of increasing α-amylase activity in composite flour and compounds present in the composition of quinoa flour fractions [42].
The stability of the hot-formed starch gel may be related to the stability of the already damaged starch granules with increasing temperature [43]. Ahmed et al. (2019) [17] showed that a low amylose content in quinoa seeds can cause more fluid gel formation without such a well-defined three-dimensional structure, contributing to a decrease in C3-4 torque. An increase in C3-4 may be associated with reduced gel stability when hot and may be due to starch damage.
Starch retrogradation increased when PS increased and addition level decreased, which indicates that the set back of starch depends on the proportions of the amylose and amylopectin ratio [44], with the amylose recrystallizing faster than amylopectin. The decrease in C5 torque values suggested that the particle size, with a different chemical composition, influenced the activity of α-amylase in composite flours. This decrease can be attributed to the addition of quinoa flour to wheat flour, which can limit the starch retrogradation and keep the bread fresh.
The increase in dough tenacity (P) with the decrease of wheat flour content in wheat-quinoa composite flour can be explained by the dilution of the gluten network, which has been demonstrated by other authors [45,46]. The influence of particle size on dough extensibility (L) can be correlated with the protein content of this particle size, the results presented being in correlation with those reported by Cappelli et al. (2018) [46].
Deformation energy (W) decreased with the amount of QF added, probably due to the replacement of wheat flour with non-gluten flour, which will lead to dilution of the gluten network, with a decrease in the amount and its quality.
Fermentation process analysis is used to obtain information about dough development and gas formation [47]. The increase of the fermentation parameters can be attributed to the higher availability of substrate (fermentable sugars) in quinoa seeds. Meanwhile, it was observed a decrease of these rheofermentometer parameters when PS increased. This phenomenon can be explained by the presence of fibers that can weaken the gluten network during expansion. Similar results were reported by Föste et al. (2014) [48] when they introduced wholemeal flour and quinoa bran into wheat flour. The decrease in retention capacity as the particle size increased may be due to interruptions in the gluten network caused by interactions between large QF particles and their components with wheat flour proteins. This can be attributed to its high amount of starch and low protein and lipid content [49].
The elastic modulus (G′) values were higher than the modulus (G″) values, so it can be stated that the dough had a viscoelastic behavior. The increase of the particle size and the addition level of QF in wheat flour determined the increase of the G′ and G″ moduli values. These variations in rheological properties could be explained by the different chemical compositions (proteins, lipids, carbohydrates) of the QF particles [14] and the starch granules’ shape, size, and molecular structures [15].
Viscosity factor (tan δ) decreased with the rise of QF amount, that can be explained by the synergistic effect between the amount of starch and large particles, a finding that is consistent with the results obtained by Solaesa et al. (2020) [49].
Tmax decreased when the amount of QF in wheat flour increased, maybe due to the high content of proteins and lipids and the low content of carbohydrates (which are associated with starch). Similar results were reported by Ahmed et al. (2019) [17].
The decrease of the Jcmax and Jrmax with the increase of QF addition level can be caused by the hydroxyl groups from the starch composition that will form covalent and non-covalent bonds, suggesting that the obtained dough is firmer. Due to the starch gelatinization during heating, the water retention capacity and the size of the starch particles increased, which led to an increase in the stiffness of the dough obtained with composite flour compared to the control dough sample. This finding was consistent with the results obtained by Sun et al. (2016) [50], where the hardness of oat-wheat composite dough was higher than that of wheat flour dough.
Particle size and addition level significantly negatively influenced the volume of breads (Table 3). This may be due to proteins (globulins and albumin) in quinoa seeds that retain more water than wheat protein; the gluten network is diluted and decreased the activity of α-amylase. The results were consistent with those reported by previous works [18,51]. The firmness of the crumb is the main determinant of the quality of the bread and is closely related to the perception of fresh bread by consumers. Bread firmness increased when the QF amount rose in composite flour, which may be due to the protein (albumin) in quinoa seeds, as it can act as gluten in the dough. It was observed that all particle sizes of quinoa flour, at 20% addition level, significantly increased the firmness of the bread, which can be explained by reducing the percentage of gluten, being correlated with the high protein content found in these composite flours, which leads to a hard and crunchy bread [50]. These results are accordingly with the results reported by Wang et al. (2021), El-Sohaimy et al., (2019), and Wolter et al. (2013) [18,52,53].
The results of the optimization process for the QF addition level at different PS indicated a decrease in the falling number index for the flours obtained with the optimal addition of large and medium particles. Water absorption capacity, dough stability and consistency during the starch retrogradation stage, extensibility, deformation energy, viscosity factor, and maximum gelatinization temperature decreased especially in the sample obtained with the small particle size optimized flour. Compared to the control sample, an increase in the falling number index and the fermentation parameters was observed in the composite flour with small particles. Bread volume and firmness increased with increasing quinoa flour particle size in the optimized addition level.

5. Conclusions

The values of the falling number index indicated a decrease with the increase of quinoa flour particle size in composite flour, thus an increase in α-amylase activity, extending the alternatives for chemical additives. Particle size significantly decreased the water absorption and protein weakening rate, while starch gelatinization, hot starch gel stability, and starch retrogradation increased. With increasing the addition level of quinoa flour in wheat flour, dough stability followed a decreasing trend, while water absorption and dough development time increased. Higher values compared to the control were obtained for dough tenacity and alveograph ratio, but lower extensibility and deformation energy, with increasing of addition level. The parameters that define the fermentation operation were significantly improved when the amount of quinoa flour added to the wheat flour increased, while the particle size negatively influenced the gas retention coefficient. The viscoelastic moduli increased while the viscosity factor decreased with increasing of addition level. The maximum gelatinization temperature increased when the particle size decreased but the addition dose increased. Creep and recovery compliances decreased when the dose of quinoa flour added to wheat flour increased. Bread volume decreased when quinoa flour particle size and addition level increased, while the firmness followed an opposite trend. The results of the optimization process of the quinoa flour addition level with different particle sizes indicated a decrease in the falling number index for the optimal flours obtained with large and medium particle size. Water absorption, dough stability, starch retrogradation, extensibility, deformation energy, viscosity factor, and maximum gelatinization temperature decreased especially in the sample obtained with the optimal addition level of small particle size of quinoa flour. Compared to the control sample, an increase in the falling number index, the maximum height of the dough during the formation and retention of gases, the total volume of gases formed in the dough, the volume of gases retained in the dough, the retention coefficient and the viscosity factor was observed in the composite flour with small particles. Bread volume and firmness increased with increasing the quinoa flour particle size at the optimal addition level. The optimization of factors in the function of the dough rheological and bread characteristics considered underlined that an addition level of 9.13% large, 10.57% medium, and 10.25% small particle size in wheat flour would be recommended. Thus, these results could be of interest to processors in order to develop new bread formulations with improved dough behavior and bread characteristics: elasticity, volume, and firmness. Subsequent studies regarding the new process conditions corroborated with the nutritional and sensory analysis of the bread obtained after the optimization process would be required.

Supplementary Materials

The following supporting information can be downloaded at: https://www.mdpi.com/article/10.3390/agronomy12102271/s1, Table S1: Actual and coded values of formulation factors in the experimental design.

Author Contributions

Conceptualization, I.C. and S.M.; methodology, I.C. and S.M.; software, I.C. and S.M.; validation, I.C. and S.M.; formal analysis, I.C. and S.M.; investigation, I.C. and S.M.; resources, I.C. and S.M.; data curation, I.C. and S.M.; writing—original draft preparation, I.C. and S.M.; writing—review and editing, I.C. and S.M.; visualization, I.C. and S.M.; supervision, I.C. and S.M.; project administration, I.C. and S.M.; funding acquisition, S.M. All authors have read and agreed to the published version of the manuscript.

Funding

This work was funded by the Ministry of Research, Innovation and Digitalization within Program 1—Development of national research and development system, Subprogram 1.2—Institutional Performance—RDI excellence funding projects, under contract no. 10PFE/2021.

Institutional Review Board Statement

Not applicable.

Informed Consent Statement

Not applicable.

Data Availability Statement

Not applicable.

Acknowledgments

This work was funded by Ministry of Research, Innovation, and Digitalization within Program 1—Development of national research and development system, Subprogram 1.2—Institutional Performance—RDI excellence funding projects, under contract no. 10PFE/2021.

Conflicts of Interest

The authors declare no conflict of interest.

References

  1. Sanz-Penella, J.M.; Wronkowska, M.; Soral-Smietana, M.; Haros, M. Effect of whole amaranth flour on bread properties and nutritive value. LWT-Food Sci. Technol. 2013, 50, 679–685. [Google Scholar] [CrossRef]
  2. Iglesias-Puig, E.; Monedero, V.; Haros, M. Bread with whole quinoa flour and bifidobacterial phytases improve contribution to dietary mineral intake and their bioavailability without substantial loss of bread quality. LWT–Food Sci. Technol. 2015, 60, 71–77. [Google Scholar] [CrossRef]
  3. Ramesh, D.; Prakash, J. Nutritional and functional properties of amaranth grain flour fractions obtained by differential sieving. Prog. Chem. Biochem. Res. 2020, 3, 272–286. [Google Scholar]
  4. Zhang, D.; Moore, W.R. Wheat bran particle size effects on bread baking performance and quality. J. Sci. Food Agric. 1999, 79, 805–809. [Google Scholar] [CrossRef]
  5. Noort, M.W.J.; van Haaster, D.; Hemery, Y.; Schols, H.A.; Hamer, R.J. The effect of particle size of wheat bran fractions on bread quality–Evidence for fibre–protein interactions. J. Cereal Sci. 2010, 52, 59–64. [Google Scholar] [CrossRef]
  6. Cai, L.; Choi, I.; Hyun, J.N.; Jeong, Y.K.; Baik, B.K. Influence of bran particle size on bread-baking quality of whole grain wheat flour and starch retrogradation. Cereal Chem. 2014, 91, 65–71. [Google Scholar] [CrossRef]
  7. Li, S.H.; Zhao, W.; Li, P.L.; Min, G.; Zhang, A.X.; Zhang, J.L.; Liu, J.K. Effects of different cultivars and particle sizes of non-degermed millet flour fractions on the physical and texture properties of Chinese steamed bread. Cereal Chem. 2020, 97, 661–669. [Google Scholar] [CrossRef]
  8. Coţovanu, I.; Mironeasa, C.; Mironeasa, S. Insights into the Potential of Buckwheat Flour Fractions in Wheat Bread Dough. Appl. Sci. 2022, 12, 2302. [Google Scholar] [CrossRef]
  9. Coţovanu, I.; Mironeasa, S. Features of Bread Made from Different Amaranth Flour Fractions Partially Substituting Wheat Flour. Appl. Sci. 2022, 12, 897. [Google Scholar] [CrossRef]
  10. Niu, M.; Hou, G.G.; Wang, L.; Chen, Z. Effects of superfine grinding on the quality characteristics of whole-wheat flour and its raw noodle product. J. Cereal Sci. 2014, 60, 382–388. [Google Scholar] [CrossRef]
  11. Liu, X.; Li, T.; Liu, B.; Zhao, H.; Zhou, F.; Zhang, B. An external addition of soy protein isolate hydrolysate to sourdough as a new strategy to improve the quality of chinese steamed bread. J. Food Qual. 2016, 39, 3–12. [Google Scholar] [CrossRef]
  12. Ahmed, J.; Ptaszek, P.; Basu, S. Influence of fibers and particle size distribution on Food Rheology. In Advances in Food Rheology and Its Applications; Woodhead Publishing: Cambridge, UK, 2016. [Google Scholar]
  13. Penella, J.S.; Collar, C.; Haros, M. Effect of wheat bran and enzyme addition on dough functional performance and phytic acid levels in bread. J. Cereal Sci. 2008, 48, 715–721. [Google Scholar] [CrossRef]
  14. Coțovanu, I.; Batariuc, A.; Mironeasa, S. Characterization of Quinoa Seeds Milling Fractions and Their Effect on the Rheological Properties of Wheat Flour Dough. Appl. Sci. 2020, 10, 7225. [Google Scholar] [CrossRef]
  15. Coţovanu, I.; Ungureanu-Iuga, M.; Mironeasa, S. Investigation of Quinoa Seeds Fractions and Their Application in Wheat Bread Production. Plants 2021, 10, 2150. [Google Scholar] [CrossRef]
  16. Xiong, L.; Zhang, B.; Niu, M.; Zhao, S. Protein polymerization and water mobility in whole-wheat dough influenced by bran particle size distribution. LWT-Food Sci. Technol. 2017, 82, 396–403. [Google Scholar] [CrossRef]
  17. Ahmed, J.; Thomas, L.; Arfat, Y.A. Functional, rheological, microstructural and antioxidant properties of quinoa flour in dispersions as influenced by particle size. Food Res. Int. 2019, 116, 302–311. [Google Scholar] [CrossRef]
  18. Wang, X.; Lao, X.; Bao, Y.; Guan, X.; Li, C. Effect of whole quinoa flour substitution on the texture and in vitro starch digestibility of wheat bread. Food Hydrocoll. 2021, 119, 106840. [Google Scholar] [CrossRef]
  19. Koziol, M.J. Quinoa: A potential new oil crop. In New Crops; Janick, J., Simon, J.E., Eds.; Wiley: New York, NY, USA, 1993; pp. 328–336. [Google Scholar]
  20. Steffolani, M.E.; León, A.E.; Pérez, G.T. Study of the physicochemical and functional characterization of quinoa and kañiwa starches. Stärke 2013, 65, 976–983. [Google Scholar] [CrossRef]
  21. Demin, M.A.; Vucelic-Radovic, B.V.; Banjac, N.R. Buckwheat and Quinoa seeds as supplements in wheat bread production. Hem. Ind. 2013, 67, 115–121. [Google Scholar] [CrossRef]
  22. Poutanen, K.; Sozer, N.; Della Valle, G. How can technology help to deliver more of grain in cereal foods for a healthy diet? J. Cereal Sci. 2014, 59, 327–336. [Google Scholar] [CrossRef]
  23. SR 90:2007; Wheat Flour. Analysis Method. Romanian Standards Association: Bucharest, Romania, 2007.
  24. ICC. Standard Methods of the International Association for Cereal Chemistry. Methods 104/1, 110/1, 136, 105/2, 171, 121, 107/1, 173; International Association for Cereal Chemistry: Vienna, Austria, 2010. [Google Scholar]
  25. Coțovanu, I.; Mironeasa, S. Impact of different amaranth particle size addition level on wheat flour dough rheology and bread features. Foods 2021, 10, 1539. [Google Scholar] [CrossRef] [PubMed]
  26. Coțovanu, I.; Stoenescu, G.; Mironeasa, S. Amaranth Influence on Wheat Flour Dough Rheology: Optimal Particle Size and Amount of Flour Replacement. J. Microbiol. Biotechnol. Food Sci. 2020, 10, 366–373. [Google Scholar] [CrossRef]
  27. Rasper, V.F.; Walker, C.E. Quality evaluation of cereals and cereal products. In Handbook of Cereal Science and Technology; Kulp, K., Ponte, J.G., Eds.; Marcel Dekker: New York, NY, USA, 2000; Chapter 16. [Google Scholar]
  28. Iuga, M.; Mironeasa, C.; Mironeasa, S. Oscillatory rheology and creep-recovery behaviour of grape seed-wheat flour dough: Effect of grape seed particle size, variety and addition level. Bull. Univ. Agric. Sci. Vet. Med. Cluj-Napoca. Food Sci. Technol. 2019, 76, 40–51. [Google Scholar] [CrossRef]
  29. Iuga, M.; Boestean, O.; Ghendov-Mosanu, A.; Mironeasa, S. Impact of dairy ingredients on wheat flour dough rheology and bread properties. Foods 2020, 9, 828. [Google Scholar] [CrossRef]
  30. Struyf, N.; Verspreet, J.; Courtin, C.M. The effect of amylolytic activity and substrate availability on sugar release in non-yeasted dough. J. Cereal Sci. 2016, 69, 111–118. [Google Scholar] [CrossRef]
  31. Wang, H.; Xu, K.; Liu, X.; Zhang, Y.; Xie, X.; Zhang, H. Understanding the structural, pasting and digestion properties of starch isolated from frozen wheat dough. Food Hydrocoll. 2021, 111, 106168. [Google Scholar] [CrossRef]
  32. Ma, Y.; Wu, D.; Guo, L.; Yao, Y.; Yao, X.; Wang, Z.; Wu, K.; Cao, X.; Gao, X. Effects of Quinoa Flour on Wheat Dough Quality, Baking Quality, and in vitro Starch Digestibility of the Crispy Biscuits. Front. Nutr. 2022, 9, 846808. [Google Scholar] [CrossRef]
  33. Sundarram, A.; Murthy, T.P.K. α-amylase production and applications: A review. J. Appl. Environ. Microbiol. 2014, 2, 166–175. [Google Scholar] [CrossRef]
  34. Drakos, A.; Kyriakakis, G.; Evageliou, V.; Protonotariou, S.; Mandala, I.; Ritzoulis, C. Influence of jet milling and particle size on the composition, physicochemical and mechanical properties of barley and rye flours. Food Chem. 2017, 215, 326–332. [Google Scholar] [CrossRef]
  35. Rao, B.D.; Anis, M.; Kalpana, K.; Sunooj, K.V.; Patiul, J.V.; Ganesh, T. Influence of milling methods and particle size hydration properties of sorghum flour and quality of sorghum biscuits. LWT-Food Sci. Technol. 2016, 67, 8–13. [Google Scholar] [CrossRef]
  36. Lamothe, L.M.; Srichuwong, S.; Reuhs, B.L.; Hamaker, B.R. Quinoa (Chenopodium quinoa W.) and amaranth (Amaranthus caudatus L.) provide dietary fibres high in pectic substances and xyloglucans. Food Chem. 2015, 167, 490–496. [Google Scholar] [CrossRef]
  37. Haros, C.M.; Sanz-Penella, J.M. Food uses of whole pseudocereals. In Pseudocereals: Chemistry and Technology; Haros, M., Schoenlechner, R., Eds.; Wiley: Oxford, UK, 2017; pp. 163–192. [Google Scholar]
  38. Mironeasa, S.; Iuga, M.; Zaharia, D.; Mironeasa, C. Optimization of grape peels particle size and flour substitution in white wheat flour dough. Sci. Study Res. Chem. Eng. Biotechnol. Food Ind. 2019, 20, 29–42. [Google Scholar]
  39. Carr, N.O.; Daniels, N.W.; Frazier, P.J. Lipid interactions in breadmaking. Crit. Rev. Food Sci. Nutr. 1992, 31, 237–258. [Google Scholar] [CrossRef] [PubMed]
  40. Mironeasa, S.; Zaharia, D.; Codină, G.G.; Ropciuc, S.; Iuga, M. Effects of grape peels addition on mixing, pasting and fermentation characteristics of dough from 480 wheat flour type. Bull. UASVM Food Sci. Technol. 2018, 75, 27–35. [Google Scholar] [CrossRef]
  41. Martínez-Villaluenga, C.; Peñas, E.; Hernández-Ledesma, B. Pseudocereal grains: Nutritional value, health benefits and current applications for the development of gluten-free foods. Food Chem. Toxicol. 2020, 137, 111178. [Google Scholar] [CrossRef] [PubMed]
  42. Wang, S.; Zhu, F. Formulation and Quality Attributes of Quinoa Food Products. Food Bioprocess Technol. 2016, 9, 49–68. [Google Scholar] [CrossRef]
  43. Liu, X.L.; Mu, T.H.; Sun, H.N.; Zhang, M.; Chen, J.W. Influence of potato flour on dough rheological properties and quality of steamed bread. J. Integr. Agric. 2016, 15, 2666–2676. [Google Scholar] [CrossRef]
  44. BeMiller, J.N. Starches: Molecular and granular structures and properties. In Carbohydrate Chemistry for Food Scientists, 3rd ed.; BeMiller, J.N., Ed.; Elsevier Inc.: Amsterdam, The Netherlands, 2019; pp. 159–189. [Google Scholar]
  45. Coțovanu, I.; Mironeasa, S. Buckwheat seeds: Impact of milling fractions and addition level on wheat bread dough rheology. Appl. Sci. 2021, 11, 1731. [Google Scholar] [CrossRef]
  46. Cappelli, A.; Cini, E.; Guerrini, L.; Masella, P.; Angeloni, G.; Parenti, A. Predictive models of the rheological properties and optimal water content in doughs: An application to ancient grain flours with different degrees of refining. J. Cereal Sci. 2018, 83, 229–235. [Google Scholar] [CrossRef]
  47. Hager, A.S.; Wolter, A.; Czerny, M.; Bez, J.; Zannini, E.; Arendt, E.K.; Czerny, M. Investigation of product quality, sensory profile and ultrastructure of breads made from a range of commercial gluten-free flours compared to their wheat counterparts. Eur. Food Res. Technol. 2012, 235, 333–344. [Google Scholar] [CrossRef]
  48. Föste, M.; Nordlohne, S.D.; Elgeti, D.; Linden, M.H.; Heinz, V.; Jekle, M.; Becker, T. Impact of quinoa bran on gluten-free dough and bread characteristics. Eur. Food Res.Technol. 2014, 239, 767–775. [Google Scholar] [CrossRef]
  49. Solaesa, Á.G.; Villanueva, M.; Vela, A.J.; Ronda, F. Protein and lipid enrichment of quinoa (cv. Titicaca) by dry fractionation. Techno-functional, thermal and rheological properties of milling fractions. Food Hydrocoll. 2020, 105, 105770. [Google Scholar] [CrossRef]
  50. Sun, J.J.; Wei, X.P.; Qiu, Y.Y.; Luan, G.Z.; Shi, L.; Eizo, T. Effect of dry method gelatinization on the stress relaxation properties of oat flour dough. J. Chin. Cereals Oils Assoc. 2016, 31, 23–27. [Google Scholar]
  51. Kurek, M.A.; Sokolova, N. Optimization of bread quality with quinoa flour of different particle size and degree of wheat flour replacement. Food Sci. Technol. 2020, 40, 307–314. [Google Scholar] [CrossRef]
  52. El-Sohaimy, S.A.; Shehata, M.G.; Mehany, T.; Zeitoun, M.A. Nutritional, Physicochemical, and Sensorial Evaluation of Flat Bread Supplemented with Quinoa Flour. Int. J. Food Sci. 2019, 2019, 4686727. [Google Scholar] [CrossRef]
  53. Wolter, A.; Hager, A.S.; Zannini, E.; Arendt, E.K. In vitro starch digestibility and predicted glycaemic indexes of buckwheat, oat, quinoa, sorghum, teff and commercial gluten-free bread. J. Cereal Sci. 2013, 58, 431–436. [Google Scholar] [CrossRef]
Figure 1. 3D response surface graphic presenting the effect of quinoa flour particle size and addition level on: (a) falling number index (FN), (b) water absorption (WA), (c) development time (DT), and (d) dough stability (ST).
Agronomy 12 02271 g001
Figure 2. 3D response surface graphic presenting the effect of quinoa flour particle and addition level on: (a) protein weakening (C1-2); (b) starch gelatinization (C3-2); (c) cooking stability (C3-4); (d) starch retrogradation (C5-4).
Agronomy 12 02271 g002
Figure 3. 3D response surface graphic presenting the effect of quinoa flour particle size and addition level on: (a) dough tenacity (P); (b) dough extensibility (L); (c) deformation energy (W); (d) alveograph ratio (P/L).
Agronomy 12 02271 g003
Figure 4. 3D response surface graphic presenting the effect of quinoa flour particle and addition level on: (a) maximum height of the gas release curve (H’m); (b) total CO2 volume production (VT); (c) volume of the gas retained in the dough at the end of the test (VR); (d) retention coefficient (CR).
Agronomy 12 02271 g004
Figure 5. 3D response surface graphic presenting the effect of quinoa flour particle and addition level on: (a) storage modulus (G’); (b) loss modulus (G″); (c) viscosity factor (tan δ); (d) maximum gelatinization temperature (Tmax).
Agronomy 12 02271 g005aAgronomy 12 02271 g005b
Figure 6. 3D response surface graphic presenting the effect of quinoa flour particle and addition level on: (a) maximum creep test (Jcmax); (b) maximum recovery test (Jrmax); (c) bread volume (BV); (d) bread firmness (BF).
Agronomy 12 02271 g006
Table 1. Effects of PS and QF addition level on: (a) falling number and dough Mixolab parameters, (b) Alveograph and Rheofermentometer parameters, (c) dynamic rheology and bread characteristics.
(a)
RunFalling
Number
Mixolab
FN
(s)
WA
(%)
DT
(min)
ST
(min)
C1-2
(N m)
C3-2
(N m)
C3-4
(N m)
C5-4
(N m)
1277.00 ± 8.41 i59.00 ± 1.04 abc5.72 ± 0.06 c8.40 ± 0.16 h0.65 ± 0.03 ab1.27 ± 0.05 gh0.36 ± 0.01 e0.73 ± 0.03 g
2292.00 ± 5.35 h57.50 ± 0.75 c5.57 ± 0.04 d9.93 ± 0.09 b0.63 ± 0.03 bc1.34 ± 0.03 def0.35 ± 0.00 a0.80± 0.02 f
3300.00 ± 6.56 fg57.30 ± 0.81 c2.13 ± 0.06 g10.35 ± 0.10 a0.56 ± 0.03 f1.37 ± 0.05 bcd0.23 ± 0.01 c0.87 ± 0.03 d
4306.00 ± 8.25 e58.20 ± 1.81 bc1.67 ± 0.01 h9.93 ± 0.12 b0.59 ± 0.02 de1.42 ± 0.03 ab0.12 ± 0.00 e1.00 ± 0.02 b
5312.00 ± 9.25 d58.50 ± 1.11 bc1.69 ± 0.07 h9.96 ± 0.39 b0.61 ± 0.01 cd1.41 ± 0.02 a0.05 ± 0.00 f1.15 ± 0.04 a
6299.50 ± 11.32 g59.40 ± 0.92 a5.18 ± 0.20 e9.32 ± 0.22 e0.65 ± 0.02 ab1.27 ± 0.02 gh0.31 ± 0.00 e0.71 ± 0.02 g
7304.00 ± 9.47 efg58.10 ± 0.82 bc1.55 ± 0.06 i9.58 ± 0.27 cd0.61 ± 0.02 cd1.32 ± 0.02 fg0.22 ± 0.00 cd0.86 ± 0.01 de
8304.00 ± 9.47 ef58.20 ± 1.17 bc1.47 ± 0.07 j9.65 ± 0.40 c0.61 ± 0.01 cd1.35 ± 0.02 cde0.18 ± 0.00 d0.83 ± 0.02 e
9299.00 ± 27.15 g58.10 ± 1.47 bc1.70 ± 0.05 h9.85 ± 0.17 b0.57 ± 0.02 ef1.40 ± 0.02 abc0.12 ± 0.00 e0.96 ± 0.02 b
10312.00 ± 8.75 d58.50 ± 0.92 bc1.69 ± 0.02 h9.96 ± 0.16 b0.61 ± 0.03 cd1.41 ± 0.06 a0.05 ± 0.01 f1.15 ± 0.03 a
11325.00 ± 13.41 c59.60 ± 1.16 a6.02 ± 0.07 b8.85 ± 0.15 g0.66 ± 0.01 a1.20 ± 0.02 i0.24 ± 0.00 c0.56 ± 0.01 i
12334.50 ± 5.13 b59.40 ± 1.28 a4.60 ± 0.03 f9.07 ± 0.32 f0.64 ± 0.01 ab1.26 ± 0.02 h0.21 ± 0.00 cd0.64 ± 0.01 h
13347.00 ± 9.25 a58.70 ± 1.10 ab6.13 ± 0.06 a9.55 ± 0.12 f0.62 ± 0.03 cd1.32 ± 0.05 ef0.18 ± 0.01 d0.80 ± 0.03 f
14325.50 ± 14.25 c58.90 ± 1.57 ab1.28 ± 0.14 k9.48 ± 0.15 d0.63 ± 0.02 abc1.36 ± 0.01 bcde0.12 ± 0.01 e0.93 ± 0.01 c
15312.00 ± 10.75 d58.50 ± 1.05 bc1.69 ± 0.06 h9.96 ± 0.38 b0.61 ± 0.01 cd1.41 ± 0.03 a0.05 ± 0.00 f1.15 ± 0.04 a
(b)
RunAlveographRheofermentometer
P
(mm H2O)
L
(mm)
W (×10−4)
(J)
P/L
(adim.)
H‘m
(mm)
TV
(mL)
VR
(mL)
CR
(%)
1113 ± 1.49 b35 ± 0.56 i142 ± 1.96 g3.21 ± 0.05 d65.10 ± 2.22 e1168 ± 43.32 g1113 ± 39.86 a86.70 ± 2.68 e
2104 ± 1.76 c33 ± 0.76 j158 ± 2.62 f3.39 ± 0.04 c68.10 ± 2.80 a1285 ± 18.35 a1101 ± 13.11 b83.80 ± 1.18 i
3103 ± 1.69 cd40 ± 0.55 gh166 ± 1.90 e2.65 ± 0.03 h62.80 ± 3.50 c1245 ± 36.04 b1090 ± 37.44 d87.00 ± 2.19 d
489 ± 1.49 fg47 ± 0.74 d168 ± 5.69 e1.80 ± 0.03 j63.70 ± 3.03 g1220 ± 16.68 d1068 ± 18.71 d83.40 ± 1.26 j
587 ± 2.66 g94 ± 3.67 a253 ± 9.87 a0.93 ± 0.03 l62.00 ± 1.18 i1168 ± 18.69 g991 ± 15.86 i84.80 ± 1.36 g
6113 ± 1.85 b29 ± 0.80 k145 ± 5.15 g3.92 ± 0.04 b65.40 ± 2.89 d1140 ± 15.46 i997 ± 17.76 hi87.40 ± 1.17 c
7118 ± 1.40 a26 ± 0.80 l174 ± 5.42 d4.53 ± 0.03 a67.80 ± 2.65 ab1190 ± 17.89 f1055 ± 18.61 e84.50 ± 1.37 h
8101 ± 2.44 cd42 ± 2.82 fg174 ± 0.12 d2.35 ± 0.03 g64.30 ± 1.12 f1185 ± 23.36 f1035 ± 18.75 f87.40 ± 1.70 c
9103 ± 2.11 cd43 ± 1.09 ef174 ± 6.59 d2.44 ± 0.04 f63.90 ± 1.28 fg1200 ± 20.45 e995 ± 39.60 hi84.60 ± 1.47 h
1087 ± 1.16 g94 ± 0.27 a253 ± 1.34 a0.93 ± 0.03 l62.00 ± 1.71 i1168 ± 28.60 g991 ± 24.08 i84.80 ± 2.31 g
1181 ± 1.38 h37 ± 1.32 hi124 ± 2.60 h2.18 ± 0.02 h65.90 ± 1.43 c1150 ± 26.58 h1005 ± 23.12 h88.00 ± 1.81 b
1292 ± 2.06 f44 ± 1.06 de158 ± 6.08 e2.22 ± 0.04 h67.60 ± 2.70 b1220 ± 29.48 d1070 ± 26.06 d88.50 ± 1.68 a
1396 ± 0.65 e53 ± 0.48 c180 ± 0.96 c1.87 ± 0.01 i65.80 ± 1.24 c1270 ± 26.85 b1077 ± 9.61 c88.30 ± 1.76 f
1499 ± 1.30 d59 ± 0.40 b204 ± 4.72 b1.55 ± 0.03 k65.20 ± 2.82 de1250 ± 11.97 c1024 ± 9.86 g85.40 ± 0.81 a
1587 ± 2.61 g94 ± 3.57 a253 ± 9.61 a0.93 ± 0.03 l62.00 ± 1.15 i1168 ± 21.02 g991 ± 15.86 i84.80 ± 1.70 g
(c)
RunRheometerBread Characteristics
G′
(Pa)
G″
(Pa)
tan δ (adim.)Tmax
(°C)
Jcmax (×10−5) (Pa−1)Jrmax (×10−5)
(Pa−1)
BV
(cm3)
BF
(g)
155,380 ± 542 c16,525 ± 200 d0.3108 ± 0.01 j81.76 ± 1.55 a15.22 ± 0.44 g10.92 ± 0.31 h316.65 ± 7.71 l727.50 ± 9.89 d
245,430 ± 422 h14,870 ±180 g0.3315 ± 0.01 g79.36 ± 1.27 b12.57 ± 0.34 hi8.85 ± 0.24 m358.63 ± 4.88 h459.00 ± 10.76 k
347,360 ± 976 g15,565 ± 359 f0.3350 ± 0.01 f82.36 ± 3.21 ab13.05 ± 0.58 h9.53 ± 0.32 k335.11 ± 5.63 k428.00 ± 12.58 l
452,790 ± 224 d17,125 ±101 c0.3210 ± 0.00 i79.63 ± 1.43 b16.69 ± 0.26 f12.77 ± 0.24 e372.80 ± 6.69 g350.00 ± 17.00 m
526,370 ± 237 m9488 ± 85 m0.3698 ± 0.00 a83.24 ± 2.16 ab24.50 ± 0.42 d16.62 ± 0.37 c378.20 ± 14.75 f786.00 ± 7.07 c
665,040 ± 143 a19,840 ± 77 a0.3080 ± 0.00 k81.48 ± 2.36 ab12.82 ± 0.48 hi9.13 ± 0.12 l339.10 ± 6.20 j932.00 ± 4.69 b
757,130 ± 319 b18,470 ± 102 b0.3250 ± 0.00 h80.38 ± 1.61 b12.31 ± 0.14 i10.06 ± 0.18 j372.70 ± 6.39 g637.50 ± 4.18 g
834,865 ± 316 j11,935 ± 104 i0.3498 ± 0.00 c83.24 ± 2.00 ab17.32 ± 0.25 f12.48 ± 0.40 f389.58 ± 14.37 d596.00 ± 6.29 i
947,380 ± 191 f16,300 ± 80 e0.3440 ± 0.00 d79.36 ± 1.51 b20.52 ± 0.44 e14.68 ± 0.09 d392.67 ± 10.35 c537.00 ± 12.61 j
1026,370 ± 710 m9488 ± 227 m0.3400 ± 0.01 a81.95 ± 1.31 ab24.50 ± 0.13 d16.62 ± 0.41 c378.20 ± 4.16 f786.00 ± 30.71 c
1139,020 ± 541 i11,680 ± 204 j0.3600 ± 0.01 e82.46 ± 1.65 ab15.40 ± 0.63 g10.41 ± 0.35 i357.13 ± 7.48 i1176.00 ± 4.62 a
1248,890 ± 297 e14,780 ± 75 h0.3080 ± 0.00 b80.15 ± 1.76 b25.48 ± 0.50 c12.19 ± 0.20 g381.24 ± 6.28 e630.00 ± 11.91 h
1332,860 ± 621 k10,853 ± 224 k0.3350 ± 0.01 f82.79 ± 1.49 ab28.67 ± 0.38 a18.55 ± 0.36 a424.35 ± 4.70 a675.50 ± 13.24 e
1431,600 ± 297 l10,510 ± 133 l0.3300 ± 0.00 g80.48 ± 1.45 b26.24 ± 0.52 b18.38 ± 0.22 b417.58 ± 5.16 b671.00 ± 5.24 f
1526,370 ± 316 m9488 ± 104 m0.3698 ± 0.00 a83.24 ± 2.33 ab24.50 ± 0.38 d16.62 ± 0.46 c378.20 ± 14.37 f786.00 ± 6.29 c
(a) FN—falling number index; WA—water absorption; DT—development time; ST—stability; C1-2—speed of protein weakening stage; C3-2—starch gelatinization; C3-4—gel hot stability; C5-4—starch retrogradation. (b) P—dough tenacity; L—dough extensibility; W—deformation energy; P/L—alveograph ratio; H’m—maximum height of the gas release curve; TV—total volume of gas produced; VR—volume of the gas retained in the dough; CR—retention coefficient. (c) G′, G″—elastic and viscous modulus; tan δ—viscosity factor; Tmax—maximum gelatinization temperature; Jcmax, Jrmax—maximum creep-recovery compliance; BV—bread volume; BF—bread firmness; a–m, mean values in the same column followed by different letters are significantly different (p < 0.05).
Table 2. The coefficients in the predictive models for FN index, Mixolab, and Alveograph parameter.
FactorsParameters
Falling NumberMixolab Alveograph
FN
(s)
WA
(%)
DT
(min)
ST
(min)
C1-2
(N⋅m)
C3-2
(N⋅m)
C3-4
(N⋅m)
C5-4
(N⋅m)
P
(mm H2O)
L
(mm)
W
(×10−4)
(J)
P/L
(adim.)
Constant307.9958.061.939.590.591.360.180.87109.0735.18171.433.10
A−15.65 ***−0.46 **−0.290.16−0.01 *0.02 **0.03 **0.04 **4.20−3.80−3.200.31
B−4.530.32 *2.05 *−0.48 **0.02 **−0.08 **0.12 ***−0.22 ***7.07 *−27.20 ***−50.13 ***1.15 **
A × B−11.95 **−0.24−0.002−0.04−0.0010.01*0.03 **0.04 *7.70 *−0.307.200.30
A29.25 *0.101.33-0.011−0.010.01−0.04−9.20 *6.80−3.40−0.75 *
B2−8.380.80**0.77-0.03 *−0.02−0.010.06 *−9.33 *23.24 **25.14 *−0.53
Model evaluation
R20.890.790.710.570.780.980.980.970.790.930.880.86
Adj.-R20.830.670.550.450.660.970.960.950.670.890.810.79
p-value0.00040.00740.02690.02130.008˂0.0001˂0.0001˂0.00010.0076˂0.00010.00060.0011
*** p < 0.001, ** p < 0.01, * p < 0.05, A—particle size (µm), B—level of quinoa flour added in refined wheat flour (%), R2, Adj.-R2—measures of model fit, FN—falling number, WA—water absorption, DT—development time, ST—stability, C1-2—consistency reached during protein weakening stage, C3-2—consistency reached during starch gelatinization stage, C3-4—consistency reached during the stability of hot starch gel, C5-4—consistency during starch retrogradation stage, P—dough tenacity, L—dough extensibility, W—deformation energy, P/L—Alveograph ratio.
Table 3. The coefficients in the predictive models during dough fermentation, dynamic rheological and bread properties.
FactorsParameters
RheofermentometerRheometerBread Parameters
H‘m
(mL)
VT
(mL)
VR
(mL)
CR
(%)
G′
(Pa)
G″
(Pa)
tan δ
(adim.)
Tmax
(°C)
Jcmax (×10−5)
(Pa−1)
Jrmax (×10−5)
(Pa−1)
BV
(cm3)
BF
(g)
Constant65.501216.651040.3685.9647885.1013794.500.333878.7817.4012.47388.68521.46
A−0.482.8019.60 *−0.93 *4859.001626.150.0025−0.16−3.83 **−1.75 *−19.71 **−118.85 **
B2.10 **−4.4728.20 **1.25 *12022.67 **2889.80 *−0.0255 ***−1.61 **−4.88 **−3.57 **−20.93 **74.87 *
A × B0.0413.1020.30-807.00316.500.00510.52−0.370.32−5.88−74.85
A20.1437.80 *38.40 **-−5550.00-−0.00740.102.740.89−2.46−28.75
B2−1.65−80.10 **−51.52 **-−3456.19-0.00212.29 **0.180.24−28.45 *352.48 ***
Model evaluation
R20.710.810.870.530.680.520.890.770.740.780.810.90
Adj.-R20.540.710.790.400.500.390.830.650.600.650.710.85
(p-value)0.02790.00430.00100.03550.04050.03740.00050.00980.01710.00880.00420.0003
*** p < 0.001, ** p < 0.01, * p < 0.05, A—particle size (µm), B—level of quinoa flour added in refined wheat flour (%), R2, Adj.-R2—measures of model fit, H’m—maximum height of the gas release curve, VT—total CO2 volume production, VR—volume of the gas retained in the dough at the end of the assay, CR—retention coefficient, G′—elastic modulus, G″—viscous modulus, tan δ—viscosity factor, Tmax—maximum gelatinization temperature, Jcmax—maximum creep compliance, Jrmax—maximum recovery compliance, BV—bread volume, BF—bread firmness.
Table 4. Wheat flour dough and optimized composite flour for each quinoa flour particle size.
ParametersControl SampleO_QLO_QMO_QS
100% WF9.13%10.57%10.25%
FN (s)312.00 ± 5.25 b303.47 ± 7.23 c308.29 ± 6.25 bc331.71 ± 7.45 a
Water absorption (%)58.50 ± 0.02 a57.70 ± 0.38 b58.04 ± 0.52 ab58.55 ± 4.47 a
Development time (min)1.69 ± 0.15 d2.73 ± 0.25 b1.77 ± 0.14 c3.28 ± 0.24 a
Stability (min)9.96 ± 0.65 a9.82 ± 0.37 b9.62 ± 0.56 c9.48 ± 0.74 d
C1-2 (N∙m)0.61 ± 0.02 a0.59 ± 0.01 a0.59 ± 0.02 a0.61 ± 0.02 a
C3-2 (N∙m)1.41 ± 0.02 a1.37 ± 0.01 ab1.36 ± 0.05 ab1.33 ± 0.07 b
C3-4 (N∙m)0.05 ± 0.04 d0.21 ± 0.02 a0.17 ± 0.01 b0.15 ± 0.03 c
C5-4 (N∙m)1.15 ± 0.03 a0.90 ± 0.03 b0.89 ± 0.02 b0.81 ± 0.04 b
P (mm H2O)87.00 ± 5.75 d102.13 ± 6.41 b108.44 ± 3.25 a95.57 ± 6.52 c
L (mm)91.00 ± 8.58 a41.86 ± 4.02 c37.50 ± 2.78 d49.91 ± 3.45 b
W (×10−4) (J)253.00 ± 20.14 a170.41 ± 17.30 d175.59 ± 12.14 c179.58 ± 11.12 b
P/L (adim.)0.95 ± 0.05 d2.47 ± 0.15 b3.00 ± 0.25 a1.91 ± 0.08 c
H’m (mm)62.00 ± 4.25 b64.87 ± 3.52 a65.32 ± 3.47 a65.80 ± 3.47 a
VT (mL)1168.00 ± 89.56 c1255.01 ± 75.12 a1216.49 ± 75.65 b1252.54 ± 7.50 a
VR (mL)991.00 ± 85.25 d1091.70 ± 20.18 a1037.77 ± 74.85 c1057.10 ± 8.25 b
CR (%)84.80 ± 2.50 b84.94 ± 1.34 b85.86 ± 4.75 b95.57 ± 4.45 a
G′ (Pa)26,370.00 ± 180.00 a45,583.51 ± 427.52 a46,901.51 ± 285.69 a35,868.67 ± 269.17 a
G″ (Pa)9488.00 ± 74.58 d15,030.90 ± 120.58 a13,563.39 ± 350.45 b11,814.53 ± 200.47 c
tan δ (adim.)0.362 ± 0.02 a0.331 ± 0.01 c0.336 ± 0.02 b0.328 ± 0.01 c
Tmax (°C)83.24 ± 0.55 a78.88 ± 1.06 b78.92 ± 1.78 b79.37 ± 4.25 b
Jcmax (×10−5) (Pa−1)24.50 ± 2.35 a16.95 ± 1.25 b17.79 ± 1.32 b24.58 ± 1.25 a
Jrmax (×10−5) (Pa−1)16.62 ± 2.40 a12.01 ± 0.85 d12.75 ± 1.00 c15.64 ± 1.23 b
Bread volume (cm3)372.20 ± 15.25 c369.34 ± 17.78 c390.16 ± 16.78 b407.46 ± 17.85 a
Bread firmness (g)786.00 ± 68.52 a379.06 ± 20.36 d517.72 ± 35.78 c597.64 ± 45.14 b
FN—falling number, C1-2—consistency reached during protein weakening stage, C3-2—consistency reached during starch gelatinization stage, C3-4—consistency reached during the stability of hot starch gel, C5-4—consistency during starch retrogradation stage, P—dough tenacity, L—dough extensibility, W—deformation energy, P/L—Alveograph ratio, H’m—maximum height of the gas release curve, VT—total CO2 volume production, VR—volume of the gas retained in the dough at the end of the assay, CR—retention coefficient, G′—elastic modulus, G″—viscous modulus, tan δ—viscosity factor, Tmax—maximum gelatinization temperature, Jcmax—maximum creep compliance, Jrmax—maximum recovery compliance. a–d, mean values in the same row followed by different letters are significantly different (p < 0.05).
Publisher’s Note: MDPI stays neutral with regard to jurisdictional claims in published maps and institutional affiliations.

