Abstract
This paper is focused on intervention scenarios for smallholder potato value chains in Kenya that improve yields, reduce losses, minimize greenhouse gas (GHG) emissions and increase economic performance and food security. For that, business models and GHG emission estimates are developed, based on the existing data, combined with relevancy and time-to-impact analysis using practical real-life information from stakeholders in the potato sector, which is the second largest agricultural crop in Kenya after maize. The results show that profitability, environmental improvement and food security can go hand in hand with realistic short-term interventions for potato production at smallholder farms.
1. Introduction
In 2011, the food loss and waste (FLW) worldwide was estimated to be one-third of all the food produced for human consumption [1]. Recently, the Food and Agriculture Organization of the United Nations (FAO) proposed to split up the definition of FLW in separate Food Loss and Food Waste indicators, and provided an estimate for worldwide Food Losses of 14% of total production (Food Loss Index) [2]. Meanwhile, estimates for the Food Waste Index are under preparation by the United Nations Environment Program. In the context of the Sustainable Development Goals (SDGs), attention is increasing on other outcomes of food production as well, including greenhouse gas (GHG) emissions, resource depletion, food security and farmer livelihoods. Guo et al. [3] conducted a detailed analysis of the relation between FLW and food loss-induced GHG emissions emitted in the production and distribution of food that is ultimately lost or wasted. The general results of this research show that the total global FLW in 2017 amounted to approximately 1.9 Gt of food, and the associated food loss-induced GHG emissions were estimated at 2.5 Gt CO2-equivalent, amounting to some 4% of total anthropogenic GHG emissions.
The relevance of the environmental impact of food supply chains is beyond dispute. The indicators commonly used are resource use (land and water use), GHG emissions, marine and terrestrial eutrophication, acidification and soil depletion [4]. However, there are many possible extensions of this list of indicators [5,6]. It is worthwhile to note that food waste itself is not commonly used as an indicator, but an input to calculate the environmental impact [7]. In many scientific studies, food supply chains are analyzed with respect to either economic or environmental impact [8,9,10,11,12]. Sometimes, their relevance, impact or time to impact are also described, but rarely all of them together.
Roots, tubers and oil-bearing crops have the highest percentage of food loss (>25%) of all commodity groups, and cassava and potato are the main drivers for this high amount [2]. Therefore, the potato is a relevant product to study with respect to FLW and the related economic and environmental indicators.
Kenya is one of the main producers of potatoes in Africa (after Algeria, Egypt and South Africa) [13,14]. In Kenyan agriculture, potatoes are the second largest product in terms of quantity produced, after maize. The national potato production in 2019 was approximately 2.0 million tons [15]; public data on the more detailed county level were most recently available for 2016, as shown in Table 1. Clearly, the southwestern part of Kenya is the core production region for potatoes. The two main wholesale markets for potatoes in Kenya are the Wakulima wholesale market in Nairobi and the Kongowea wholesale market in Mombasa. The import and export of ware potatoes is absent or negligible [15], and therefore, the entire potato supply chains are located in Kenya itself.

Table 1.
Ware Potato Production in Metric Tons in Kenya per County (2016).
To further illustrate the context of this research, a typical Kenyan potato supply chain, from farm to sales outlet, is visualized in Figure 1.
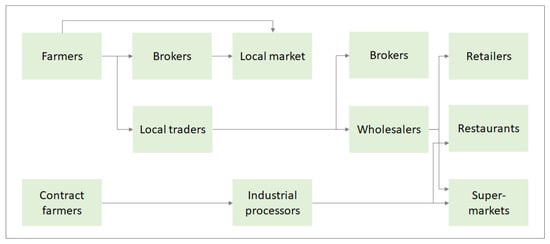
Figure 1.
Potato Supply Chain in Kenya [14].
Of the fresh potatoes produced, some 80% ends up at smaller retailers in the local market or in the main markets of the major cities, 1% is supplied to urban supermarkets, 10% is supplied to restaurants/institutions and 9% is used in processing (of which 5% is used for the production of French fries, 3% for crisps and other snacks and the remaining 1% as a source of starch/potato flour/flakes) [14]. The flows from the production areas to the cities are the largest in volume, where the following stakeholders are involved: farmer—local trader—wholesaler—retailer/restaurants/supermarkets—consumer. In the post-harvest part of this typical supply chain, transportation, food loss and food waste induce GHG emissions—cold storage is generally not used. However, the largest share of GHG emissions, as in most agricultural supply chains, occurs at the farm level (12.8%).
Potato farming in Kenya constitutes an extreme case of smallholder-dominated agriculture. Of the approximately 800,000 potato farmers in Kenya, 90%are smallholders with one hectare or less under cultivation [13]. Smallholder potato farms suffer considerably from inefficiencies, leading to low yields, high losses and, as a result, limited economic prospects for the smallholder farmers involved. First of all, the lack of certified seed has a huge impact on the current yield. The yield for Shangi (the most popular variety in Kenya) farm-saved seed is approximately 8 tons/ha, whereas Shangi-certified seed produces average yields of 16 tons/ha [14]. Due to persistent seed shortages, the certified seed potato production currently covers only some 5% of the demand, with the other 95% being fulfilled with potatoes grown with lower-yielding farm-saved seeds. The Kenyan government has launched a potato seed multiplication program in six counties to address the seed shortages that occur perennially [16]. The new seeds have been produced by plant breeders at the Kenya Agricultural and Livestock Research Organization (KALRO). Secondly, there are high losses at the farm level mainly due to poor harvest practices. Manual harvesting with crude tools often leads to considerable mechanical damage to the potatoes for various reasons. This problem can be solved by the use of appropriate machinery, but this is considered financially out of reach for many farmers, although economic analyses show that it is an economically viable business case [13,14]. Based on earlier research, there seems to be a positive business case for smallholder farmers to adopt these interventions, provided that they can cover the upfront costs with the benefit of the interventions manifesting one harvest later. This research, however, is still confined to a limited number of studies that do not address all the relevant dimensions of the issue. In one study focusing on smallholder potato farming in Kenya [13], a multi-criteria analysis is conducted, but principally on economic criteria. From an environmental point of view, more work is conducted on FLW by GIZ [14,17]. None of these studies, however, address the issue of GHG emissions as an important aspect of the sustainable development of smallholder agriculture. Outside of the Kenyan context, one paper analyzed GHG emissions for potato in Zimbabwe [18]. However, this study remains rather descriptive. Thus far, there has not been a comprehensive analysis of the amount of GHG emissions related to potato production, and the various scenarios for interventions in this sector and their associated business cases.
This paper aims to fill this gap by taking a comprehensive approach to an environmental and economic assessment of pre-harvest interventions in smallholder potato farming in Kenya. Starting from the current common practices in smallholder potato farming, the authors specify several scenarios for intervention adoption on smallholder farms, including the use of better seed, applying more appropriate fertilizer and crop protection and using mechanized equipment for farming activities—and combinations of these interventions. These intervention scenarios are evaluated relative to the current common practice scenario on a wide range of criteria, including yields, losses, economic impact and extending towards GHG emissions. For this evaluation, the authors use a novel calculation method of yields and losses, relying on backward calculation from the volume available at the market, allowing for a fair and balanced assessment of losses, yields, costs, benefits and GHG emissions. Moreover, by taking the marketable volume of produce as the benchmark, the issue of food security is explicitly made part of this evaluation.
The study presents an assessment of several interventions in smallholder potato farming and evaluates them from multiple perspectives—economic and environmental—to obtain a more integral view on their impact. The findings serve to support the decision-making of smallholder farmers, policymakers and other stakeholders in the food system toward improved farming practices. This concerns the evaluation of different types of possible interventions in a context of smallholder farmers with limited resources, but also provides support for the development of financial services to smallholder farmers by showing how—and by how much—the upfront investment in different types of interventions can constitute a sustainable improvement of farmers’ productivity, yields and farmer livelihoods, while at the same time reducing food losses and GHG emissions.
The paper is structured as follows. Section 2 describes the case of the Kenyan potato supply chain, presents different scenarios of interventions in smallholder potato production, and outlines the approach used to quantify the outcomes related to yield, losses, financial result and GHG emissions in these different scenarios. Section 3 presents the results of these calculations, showing that the interventions have an overall positive impact on smallholder potato farming by reducing losses and GHG emissions and improving yields, farmer livelihoods and food security. Section 4 discusses the results and their implications. Section 5 concludes.
2. Data and Method
This section describes the different production scenarios that will be considered and outlines the method of analysis.
2.1. Potato Production Scenarios
Above, the main challenges for the potato sector were mentioned, including the lack of certified seed, lack of appropriate inputs and bad harvesting practices that lead to suboptimal yields and high losses. In this study, different scenarios are explored with different types of improved farming practices, for each of which, the outcome will be evaluated in terms of yield, GHG emissions, food losses and economic impact for smallholder farmers. The focus of interventions is specifically on potato smallholders in Kenya, assuming no changes occur in the post-farm part of the supply chain from the main production area to the Wakulima wholesale market in Nairobi. The average distance from the main production areas in the southwest of Kenya to the Wakulima wholesale market in Nairobi is around 250 km. In this study, this specific supply chain to Nairobi is considered as the reference situation (for another main supply chain, from the production areas in the southwest to the Kongowea wholesale market in Mombasa, the average distance from production to market is 700 km). In the reference situation, we focus on the supply chains for fresh potatoes, since processed potato products are only a small part of the flow.
Starting certified seed production is not realistic for a smallholder, because of the required economies of scale [13]. However, the Kenyan government is taking action on increasing the production of certified seed through KALRO, making it a more obvious scenario that smallholder farmers would shift toward buying certified seed (assuming an increase in availability). Another option is using clean seeds: seeds produced outside of the formal seed certification process but using Good Agricultural Practices (GAPs) with quality assurance by Ministry of Agriculture extension officers.
Another challenge is the accessibility and availability of appropriate inputs such as fertilizer and crop protection. Currently, many smallholders use diammonium phosphate (DAP) fertilizer, since it is subsidized by the government. This fertilizer is meant for maize production, the number one crop in Kenya, and hence is not fully suited for potato cultivation, leading to both suboptimal production yields and environmental pressure. DAP is subsidized, and although other (more expensive) nitrogen, phosphorus and potassium (NPK) fertilizers outperform DAP in yield and, therefore, might be financially more attractive, it is difficult to convince farmers to use these better alternatives, especially when the result is a whole season away.
A third challenge concerns the mechanical damage to the potatoes caused by poor harvesting practices, often manual with crude tools. Using the proper machinery, losses can be reduced. Due to the lack of scale and resources on smallholder farms, buying mechanized equipment is often not a viable option for smallholders, whereas they can hire equipment for on-farm activities.
Based on these issues, we identify four scenarios (see Table 2 for an overview). Scenario 1 is the reference scenario, with standard practices used by the great majority of smallholder potato farmers—manual labor, home-saved seed, relatively small amounts of the cheaper DAP fertilizer and limited application of plant protection. In scenario 2, certified seed is used, with an intensified application of (DAP) fertilizer and plant protection. In scenario 3, clean seed is used, and machinery is used for ploughing. Scenario 4 is the most technically advanced, yet still realistic, scenario for smallholders: Certified seed is used, and ploughing, planting and harvesting are all performed using machinery, more appropriate NPK fertilizer is used instead of DAP, and plant protection is intensified. Likely values for fertilizer input and plant protection were obtained from personal communications with the National Potato Council Kenya [19] and secondary sources on potato production in Kenya [14,20].
Table 2.
Overview of Scenarios.
For a comprehensive calculation of costs, profit and GHG emissions, the variables in the scenarios need to be specified further. In Table 3 below the activities are elaborated, including the equipment, materials and transport means used. The details of the activities in the scenarios are taken from various secondary sources [13,14,21] and personal communication with the National Potato Council Kenya [22], Bayer [23] and SNV [24].
Table 3.
Activities per Scenario.
Note that although the post-harvest activities in the transport and market stages are identical for each scenario, they are still taken into account, on the one hand to show the relatively small share of GHG emitted in these stages compared to production, and on the other hand to incorporate the impact of the post-farm losses/waste in the GHG emission analysis.
2.2. Approach
Besides GHG emissions, FLW and economic factors are also included in the analysis. For scenario 1 (the reference situation) and scenarios 2–4, calculations on FLW and economic impact are carried out in [13,14]. These results will be used in our methodology for further calculations.
Crucial for this type of calculations is the product flow, since the size of this flow is the basis for these quantitative analyses. There are several ways to calculate product flow, and the chosen approach has a huge impact on the results for all indicators. Although several indicators are relevant, the focus in this study is on a new indicator for the potato supply chain in Kenya, namely GHG emissions’ calculations. The way GHG emissions are calculated varies in the literature and depends on the purpose of the analysis. Commonly, lost or wasted produce is excluded from GHG emissions calculations, although it is produced under the same conditions as the non-wasted part, requiring inputs and having its own environmental footprint of production-stage GHG emissions up to the point of loss or waste [25]. Another type of calculation is where the destination of the food waste is included and the GHG emissions of the waste treatment are incorporated [26]. In many cases, agricultural products are not completely edible (e.g., a cow or a pineapple), but to obtain a complete overview of GHG emissions during production, the entire product, including the inedible parts, should be considered. For example, for beef, only 55% of the live animal weight is used as beef for human consumption [27], which is called the carcass utilization rate. There are other edible parts of a cow such as offal, but for beef production, 45% of the animal is irrelevant. For that purpose, GHG emissions can be calculated starting from 1 kg of beef and going backwards through the chain to see how much ‘cow’ you need for this amount of product at the point of sale. This again can be linked to the total GHG emissions required to raise one cow for the slaughterhouse [27]. To evaluate the four scenarios, neither one nor the other of these approaches suits the goal of a fair comparison. The reason for that is the absence of a backward calculation for losses, although the approach for scaling up GHG emissions from the edible quantities to the entire product matches the way of thinking. When comparing two separate production systems, losses and productivity are generally not taken into account—for example, a comparison between a farmer harvesting 500 kg of potatoes from 1 ha and another farmer producing 1000 kg from 1 ha (all else equal) would be unfair if it did not take into account the losses and productivity differences. Therefore, it is desirable to calculate the GHG emissions along the chain backwards from a specified quantity of product at the point of sale. Using this approach in the example above would realistically show how the first farmer produces less efficiently, requiring more inputs (land, water and others) and hence, producing more GHG emissions for every kilogram of potatoes at the point of sale. The following example (Figure 2) illustrates the way of thinking applied in this paper and explains its relevance.
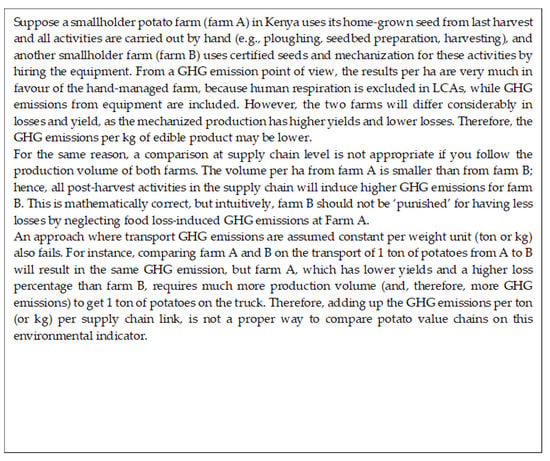
Figure 2.
Illustrative Example of Calculation Method.
The basic idea is simple: to compare two (parts of) value chains on one of the indicators (such as GHG emissions), take the last link in the value chain you consider and calculate the GHG emission to obtain 1 ton of the product at the end of that link, including all losses on the way. In this study, the ware potato chain is from the smallholder farm to point of sale (retailer, supermarket, or restaurant). An example is provided in Figure 1. Clearly, information on yield and losses are involved, and in fact, these factors will make the difference. To determine the volume of the potato product flow per scenario, FLW will be included in the backward calculation from 1 ton of potato that can be sold at a regular price at the point of sale. The methodology applied in this paper is visualized in Figure 3.
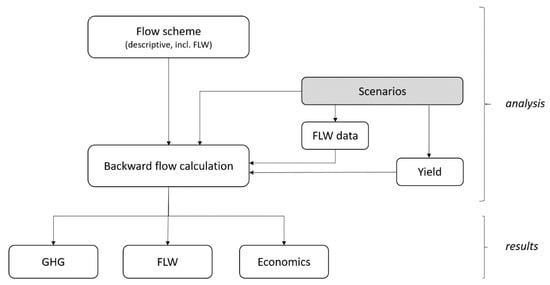
Figure 3.
Visualization of Calculation Method.
This calculation method is explained as follows. First, a flow scheme is designed, including FLW flows. Note that the flows are the same for all scenarios, but the volume of the flows differs. The volume depends on the various scenario variables explained above—choice of seed, inputs and the way activities take place at the farm level. The scenarios, as presented in Table 2, are the basis for the calculation method. Variations in farming practices between the scenarios determine differences in yields and losses. Secondly, the impact of the scenario variables on the FLW data is determined. For example, mechanized farming with the appropriate equipment has a different loss percentage than non-mechanized farming (i.e., manually, often with crude hand tools). This study aims to add an important issue to the research in this area, namely the relation between economic losses and FLW. In countries in Africa and Asia, wholesale markets and retailer markets are the most important logistic and marketing hubs for food flows, where the balance between supply and demand determines prices. Percentagewise, FLW is low since if products are of less quality, with bruises or cuts, they are sold anyway for human consumption but at a lower price. In FLW research, this is treated as an economic loss, but not added to the weight of FLW. In this paper, this is taken into account by considering the economic loss as an indicator (proxy) of the amount that is cut off the potato to obtain the remaining edible part, and hence allocated to FLW.
The yield (in kg per ha of farmland) per scenario is taken from the literature and local experts from the National Potato Council Kenya (NPCK). From there, the scenario characteristics, FLW data and the yield are applied as inputs for the backward calculation of potato flows in the flow scheme from 1 ton of regular sales of potatoes at retail level for all 4 scenarios, which closes the analysis. Finally, based on the quantification of the flows in the last step, the results on the performance of the 4 scenarios are calculated. For FLW and economic performance, this is derived from the results of earlier work on potato supply chains in Kenya [13,14,17]. Note that FLW data are used as inputs as well as outputs. FLW inputs are parameter values such as loss % related to certain activities, whereas the FLW output is the result of applying these inputs to the various scenarios and corresponding flows, which differ in size.
The sub-sections below explain in more detail the different elements used as inputs for the backward calculations, namely the flow scheme, FLW data and yield data.
2.2.1. The Flow Scheme
A typical ware potato smallholder in Kenya not only produces for the market but also for seed and home consumption, leading to flows that are not commonly presented in food supply chain representations. Since FLW is included in the flow scheme, these uses have to be incorporated as well. However, the studies that provide detailed analysis of FLW in the potato supply chain in Kenya deal with FLW in a different way. In a study by Kaguongo et al. [17], (slightly) damaged potatoes are brought to the market in large bags mixed with good quality potatoes. They are sold at a somewhat lower price depending on the share of the low-quality products. This practice we label ‘subscenario (a)’. Another approach is to consider damaged potatoes as an immediate loss at the farm level, that does not generate money along the chain anymore [13]. We label this practice ‘subscenario (b)’ (see Figure 4).
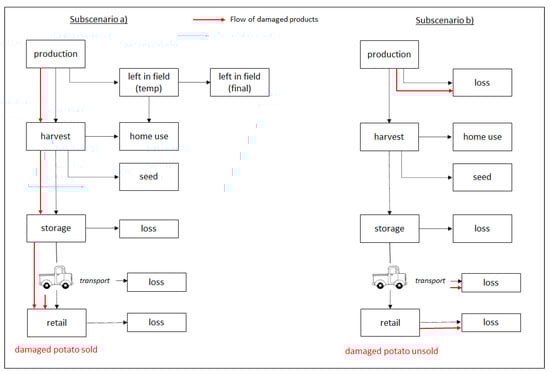
Figure 4.
Flow Scheme with Subscenarios (a,b). Both Subscenarios Can Hold for All 4 Scenarios.
Note that in the present paper, no attention is paid to what happens to the waste flows, such as, for example, animal feed or composting. The reason to include both approaches for dealing with FLW is that it is very likely that the real-world situation contains elements of both. Not all damaged potatoes are taken to the market—but some are—and not all damaged potatoes will be considered as loss—but some are. Maybe at the farm level, damaged potatoes are considered a loss, but at retail level, these products might be sold at a lower price anyway. By taking both flow schemes into account for volumes, the subscenarios provide two extreme cases with a bandwidth in between in which the real-world situation will fall. Later on, it turns out that the bandwidth is small enough to draw clear conclusions, and the impact of taking either one of the FLW approaches is limited.
2.2.2. Food Loss and Waste Data
For the backward calculation, a quantitative analysis of the flows in Figure 4 is needed, including losses. The complexity of losses requires a closer look into this topic. Worldwide initiatives are working on measurements and a reduction in FLW and there are various definitions and interpretations of what should be called FLW, but this study stays away from these details and applies results from detailed studies by Giencke [17] and Technoserve [13]. Note that pre-harvest causes such as diseases as a cause of on-farm losses are not considered in these studies. A reference value for harvest losses is taken from Waudo [28]. The following data on the destination of potatoes (including losses) in the Kenyan potato chain are found as shown in Table 4:
Table 4.
Potato Use in Kenya Based on 3 Studies.
As stated earlier, the first reference considers the damaged potatoes to be marketable or part of doing business. The second reference considers the damaged potatoes as loss for the farmer. As is shown in Figure A1, potato bags at the wholesale market still might contain a lot of cut and bruised potatoes.
According to Table 4, the marketable part (after losses, home consumption and seed use) from production is between 71% for reference [17] and 64% for reference [13]. A more detailed description of losses and damages is available as well [17]:
The percentages in Table 4 and Table 5 are not comparable, since in Table 4 it adds up all destinations of the total production of 100%, whereas in Table 5 percentages of loss and damages are part of the product weight at these stages of the supply chain. The sorting process at the broker damages another 5%, leading to a total of 2.9% losses and 15.2% damage by the farmer and sorter combined, before the potatoes reach the market. In Ref. [14], losses are mentioned of 19%, but, since no distinction between loss and damage is made in this study, the assumption is that the split is according to Table 5.
Table 5.
Losses and Damages in the Potato Value Chain in Kenya [17].
Using Table 5 as an example, the following way of calculating FLW is introduced for damaged products. Suppose a retailer has 1000 kg of potatoes and is responsible for the transport to his site. Then, according to Table 5, of the 1000 kg, 13 kg is rotten, 181 kg is cut and 51 kg is green. The amount of damaged potato equals 232 kg. The question is whether the retailer can sell this, possibly at a lower price. According to previous research [17], wholesalers/retailers still receive 50% of the market potato price for cut or bruised potatoes. It is plausible that these potatoes are used for human consumption, and eventually bad parts are cut off before preparing a meal. Hence, some part of these damaged potatoes become waste, and another part is still consumed. It is assumed that the price paid for the damaged potato reflects the percentage of edible parts of the potatoes. If the paid price is 50% of the regular price, then 116 kg of the 232 kg damaged potatoes are added to waste and also 116 kg is incorporated in the availability of potato for human consumption in the context of food security. This corresponds to subscenario (a). In subscenario (b), damaged products are unsold and this approach, using the economic loss as a proxy for the volume of FLW, is not necessary.
The data on losses in Table 4 and Table 5 are applicable to the reference situation (scenario 1), but the impact of losses in scenario 2–4 has to be determined as well. When switching to certified or clean seed, no effects on losses are expected, since the causes, such as suboptimal harvesting practices, harvesting in the rain, casual labor and storage losses are not taken away. In case of mechanization, as described in scenario 3, the harvest losses reduce from 15.2 to 2% [29].
2.2.3. Yield
Another input for the backward calculation is the yield. Major diseases such as late blight (LB), bacterial wilt (BW) and viruses can lead to yield losses of 20–80%, if the crop is not well protected with fungicides and insecticides. The yield, corresponding to the different characteristics per scenario in Table 3 is, in case of scenarios 1, 2 and 4, taken from field trials with (among other varieties) Shangi in the Potato Initiative Project (PIA), described in [14]. The yield data for the clean seed case (scenario 3) are sourced from SNV Kenya [24] (see Table 6):
Table 6.
Yield in t/ha per Scenario.
3. Results
3.1. Backward Calculation of Yields
Calculating the GHG emissions for the selected scenarios not only depends on the pre- and post-harvest activities, but also on the type and amount of the materials used (e.g., fertilizer and plant protection material). In turn, they are related to the production weight that is considered and that is, according to the methodology, calculated per scenario backwards from 1000 kg at retail sales towards the farm. Additionally, two subscenarios are provided, as explained before: one where 100% of them are sold at a reduced price, being a small share of a potato bag with also good marketable potatoes (subscenario (a)), and one where all the damaged potatoes are considered as loss and remain unsold (subscenario (b)).
Scenario 1a equals scenario 2a and 3a in flow; however, there will be a difference in the effort to produce these amounts of potatoes, since certified and clean seeds have a higher yield than home-saved seed. The same holds for 1b, 2b and 3b. The result of the backward calculation is shown in Table 7.
Table 7.
Backward Calculation of Flows from Farm to Retailer (all in kg), Starting from 1000 kg of Marketable Produce at the Point of Sale. Totals indicated in bold, losses in plain text.
The cells for ‘damage’ in scenario (b) are empty, since the damaged products are already considered as lost at the farm level. The damage and losses from transport/packaging occurs at the post-farm level, and therefore, is calculated for all the scenarios, (a) and (b).
3.2. GHG Emissions
The GHG emissions can be calculated by looking at the activities in Table 3 in relation to the production and flows in Table 7. For example, for scenario 1a, 1871 kg of Shangi potatoes has to be produced in order to obtain 1000 kg of potatoes at the point of sale. Table 6 shows a yield of 8.3 t/ha and, therefore, 0.23 ha of production is sufficient for 1000 kg of product at the point of sale. Correspondingly, fertilizer use is only 23% of 150 kg DAP, being 34 kg. GHG emissions are derived from the Cool Farm Tool for GHG [30] and this amount of DAP corresponds to 181 kg CO2-eq of GHG emissions. Crop protection is post-emergence and is calculated using the Cool Farm Tool also, amounting to 14 kg CO2-eq. The carbon footprint for seed is based on a 2000-kilogram harvest from 1 ha for seed (for next season) [17] and equals 53 kg CO2-eq/ha. The diesel use of a 10T uncooled truck is approximately 5 km/L [31], and therefore, transportation requires 50 L of diesel. The carbon footprint for diesel is 2.64 kg CO2-eq/L [32]. The produce weight of 1871 kg is only a part of the truck capacity of 10T, for which the total amount of GHG emissions is corrected—assuming the truck’s full capacity is used. See Table 8.
Table 8.
Detailed Overview of GHG Emissions per ton of Marketable Product in Scenario 1a.
The Cool Farm Tool has many entries where choices have to be made, including the of soil texture, organic matter, moisture average, drainage, pH, etc. These data vary over Kenya and, therefore, the results might differ a little if these choices are altered. The selection per entry is described in Table A2. The assumption is that the GHG emissions per scenario will be in similar proportion to one another if different entries are selected.
In the same way, GHG emissions in scenarios 1b, 2a, 2b, 3a and 3b can be elaborated. For scenario four, additional information is needed to account for the use of mechanized equipment. The mechanization activities in scenario four are ploughing, planting and harvesting, being the most important ones with respect to improving yield and reducing food loss. From the existing research [33], details can be found about the time and power use of mechanized equipment in potato production (Table 9 and Figure 5):
Table 9.
Time and Fuel Requirements per ha for Mechanized Processes in Potato Production.
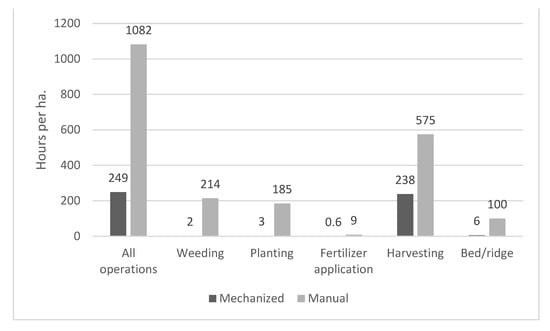
Figure 5.
Time Spent in Manhours per ha on Different Activities during Potato Production in Kenya [17].
Taking the amounts of diesel per mechanization process in combination with the carbon footprint of 2.64 kg CO2-eq/L, the GHG emissions can be calculated for these processes in scenario four.
An overview of the obtained GHG emissions for all the scenarios is shown in Table 10.
Table 10.
Final Results on GHG Emissions (kg CO2-eq) per Scenario for Production of 1 ton of Marketable Potatoes.
3.3. Economic Impact
Increasing profit can be a driver for changes in agricultural practices. Hence, an economic analysis is worthwhile to see whether there is a positive business case for switching from business-as-usual to scenario two, three, or four. Although better seed and mechanization ask for some investment, the payback turns out to be good in terms of increased yield and reduced losses. Applying mechanized farming has proven to be cost effective in various studies, since it increases the yield and decreases the losses. In general, for agricultural crops, the mechanization level for ploughing is 75%, but only 5–20% for planting and harvesting [13,14]. These three activities have the highest impact on the reduction in labor cost and food losses, and yield increase. Note that mechanized harvesting is useful only if planting was mechanized as well. Approximately 90% of the potato farmers would mechanize if they had the financial means [13]. The cost for a tractor and the corresponding implements (weeder, planter, harvester, etc.) is 10–11 million Kenyan shilling (USD 100,000–110,000, 1 USD ≈ 100 KES at the time of writing) [14], which is out of reach for almost all smallholder farmers, but hiring the tractor with the appropriate equipment is only 3500 KES (USD 35) per day [29]. The feasibility of this option—based on the labor cost savings when using mechanized equipment—can be seen by combining Figure 5 with the results on mechanization time per activity with the information in Table 9 on the time required per hectare for farm activities with mechanized equipment. Switching from manual planting and harvesting to mechanized planting and harvesting results in a total saving of 519 h of labor.
In most cases, the labor on smallholder farms is a mix of family and external people, leading to an average wage of 250–300 KES (USD 2.5–$3) per day [13,14], implying a total difference in labor costs of 130–155 KES (USD 1300–$1550). This is equivalent to 5–6 days of hiring the mechanized equipment, whereas mechanized planting and harvesting take less than one day for the typical smallholder farm.
To analyze the profitability of the scenarios, economic data are used from [14]. The upcoming use of clean seed is a recent development, and the reference data are from 2016. Therefore, in the economic evaluation, scenario three is excluded.
3.4. Overall Impact
With respect to food loss, the data per scenario are calculated as the average of the subscenarios (a) and (b)—assuming that the real-world situation is a mix of these two extremes, with some damaged potatoes being lost and some being sold at a discount. The results are derived from the data in Table 7, noting that in subscenario (a), half of the damaged products are considered as losses. These are data per ha, but for each of the four scenarios, a different acreage is needed to end up with 1000 kg of marketable potatoes at the point of sale—a more appropriate measure of the impact of interventions. Using the yield information above (combining subscenarios (a) and (b)), the food losses, GHG emissions, needed acreage, and profit per ton of marketable product can be calculated—here assuming that the farmer selling the potatoes is the price taker at the prevailing market price. The results are shown in Table 11.
Table 11.
Losses, GHG emissions, Acreage needed and Profitability per ton of Product at point of sale. Percentage Difference (positive (upward arrow) or negative (downward arrow)) with Reference Scenario Shown in Parentheses.
It is plausible that the profitability for the clean seed scenario (scenario 3) is somewhere between scenarios two and four, i.e., between USD 25.42 and USD 91.79 per ton of product at point of sale. Table 12 below lists the impact of the different intervention strategies on yield, losses at farm level, losses until the consumer is reached and the quantity of potatoes made available for human consumption.
Table 12.
Results on Yield, Losses and Food Security. Losses are Calculated in the New Way, as Introduced above.
Having higher yields and lower losses (percentagewise) reinforces the feasibility of the interventions discussed even more and in the case of certified seed calculations, shows at least a 200% profit increase, which is significant [14]. Similar tremendous improvements are reported for smallholders growing Agrico Certified seed, who saw their yields go up from the national average of 7 tons to as high as 49 tons per hectare and income grow nine times higher than for farmers using regular practices [34].
These findings show that the evaluated interventions lead to impressive improvements on all the relevant criteria: reductions in GHG emissions and food losses and increases in yields per hectare and farmers’ profits.
4. Discussion
The results show that enormous reductions in GHG emissions can be achieved by relatively simple interventions, which, at the same time, significantly increase yield and hence, farmer incomes. Note that the uncertainty about what is damaged and sold versus what is lost (subscenario (a) versus subscenario (b)) is acceptable, and without a doubt, the reductions in GHG emissions are huge, whatever mix of both subscenarios best represents reality. The crucial drivers behind these GHG emissions reductions are yield increase and loss reduction. The yield increase is so high that the area one needs to produce 1 ton of marketable potatoes at a regular price becomes very small, and hence the impact of mechanization on GHG emissions is negligible. In fact, the improved efficiency opens up new opportunities for the smallholder farmers involved.
Since the number of potatoes produced in scenarios 1–3 is the same, and because diseases are not included in the loss analysis, the losses are the same. It is only in scenario four, with mechanized ploughing and harvesting, that the losses are much lower. Note that mechanized harvesting is useful only when the planting is mechanized as well, since the depth at which the potatoes are in the soil is more constant when planting is performed in a mechanized way.
In this study, the scenarios were selected by balancing between, on the one hand, staying as close as possible to the current situation and, on the other hand, achieving enough economic profit to trigger the potato smallholder to change their production process. Change is always considered as a risk and mostly extra money is required, which smallholders typically do not have. Small steps are the only way to move this large group of smallholders, implying that these steps can be suboptimal, but necessary to start a positive development, since the impact on yield and profit is huge.
The GHG emission results were obtained by a backward calculation, which is a new approach to this issue and shows to be a fair approach to compare (parts of) supply chains on GHG emissions. The FLW is calculated in a new way as well, where the amount of economic loss (lower price) is representative for the inedible part of the product at hand. This new approach constitutes the most important methodological contribution of this study. The main substantive contribution to existing research is the comprehensive assessment of agricultural intervention strategies conducted with this new approach. The study considered outcomes related to productivity, income, environmental impact and food security—a wide range of outcomes not commonly seen in the literature, but necessary to show that improvement on diverse outcomes often goes hand in hand, further solidifying the case for these intervention strategies. The study findings show that there is no trade-off between the desirable outcomes, but rather that—since the business case is obviously there—the main challenge to address going forward is facilitating smallholder farmers to implement these intervention strategies. There is an enormous potential for profit in this sector, with opportunities not only for smallholders, but also agricultural input providers, equipment manufacturers and associated businesses and financial service providers.
Not only smallholders and other private sector actors, but also policymakers should be enthused by these results. If 14.3% of the production in the mainstream potato value chain (=reference situation) is lost and the production area of Kenyan smallholders (90% of 800,000 farmers) equals 103,000 ha [13], then some 73,300 tons of edible potatoes is marketed by the retailer. The GHG emissions in that case amount to 264 kg CO2-eq per ton of product. Per ton, scenario four saves 135 kg CO2-eq, implying a potential 9.9 kt (thousand metric tons) CO2-eq reduction in GHG emissions nationwide. Economically, in this case, the increased supply of potatoes would entail a lower market price, somewhat reducing the profitability per ton for individual farmers. However, in any case, the short-term profits will increase a lot, and when price obeys the balance between demand and supply, profit will still increase relative to the initial situation. More supply may reduce the farmer’s margins, but income can still increase.
This paper shows that scenarios can be evaluated simultaneously on the different goals specified in the SDG program [35], including reducing GHG emissions, mitigating food loss and waste and improving food security and farmer livelihoods. In future research and policy development, the findings from this study also need to extend toward other aspects of sustainable development in the local context, including education (SDG 4), gender equality (SDG 5), work and economic growth (SDG 8) and reduced inequalities (SDG 10). In smallholder potato farming specifically, this entails equitable access to loss-reducing intervention, education for the youth and training for adults on good agricultural practices, and the diversification of rural economies with activities related to input and equipment provision and maintenance and economic opportunities for those who see their opportunities limited by labor-saving interventions on farms. Apart from broadening the scope towards other dimensions of sustainable development, future research should also address some aspects that were left out of the scope of this study. For example, one limitation of this study is that we did not address the life cycle impact of agricultural equipment. Though not specifically relevant for food loss-induced emissions, a full evaluation of the impact of using mechanized equipment should include its life cycle impact.
It is not easy to change practices on smallholder potato farms, but this paper showed that minor interventions lead to a significant improvement in the dimensions of GHG emissions, farmer profit, FLW reduction and food security. The availability of certified seed and mechanization for hire should be a focal point of policy. At present, the Kenyan government is working on making certified seed available. A second major recommendation for policymakers is to support the mechanization of potato farming and facilitate farmers and mechanization service providers with, for example, demonstrations at the farm level, and/or vouchers for farmers to hire machinery. In parallel, the development of a financial services system that is accessible to smallholder farmers and allows them to access financing to procure more appropriate inputs and hire machinery should be stimulated, even if the result of their investment manifests only one harvest later. This study shows that the business case is there, with clear benefits after one crop. Therefore, it is imperative to ensure that smallholder farmers can financially bridge this relatively limited period between the investment and the return. Once groups of smallholders start to professionalize, their example and competition in the market will stimulate other farmers to do the same. After that, next steps such as storage or irrigation (preferably solar) may follow to upgrade the position of the Kenyan potato smallholder and the country as a whole with respect to less GHG emissions and less FLW, and more food security and improved livelihoods for smallholder farmers.
5. Conclusions
This study was conducted with the aim of providing a comprehensive evaluation of different intervention scenarios in smallholder potato farming in Kenya, considering productivity, economic and environmental outcomes. The findings show that using better inputs such as certified or cleaned seed and a more appropriate fertilizer and pest protection regime considerably reduces losses, improves yield (and hence farmer income) and entails less food-loss-induced GHG emissions per ton of marketable produce. Even more significant improvements on all the outcomes—yield, losses, GHG emissions and farmer income—can be realized by mechanizing farm operations. With these proven benefits of these intervention strategies, the next challenge is to stimulate their adoption. This challenge entails an opportunity for business, as smallholder farmers are shown to be a vast untapped market for inputs and equipment. The current absence of financial services for the necessary credit impedes adoption, but the positive business cases outlined in this paper show there to be an opportunity for financial service providers in this space. Aside from these business considerations, the government also has a major role to play. First of all, this involves directly simulating the adoption of better farming practices and stimulating the creation of a market for credit provision. Beyond this lies the broader task to ensure that progress on the outcomes considered here (income, emissions and food security) is accompanied by progress on other important environmental and socio-economic outcomes in the food system.
Author Contributions
Conceptualization, H.S.; methodology, H.S.; validation, H.S.; formal analysis, H.S.; investigation, H.S.; data curation, H.S.; writing—original draft preparation, H.S. and B.C.; writing—review and editing, H.S. and B.C.; visualization, H.S.; supervision, H.S.; project administration, H.S.; funding acquisition, H.S. All authors have read and agreed to the published version of the manuscript.
Funding
This work was implemented as part of the CGIAR Research Program on Climate Change, Agriculture and Food Security (CCAFS), which is carried out with support from the CGIAR Trust Fund and through bilateral funding agreements. For details, please visit https://ccafs.cgiar.org/donors, (accessed on 17 June 2021). The views expressed in this document cannot be taken to reflect the official opinions of these organizations.
Data Availability Statement
Secondary sources indicated in manuscript text. Calculations and analysis results are available from the authors on request.
Conflicts of Interest
The authors declare no conflict of interest.
Abbreviations
| DAP | Diammonium Phosphate (fertilizer) |
| FAO | Food and Agriculture Organization of the United Nations |
| FLW | Food Loss and Waste |
| GAP | Good Agricultural Practice |
| GHG | Greenhouse Gas |
| NPCK | National Potato Council Kenya |
| NPK | Nitrogen, Phosphorus and Potassium (fertilizer) |
| PIA | Potato Initiative Project |
| SDGs | Sustainable Development Goals |
| UN | United Nations |
| KALRO | Kenya Agricultural and Livestock Research Organization |
Appendix A
Table A1.
Spray regime in scenario 4 [14]: it lasts for 8 weeks starting 2 weeks after emergence of the disease.
Table A1.
Spray regime in scenario 4 [14]: it lasts for 8 weeks starting 2 weeks after emergence of the disease.
| Week | 2 | 3 | 4 | 5 | 6 | 7 | 8 | 9 |
|---|---|---|---|---|---|---|---|---|
| Fungicide | FL, Propa | FL, Propa | Fen, Propa | Fen, Propa | FL, Propa | FL, Propa | Propi, Cym | Propi, Cym |
| Foliar feed | NPK + T | NPK + T | ||||||
| Insecticide | Deltam | Deltam |
FL: Fluopicolide; Propa: Propamocarb hydrochloride; Fen: Fenamidone; Propi: Propineb; Cym: Cymoxanil (Infinito); NPK+T: NPK and trace elements; Deltam: Deltamethrin.
Appendix B
Table A2.
The entries for the Cool Farm Tool as applied for the GHG emissions are as follows.
Table A2.
The entries for the Cool Farm Tool as applied for the GHG emissions are as follows.
| Soil Settings | |
|---|---|
| texture | clay (fine) |
| organic matter | 5.16 < SOM ≤ 10.32 |
| moisture average | dry |
| drainage | poor |
| pH | 5.5 < pH ≤ 7.3 |
| field name | clay (fine), dry |
Appendix C
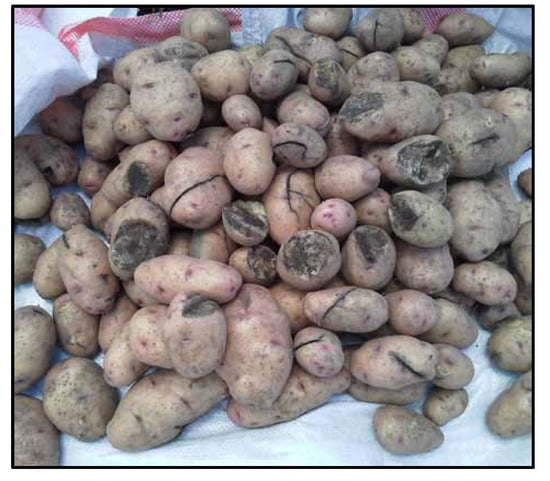
Figure A1.
Opening a potato bag after transport.
References
- Gustavsson, J.; Cederberg, C.; Sonesson, U. Global Food Losses and Food Waste; FAO: Rome, Italy, 2011; p. 38. [Google Scholar]
- FAO. The State of Food and Agriculture; FAO: Rome, Italy, 2019; p. 182. [Google Scholar]
- Guo, X.; Broeze, J.; Groot, J.J.; Axmann, H.; Vollebregt, M. A Worldwide Hotspot Analysis on Food Loss and Waste, Associated Greenhouse Gas Emissions, and Protein Losses. Sustainability 2020, 12, 7488. [Google Scholar] [CrossRef]
- Hollander, A.; Temme, E.H.M.; Zijp, M.C. The Environmental Sustainability of the Dutch Diet; RIVM: Bilthoven, The Netherlands, 2016; p. 104. [Google Scholar]
- Ecochain. Impact Categories (LCA)—Overview. Available online: https://ecochain.com/knowledge/impact-categories-lca/ (accessed on 17 June 2021).
- European Commission. Life Cycle Indicators for Resources, Products and Waste; Publications Office of the European Union: Luxembourg, 2012; p. 102. [Google Scholar] [CrossRef]
- FAO. Food Wastage Footprint Impacts on Natural Resources Summary Report; FAO: Rome, Italy, 2013; p. 63. [Google Scholar]
- Asante-Dartey, J. Value Chain Studies of the Citrus Industry in Ghana; Agribusiness in Sustainable Natural African Plant Products: Johannesburg, South Africa, 2017. [Google Scholar]
- Desalegn, P. Poultry Value Chain in West Amhara; Programme for Agro-Business Induced Growth in the Amhara National Regional State: Bahir Dar, Ethiopia, 2018; p. 24. [Google Scholar]
- Gogo, E.O.O.; Ulrichs, C.; Huyskens-Keil, S. Nutritional and economic postharvest loss analysis of African indigenous leafy vegetables along the supply chain in Kenya. Postharvest Biol.Technol. 2017, 130, 39–47. [Google Scholar] [CrossRef]
- Hamprecht, J.; Corsten, D.; Noll, M.; Meier, E. Controlling the sustainability of food supply chains. Supply Chain Manag. 2005, 10, 7–10. [Google Scholar] [CrossRef]
- SFAC. Value Chain Analysis of Select Crops in North Eastern States; Small Farmers’ Agribusiness Consortium: New Delhi, India, 2012; p. 176. [Google Scholar]
- Technoserve. Kenya Potato ISP; Technoserve: Arlington, VA, USA, 2018; p. 149. [Google Scholar]
- GIZ. Modernization Options for the Potato Value Chain in Kenya and Nigeria; GIZ: Bonn and Eschborn, Germany, 2016; p. 84. [Google Scholar]
- KNBS. Kenya National Bureau of Statistics Economic Survey 2020; KNBS: Nairobi, Kenya, 2020; p. 418. [Google Scholar]
- FreshPlaza. Kenyan Government Launches Potato Seed Multiplication Program in Six Countries. Available online: https://www.freshplaza.com/article/9220040/kenyan-government-launches-potato-seed-multiplication-program-in-six-counties/ (accessed on 17 June 2021).
- Kaguongo, W.; Maingi, G.; Giencke, S. Post-harvest Losses in Potato Value Chains in Kenya: Analysis and Recommendations for Reduction Strategies; GIZ: Bonn, Germany, 2014; p. 80. [Google Scholar]
- Svubure, O.; Struik, P.; Haverkort, A.; Steyn, J. Carbon footprinting of potato (Solanum tuberosum L.) production systems in Zimbabwe. Outlook Agric. 2018, 47, 3–10. [Google Scholar] [CrossRef] [Green Version]
- NPCK; P.O. Box 29982-00100, Nairobi, Kenya. Local Expert Personal Communications, 2020.
- FarmKenya. Nakuru Mechanized Potato Farming Part 1. 2019. Available online: https://www.standardmedia.co.ke/ktnnews/video/2000166954/nakuru-mechanized-potato-farming-part-1 (accessed on 17 June 2021).
- Soethoudt, H.; Gitau, C. Up-Scaling of Commercial Storage & Warehousing of Potato Value Chains in Kenya—Phase 1: Product and Market Research Report 1762; Wageningen Food & Biobased Research: Wageningen, The Netherlands, 2017; p. 46. [Google Scholar]
- Chemjor, H.; National Potato Council Kenya, Nairobi, Kenya. Personal Communication, 2020.
- Gitonga, D.; Bayer AG, Leverkusen, Germany. Personal Communication, 2020.
- Nzoka, O.; SNV, The Hague, The Netherlands. Personal Communication, 2020.
- Choo, Y.M.; Muhamad, H.; Hashim, Z.; Subramaniam, V.; Puah, C.W.; Tan, Y. Determination of GHG contributions by subsystems in the oil palm supply chain using the LCA approach. Carbon Footpr. 2011, 16, 669–681. [Google Scholar] [CrossRef]
- Roibása, L.; Rodríguez-Garcíaa, S.; Valdramidisb, V.P.; Hospidoa, A. The relevance of supply chain characteristics in GHG emissions: The carbon footprint of Maltese juices. Food Res. Int. 2018, 107, 747–754. [Google Scholar] [CrossRef]
- Hamerschlag, K.; Venkat, K. Meat Eater’s Guide—To Climate Change + Health; EWG: Washington, DC, USA, 2011; p. 63. [Google Scholar]
- Waudo, J.N.; Schrisema, A. Study of Food Losses and Loss Reduction Opportunities in Fruits and Vegetable Chains in Kenya—An Assessment of Potato, Courgette and Avocado Supply Chains; SNV: The Hague, The Netherlands, 2015; p. 68. [Google Scholar]
- KenyaCitizenTV. Smart Farm—Mechanized Potato Harvesting. Available online: https://www.youtube.com/watch?v=MvuixkY-QeU (accessed on 17 June 2021).
- CoolFarmAlliance. Cool Farm Tool. Available online: https://coolfarmtool.org/ (accessed on 17 June 2021).
- Nylund, N.-O.; Erkkilä, K. Heavy-Duty Truck Emissions and Fuel Consumption simulating Real-World Driving in Laboratory Conditions. In Proceedings of the 2005 DEER Conference, Chicago, IL, USA, 21–25 August 2005; p. 23. [Google Scholar]
- Ecoscore. Available online: https://ecoscore.be/en/home (accessed on 17 June 2021).
- Gulati, S.; Singh, M. Energy Requirement and Management in a Potato Production System; Central Potato Research Institute: Shimla, India, 2011; p. 6. [Google Scholar]
- Standard. Government Approves High Yield Potato Seeds. Available online: https://www.standardmedia.co.ke/business/news/article/2001361294/government-approves-high-yield-potato-seeds (accessed on 17 June 2021).
- UN. Sustainable Development Goals. Available online: https://www.un.org/sustainabledevelopment/sustainable-development-goals/ (accessed on 17 June 2021).
Publisher’s Note: MDPI stays neutral with regard to jurisdictional claims in published maps and institutional affiliations. |
© 2021 by the authors. Licensee MDPI, Basel, Switzerland. This article is an open access article distributed under the terms and conditions of the Creative Commons Attribution (CC BY) license (https://creativecommons.org/licenses/by/4.0/).