Abstract
This study evaluated the effects of de-inking paper sludge (DPS) and sewage sludge (SS) application on soil properties, and durum wheat growth and yield. A pot experiment was performed on Calcaric cambisol (clCM) and Cromic Luvisol (coLV) soils. Three DPS rates (0, 30, and 60 Mg ha−1) were studied with and without nitrogen fertilizer (280 kg NH4NO3 ha−1). DPS was also mixed with SS at two rates (5 and 10 Mg ha−1) to highlight the benefits of organic nitrogen compared to mineral nitrogen. DPS improved total organic carbon and nitrogen, mineral nitrogen, and soils cation exchange capacity, the 30% rate provided the greatest improvement in both soils. DPS increased grain and root P, K, Ca, and Mg contents in both soils. It also increased wheat straw N, P, Mg, and Ca for the same soil compared to the control. Mixed DPS treatments with nitrogen fertilizer enhanced grain yield by up to 38% and increased root biomass in the studied soils. Thus, DPS is a potential source of organic matter and a liming agent for acid soils when appropriate supplemental fertilizer is provided.
1. Introduction
According to the Kyoto protocol related to the reduction of greenhouse gas (GHG) emissions, waste management, and the use of residual fertilizer material (RFM), can mitigate climate change []. Waste management is an international problem, especially in developing countries. This waste should constitute an asset that should not be wasted and should be reconsidered in terms of energy, fertilizer, or other resources.
The use of fertilizing matter like compost, biosolids, or de-inking paper sludge (DPS) is one of the ways to decrease the effects of climate change [,]. At the Conference of the Parties in Paris is the 21st (COP21), the reduction target for Tunisia was estimated at 40% of total emissions [,]. Despite this, the recycling rate in Tunisia for residues such as DPS is close to 0%, which represents a big loss of organic matter [,]. The explanation for this is that in Tunisia this kind of residue is considered dangerous (Article 2 of Act No. 96-41 of 10 June 1996, JORT No. 49 of 18 June 1996 relating to control, management, and disposal of wastes; Decree No. 2000-2339 of 10 October 1996–2000, hazardous waste list JORT No 86 of 27 October 2000), although this classification is not supported by studies. De-inking sludge is included in Group 5, waste from wood processing, paper, and panel and furniture production. DPS is considered non-hazardous in European and Canadian legislation because it is recalcitrant organic matter and contains a lot of nutrients (C, P, K, Ca, and Mg) []. The heavy metal content of DPS does not exceed contamination limits [,]; this organic matter can be used as a fertilizer and there is no risk of soil contamination if the application rate does not exceed 60 Mg ha−1 [,,].
This type of organic matter has been used in several applications: restoration of degraded or mining sites [], crop growth and yield improvement [], growth improvement of forest tree species such as alder and aspen [], improvement of the physicochemical properties of acidic soils [,,], and the reduction of greenhouse gases, essentially N2O [,]. But few studies have involved Mediterranean conditions and especially calcareous soils [,]. Recent studies have demonstrated the role of DPS in the improvement of soil fertility, soil carbon storage, and humic substances [,,]. This leads to the need for in-depth research on the environmental impacts of this amendment on agronomic calcareous soils compared with acidic forest soils and the possibilities of its valorization as an organic fertilizer for agricultural soils and crops.
Climate change and poor management of resources affect soil organic carbon stocks, mainly in Mediterranean areas, where there is a deterioration in the physicochemical and biological properties of soils []. For example, the soils in Tunisia are chemically poor, with an organic matter content of less than 2%, and remain in a perpetual quest for a source of organic matter []. We believe that DPS may be a source of organic matter for the restoration of agronomic calcareous soils. Furthermore, the pulp industry generates a large amount of lignocellulosic waste that must be managed. Information on the fertilizing value of de-inking paper and mixed sewage sludge on crops is relatively scarce.
In the Mediterranean region, durum wheat (Triticum turgidum L. sub sp. durum) is one of the most cultivated herbaceous crops and is considered a major cereal crop in Tunisia, with 1.8 Mha under cultivation []. However, the total production of wheat is still far from the country’s requirements, which range from 1 Tha−1 to 6 Tha−1, mainly due to poor crop management, []. Indeed, amendments could improve crop growth, nutrient status, and grain yield. Hence, research is needed to provide data for determining the effects of de-inking paper sludge on Mediterranean soils and the vegetative parameters of durum wheat. The present study was focused on the assessment of the effect of different de-inking paper sludge application rates on vegetative parameters and durum wheat yield in two Mediterranean soils.
The specific objectives of this research were (i) to study the effects of DPS application rates (0, 30, and 60 Mg ha−1) on the chemical parameters of a calcareous soil, and on the vegetative growth and yield of durum wheat following DPS application and (ii) to determine whether the addition of N fertilizer (organic or mineral) induces changes in soil and agricultural parameters.
2. Materials and Methods
2.1. Soils and Amendments
Soils were collected from the surface layer (0–20 cm) of two representative Mediterranean soils from two sites in Tunisia, Nefza and Mornag. The Nefza soil is a Cromie luvisol (coLV) [] and is located under a cork oak forest on a mountain slope (20%). The climate of Nefza is humid (1000 mm rain/year) and the soil is on a sandstone and acid clay bedrock. The Mornag soil is a Calcaric cambisol (clCM) [], located at the National Institute of Tunisia (INAT) agronomic experimental farm. The climate of Mornag is semi-arid (400–450 mm rainfall/year) and the soil is limestone-clay alluvium plain. The collected soils were air-dried and sieved. Crop residues were removed. Before sowing, initial soil physicochemical analyses were carried out (Table 1). The organic carbon content was low in both soils (5.8 and 4.6 g kg−1 for Calcaric cambisol and Cromie luvisol, respectively), as is typical for Mediterranean (Tunisian) agricultural soils. The clCM silty clay soil is characterized by a medium pH (basic pH = 7.84), high K and high available P, whereas the coLV silty clay-sand soil has a high K, an acidic pH (acidic pH = 5.73) and low available P. Total limestone was measured for the two soils, with the highest value in the clCM (25.52%) compared to coLV soil (0%).

Table 1.
The physicochemical characteristics of initial soils collected from the experimental fields.
Two wastes were used as organic amendments (OA). The de-inking paper sludge (DPS) was obtained from the Tunisie Ouate Company [,]. The sewage sludge (SS) was used after waste was dewatered from the Chotrana Wastewater Treatment Station (Ariana, Tunisia). This amendment is considered stable, is black and more than 6 months old and was randomly sampled. Only the solid part was recovered after secondary treatment. The DPS and SS were air-dried and the resulting biosolids were analyzed to determine their physico-chemical characteristics before treatment application (Table 2). The DPSs were rich in C, Ca, and Mg, whereas a supplement nitrogen source was required due to the high C:N ratio (C:N = 108). The total organic carbon content was 315 and 399 g kg−1 for DPS and SS, respectively. DPS N, P, K, Ca, and Mg contents were 2.91, 0.35, 7.23, 122, and 4.49 g kg−1, respectively. The C:N and C:P ratios were 108.24 and 900 for the DPS and 149.4 and 151.1 for the SS, respectively. Critical C:N ratio was established between 20–30 and the C:P ratio between 40–50 []. The Ca:Mg ratio is another measure of the suitability of organic residues as a nutrient source for plant growth []. This ratio was 27.17 for the DPS and 63.15 for the SS.
Table 2.
Characteristics of the two biosolid amendments used in the experiment.
Marouani et al. [] reported that the same DPS contained aliphatic (polysaccharides) and aromatic structures (lignin or lignin derived products). Infrared spectroscopy revealed that the DPSs contain quartz, kaolinite, smectite (3620, 3650 and 3690 cm−1) and carbonate (875 and 2520 cm−1) [].
2.2. Experimental Design and Soil Sampling Scheme
Sixty-four pots of soil (13.5 cm diameter × 20 cm height, 2 kg of soil) were placed in a semi-controlled greenhouse at INAT (36°49′ N, 10°10′ E) in Tunis (Tunisia) during the 2013–2014 growing season (Figure 1). The monthly air temperature ranged from 12 to 36 °C. The monthly relative humidity fluctuated between 58 and 68%. The soils were collected from clCMs and coLVs.
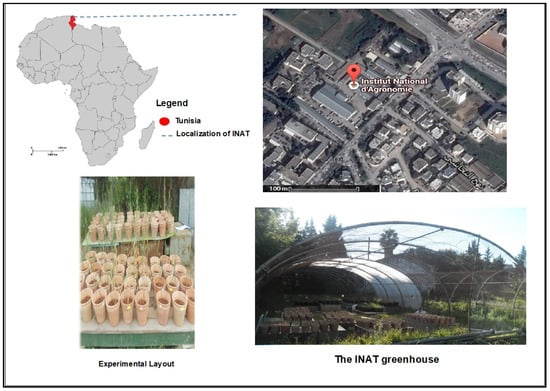
Figure 1.
Location of experimental site.
Three rates of DPS were used (0, 30, and 60 Mg wet ha−1) identified as control, DPS30 and DPS60, respectively. One mineral nitrogen rate of 280 kg N ha−1 (as NH4NO3−, noted as F) is added to former treatments identified as DPS30F, and DPS60F. This nitrogen is applied at two crop growth stages: three leaves (13) and two nodes (33) according to the BBCH scale.
Two rates of SS (5 and 10 Mg. ha−1) were used alone to give the treatments SS5 and SS10. The treatment “MIXED” is a mixture of DPS 60 and SS10. Thus, the treatments were identified as: Control, DPS 30, DPS 60, DPS 30F, DPS 60F, MIXED, SS5 and SS10. The pots were arranged in a randomized complete block design in four replications and were re-randomized every week to avoid light and temperature side effects. For each pot, treatments were mixed thoroughly into soil seven days before sowing. During the experiment, the pots were weighed daily and the lost water was replaced by adding tap water.
Four seeds of durum wheat, variety “KARIM”, were sown in each pot on 15 December 2014. Irrigation was applied using tap water to reach a 40% soil holding capacity. After 188 days, on May 23rd, the aerial portion of plants was harvested, separated into grain and straw, weighed, and oven-dried at 65 °C. After watering, roots were smoothly collected and maximum length is measured on millimeter paper. The soil in each pot was air-dried, ground, sieved (2 mm), and mixed well and analyzed.
The measured agronomic parameters were grain and straw yield, biomass root, root length, and dry matter. Mineral element concentrations (P, Mg, Ca, K, Pb, and Cd) in durum wheat grain, straw, and roots were analyzed. Nitrogen was analyzed in both the above and belowground plant parts.
2.3. Soil Chemical Analysis
All chemical and physical analyses were performed according to Pauwels et al., []. The soil pH values were measured at 25 °C in a sample suspended in distilled water (1:2.5; w:w), using a Consort C860 multi-parameter analyzer (Consort bvba, Turnhout, Belgium). Total organic C was determined using the Walkley and Black method based on potassium dichromate oxidation [,]. Total N was determined using the Kjeldahl method [,]. Available P was extracted using the Olsen method [,] and measured with the ascorbic acid–molybdate reaction []. The determination of the content of exchangeable K, Ca, and Na in soil was based on the principle of extracting the exchangeable bases with a 1 N solution of ammonium acetate (C2H7NO2). The extract was passed to the flame photometer to measure K, Ca, and Na concentrations []. The determination of the percentage of clays and silts was based on the principle of sedimentation. The proportion of sand was determined by dry sifting []. Mineral nitrogen (N-NH4+ and N-NO3−) of soil subsamples was extracted with 2 M of potassium chloride solution (KCl) with a 1:10 (soil: solution) ratio and shaken for 1 h to determine the concentration of soil N-NH4+ and N-NO3− [].
The cation exchange capacity (CEC) was carried out according to the principle of extracting the exchangeable bases with a 1 N solution of ammonium acetate (C2H7NO2). The extract was passed through a flame photometer to measure K, Ca, and Na concentrations []. Cd and Pb concentrations were measured by atomic absorption. Metal extraction followed the acid attack method using a 1 g soil sample sieved to 0.25 mm. All analyses were performed in triplicate and were reported as average values. For sludge, moisture content was calculated from weight loss after oven-drying to a constant weight at 105 °C, and organic matter content by loss on ignition at 450 °C for 4 h. Total P, Na, Ca, Mg, Fe, Cu, Mn, and Zn were determined after dry-ashing at 500 °C for 3 h [].
2.4. Carbon Mineralization of Biosolid Amended Soils
Soil incubations were carried out under controlled conditions at humidity levels close to field capacity and a constant temperature (30 °C) in the dark for 95 days so that the soil respiration of the biosolid-amended soil could be quantified and compared to that of the control, as described in Marouani et al. []: A sample of 50 g of moistened soil from each treatment was placed in a one-liter hermetic jar containing 10 mL of NaOH and a crystallizer. CO2 emissions during the incubation period were trapped in 1 mol L−1 NaOH solution and the excess NaOH was titrated with 0.1 mol L−1 H2SO4 after the addition of 2 mL of BaCl2. The CO2-C released by mineralization was expressed as mg CO2 kg soil−1 (Equation (1)) []:
where T is the total volume (mL) of NaOH at the start of incubation; V is the H2SO4 volume (mL) required to titrate the NaOH; B is the H2SO4 volume used to titrate NaOH in the blanks; N is the H2SO4 normality used to titrate NaOH; E (E = 6) is the equivalent weight of carbon; W is the soil weight and d is the days between every two sampling times.
CO2-C emission rate = [(T − V) − (T − B)(NE/W) d]
The CO2-C released by mineralization was expressed as mg CO2 kg soil−1 using Equation (2):
where Ct is the cumulative carbon mineralized at time t expressed in mg C kg−1; C0 is mineralizable carbon potential expressed in mg C kg−1; k is the mineralization constant expressed in days−1 and t is the incubation time expressed in days. The data was also tested using Curve Expert software and the kinetics parameters were calculated as in Marouani et al. [].
Ct = C0 (1 − e−Kt)
2.5. Plant Analysis
The dried plant tissue was ground to determine N, P, K, Ca, and Mg concentrations. About 1g of the ground tissue was incinerated at 500 °C for 4 h and digested with 20 mL of HNO3 (1N). To obtain the total element concentrations, we calculated the sum of each element accumulated in the grain, straw, and root, and multiplied it with its respective dry matter mass [,]. To fix Ca and Mg, about 1 mL of plant extract was added to 4 mL of distilled water and 4 mL of buffer solution. The analysis was performed using EDTA (0.02 N) after adding a colored indictor. The P content was quantified by the ammonium molybdate—ascorbic acid method []. The N content was determined using the Kjeldhal method [], K and Na were analyzed using a flame photometer, and Ca, Mg, Fe, Cu, Mn, and Zn were quantified by flame atomic absorption spectrometry as described by Pauwels et al. [].
2.6. Statistical Analysis
The chemical soil parameters (pH, TOC, TN, C/N, PT, available P, available K, Ca, Mg, Na NH4+, NO3) were subjected to variance analyses with the GLM procedure using partial sums of squares. Data were analyzed using the SAS® statistical package, version 9.4. The statistical significance tested using F-tests at a 5% level of probability. The mean and standard deviation for each physicochemical soil attribute (pH, TOC, TN, C:N, PT, available P, available K, Mg, Ca, Na, NH4+, NO3-) were calculated for each soil type and treatment [0 (control), DPS 30, DPS 60, DPS 30F, DPS 60F, MIXED, SS5, and SS10]. Tukey’s student range (HSD) test was used to test for significant statistical differences in physicochemical soil and plant variables between soil types (cl CM; co LV). F-values were considered statistically significant at p ≤ 0.05 [].
3. Results
3.1. Changes of Soil Chemical Properties after DPS Application
3.1.1. Effect on Soil pH and Electrical Conductivity (EC)
The pH values were highly dependent on soil type (p ˂ 0.0001), treatment (p ˂ 0.0001) and the interaction is highly significant (p ˂ 0.001) (Table 3). Results showed that DPS application rates and the presence of the N fertilizer were affected by soil pH. In the silty clay soil (clCM), the pH value increased significantly for the 60 Mg ha−1 treatment with and without N fertilizer compared to the control with 0.41 and 0.21 increases respectively. For the acidic co LV soil, the 60 Mg ha−1 DPS rated raised the soil pH by 0.54 (Table 4). The present study showed a highly significant variation in EC among soils (p ˂ 0.0001) and treatments (p ˂ 0.0001) (Table S1). In the non-fertilized clCM soil, EC decreased from 276.8 to 199.0 mS cm−1 for DPS30 treatment and from 276.8 to 194.6 mS cm−1 for DPS60 treatment (see Supplementary data). However, when N fertilizer (DPS30F and DPS60F) was applied, a strong EC increase is observed due to the salts contained in the N fertilizer, (see Supplementary data; Table S1). In the acidic coLV soil, a decrease of EC was observed for the DPS30 compared to the control. The value of EC for the MIXED treatment was lower than that for the DPS60F in both soils.
Table 3.
Analysis of variance for the different soil chemical properties.
Table 4.
DPS application effects on soil chemical properties.
3.1.2. Changes in Total Organic Carbon and Total Organic Nitrogen
Overall, highly significant variations among soils (p < 0.01) and treatments (p < 0.001) occurred for organic carbon, however, the interaction was not significant (Table 3). The 30 Mg ha−1 DPS dose produced the highest amounts of soil organic carbon (SOC) compared to control in coLV soil (Table 4). A DPS rate of 30 Mg ha−1 was required to increase SOC by 0.06 g kg−1 C for clCM, and this, with only one application. While for the SS10 Mg ha−1 treatment, SOC decreased from 5.8 to 4.6 g kg−1 for SS10 and from 4.6 to 3.9 g kg−1 in the clCM and coLV soils respectively compared to the control.
Total organic nitrogen was highly significantly (p ˂ 0.0001) affected by soils, treatments as well as their interaction (Table 3). An increase of 0.065 g kg−1 and 0.013 g kg−1 occurred in clCM and coLV respectively, compared to the control. More interestingly, the application of the DPS 30 Mg ha−1 rate without N fertilizer significantly increased total organic nitrogen in both soils (Table 4). There was no significant difference between the 60 Mg ha−1 (DPS60) and MIXED treatments in both soils. However, there was a significant decrease between the control and the DPS30F and DPS60F treatments from 0.103 to 0.09 g kg−1 in clCM soil and from 0.19 to 0.17 g kg−1 in coLV soil.
3.1.3. Variation of Mineral Nitrogen (N-NH4+ and N-NO3−) and Available P
The NH4+ and NO3− concentrations depended highly on soils (p ˂ 0.0001), treatments (p ˂ 0.0001) and their interaction (p ˂ 0.001) (Table 3). Among the two soils, maximum NH4+ and NO3− occurred in the acidic coLV soil with the MIXED (237.0 mg kg−1) and DPS30F (296.9 mg kg−1) treatments.
In the clCM soil, post-harvest soil analysis showed that NH4+ values were significantly higher than the control for only the Mixed, DPS60, and SS10 treatments. For the other treatments, NH4+ was either lost or absorbed by the plant. In the acidic coLV soil, the analysis showed that the MIXED treatment had either the highest concentration of NH4+ (a significant increase compared to the control and other treatments), where the concentration significantly increased of from 182.6 to 237.0 mg kg−1 (Table 4).
The addition of DPS at rates of 30 and 60 Mg ha−1 with and without N fertilizer had no significant effect on NO3− concentration in clCM soils. In contrast, the Mixed and SS10 treatments significantly increased the soil NO3− concentration from 139.89 to 174.18 mg kg−1 after harvest compared to the control. In the acidic coLV soil, there was a highly significant decrease in the NO3− concentration for DPS doses of 30 and 60 Mg ha−1 with and without fertilizer compared to the control. In contrast, the Mixed and SS10 treatments significantly increased the soil NO3− concentration from 222.9 to 305.9 mg kg−1 after harvest compared to the control.
Available P was highly dependent (p ˂ 0.0001) on soils, treatments, and their interaction. An application of DPS increased available P in both soils (Table 3). In the clCM soil, there was a significant increase for the two DPS rates (30 and 60 Mg ha−1) with or without N fertilizer especially for 60 Mg ha−1. Whereas for the two SS doses, there was a decrease in available P compared to the control in cl CM. Whereas, there was a positive effect on the available P content for all DPS and SS treatments in the acidic coLV soil (Table 4).
3.1.4. Variation of Nutrients (Ca2+, Mg2+, K+ and Na+)
Based on the results, significant effects of soils, treatments, and their interaction were found for micronutrient (p ˂ 0.0001) (Table 3). The application of soil amendments increased all nutrients in the clCM soil compared to the co LV soil (Table 4).
In clCM soil, the addition of 30 and 60 DPS Mg ha−1 with N fertilizer produced a highly significant increase in Ca2+ concentration compared to the control (from 1629.5 to 3259.0 mg kg−1) For the DPS60 treatment without fertilizer, there was a strong decrease in Ca2+ concentration compared to the control. In the acidic coLV soil, there were significant increases in the concentration of Ca2+ compared to the control for the DPS30F (614.2 to 747.9 mg kg−1), DPS60F (614.2 to 848.2 mg kg−1) and MIXED treatments 614.2 to 641.1 mg kg−1) (Table 4).
There was a significant drop in the Mg2+ concentration following the application of amendments to the clCM soil, except for Mixed and DPS60F treatments, whereas in the coLV soil, there was no significant effect compared to the control.
K+ values were significantly higher than the control in the acidic coLV soil, only for theDPS60F. The DPS60F treatment significantly decreased the Na+ concentration in the clCM soil. There was also a significant decrease in the Na+ concentration for the DPS60 and DPS30F in the acidic coLV soil (Table 4).
3.1.5. Effect on Cation Exchange Capacity
Results showed a significant effect of soils (p ˂ 0.0001), treatments (p ˂ 0.001), and their interaction (p ˂ 0.005), on the cation exchange capacity (CEC) (see Supplementary data). In the clCM soil, CEC values established to 23.08, 29.35 to 50 meq 100 g−1 soil for the control, DPS60 and MIXED treatments respectively. In the coLV soil, the maximum CEC value was also observed for the MIXED (DPS + SS) treatment (195.0 meq 100 g−1) compared to the control (134.22 meq 100 g−1) and DPS60 (133.97 meq 100 g−1).
3.2. Effect of De Inking Paper Sludge on Carbon Mineralization
In the absence of N fertilizer, the addition of DPS30 (30 Mg ha−1) increased the C0 mineralization potential for both soils. Indeed, DPS provides an appreciable supplement (63%) of organic carbon (Table 5). Doubling this rate with DPS60 produced a slight decrease in C0 in the cl CM soil but C0 remained stable in the coLV soil. The addition of ammonium nitrate did not affect the mineralization potential of any of the treatments in either soil except for DPS60 added to the coLV soil. The mineralization coefficient k did not seem to be affected by DPS inputs, but N inputs (organic or mineral) increased this coefficient. The maximum mineralization rate occurred for the SS10 and DPS60 treatments in the clCM and coLV soils, respectively.
Table 5.
Kinetic parameters of carbon (C) mineralization according to the exponential model calculated as Ct = C0 (1 − e(−kt)) using Curve Expert Professional software.
3.3. Effect of DPS on Nutrient Status, Yield, and Root Length of Durum Wheat
3.3.1. Grain Yield and Nutrient Status
Biosolid application improved the grain yield of the clCM soil for DPS30F, MIXED, SS5, and SS10 treatments compared to the control. Significant decreases in grain yield were observed for the co LV soil, except for the DPS 60 F treatment, which produced a significant increase (Table 6). Results revealed that, in the clCM soil, grain N content decreased for all treatments except DPS60F. Whereas, in the co LV soil, grain N content increased significantly for the DPS30, DPS30F, DPS60F and SS10 treatments. For grain P content, the maximum concentration was occurred for the DPS30, DPS60 and SS10 in the clCM soil and for the MIXED, SS5, and SS10 treatments in coLV soil. The highest concentrations in grain K content were observed in clCM soils amended with DPS30 and DPS60. While, in the coLV soil, the DPS60, MIXED, SS5, and SS10 treatments produced the highest contents. Data showed that DPS30 and DPS 60 positively affected the Ca2+ grain content on the clCM soil, however, we registered a decline using the MIXED, SS5, and SS10 treatments. For coLV soils, we noted a positive effect of the DPS 60 application on Ca2+ grain content, however, we observed a negative effect when adding DPS30 and DPS30F. Moreover, results revealed no significant effects on grain Mg content for nearly all treatments, excepting DPS60, MIXED, and SS10 added to the clCM soil. For the coLV soil, Mg grain content increased significantly for DPS60 and declined for the DPS30, DPS30F, and MIXED treatments. In the case of Na grain content, in clCM, we observed, an increase in DPS60 and SS10 and we detected a significant only positive effect in DPS60 for coLV soil.
Table 6.
Wheat grain yield and selected elemental composition as affected by biosolid application.
3.3.2. Straw
Data indicates that biosolid application consistently increased straw yield, particularly for the cl CM soil, DPS30, DPS30F, MIXED, and SS10 treatments compared to the control. For the co LV soil, with the exception of the DPS 60 F treatment, treatments caused a significant decrease in straw yield (Table 7). The highest straw P content occurred for the SS10, DPS30 and DPS60 treatments added to the clCM soil and DPS30 and DPS60 treatments added to the coLV soil. For Straw K content, we observed a significant increase with the application of DPS30F and MIXED to clCM soil and the application of DPS60, MIXED, SS5, and SS10 to the coLV soil. Deinking paper sludge alone (30 and 60 Mg ha−1) or mixed with 10 Mg ha−1 sewage sludge significantly increased Ca2+ straw content for the cl CM soil. Whereas there was no significant effect for the co LV soil. The most notable increase in straw Na+ content was detected for the Mixed in cl CM soil and for DPS60F and SS10 treatments in co LV soil.
Table 7.
Wheat straw yield and selected elemental composition as affected by deinking paper sludge application.
3.3.3. Root Length and Biomass
The effect of the combined application of SS and DPS treatments on root length and biomass and nutrient content is illustrated in Table 8. All treatments induced a higher root length as compared to the control for the clCM soil, whereas, for the coLV soil, we observed this trend only when adding DPS60F. As for root biomass, data showed an improvement of this parameter for most of the treatments for the two soils. Regarding nutrient content, all treatments induced an increase in the concentrations of some elements for both soils compared to the control. Results show an inhibition of root N concentration for the clCM soil for all treatments expect for DPS30. However, an increase in this parameter was observed for DPS60 and DPS60F added to the co LV soil. Root P content increased significantly with the application of DPS60, MIXED, SS5, and SS10 to the clCM soil, and with the application of the DPS30, DPS60, DPS30F, DPS60F and MIXED treatments to the coLV soil, while it declined with SS5 and SS10. The use of DPS60F and SS5 significantly increased root K content for the cl CM soil, more interestingly, data revealed an improvement of the concentration of K for all treatments in the case of the coLV soil.
Table 8.
Wheat root length and selected elemental composition affected by deinking paper sludge application.
Furthermore, we observed an increase in Ca2+ root content using DPS30 for the cl CM soil and DPS60 and DPS60F for the coLV soil. Root Mg2+ content was significantly higher for DPS30 added to the clCM soil and decreased for all treatments compared to the control for the coLV soil. The application of DPS60F and MIXED produced the highest values of root Na content for the cl CM soil, while the highest values for the coLV soil occurred when DPS60, DPS30F andDPS60Fwere applied.
3.4. Metal Content
Cd and Pb contents in wheat extracts were below the detection limits of the apparatus (Flame Atomic Absorption Spectroscopy: AA400 Flame), i.e., <0.8 µg Cdl−1 and <15 µg Pb l−1.
The Cd and Pb contents in durum wheat were less than 0.8 µg g−1 for Cd and less than 15 µg g−1 for Pb. The acceptable thresholds for cereals are 0.2 mg g−1 for Cd and 0.2 mg g−1 for Pb as indicated by the European regulation of the 1881/2006 European directive. [] There is therefore no contamination risk by either cadmium or lead.
4. Discussion
One of the most important benefits of sludge application to agricultural soils is the increased availability of plant nutrients. Deinking paper sludge was characterized as an alkaline residue according to the studies of Marouani et al. [,,]. Soil characteristics were in the same range as those reported in many studies conducted in the same region [,]. Previous studies by Cabral and Vasconcelos [], Nunes et al. [] and Marouani et al. [] established a close relationship between paper sludge application rate and pH in soils, especially in acidic soils. This can be explained by the high initial pH of calcareous clCM soils, which is expected to be more strongly buffered than soils with low pH [].
The Marouani et al. [] study, which evaluated the effect of two years of DPS application on the same calcareous soil indicated that, following a limestone amendment, the Ca2+ ions replace the H+ ions on the clay humic complex, thus decreasing the acidity. However, this study only showed a short-term effect of DPS application and only for 30 Mg ha−1 in the absence of nitrogen fertilizer, pH was lower than the control. This decrease was linked to a “priming effect” produced by the addition of a small dose of organic matter in the form of deinking sludge, causing intense mineralization, and releasing organic acids. and that for the other treatments DPS30F, DPS60F, and DPS60, the mineralization is less intense thus promoting a slow degradation of the matter and the pH increases significantly compared to the control (8.16–8.57). This could be explained by the change in soil pH following an acidic or basic amendment, the soil would tend to return to its original pH after a certain period due to the soil’s buffering capacity. This principle is very important especially, for calculating the dose necessary to correct pH []. For the other wastewater sludge treatments (Mixed, 5 SS, and 10 SS), there were no significant differences compared to the control. Thus, it can be concluded that the soil returned to its initial pH after harvest or that the pH remained unchanged. These results give us an idea of the residence time and the degradation of DPS. As to the 30 Mg ha−1 rate, it does not seem to slow or block mineralization in agricultural soils even after the end of the growing season. This result is in concordance with those of Marouani et al. []. In the acidic coLV soil, the sludge application rate was closely related to the change in soil pH and about 60 Mg ha−1 of DPS will be required to raise the pH from 6.01 to 6.54 in this soil, whether in the absence or presence of fertilizer. The present results are in accordance with other studies where a close relationship was reported between paper sludge application rate and pH in Mediterranean soils [,,]. DPS application significantly increased the pH in both soils (Table 4). Soils with high initial pH were expected to be more strongly buffered than soils with low initial pH [,].
When chemical N fertilizers (DPS30F and DPS60F) are added, there is a strong increase in EC due to the salts contained in the fertilizers. In the acidic coLV soil, the decrease was statistically significant only for the 30 Mg ha−1 sludge dose. For both soils, the value of EC for the mixed treatment (10 Mg ha−1 SS + 60 Mg ha−1 DPS) is lower than the same 60 Mg ha−1 dose with chemical N fertilizer. This result highlights the importance of integrating organic nitrogen with DPS (i.e., sewage sludge) to reduce salt accumulation. DPS is composed of kaolinite and montmorillonite [] and could be recommended for saline limestone soils to decrease the Na+ concentration. Therefore, studies of DPS applications to saline soils are a new track that should be followed. Our results also showed that the absence of an increase in SOC during the growing cycle can be explained by the mineralization of the OM and its assimilation by plants. The objective of adding DPS to soils is to increase the SOC and thus use DPS as a fertilizer [,,]. Considering our results, we recommend adding doses at rates below 30 Mg ha−1 for calcareous soils if the objective is an increase in the organic carbon stock of the soil.
A rapid mineralization of organic carbon following the addition of a nitrogen source (mineral or organic) was observed. This suggests that nitrogen could have been immobilized during the degradation of labile C constituents in the DPS and that organic N mineralized very slowly when high levels of sludge were applied to the clCM soil. Studies have reported that amending soils with high C:N paper sludge caused a net immobilization of soil N and reduced plant growth [,]. Whereas low C:N sludge increased plant-available N and biomass production in N-limited soils [,]. Thus, the choice of nitrogen type is important. The association of DPS and organic fertilizer SS may increase the adsorbent capacity of the humic clay complex compared to chemical amendments. NO3− ions are still in the drainage water when paper sludge is amended with chemical fertilizer [].
The saturation of Ca2+ in the soil solution accompanied by N immobilization due to high C content in DPS60 for the clCM soil induces humus fixation on clay by the Ca2+, ion and the formation of calcium bonds []. The sludge used in this study had a Ca:Mg ratio of 131:1, indicating that an adjustment of Mg is needed to reduce this ratio in the future. These findings agree with other studies, using similar materials, which reported that no consistent trend was observed for soil Mg as a function of the addition of increased paper sludge rates to soils. Except for the Mixed treatment (combined DPS and SS), Mg 2+ values were significantly higher than the control and the differences were statistically significant. Ca2+ plays an antagonistic role for potassium, unlike K+. Ca2+ slows the absorption of water and increases respiration. Ca2+ also functions as a growth regulator by slowing the elongation of plant organs and thus intervenes in the root development of the plants. Mg2+ and K+ are essential to plant life, Mg2+ is a constituent of chlorophyll and activates certain enzymes involved in the metabolism of phosphorus, lipid carbohydrate proteins, and vitamins. K+ is a catalytic agent in the synthesis of carbohydrates and proteins. Deficiencies in Mg2+ and K+ are rare in clay or silty clay soils but frequent, on the other hand, in sandy or very calcareous soils.
The increase in available P in amended soils reflects the mineralization of organic P from the decomposition of DPS. However, due to P fixation, increasing pH and Ca during the experiment limited this effect [,]. Except for Mg in the clCM soil, there was a highly significant relationship between sludge application and all exchangeable cations in both soils, indicating that an increase in sludge rate resulted in a proportional increase in exchangeable basic cations in the soil. The net effect of the increase in exchangeable cations was the enrichment of soil exchange sites with basic cations in both soils. As was expected, the increases in CEC are attributable to increases in organic matter. The CEC of a soil depends on the nature of the colloids and the soil pH.
DPS mineralization was characterized by two steps; the first phase consisted in high biological activity due to the presence of readily biodegradable substances and by a large release of CO2. This release decreased in the second phase because of the reduction in biological activity caused by a decrease in readily biodegradable substances []. Mineralization results explained the role of nitrogen in stimulating the activity of microorganisms. The speed of mineralization decreased for the coLV soil and this process can be linked to the acidic pH, which negatively affects the biological activity of the soil microorganisms and the soil CEC, which depends on soil texture.
Plant response to biosolids varied between amendment type, soil type, and plant part (grain, straw, or root). This study suggests that DPS30F and DPS60F should have sufficient N and other essential elements to provide good grain yields. The highest grain yield obtained for the coLV soil with DPS60F may be explained by its low cation exchange capacity. Hence, adding more organic matter might help to retain nutrient cations at exchange sites and promote soil structure []. Moreover, type, grain yield was affected by the interaction between treatment and soil in this study. Our investigation indicated that DPS30F has the potential for improving yield for clay-loam-sand (balanced) textured soils (coLV). These results could be attributed to the belowground favorable living conditions for microorganisms [,]. Recent reviews have highlighted the beneficial effects of this soil texture which provides higher and faster mineralization than clay-loam textures, as found for the clCM soil []. The use of DPS instead of sending it to landfills can mitigate around 30% of greenhouse gas emissions [,] and the substitution of chemical fertilizer sources by organic amendments based on DPSs can lead to a 40% decrease of N2O emissions [].
The influence of amendments type and soil type were observed for straw yield. Compared to the addition chemical fertilizer, the application of organic sources improved the straw yield for both soils. This can be interpreted as a positive effect produced by these two amendments and they could be used for forage crops. The amendment rate depended also on the soil characteristics. Our findings suggest that the appropriate selection of rates and fertilizer combinations increases grain and straw yields.
Root length and biomass were affected by amendment and soil type. The maximum root length was obtained for the 60 Mg ha−1 DPS treatment can be explained by the highest values of C:N in this amendment (between 73 and 117), which resulted in an increase in root length as an alternative to the strategy of increasing resource N uptake. However, root biomass was found to be highest when adding 30 Mg DPS ha−1. This finding is in line with the Hirte et al. [] study which established that root biomass is inhibited by N deficiency.
Regardless of amendment type, soil mineralization was affected by DPS rate, the presence or absence of N fertilizer, and the type of N fertilizer (mineral or organic).
The variation of macro and micronutrients with the different treatments was found to be significantly related to different plant parts and soil types. Overall, the highest grain N and P contents were obtained with DPS30 and DPS60 applied to either soil. This result was likely caused by the availability of these two elements which were derived from the decomposition of DPS. More interestingly, the high grain N values obtained for these two amendments is the parameter that characterizes the quality of grain and consequently the grain yield [].
The analysis of the soil and plants after the application of deinking sludge did not detect any trace of Cd and Pb. This shows that DPS sludge did not contaminate the soils under our experimental conditions. Moreover, in their characterization of DPS, Marouani et al. [] demonstrated that the same DPS used in this study can be used as residual fertilizing matter according to the strictest Quebec standards for the management of paper sludge and that there was no risk of metallic or organic pollution in the short and medium-term. Marouani et al. [] also evaluated the effect of DPS under field conditions after two years of application (30 and 60 Mg ha−1) on the same clCM soil used for our experiment and showed that there was no risk of soil contamination if the application rate did not exceed 60 Mg ha−1.
5. Conclusions
The application of de-inking sludge characterized by low N, P, and K contents and a very high C:N ratio seems to improve straw production without having any effect on the grain. However, results showed that better soil fertility and an increase in the durum wheat yield were observed when DPS was combined with a nitrogen supplement source. The form of nitrogen supplement (organic or mineral) affected soil mineralization, soil fertility, and plant growth. The rate of DPS application varied according to the initial CEC, texture and pH of the soil, and the form of N supply. For example, for the clCM soil, the 30 Mg DPS ha−1 rate was increased durum wheat grain yield (around 37%), straw yield, and root biomass. For the coLV soil, the 60 DPS Mg ha−1 rate associated with 10 SS Mg ha−1 is recommended to increase durum wheat yield and maintain soil fertility. The value of applying biosolids (DPS and SS) lies in their capacity to improve soil properties and to provide nutrients to the plants, which ensures plant growth. A long-term study is required to validate these results under field conditions and with other crops. Fodder crops should be tested.
Supplementary Materials
The following are available online at https://www.mdpi.com/article/10.3390/agronomy11040709/s1, Table S1: Analysis of variance of DPS application effects on Electrical Conductivity (CE) and on cation exchageable capacity (CEC).
Author Contributions
Conceptualization, E.M.; methodology, E.M., B.Z. and N.K.B. and R.I.Z.; validation, N.K.B., N.Z. and A.K.; formal analysis, E.M. and B.B.; investigation, E.M., B.Z., K.B. and N.K.B.; resources, N.K.B., N.Z. and A.K.; data curation, E.M., B.Z., K.B., R.I.Z.; writing—original draft preparation, E.M.; writing—review and editing, K.B., N.K.B., N.Z., A.K.; supervision, N.K.B., N.Z., A.K.; project administration, N.K.B.; funding acquisition, N.K.B., A.K. All authors have read and agreed to the published version of the manuscript.
Funding
We are grateful to Tunisie Ouate, CETIBA, CRIBIQ, Mitacs, Canada Research Chairs, the Tunisian Ministry of Industry, the Tunisian Ministry of Higher Education, and Agriculture and Agri-Food Canada.
Institutional Review Board Statement
Not applicable.
Informed Consent Statement
Not applicable.
Data Availability Statement
Not applicable.
Acknowledgments
We thank for the technical support of National Agency for Waste Management (ANGed) “Department of Industrial Waste” under the tutorial of the Ministry of the Environment and sustainable development of Tunisia.
Conflicts of Interest
The authors declare no conflict of interest.
References
- Hébert, M. Guide sur le Recyclage des Matières Résiduelles Ferilisantes: Critères de Référence et Normes Réglementaires; Ministry of Sustainable Development, Environment, and Fight Against Climate Change: Quebec City, QC, Canada, 2015; Available online: http://www.environnement.gouv.qc.ca/matieres/mat_res/fertilisantes/critere/guide-mrf.pdf (accessed on 26 June 2020).
- Marouani, E.; Ziadi, N.; Lévesque, V.; Benzina, N.K.; Bouslimi, B.; Koubaa, A. Mitigation of CO2, CH4 and N2O from Acidic Clayey Soil Amended with Fertilizer Pellets Based on Al-kaline Organic Residues. Waste Biomass Valorization 2020, 1–15. [Google Scholar] [CrossRef]
- Faubert, P.; Barnabé, S.; Bouchard, S.; Côté, R.; Villeneuve, C. Pulp and paper mill sludge management practices: What are the challenges to assess the impacts on greenhouse gas emissions? Resour. Conserv. Recycl. 2016, 108, 107–133. [Google Scholar] [CrossRef]
- Marouani, E.; Benzina, N.K.; Ziadi, N.; Bouslimi, B.; Abida, K.; Tlijani, H.; Koubaa, A. CO2 Emission and Change in the Fertility Parameters of a Calcareous Soil Following Annual Applications of Deinking Paper Sludge (The Case of Tunisia). Agronomy 2020, 10, 956. [Google Scholar] [CrossRef]
- Marouani, E.; Benzina, N.K.; Ziadi, N.; Bouslimi, B.; Abouda, A.; Koubaa, A. Deinking sludge compost stability and maturity assessment using Fourier transform infrared spectroscopy and thermal analysis. Waste Manag. Res. 2019, 37, 1043–1057. [Google Scholar] [CrossRef] [PubMed]
- Camberato, J.J.; Gagnon, B.; A Angers, D.; Chantigny, M.H.; Pan, W.L. Pulp and paper mill by-products as soil amendments and plant nutrient sources. Can. J. Soil Sci. 2006, 86, 641–653. [Google Scholar] [CrossRef]
- Fierro, A.; Angers, D.A.; Beauchamp, C.J. Restoration of ecosystem function in an abandoned sandpit: Plant and soil responses to paper de-inking sludge. J. Appl. Ecol. 1999, 36, 244–253. [Google Scholar] [CrossRef]
- Ziadi, N.; Gagnon, B.; Nyiraneza, J. Crop yield and soil fertility as affected by papermill biosolids and liming by-products. Can. J. Soil Sci. 2013, 93, 319–328. [Google Scholar] [CrossRef]
- Filiatrault, P.; Camiré, C.; Norrie, J.P.; Beauchamp, C.J. Effects of de-inking paper sludge on growth and nutritional status of alder and aspen. Resour. Conserv. Recycl. 2006, 48, 209–226. [Google Scholar] [CrossRef]
- Rashid, M.; Barry, D.; Goss, M. Papermill biosolids application to agricultural lands: Benefits and environmental concerns with special reference to situation in Canada. Soil Environ. 2006, 25, 85–98. [Google Scholar]
- Chantigny, M. Émissions de protoxyde d’azote (N2O) en Agriculture, Contribution des Amendements Organiques, des Fertilisants Miné-Raux et du Labour. In Proceedings of the 65e Congrès de l’Ordre Agronomique du Québec; 2018. 8Available online: https://www.agrireseau.net/agroenvironnement/documents/chantigny.pdf (accessed on 26 January 2020).
- Barriga, S.; Méndez, A.; Camara, J.; Guerrero, F.; Gascó, G. Agricultural valorisation of de-inking paper sludge as organic amendment in different soils. J. Therm. Anal. Calorim. 2010, 99, 981–986. [Google Scholar] [CrossRef]
- Annabi, M.; Bahri, H.; Latiri, K. Statut organique et respiration microbienne des sols du nord de la Tunisie. Biotechnologie, Agronomie. Société Environ. 2009, 13, 401. [Google Scholar]
- Latiri, K.; Lhomme, J.; Annabi, M.; Setter, T. Wheat production in Tunisia: Progress, inter-annual variability and relation to rainfall. Eur. J. Agron. 2010, 33, 33–42. [Google Scholar] [CrossRef]
- Chamekh, Z.; Karmous, C.; Ayadi, S.; Sahli, A.; Hammami, Z.; Fraj, M.B.; Benaissa, N.; Trifa, Y.; Slim-Amara, H. Stability analysis of yield component traits in 25 durum wheat (Triticum durum Desf.) genotypes under contrasting irrigation water salinity. Agric. Water Manag. 2015, 152, 1–6. [Google Scholar] [CrossRef]
- Legrain, X.; Berding, F.; Dondeyne, S.; Schad, P.; Chapelle, J. Base de Référence Mondiale pour les Ressources en Sols 2014. Système International de Classification des Sols pour Nommer les Sols et Élaborer des Légendes de Cartes Pédologiques. Available online: http://www.fao.org/3/i3794fr/I3794FR.pdf (accessed on 26 June 2020).
- Nunes, J.R.; Cabral, F.; López-Piñeiro, A. Short-term effects on soil properties and wheat production from secondary paper sludge application on two Mediterranean agricultural soils. Bioresour. Technol. 2008, 99, 4935–4942. [Google Scholar] [CrossRef] [PubMed]
- Pauwels, J.; Van Ranst, E.; Verloo, M.; Mvondo, Z.E.A. Manuel de Laboratoire de Pedologie: Methodes D’analyses de Sols et de Plantes, Equipement, Gestion de Stocks de Verrerie et de Produits Chimiques. 1992. Available online: http://hdl.handle.net/1854/LU-223183 (accessed on 20 June 2020).
- Nelson, D.W.; Sommers, L.E. Total carbon, organic carbon, and organic matter. In Methods of Soil Analysis: Part 3 Chemical Methods; Soil Science Society of America and American Society of Agronomy: Madison, WI, USA, 1996; Volume 5, pp. 961–1010. [Google Scholar] [CrossRef]
- Olsen, S.R. Estimation of Available Phosphorus in Soils by Extraction with Sodium Bicarbonate; United States Department of Agriculture: Washington, DC, USA, 1954.
- Waring, S.A.; Bremner, J.M. Ammonium Production in Soil under Waterlogged Conditions as an Index of Nitrogen Availability. Nat. Cell Biol. 1964, 201, 951–952. [Google Scholar] [CrossRef]
- Murphy, J.; Riley, J. A modified single solution method for the determination of phosphate in natural waters. Anal. Chim. Acta 1962, 27, 31–36. [Google Scholar] [CrossRef]
- Richards, J.E. Chemical characterization of plant tissue. Soil sampling and methods of analysis. Lewis Ann. Arbor. 1993, 15, 115–139. [Google Scholar]
- Bremner, J.M.; Sparks, D.L.; Page, A.L.; Helmke, P.A.; Loeppert, R.H.; Soltanpour, P.N.; Tabatabai, M.A.; Johnston, C.T.; Sumner, M.E. Nitrogen-Total. Methods of Soil Analysis: Part 3 Chemical Methods; Soil Science Society of America and American Society of Agronomy: Madison, WI, USA, 1982; Volume 2, pp. 595–624. [Google Scholar] [CrossRef]
- SAS Institute Inc. Cary, NC, USA. 2008. Available online: https://support.sas.com/resources/papers/proceedings/pdfs/sgf2008/190-2008.pdf (accessed on 20 June 2020).
- Cabral, F.; Vasconcelos, E. Agricultural use of combined primary/secondary pulp mill sludge. Agrochimica 1993, 37, 409–417. [Google Scholar]
- Luo, X.-S.; Yu, S.; Zhu, Y.-G.; Li, X.-D. Trace metal contamination in urban soils of China. Sci. Total Environ. 2012, 421–422, 17–30. [Google Scholar] [CrossRef]
- Dos Santos Rheinheimer, D.; Anghinoni, I. Accumulation of soil organic phosphorus by soil tillage and cropping sys-tems under subtropical conditions. Commun. Soil Sci. Plant Anal. 2003, 34, 2339–2354. [Google Scholar] [CrossRef]
- Weil, R.R.; Magdoff, F. Significance of soil organic matter to soil quality and health. In Soil Organic Matter in Sustainable Agriculture; CRC Press Inc.: Boca Raton, LA, USA, 2004; pp. 1–43. [Google Scholar]
- Naveed, M.; Herath, L.; Moldrup, P.; Arthur, E.; Nicolaisen, M.; Norgaard, T.; Ferré, T.P.; De Jonge, L.W. Spatial variability of microbial richness and diversity and relationships with soil organic carbon, texture and structure across an agricultural field. Appl. Soil Ecol. 2016, 103, 44–55. [Google Scholar] [CrossRef]
- Faubert, P.; Bélisle, C.L.; Bertrand, N.; Bouchard, S.; Chantigny, M.H.; Paré, M.C.; Rochette, P.; Ziadi, N.; Villeneuve, C. Land application of pulp and paper mill sludge may reduce greenhouse gas emissions compared to landfilling. Resour. Conserv. Recycl. 2019, 150, 104415. [Google Scholar] [CrossRef]
- Faubert, P.; Lemay-Bélisle, C.; Bertrand, N.; Bouchard, S.; Chantigny, M.H.; Durocher, S.; Paré, M.C.; Rochette, P.; Tremblay, P.; Ziadi, N.; et al. Greenhouse gas emissions following land application of pulp and paper mill sludge on a clay loam soil. Agric. Ecosyst. Environ. 2017, 250, 102–112. [Google Scholar] [CrossRef]
- Hirte, J.; Leifeld, J.; Abiven, S.; Mayer, J. Maize and wheat root biomass, vertical distribution, and size class as affected by fertilization intensity in two long-term field trials. Field Crops Res. 2018, 216, 197–208. [Google Scholar] [CrossRef]
- Ukalska-Jaruga, A.; Siebielec, G.; Siebielec, S.; Pecio, M. The Impact of Exogenous Organic Matter on Wheat Growth and Mineral Nitrogen Availability in Soil. Agronomy 2020, 10, 1314. [Google Scholar] [CrossRef]
Publisher’s Note: MDPI stays neutral with regard to jurisdictional claims in published maps and institutional affiliations. |
© 2021 by the authors. Licensee MDPI, Basel, Switzerland. This article is an open access article distributed under the terms and conditions of the Creative Commons Attribution (CC BY) license (https://creativecommons.org/licenses/by/4.0/).