Abstract
To determine the effect of the tractor driving system type on the soil compaction and soil behavior a series of tests was conducted using Goldoni 240 tractor with a power rate of 30.8 kW and included four similar tires at three different driving systems (4WD, rear-wheel drive (RWD) and front-wheel drive (FWD)). To evaluate these systems’ effects on soil compaction, tests were conducted at three soil moisture contents (10, 15 and 20% d.b.), three tire inflation pressures (170, 200 and 230 kPa), and three tractor speeds (1.26, 3.96 and 6.78 km/h). Soil bulk density was measured at three average depths of 20, 30 and 40 cm. To evaluate soil compaction, cylindrical cores were used and to assess soil behavior during this process, the soil displacement in a three coordinate system was measured using three displacement transducers. It was found that the 4WD system created the least bulk density of 1155 kg/m3, while the FWD system led to the highest density of 1241 kg/m3. Maximum vertical soil compression of 55 mm occurred for the FWD system and it declined to 43 and 36 mm in RWD and 4WD systems, respectively. Soil displacement in the horizontal and lateral directions was larger for the FWD system in comparison to the other systems. With increment of speed and depth soil compaction decreased. Minimum bulk density of 1109 kg/m3 was occurred at velocity of 6.78 Km/h using the 4WD system, also with this system at the depth 40 cm density was 1127 kg/m3. While at velocity of 1.26 Km/h and depth of 20 cm soil density was 1190 kg/m3.
1. Introduction
Agricultural management practices on a large scale require using of heavy machines for planting and harvesting. These are often associated with the destruction of soil structure and increasing soil density. Increasing heavy machine use causes a high stress on soil up to deeper depths and therefore, great subsoil compaction has been reported in comparison to the past [1,2,3]. In order to enhance productivity in the agricultural sector, farms should be large enough, which their productivity can be enhanced by using more efficient machines [4]. For many years, the trend in agriculture has been towards increasing the tractor size and weight, which increases the risk of soil compaction [5]. To eliminate created hard layers of soil that limit the root growth and proper drainage of the soil [6,7], deep plowing is often necessary and plowing with such intensity increases required energy and imposes heavy costs on farmers [8].
Soil compaction is a form of physical degradation of soil that causes compacting and approaching solid particles of soil near each other or reducing porosity and reducing soil permeability, which appear as an increase of dry soil bulk density [9]. Soil compaction can significantly reduce soil productivity [10], based on information from seven countries in Europe and North America, a 14% yield reduction in the first year after the passing of machines has been reported [11]. Disadvantages of soil compaction such as reduced water infiltration rate and reduced air permeability in soil affect soil chemical properties. Soil compaction reduces oxygen release and can lead to suffocation in compacted soils if oxygen consumption is faster than release. At the same time, due to the reduction of the water infiltration rate, soil compaction can lead to flooding. Flooding of surface soil in turn leads to a decrease in oxygen. As a result of this phenomenon, there is no necessary potential for the formation of various metal ions that can be absorbed by plant organs, and consequently the plant will suffer from micronutrient deficiencies [12]. Soil compaction leads to limited root growth, reduced access to nutrients, and increased loss of soil nutrients by leaching, runoff, and loss of gases in the atmosphere, which can affect plant growth. Soil density increment affects the ability of roots to penetrate due to increased soil resistance and decreased number of macropores [13]. One of the most important effects of soil density on plant growth is the lack of germination and emergence of plant seedlings to the soil surface. Due to the fact that young seedlings have little energy, dense soil consumes their energy and prevents the emergence of seedlings. In general, soil compaction greatly reduces crop yields [14].
Increasing load on the agricultural machinery wheels is the main cause of soil compaction in the deeper layers of the soil. Topsoil of arable land is loosened by plowing every year, however, the soil layer beneath the plow layer often remains intact. This means that every time the maximum load carrying capacity on tires, soil moisture exceeded the normal limit, additional soil compaction will occur at deeper depths of soil. Moreover, these effects are long lasting, and the results of natural and artificial soil compaction are destructive [15]. In the first step, all effort it should be conducted to prevent from soil compaction occurring, and one of the most effective solution is reducing the load on the wheel. Soil compaction can be avoided by adjusting tire size, tire inflation pressure and contact pressure of the loaded wheel [16].
Contact area between the drive tires and soil and their basic dimensions such as width and length affect traction properties of machines and changes in soil physical parameters [17]. In addition, the compaction considerably is influenced by tire operating parameters, wheel slip, forward speed and number of passes [18]. In order to study the effects of soil moisture on soil compaction, tests were carried out in Sweden in the moisture content range between 11 and 35% (d.b.) with load of 2, 3, 5 and 7 Mg on tires. The results showed that compaction occurs much less in dry soil but with rising soil moisture (less than the critical limit) and increasing load, soil compaction increased significantly [19]. Soil stress was measured under vehicle traffic by placing a pressure transducer in the soil and soil stress data have been used to calculate soil pressure including octahedral stresses and principal stresses. However, the relationship between soil stress and strain has not been well-defined [20]. In another study, a computational tool for simulation of compaction induced by agricultural field traffic based on soil physical and soil mechanics principles was presented. It includes the calculation of contact stress, stress propagation in the soil profile, simulation of bulk density variation in response to the applied stress and assessment of the risk of compaction through readily available soil properties and machinery parameters. The model was computationally implemented as a set of R functions (R software), and on an interactive web page, named PredComp. The results of this simulation have acceptable accuracy [21]. Hence, predicting strain by the stress data may significantly differ from the actual soil strain. A simple stress–strain relationship based on linear elastic theory cannot precisely predict soil compaction from stress. Therefore, measuring soil strain in different directions of the vertical, lateral and longitudinal will be useful [22]. Erbach [20] used a rectilinear potentiometer to measure soil vertical strain. Soil compaction was measured using six soil-strain gages under tires of a tractor with a mass of 6000 kg, where 4200 kg was distributed on the rear axle. Four gages were positioned vertically and spaced 150 mm apart and with extended endplate distances of 250 mm. Their top endplate was 50, 100, 150 and 200 mm beneath the soil surface. Two gages also were placed 150 and 300 mm laterally away from the tire centerline from the centerline of the rear tire with their top endplates 50 mm beneath the soil surface. The result of field tests showed that soil strain decreased with the depth increment. The maximum natural strain of 17.6 and 3.2% occurred under the rear tire when the top endplate of strain gages were 50 and 200 mm under the soil surface, respectively. In a study [23] the effect of two tractors with different tire sizes and axle loads on the motion resistance and soil cone index on three soil conditions: direct sowing systems, ploughed and seedbed was investigated. They determined the relationship between the motion resistance and pressure parameters of the ground and the tire sinkage. Their results showed that the single differential tractor with less axle load generated more compaction in the topsoil in comparison with two differential tractor, which included more axle load. However, in subsoil the tractor equipped with two differentials has generated greater compaction than the 2WD tractor [23]. In a study in Sweden, researchers compared the compaction and slip caused by a rubber track tractor, a tractor with a single tire (two tires on rear axle) and a dual tire tractor (4 tires on rear axle). Measured stress and compaction in all depths for the track and dual wheel tractors were about the same but were considerably higher for the single wheel tractor. Slip for tractors with dual and single wheels was significantly higher than for the track tractor [5]. The effect of passing of tires and a rubber track at high axle loads on soil compaction investigated by Asnsorage and Godwin [24]. After the passage of a track the effect of the rear tire size was insignificant, but the rear tire size had a significant influence on soil density when following a leading tire. This was due to a higher strength layer at the soil surface created by the track, which was able to withstand the load of the subsequent passes and protect the soil below from further compaction. A field experiment on an alluvial sandy loam was conducted to determine the compaction of the subsoil layers resulting from multiple passes of a 4WD tractor was performed with changing normal loads [25]. Normal loads on both rear tires and the number of passes were 4.4, 4.6 and 4.8 kN and 1, 6, 11 and 16, respectively. Cone penetration resistance and bulk density were measured each 5 cm down to a depth of 60 cm. The effect of the number of passes and normal loads decreased with increasing depth. Practically at depths greater than 45 cm, the effect of pass and normal loads were not significant. In a study the effects of soil moisture, depth and speed of the tractor on soil compaction in three main directions of transducers were investigated [26]. In the trial tests displacement transducers and cylindrical cores were used for measuring soil displacement and compaction. The results showed that compaction increases considerably as speed decreased and moisture increased. Soil was compressed in the vertical direction and was stretched in the lateral direction. The results showed that the soil is compacted with approaching the tire to the transducer in the longitudinal direction and then was stretched as the tire was on top of the sensor and after passing tire it compressed again. Similar results were reported by Way [27]. In a study, the effect of traffic of high-mass potato combines and low-mass autonomous harvesters on soil compaction was investigated. The results of this study showed that the use of high-mass combines causes the soil compaction to exceed the critical limit. Additionally, the disadvantages of increasing the weight of the combine on the soil were more severe in wet conditions. The study suggested that the integration of controlled traffic farming and low-mass autonomous machinery can be used as a viable alternative to high-mass combines for preventing soil compaction phenomenon [28].
Efforts that were begun to eliminate soil compaction have been expanded to completely manage traffic-induced soil compaction. Controlled traffic is a compaction management concept that can provide the conditions desired for crop production systems. Antille et al. [29] conducted a literature review to collate best practice techniques for soil compaction management within cotton-farming systems in Australia. Universally negative effects of traffic-induced soil compaction on the whole-farm system and the wider environment include reduced fertilizer-use and water efficiency and increased tillage intensity. Knowledge gaps that merit research priority, and research strategies, are suggested. These include: identifying wider impacts on farm economics to guide decision-making and development of decision support systems that capture the effects of compaction on fertilizer, water and energy use efficiency and predicting risks at the field and implementing precision management of traffic compaction to investigate the role of controlled traffic farming (CTF) in mitigating greenhouse gas emissions and loss of soil organic carbon, and enhancing fertilizer and water-use efficiencies. Catchment-scale modeling incorporating changes in arable land-use, such as increased area under CTF coupled with no- or minimum-tillage, and variable rate technology is suggested. Such modeling should assess the potential of CTF and allied technologies to reduce sediment and nutrient losses, and improve water quality in intensively managed arable catchments. Resources must be efficiently managed within increasingly sophisticated farming systems to enable long-term economic viability of cotton production. Key to managing soil compaction appears to be encouraging increased adoption of CTF.
Sidhu and Duiker [30] showed that soil compaction decreased crop yield as they studied maize plant population, its height and yield from 2002–2005 in a no-tillage/in-row tillage study on silt loam soil. Soil was compacted annually with a three-axle truck with 10-Mg axle load mounted with road tires (700 kPa inflation pressure) or flotation tires (250 kPa). Remediation treatments were deep (40 cm) in-row tillage before or after compaction with road tires and shallow (10 cm in 2002–2003 and 22 cm in 2004–2005) in-row tillage after compaction. Significant yield reductions of 17% in 3 years were observed for compaction with road tires compared with control (no-tillage without compaction). Compaction with flotation tires reduced yield significantly in the first year only. Yield reductions due to compaction disappeared after 1 year. Deep tillage after compaction increased yield (17%) in the first year, whereas shallow tillage did not affect yield. Deep tillage and no-tillage showed similar yields in the first 3 years, but no-tillage had higher yield in the next year. It was found that little need for in-row tillage to manage compaction in long-term of no-tillage when axle loads are less than 10 Mg and flotation tires with inflation pressure of less than 250 kPa were used. Martínez et al. [31] found Mediterranean climate region are characterized by highly degraded and compacted soils in Chile, which require the use of conservation tillage systems to mitigate water erosion. An oat and wheat crop rotation was established under the following conservation systems: no tillage (Nt), Nt + contour plowing (Nt + Cp), Nt + barrier hedge (Nt + Bh) and Nt + subsoiling (Nt + Sb), compared to conventional tillage (Ct) to evaluate their influence on soil water content (SWC) in the profile (10–110 cm depth), the soil compaction and their interaction with the crop yield. Experimental were established in 2007 and lasted 3 years until 2009 in a compacted Alfisol. Soil water content had a significant (p < 0.05) interaction with tillage system and depth; Nt + Sb showed lower SWC between 10 and 30 cm, but higher and similar to the rest between 50 and 110 cm except for Ct. No tillage + subsoiling reduced soil compaction and had a significant increment of grain yield. These findings show us that the choice of conservation tillage in compacted soils of the Mediterranean region needs to improve soil structure to obtain higher yields.
The objective of these tests was to evaluate the effect of different drive systems of tractors (four-wheel drive, rear-wheel drive and front-wheel drive) on soil compaction at different depths. Additionally, the effects of soil condition and machine operating factors on soil deformation in three orientations of the transducers of longitudinal, transverse and vertical orient were investigated.
2. Materials and Methods
Experiments were carried out in a loamy soil with sand, silt, clay and organic matter content of 46%, 29%, 25% and 0.29% respectively. The soil structure was granular. A four wheel drive (4WD) Goldoni model 240 tractor equipped with single front and rear tires was used for conducting tests (Figure 1), and technical characteristics are presented in Table 1.
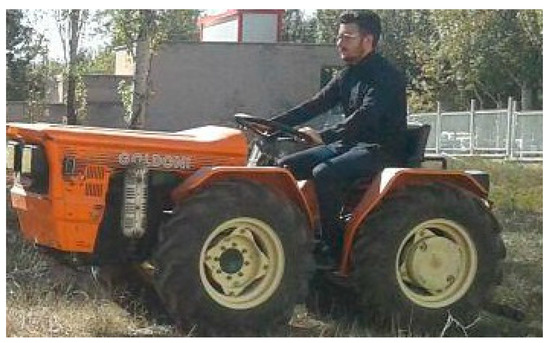
Figure 1.
A four wheel drive (4WD) Goldoni model 240 tractor.

Table 1.
Tractor characteristics.
In four-wheel drive tractors, unlike two-wheel drive tractors, to achieve the best pulling performance and to reach the maximum tire’s draft capacity the tractor’s weight should be distributed equally on both axles. The static weight on the front and rear axle of the tractor was 6.92 kN and 3.53 kN, respectively. However, during pulling operations, the dynamic weight on the tires was the important factor. The dynamic weight on the axle is the total of static weight on the axle and the transferred weight due to the application of the draft force computed by Equations (1) and (2) [32].
where:
- = the static load on rear tires, N;
- = the drawbar height, m;
- = the wheel base, m;
- Wdf = the dynamic load on rear tires, N;
- = the static load on front tires, N;
- Wdr = the dynamic load on front tires, N;
- P = draft, N.
According to the transferred weight during tests, the calculated dynamic weight percentage on the front and rear axle of the tractor was 48 and 52 percent, respectively (Table 1).
It was equipped with 7.5R-16 Goodyear agricultural tires, which were almost new. The front and rear differential of tractor were disabled in turn for related experiments, so that the tractor could operate as front- or rear-wheel drive. A fuel tanker was hitched to drawbar of the tractor to create a pull of 8 kN. The tanker equipped with two driven tires without power and pulled by the tractor. It was not equipped with separate brakes and stopped together with the tractor. To prevent the effect of braking on the soil compaction, hence it braked after passing the test plot. Additionally, the tractor-tanker was driven about 20 m ahead of test plot so that the velocity and draft on pulling toolbar stabilized, in addition the draft value checked in all test and no significant variation was observed.
The experiments were conducted in a completely randomized design with three replications. To create a homogenous environment and also to exclude the effect of crop residue the field was tilled by a moldboard plow before experiments and the soil was quite loose. The treatments included different tractor forward speeds of 1.26, 3.96 and 6.78 km/h, tire inflation pressures of 170, 200 and 230 kPa, soil moisture content values of 10, 15 and 20% (d.b.) and three drive systems of tractor (four-wheel drive, rear-wheel drive and front-wheel drive). Soil compaction was evaluated in the depth of 10, 20, 30 and 40 cm relative to the untrafficked soil surface. To investigate tire inflation pressure 3 inflation pressure values of 170, 200 and 230 kPa were selected. Inflation pressure of 200 kPa was the standard pressure recommended by a manufacturer manual, which is applicable in standard tire’s dynamic load to achieve maximum tire life and optimum pulling draft. Recommended pressure did not consider soil compaction, hence to find an inflation pressure effect on the soil compaction overinflated value of 230 kPa and underinflated value of 170 kPa were studied.
In order to compare compaction caused by different treatments, changes in bulk density was used as a benchmark of comparisons. In order to obtain soil bulk density, soil samples from different depths were taken by using standard cylinders (diameter 5 cm × height 5 cm) and after drying in an oven soil bulk density and soil moisture were determined. To evaluate the accuracy of the values obtained from the cylinder samples, three displacement sensors were placed in the horizontal, lateral and vertical direction, along a sampling path the distance of transducers midpoint from soil surface was 30 cm. The distance between vertical transducers’ endplates was 210 mm and lateral and longitudinal ones were 170 mm in an extended position (Figure 2). The path of the tires that trafficked over the transducers was directly above the initial center of each transducer.
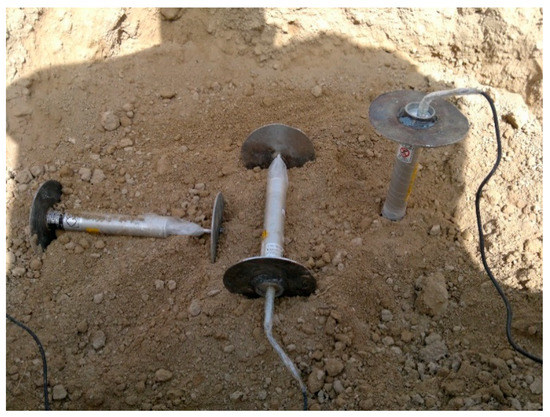
Figure 2.
Placement of strain transducers including endplates inside the soil profile in longitudinal, lateral and vertical directions.
To measure soil displacement, three displacement transducers with linear variation (model DHL-A-70), sensitivity of 3.64 mV/V and a maximum capacity of 70 mm were used. Two plates were connected at the end points of the transducer to transfer soil forces to the transducer to measure soil displacement accurately. Data was recorded to a laptop via a data logger. Initial bulk density of the loose soil was measured by cylindrical cores and was 1102 kg/m3. To determine the changes in soil density using the displacement transducers, the mass of soil located inside an imaginary cube with dimensions consistent with the three transducers was calculated from Equation (3).
where
- m = soil mass, kg.
- = initial soil density, kg/m3.
- = initial length of longitudinal transducer, m.
- = initial length of lateral transducer, m.
- = initial length of vertical transducer, m.
A constant mass of soil between the end plates installed on the displacement gauges was assumed, final soil density was computed from Equation (4).
where:
- = final soil density, kg/m3.
- = final length of longitudinal transducer, m.
- = final length of lateral transducer, m.
- = final length of vertical transducer, m.
All of the tests were performed in a pit with dimensions of 3 m long, 1 m deep and 1.5 m wide. To maintain uniformity in testing and prevent errors caused by variations in soil texture after each test, after each test, the soil was removed from the pit and was sieved to eliminate compaction caused by previous tests and return to it’s original density at the beginning of the test. To reach the required soil moisture by weighing water spray at different times of mixing operation the required water was sprayed on the soil during mixing and then was filled into the pit again. To prevent moisture evaporation, all tests were related to a determined value of moisture were conducted consecutively at a definite time period in a day. Additionally temperature was 17–20 °C and the soil surface kept covered with a plastic sheet to minimize soil moisture loss when we were not working on that particular part of the soil, hence no significant evaporation was observed. Finally, obtained data were analyzed using Minitab version 16.2 statistical software (Minitab, Inc., State College, PA, USA). Additionally, mean comparisons were performed based on the Tukey method using Minitab software (post-hoc test).
3. Results
The analysis of variance results of soil compaction are presented in Table 2. The results indicated that all of the main effects and two-way interaction effects of experimental factors were significant at a probability level of 1%. According to the analysis of variance three-way interaction effects of moisture × depth × speed, moisture × speed × motion system and motion system × inflation pressure × speed were significant at 1%. Among four-way interactions effects only the effect of moisture × depth × motion system× inflation pressure was significant at 1%. According to the results, five-way interaction effects of factors were not significant.
Table 2.
ANOVA statistics for the effect of moisture, speed, inflation pressure, motion system and depth on soil density.
Due to the large number of main and interaction effects of parameters we attempted to investigate the effect of the tractor drive system and its interaction with other parameters based on the hypothesis of the study that they have high influence on soil compaction.
3.1. The Main Effects
According to the F value obtained from Table 2 the most effective factors on soil compaction were depth, driving system type, soil moisture, tractor speed and tire inflation pressure. Soil compaction is reduced with increasing depth, which has also been reported in the work of other researchers [33]. By changing the drive system significant changes in soil compaction occurred, the lowest and highest compaction were respectively corresponding to 4WD and front-wheel drive (FWD) systems (Figure 3). The similar trend has been reported by Botta [23].
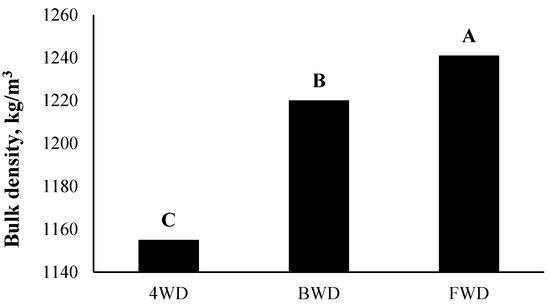
Figure 3.
Changes in bulk density due to changes in the drive system (different letters shows significant difference between treatments).
3.2. The Two-Ways Effects
Among the two-way effects, the most important was interaction between drive system and depth. Figure 4 shows that the impact of the drive system on soil compaction decreased with increasing depth and in a depth of 40 cm all three drive systems produced densities that are close together whereas at the depth of 20 cm, there was a noticeable difference between the 4WD system and the other two systems. The reason for this could be stress that wheels apply to the surface soil but the rate of transmission of the stress to the subsoil is negligible. Maximum soil density of 1331.5 kg/m3 occurred at the depth of 20 cm for the FWD system while it declined to 1190 kg/m3 at the same depth for the 4WD system.
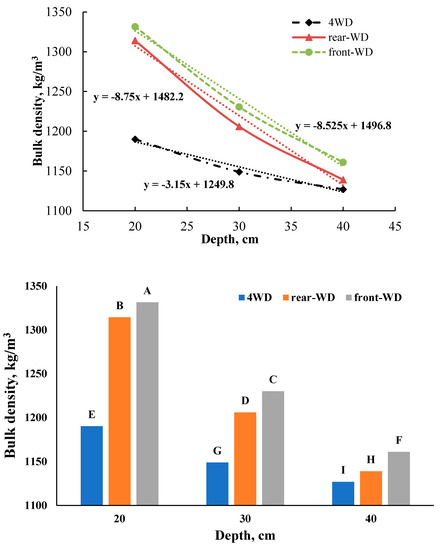
Figure 4.
Effects of the drive system on soil compaction at three depths and depths here are depths from the untrafficked soil surface to the centers of the soil cores (different letters shows significant difference between treatments).
The interaction between the drive systems and soil moisture is shown in Figure 5. For all three drive systems soil compaction increased with increasing soil moisture. Maximum compaction occurred at a moisture of 20% (d.b.), which was below the proctor density moisture content of 22% (d.b.) determined by the standard proctor test. The important point is there is large difference between the 4WD system and the other two systems. In terms of moisture range it can be concluded for all agricultural operations using the 4WD system will reduce soil compaction significantly in comparison to the other systems.
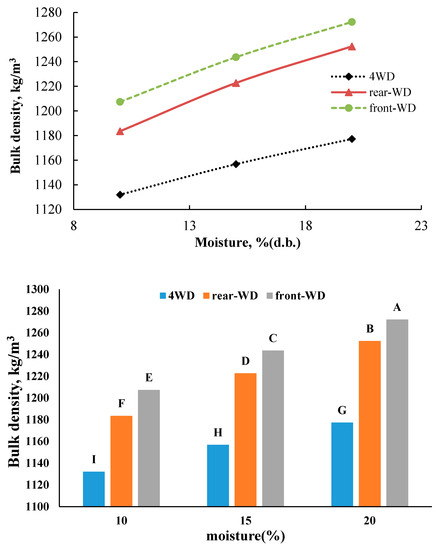
Figure 5.
Effects of the drive system on soil compaction at three soil moisture contents cores (different letters shows significant difference between treatments).
Figure 6 shows that with increasing travel speed in all three drive systems soil compaction decreased linearly. In all speeds the 4WD system created the lowest bulk density and the FWD system imposed the highest density that reflects the advantage of 4WD systems in creation of compaction in the soil. Minimum soil density of 1109 kg/m3 was occurred at the forward velocity of 6.8 km/h for the 4WD system, while it was increased to 1192 kg/m3 at this velocity when the FWD system was used, resulting in a 7.5% decrement in soil density.
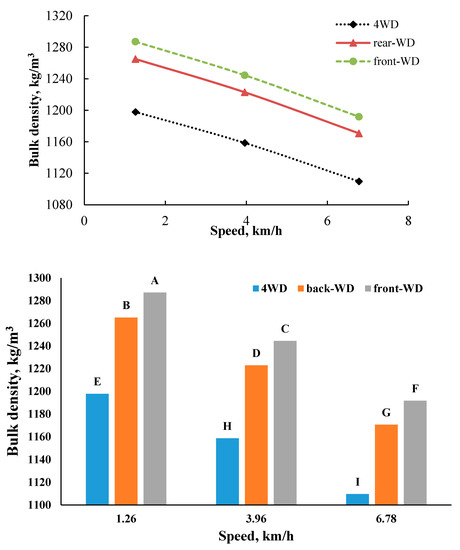
Figure 6.
Effects of the drive system on soil compaction at three tractor forward speeds (different letters shows significant difference between treatments).
Finally the two-way effect of the drive system and tire inflation pressure on soil compaction was investigated (Figure 7). For all drive systems soil compaction was increased linearly with tire inflation pressure. The difference between the 4WD system and two other systems was very high. The highest soil density of 1261 kg/m3 was occurred at inflation pressure of 180 kPa and soil density dropped to 1172 kg/m3 as the 4WD system was used, resulting in a compaction decrement of 4.4%. This difference between the systems was constant at all pressures.
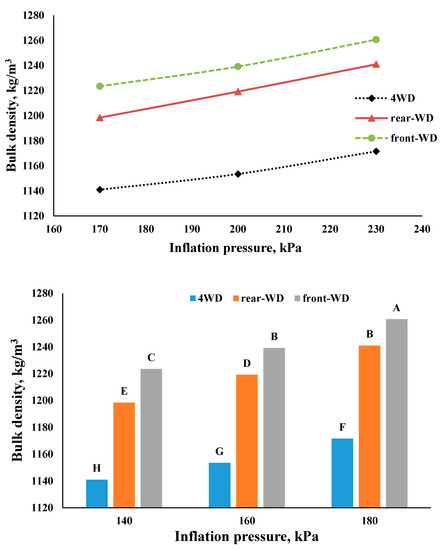
Figure 7.
Effects of the drive system on soil compaction at three tire inflation pressures (different letters shows significant difference between treatments).
3.3. The Three-Way Interaction Effect of Parameters
The most important triplet interaction effect in this study was the interaction between drive systems × depth × moisture. The mutual binary effect of drive system and depth showed that the effect of the drive system declined by increasing depth. According to Figure 8 the compaction in the subsoil increased with increasing moisture. The triplet effect of inflation pressure × depth × moisture showed a similar trend. To achieve a clearer understanding of these effects the best fitted equation of the curves together with the slope of the curves at all depths are presented in Table 3 and Table 4. Changes of in curve slope in higher moisture was less and so the effect of the drive system was transferred to the subsoil but changes of the curve slope in lower moisture were high and practically all the curves of drive systems were close to each other in subsoil and this showed that the effect of the drive system diminished. According to Figure 8, at a moisture content of 10% and depth of 20 cm, the difference in bulk density between the drive systems was 10.2%, while with a depth increase to 40 cm, this difference decreased to 2.2%. This trend shows that increasing the depth reduced the effect of the drive system. According to Figure 8, at a moisture content of 20% and depth of 20 cm the difference in bulk density between the drive systems was 11.2% and with a depth increment of 40 cm, this difference decreased to 3.9%. Then it can be concluded that the effect of increasing the depth on reducing the effect of the drive system at a moisture content of 10% was greater than at a moisture content of 20%. Figure 8 shows at a depth of 20 cm, the change in the drive system indicated a greater effect on bulk density than the increment of moisture content (black arrows). In contrast, at the depth of 40 cm, increasing moisture content showed a greater effect on bulk density than changing the drive system (green arrows). By a careful review of Figure 9 and Table 4 it can be realized that in low inflation pressure, moisture changes had a negligible impact on the bulk density of topsoil. The effect of moisture changes in subsoil is highlighted and a considerable difference in the bulk density of the soil appeared. However, when inflation pressure was higher than the recommended limits, also significant differences in the bulk density of the soil arose in topsoil as a result of moisture changes. Figure 9 indicates that at the depth of 20 cm and a moisture content of 10% with increasing inflation pressure from 170 to 230 kPa bulk density increased by 3.9%, also at a depth of 40 cm and moisture content of 10% with increasing inflation pressure at the same range bulk density increase was 1%. Therefore, it can be concluded that with increasing depth, the effect of inflation pressure was reduced. At a depth of 20 cm and moisture content of 20%, the bulk density increment due to inflation pressure increase was 6%. Finally at the depth of 40 cm and moisture content of 20%, with increasing inflation pressure from 170 to 230 kPa, the bulk density increased was 3%. Then, it was concluded that the effect of increasing the depth on the reduction of the inflation pressure effect at moisture content of 10% was more than a moisture content of 20%. Figure 9 shows at a depth of 20 cm, the increase in tire inflation pressure showed a greater effect on bulk density than the moisture content increment change (green arrows). In contrast, at the depth of 40 cm, increasing moisture content indicated a greater effect on bulk density than increasing inflation pressure (black arrows).
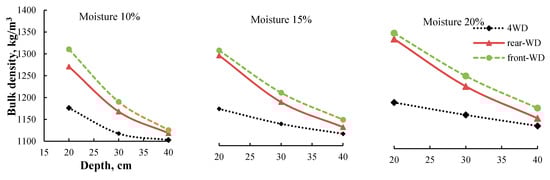
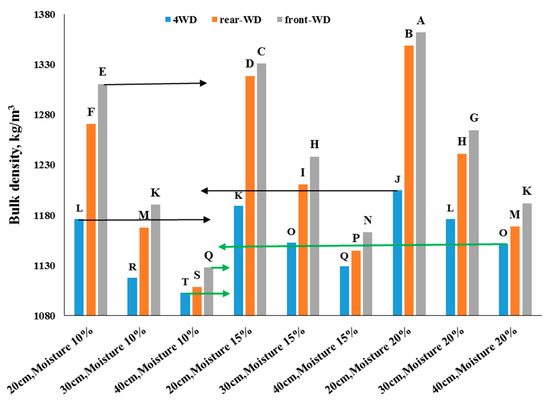
Figure 8.
Changes of bulk density relative to the depth, moisture (d.b.) and driving system type. (different letters shows significant difference between treatments).
Table 3.
Equations that fitted the curve bulk density relative to the depth, moisture (d.b.) and driving system type (the slope is obtained using a derivation).
Table 4.
Equations that fitted the curve bulk density relative to the depth, moisture (d.b.) and inflation pressure.
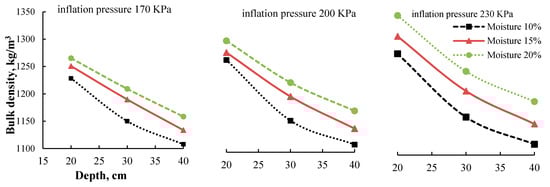
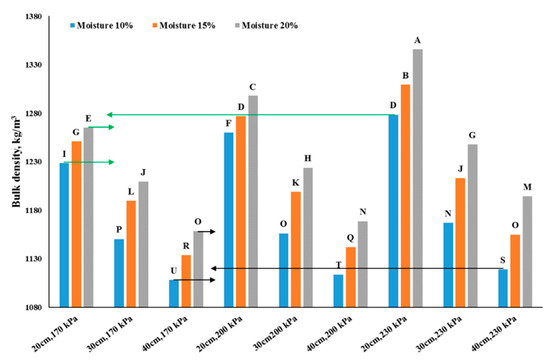
Figure 9.
Changes of bulk density relative to the depth, moisture (d.b.) and inflation pressure (different letters shows significant difference between treatments).
3.4. Soil Behavior in Three Coordinate Directions under the Tractor Wheels
In order to more accurately illustrate the causes of soil compaction as a result of applied treatments, soil displacement variation curves measured by transducers were drawn. Curves were drawn in such a way that their starting point are one meter before reaching the front wheel center to the position of sensors and the end point of the curve are after the complete pass of the rear wheel through the sensor as soil displacement reached to a stable condition. Figure 10 shows soil displacement in the vertical (z) for three cases of 4WD, RWD and FWD drive systems. By comparing and more accurately surveying these curves a clear understanding of the causes of differences in created compaction in different cases can be reached. In the case of the 4WD system in which wheel slip was less than others conditions during the front tire pass the large soil displacement of 34 mm took place and when passing the rear wheel since the soil has been compacted already due to front wheel pass and the rear wheel movement on a firm surface, since the rate of slip was low and only little displacement of 2 mm occurred in the soil. In the case of RWD the soft soil is displaced and compacted by passing the front wheel, which is non-slip, but the value of the soil displacement was 30 mm, which was less than the 4WD system in which the front wheel included more slip. When the rear wheel passes over the sensor, which has more slip than the rear wheel of the 4WD mode, a more severe displacement of 14 mm happened in the soil and the final compaction caused by passing both wheels in this case was greater than in the 4WD mode. The mode of FWD had more slip relative to the previous modes because the drive wheel was in contact with the soft soil, therefore a high displacement of 54 mm occurred and left a profound influence on soil compaction, after passing the front wheel, with passing the rear tire a particular displacement did not occur in the soil that is non-slip, however a total of displacement created in this case was more than both of the previous modes.
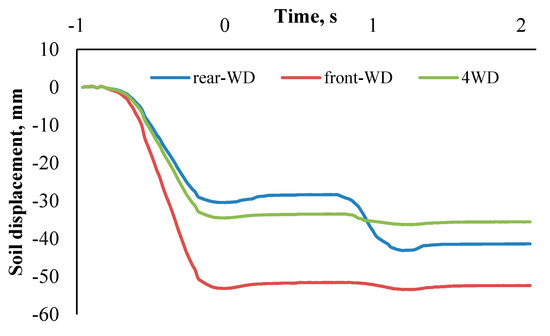
Figure 10.
Soil strain along the vertical (z) direction.
Figure 11 shows the lateral displacement of soil for three drive system modes. In the case of 4WD with approaching the front tire to the transducer axis, its displacement started uniformly, with more approach of the front tire it stayed at a constant value of 5 mm, until the rear tire approached the transducer and the soil extended uniformly again and stayed constant for the rest of time. The RWD system almost showed a similar trend to the 4WD drive system. However its displacement was 1 mm less than the 4WD system in the first stage in which the front tire approached the transducer and soil reaction was more to the rear tire and it elongated about 6 mm as the rear tire was on the transducer axis. In general soil extension in the RWD system was 3 mm more than the 4WD system. For the FDW system maximum soil extension of 12 mm occurred as the front tire was on top of the transducer and rear wheel effect was negligible. Its lateral displacement was more than two other systems.
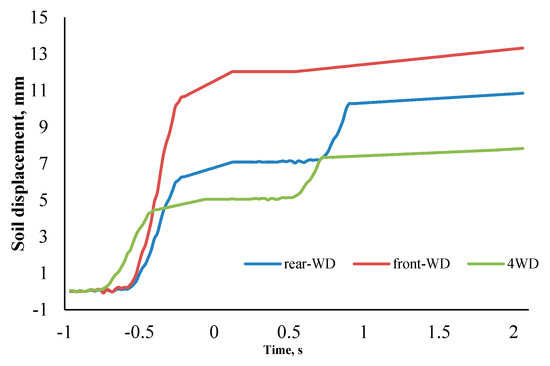
Figure 11.
Soil strain along the lateral (y) direction.
Figure 12 shows longitudinal soil displacement for different driving systems. For the 4WD mode by approaching the front tire soil compressed and as the tire center was close to the related sensor, it started extending and the maximum extension was when the tire center was on top of the sensor. After passing the front tire soil extension ended at that moment the rear wheel was approaching the sensor, hence it started compression again and because soil was compacted by the front tire already therefore rear tire compression was a little less than the front tire. Again when the rear wheel center was quite close to the sensor it was elongated and when the rear wheel center was on top of the sensor maximum elongation occurred. After passing the tire it was compressed again and then stayed constant for the rest of time. In the RWD system the soil reaction relative to the front tire was similar to 4WD except that it was 1 mm less than the 4WD system due to lower slippage and soil engagement. However, soil compression by approaching the rear wheel was a high value of 10 mm. When the rear tire was on top of the transducer the soil elongated and after passing the tire it was compressed again and leveled off. The point should be mentioned that there was a phase lag between the 4WD and RWD system curves related to the rear tires. It was because of the rear tire slippage of 21% in the RWD system. Hence the soil displacement curve was delayed relative to the 4WD system, which average slippage was 14%. This delay also can be seen in Figure 10.
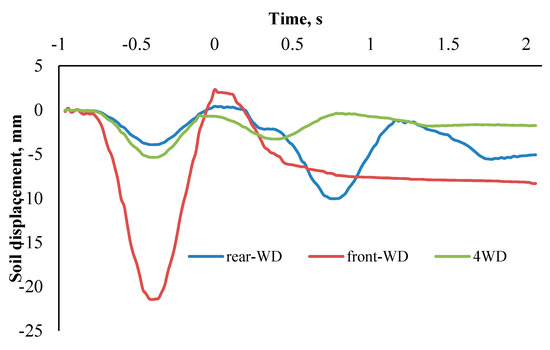
Figure 12.
Soil displacement along the longitudinal (x) direction.
In the case of the FWD system by approaching the front wheel, which was the sole drive tire that included more slippage of 24% and had more engagement with the loose soil and as a result a more dynamic load was on that, more soil compression was created in comparison to the 4WD mode. Additionally, more soil elongation was observed relative to the 4WD case when the front tire was on the sensor. The rear wheel did not show any significant effect on longitudinal soil displacement.
It appears an interesting issue with comparing soil displacement in vertical direction curves (Figure 13) that correspond to the mode of FWD in soil moisture of 10% and 20%, respectively. At a moisture content of 10% after passing each wheel over the soil, the soil returned a few millimeters upward and thus the resulted soil compaction reduced, but at a moisture content of 20% soil recursion did not occur because soil particles stick to together due to the presence of moisture and causes the soil layers to remain constant in their places.
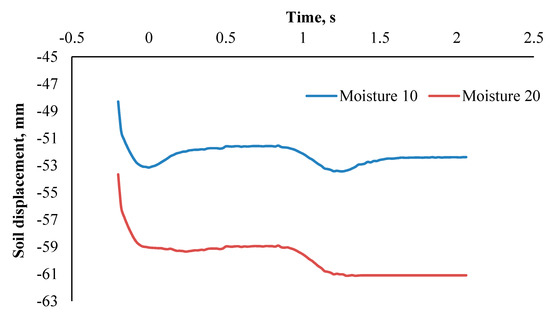
Figure 13.
Soil displacement along the vertical (z) directions in mode of FWD at different soil moisture contents (d.b).
4. Discussion
Increasing compaction by changing the driving system can be attributed to the different slippage level in each of these systems. The 4WD system included the lowest slippage of 14%, which was less than two other systems, hence a minimum bulk density of 1155 kg/m3 was generated in this system [34]. On the other hand, due to the movement of the drive wheels on the undisturbed soil in the mode of FWD, the slip of the drive wheels in this mode was greater than the rear-wheel drive (RWD) mode. Hence a maximum bulk density of 1241 kg/m3 was generated. A similar result was reported on the soil compaction by Battiato [35] and Raghavan [36]. For all systems with depth increment soil compaction was decreased. Arvidsson [5] reported that the stress was altered by increasing the applied load on the drive wheel and reflects the fact that the force applied on the soil has the greatest impact on compaction in subsoil. In other words the compaction of the topsoil to a large extent depends on the ground pressure but the compaction of the subsoil is related to the applied load on the drive wheel [37]. In all driving systems with travel speed increment soil compaction decreased. This is due to the issue that wheel slip was reduced by increasing speed and loading time on the soil reduced and these two together had a greater impact on the soil compaction decrement. Such a phenomenon was reported by Taghavifar and Mardani [38]. For all drive systems soil compaction was increased linearly with tire inflation pressure. Low tire inflation pressures proved to be very effective in preventing subsoil compaction. Arvidsson and Keller [39] found there was a direct relationship between tire inflation pressure and soil stress at different depths and this was more significant in topsoil layers. Van den Akker [40] showed that compaction and deformations under the low pressure tire were limited to the topsoil, where the bearing capacity was sufficient for bearing inserted pressure. While inserted pressure exceeded the bearing capacity of the topsoil under the tire, then compaction and deformations reaches into the subsoil layers.
Soil compaction increment due to increasing moisture can be attributed to increment adhesion between soil particles, soil particles are pressed together due to applied pressure and the moisture makes their position to be maintained after pressure removal. Increasing the soil moisture under critical values resulted in a high soil compaction because the water in the soil acts as a lubricant. This phenomenon was very important in heavy and cohesive soils in soil compaction increment [40]. Additionally, at a low moisture content of 10% after passing each wheel the soil returned a few millimeters upward and thus the final soil compaction reduced, but at a moisture content of 20% soil recursion did not occur because of an increment of soil cohesion, then the presence of moisture decreases soil recursion after removing inserted pressure. The effect of moisture on the increasing soil compaction and its effect in subsoil compaction in the work of other researchers has been reported [41,42,43].
Maximum soil displacement and soil compaction occurs when the soil is loose and with an increasing number of passes the rate of soil compaction decreases. Soil displacement in the vertical direction showed that in both 4WD and FDW systems the front wheel was passed on loosed soil, then maximum compression occurred after its passage and rear tire effect on the soil compaction was less than the front wheel
5. Conclusions
It was concluded that the 4WD system is the optimum driving system in terms of reducing soil compaction and preventing destroying its destruction. The using this system for conduction heavy duties where slip is high is recommended. For conduction relatively light works with considering energy management using the RWD system is a better option. It was found at all systems soil moisture was very significant in soil compaction. To mange soil compaction in different agricultural operations it is recommended that the operation is conducted at a relatively low tire inflation pressure of less than 250 kPa and optimum moisture with regard to soil texture. Additionally, the interaction of inflation pressure and load on tire should be such that topsoil could have inserted pressure. In case of exceeding pressure to sublayers permanent compaction will occur, which limits crop growing. To eliminate that subsoil must be performed, which require high energy. For proper managing agriculture operations with minimum compaction, conduction of conservative tillage and controlled traffic systems and adding organic materials are recommended. Since existence of organic material are very important in recursion compacted soil to initial situation.
Author Contributions
Conceptualization, G.S.; methodology, A.M.; software, A.M.; validation, Y.A.-G.; formal analysis, A.M. and G.S.; investigation, A.M.; resources, M.A.H.-M.; data curation, Y.A.-G.; writing—original draft preparation, A.M.; writing—review and editing, J.L.H.-H.; supervision, G.S.; project administration, I.H.-M.; funding acquisition, I.H.-M., J.L.H.-H. and M.A.H.-M. All authors have read and agreed to the published version of the manuscript.
Funding
This research received no external funding.
Institutional Review Board Statement
This study does not involve any human or animal testing.
Informed Consent Statement
Written informed consent was obtained from all study participants.
Data Availability Statement
Data available on request due to restrictions.
Acknowledgments
Authors are grateful to the University of Mohaghegh Ardabili, the Autonomous University of Guerrero and National Technological of México/Campus Chilpancingo for supporting this work. This research received no external funding.
Conflicts of Interest
The authors declare no conflict of interest. The funders had no role in the design of the study; in the collection, analyses or interpretation of data; in the writing of the manuscript or in the decision to publish the results.
References
- Keller, T.; Défossez, P.; Weisskopf, P.; Arvidsson, J.; Richard, G. SoilFlex: A model for prediction of soil stresses and soil compaction due to agricultural field traffic including a synthesis of analytical approaches. Soil. Till. Res. 2007, 93, 391–411. [Google Scholar] [CrossRef]
- Zink, A.; Fleige, H.; Horn, R. Load risks of subsoil compaction and depths of stress propagation in arable Luvisols. Soil Sci. Soc. Am. J. 2010, 74, 1733–1742. [Google Scholar] [CrossRef]
- Keller, T.; Sandin, M.; Colombi, T.; Horn, R.; Or, D. Historical increase in agricultural machinery weights enhanced soil stress levels and adversely affected soil functioning. Soil. Till. Res. 2019, 194, 104293. [Google Scholar] [CrossRef]
- Ansorge, D.; Godwin, R.J. The effect of tyres and a rubber track at high axle loads on soil compaction, Part 1: Single axle-studies. Biosyst. Eng. 2007, 115–126. [Google Scholar] [CrossRef]
- Arvidsson, J.; Westlin, H.; Keller, T.; Gilbertsson, M. Rubber track systems for conventional tractors–Effects on soil compaction and traction. Soil. Till. Res. 2011, 117, 103–109. [Google Scholar] [CrossRef]
- Horn, R.; Holthusen, D.; Dorner, J.; Mordhorst, A.; Fleige, H. Scale-dependent soil strengthening processes–what do we need to know and where to head for a sustainable environment? Soil. Till. Res. 2019, 195, 104388. [Google Scholar] [CrossRef]
- De Lima, R.P.; Keller, T.; Giarola, N.B.; Tormena, C.A.; da Silva, A.R.; Rolim, M.M. Measurements and simulations of compaction effects on the least limiting water range of a no-till Oxisol. Arid. Soil Res. Rehabil. 2020, 58, 62–72. [Google Scholar]
- Barik, K.; Aksakal, E.L.; Islam, K.R.; Sari, S.; Angin, I. Spatial variability in soil compaction properties associated with field traffic operations. Catena 2014, 120, 122–133. [Google Scholar] [CrossRef]
- Veronesi, F.; Corstanje, R.; Mayr, T. Mapping soil compaction in 3D with depth functions. Soil. Till. Res. 2012, 124, 111–118. [Google Scholar] [CrossRef]
- Li, H.; Schindler, C. Analysis of soil compaction and tire mobility with finite element method. Proc. IMechE Part K J. Multi-Body Dyn. 2013, 227, 275–291. [Google Scholar] [CrossRef]
- Håkansson, I.; Reeder, R.C. Subsoil compaction by vehicles with high axle load—Extent, persistence and crop response. Soil. Till. Res. 1994, 29, 277–304. [Google Scholar] [CrossRef]
- De Moura, M.S.; Silva, B.M.; Mota, P.K.; Borghi, E.; de Resende, A.V.; Acuña-Guzman, S.F.; Araújo, G.S.S.; Silva, L.D.C.M.D.; De Oliveira, G.C.; Curi, N. Soil management and diverse crop rotation can mitigate early-stage no-till compaction and improve least limiting water range in a Ferralsol. Agric. Water Manag. 2021, 243, 106523. [Google Scholar] [CrossRef]
- Rabot, E.; Wiesmeier, M.; Schlüter, S.; Vogel, H.J. Soil structure as an indicator of soil functions: A review. Geoderma 2018, 314, 122–137. [Google Scholar] [CrossRef]
- De Moraes, M.T.; Debiasi, H.; Franchini, J.C.; Mastroberti, A.A.; Levien, R.; Leitner, D.; Schnepf, A. Soil compaction impacts soybean root growth in an Oxisol from subtropical Brazil. Soil. Till. Res. 2020, 200, 104611. [Google Scholar] [CrossRef]
- Voorhees, W.B. Long-term effect of subsoil compaction on yield of maize. Adv. Geoecol. 2000, 32, 331–338. [Google Scholar]
- Van den Akker, J.J.H. SOCOMO: A soil compaction model to calculate soil stresses and the subsoil carrying capacity. Soil. Till. Res. 2004, 79, 113–127. [Google Scholar] [CrossRef]
- Bekker, M.G. Theory of Land Locomotion; University of Michigan Press: Ann Arbor, MI, USA, 1956. [Google Scholar]
- Marsili, A.; Servadio, P. Compaction effects of rubber or metal-tracked tractor passes on agricultural soils. Soil. Till. Res. 1996, 37, 37–45. [Google Scholar] [CrossRef]
- Trautner, A.; Arvidsson, J. Subsoil compaction caused by machinery traffic on a Swedish Eutric Cambisol at different soil water contents. Soil. Till. Res. 2003, 73, 107–118. [Google Scholar] [CrossRef]
- Erbach, D.C.; Kinney, G.R.; Wilcox, A.P.; Abo-Abda, A.E. Strain gage to measure soil compaction. Trans. ASAE 1991, 34, 2345–2348. [Google Scholar] [CrossRef]
- De Lima, R.P.; da Silva, A.R.; da Silva, Á.P. Soilphysics: An R package for simulation of soil compaction induced by agricultural field traffic. Soil. Till. Res. 2021, 206, 104824. [Google Scholar] [CrossRef]
- Kinney, G.R.; Erbach, D.C.; Bern, C.J. Soil strain under three tractor configurations. Trans. ASAE 1992, 35, 1135–1139. [Google Scholar] [CrossRef][Green Version]
- Botta, G.F.; Tolon-Becerra, A.; Tourn, M.; Lastra-Bravo, X.; Rivero, D. Agricultural traffic: Motion resistance and soil compaction in relation to tractor design and different soil conditions. Soil. Till. Res. 2012, 120, 92–98. [Google Scholar] [CrossRef]
- Ansorge, D.; Godwin, R.J. The effect of tyres and a rubber track at high axle loads on soil compaction—Part 2: Multi-axle machine studies. Biosyst. Eng. 2008, 99, 338–347. [Google Scholar] [CrossRef]
- Patel, S.K.; Mani, I. Effect of multiple passes of tractor with varying normal load on subsoil compaction. J. Terrramech. 2011, 48, 277–284. [Google Scholar] [CrossRef]
- Shahgholi, G.; Abuali, M. Measuring soil compaction and soil behavior under the tractor tire using strain transducer. J. Terrramech. 2015, 59, 19–25. [Google Scholar] [CrossRef]
- Way, T.; Erbach, D.; Bailey, A.; Burt, E.; Johnson, C. Soil displacement beneath an agricultural tractor drive tire. J. Terrramech. 2005, 42, 35–46. [Google Scholar] [CrossRef]
- McPhee, J.E.; Antille, D.L.; Tullberg, J.N.; Doyle, R.B.; Boersma, M. Managing soil compaction–A choice of low-mass autonomous vehicles or controlled traffic? Biosyst. Eng. 2020, 195, 227–241. [Google Scholar] [CrossRef]
- Sidhu, D.; Duiker, S. Soil Compaction in Conservation Tillage: Crop Impacts. Agronomy J. 2006, 98, 1257–1264. [Google Scholar] [CrossRef]
- Martínez, G.I.; Ovalle, C.; Del Pozo, A.; Uribe, H.; Valderrama, V.N.; Prat, C.; Sandoval, M.; Fernández, F.; Zagal, E. Influence of conservation tillage and soil water content on crop yield in dryland compacted alfisol of central chile. Chil. JAR 2011, 71, 615–622. [Google Scholar] [CrossRef][Green Version]
- Antille, D.L.; Bennett, J.M.; Troy, A.; Jensen, T.A. Soil compaction and controlled traffic considerations in Australian cotton-farming systems. Crop Pasture Sci. 2016, 67, 1–28. [Google Scholar] [CrossRef]
- Liljedahl, J.B.; Turnquist, P.K.; Smith, D.W.; Hoki, M. Tractors and Their Power Units; Wiley: New York, NY, USA, 1979. [Google Scholar]
- Stafford, J.V.; Mattos, P. The effect of forward speed on wheel induced soil compaction: Laboratory simulation and field experiments. J. Agric. Eng. Res. 1981, 26, 333–347. [Google Scholar] [CrossRef]
- Moinfar, A.; Shahgholi, G.; Gilandeh, Y.A.; Gundoshmian, T.M. The effect of the tractor driving system on its performance and fuel consumption. Energy 2020, 202, 117803. [Google Scholar] [CrossRef]
- Battiato, A.; Alaoui, A.; Diserens, E. Impact of Normal and Shear Stresses Due to Wheel Slip on Hydrological Properties of an Agricultural Clay Loam: Experimental and New Computerized Approach. J. Agric. Sci. 2015, 7, 1–19. [Google Scholar] [CrossRef]
- Raghavan, G.S.V.; McKyes, E.; Chase, M. Effect of Wheel Slip on Soil Compaction. J. Agric. Eng. Res. 1977, 22, 79–83. [Google Scholar] [CrossRef]
- Botta, G.G.; Jorajuria, C.D.; Draghi, T.L. Soil compaction during secondary tillage traffic. Agro-Ciencia 1999, 15, 139–144. [Google Scholar]
- Taghavifar, H.; Mardani, A. Effect of velocity, wheel load and multipass on soil compaction. J. Saudi Soc. Agric. Sci. 2014, 13, 57–66. [Google Scholar] [CrossRef]
- Arvidsson, J.; Keller, T. Soil stress as affected by wheel load and tyre inflation pressure. Soil. Till. Res. 2007, 96, 284–291. [Google Scholar] [CrossRef]
- Van den Akker, J.J.H. Prevention of subsoil compaction by defining a maximum wheel load bearing capacity. Soil Compact. Compress. Relat. Sugar Beet Prod. 1998, 1, 43–54. [Google Scholar]
- Ishaq, M.; Hassan, A.; Saeed, M.; Ibrahim, M.; Lal, R. Subsoil compaction effects on crops in Punjab. Pakistan I. Soil physical properties and crop yield. Soil. Till. Res. 2001, 59, 57–65. [Google Scholar] [CrossRef]
- Smith, C.; Johnston, M.; Lorentz, S. Assessing the compaction susceptibility of South African forestry soils. I. The effect of soil type, water content and applied pressure on uni-axial compaction. Soil. Till. Res. 1997, 41, 53–73. [Google Scholar] [CrossRef]
- Saffih-Hdadi, K.; Defossez, P.; Richard, G.; Cui, Y.; Tang, A.; Chaplain, V. A method for predicting soil susceptibility to the compaction of surface layers as a function of water content and bulk density. Soil. Till. Res. 2009, 105, 96–103. [Google Scholar] [CrossRef]
Publisher’s Note: MDPI stays neutral with regard to jurisdictional claims in published maps and institutional affiliations. |
© 2021 by the authors. Licensee MDPI, Basel, Switzerland. This article is an open access article distributed under the terms and conditions of the Creative Commons Attribution (CC BY) license (https://creativecommons.org/licenses/by/4.0/).