Effect of Water Stress on the Physiological Characteristics of Five Basil (Ocimum basilicum L.) Cultivars


Abstract
1. Introduction
2. Materials and Methods
2.1. Study Site
2.2. Genotypes Used in the Study
2.3. Experimental Design and Crop Management
2.4. Dry Herb Yield Determination
2.5. Essential Oil Determination
2.6. Gas-Exchange Measurements
2.7. Chlorophyll Fluorescence
2.8. Chlorophyll Content
2.9. Leaf Temperature
2.10. Water Potential
2.11. Statistical Analysis
3. Results
3.1. Chlorophyll Content
3.2. Leaf Temperature
3.3. Water Potential
3.4. Gas-Exchange Parameters
3.5. Chlorophyll Fluorescence
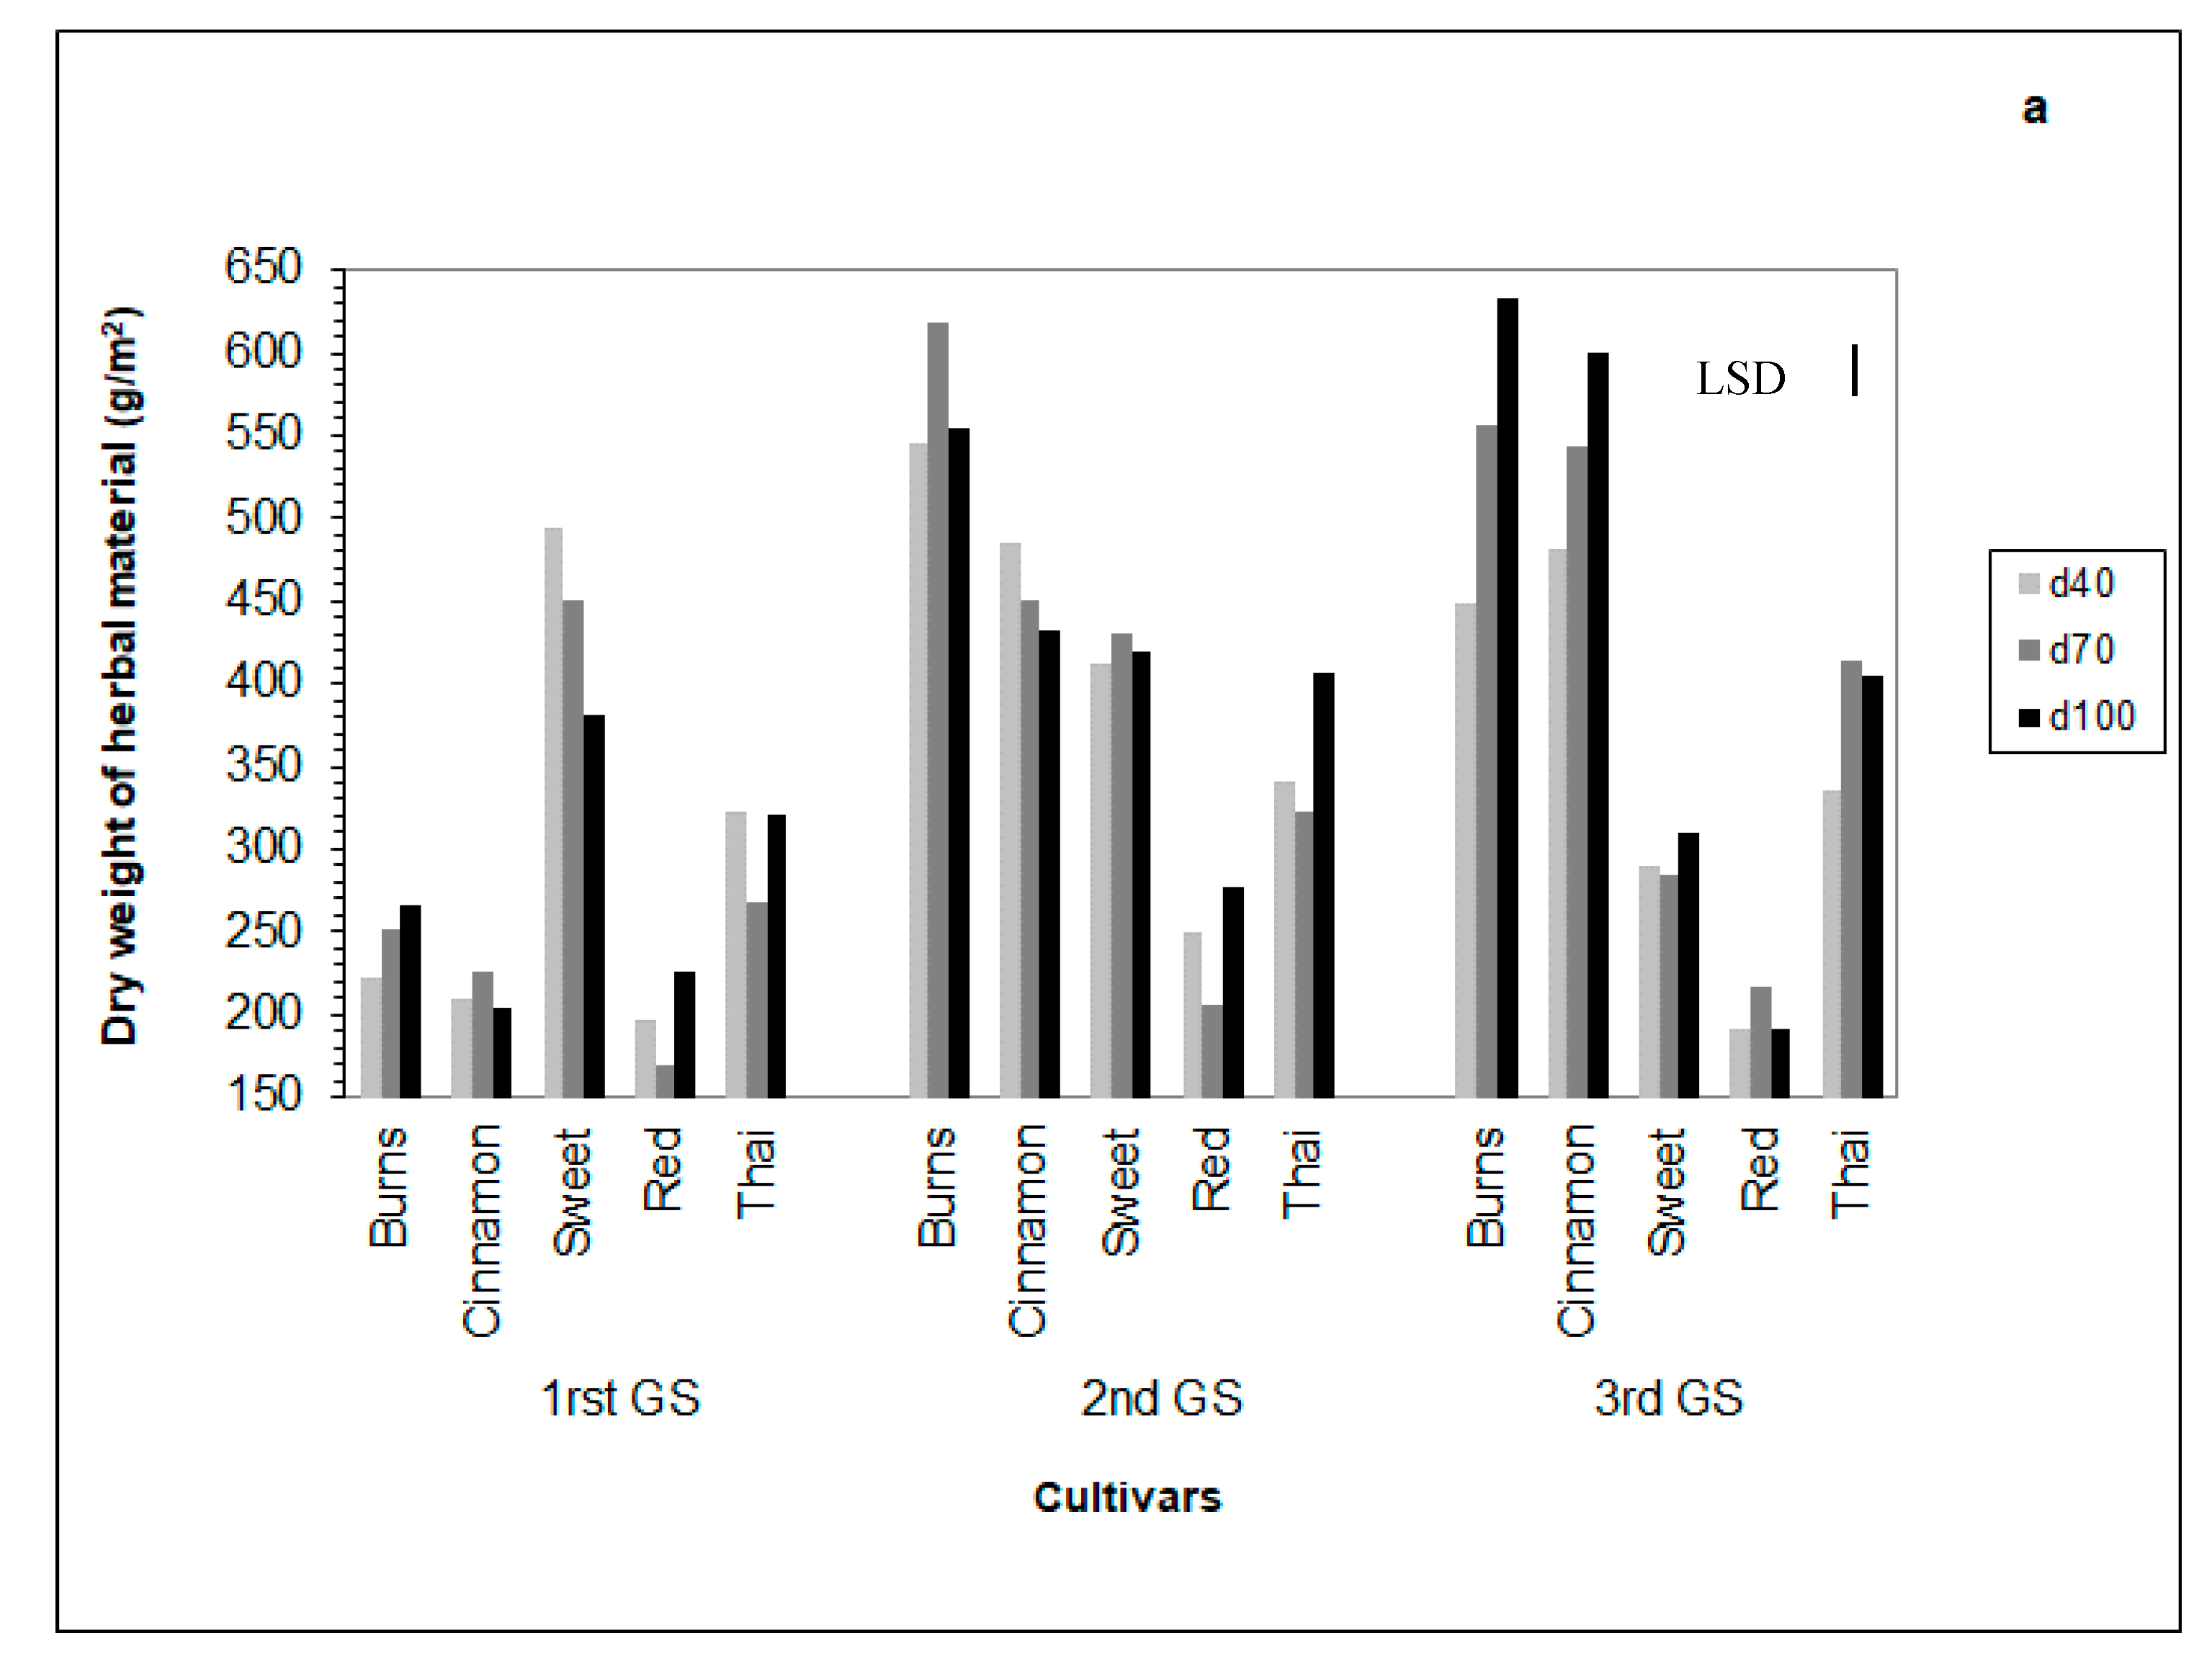
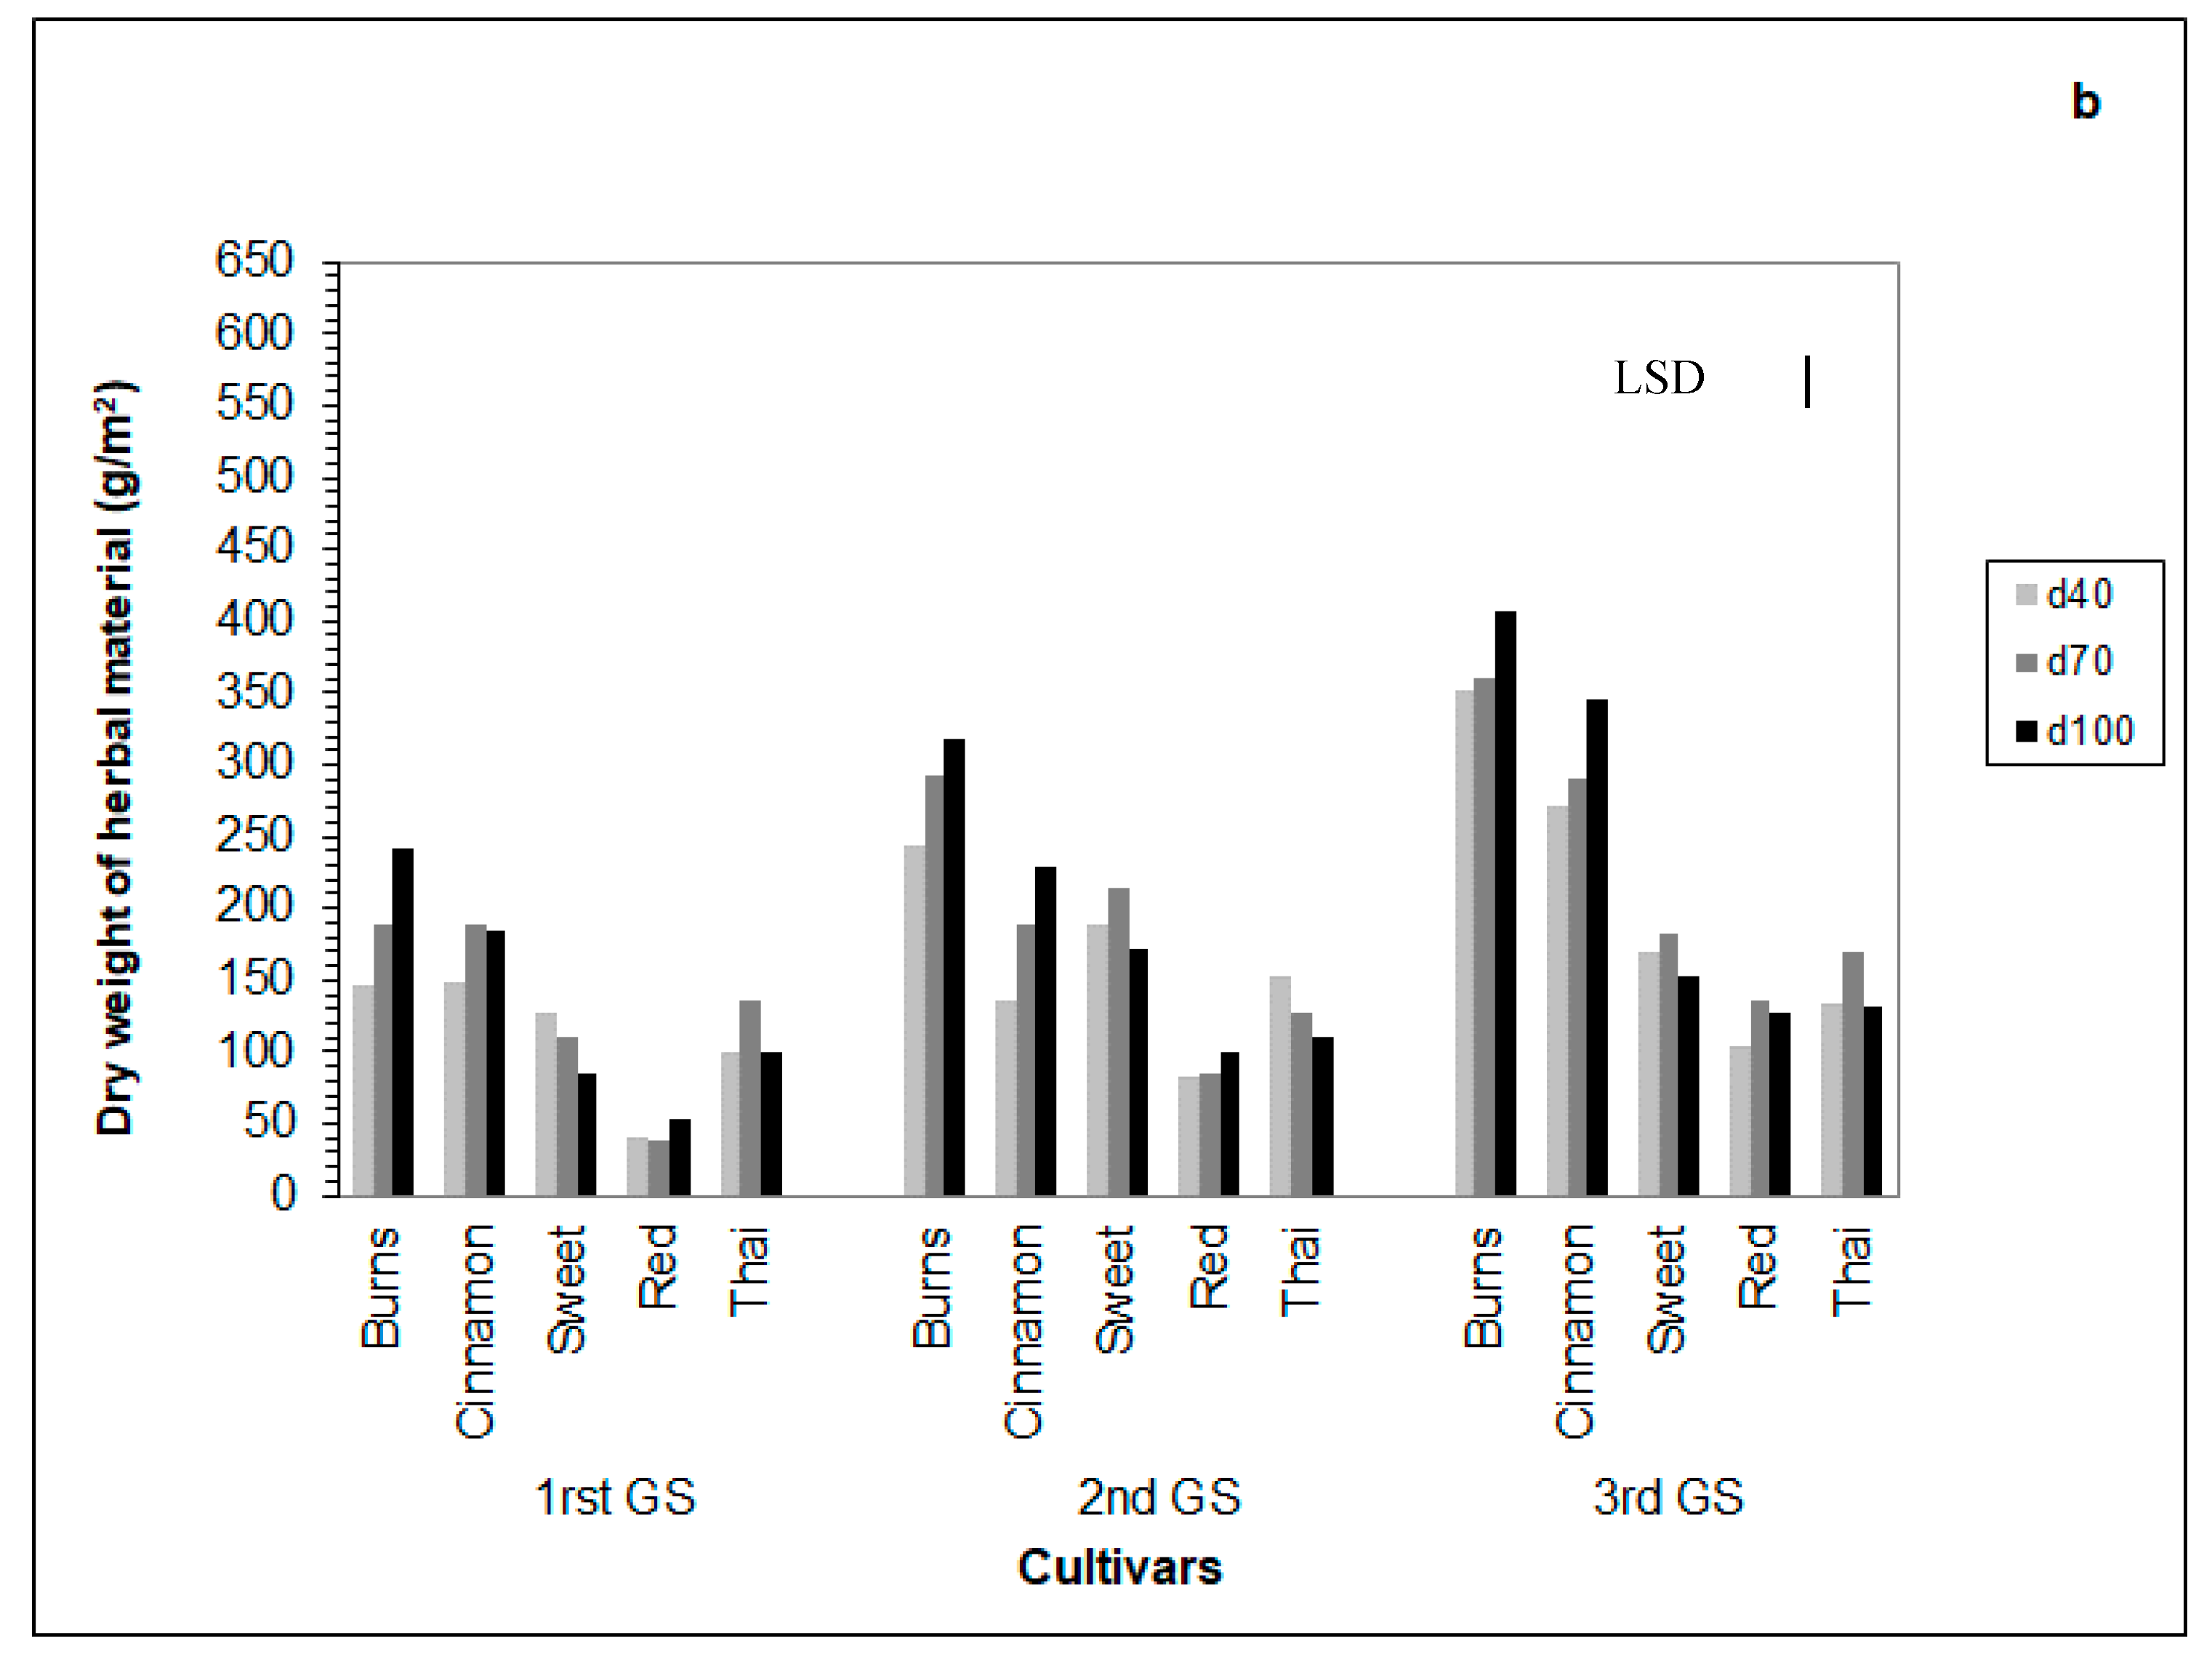
3.6. Dry Herb Yield
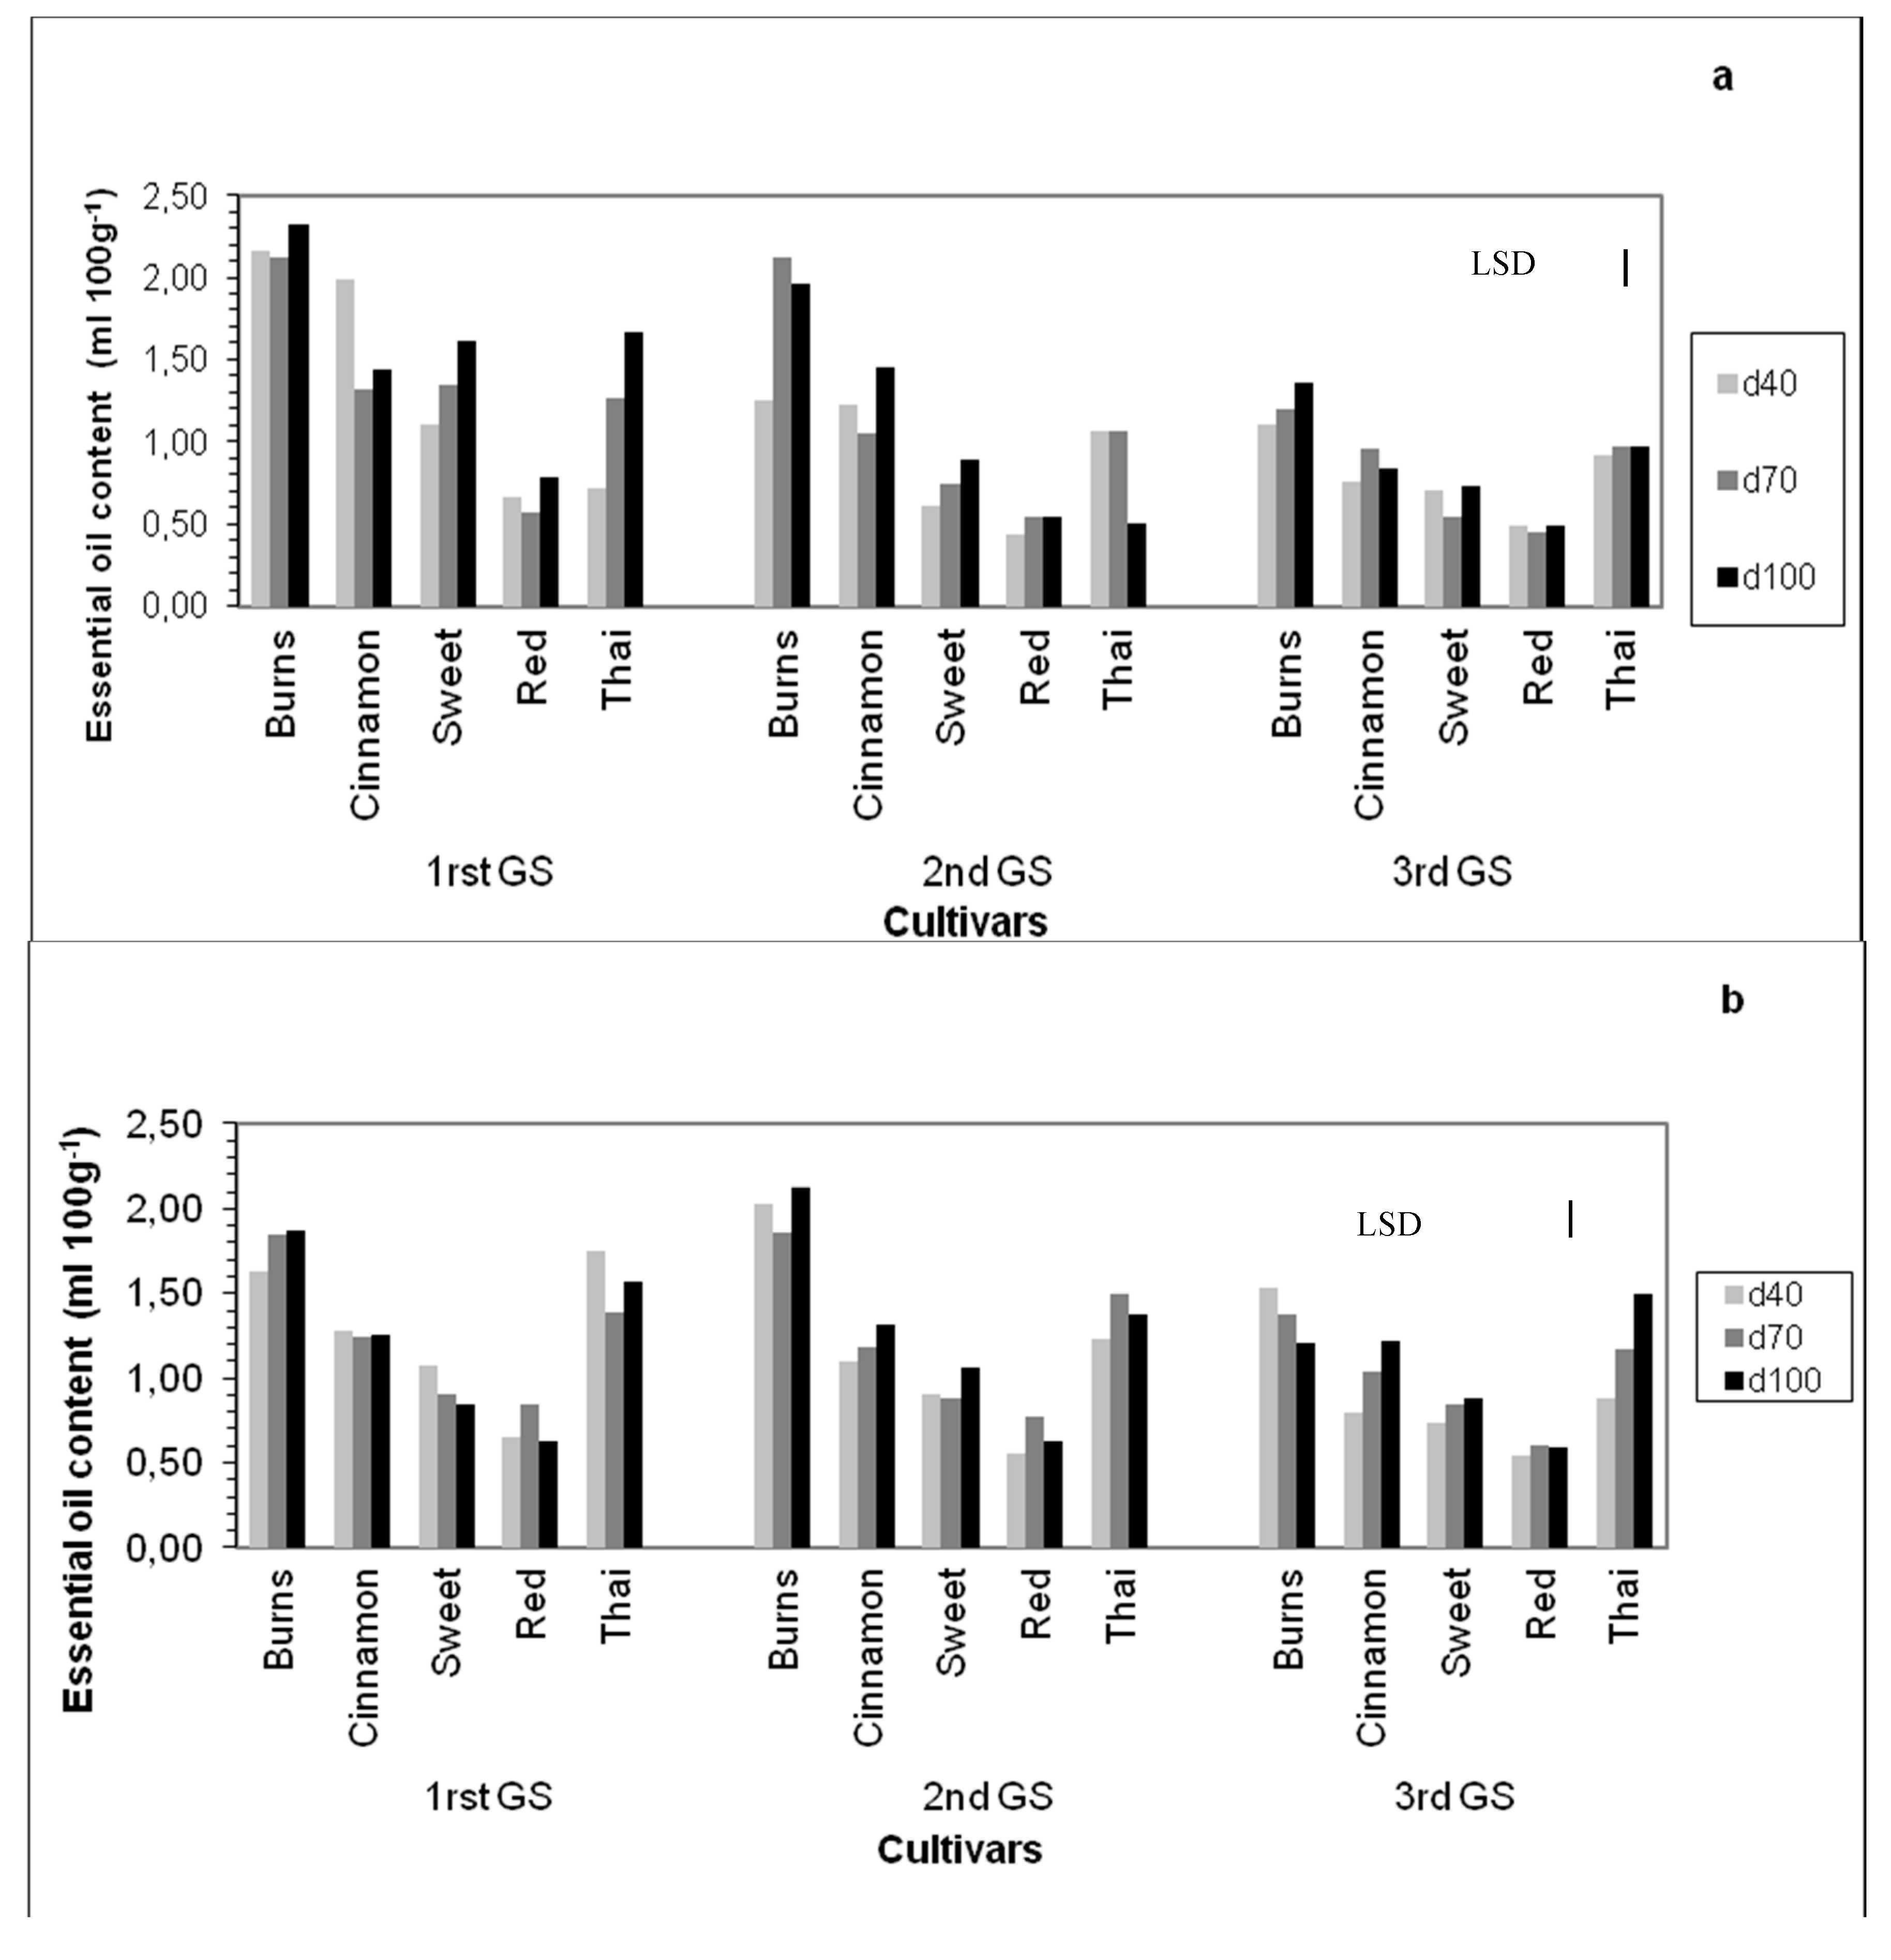
3.7. Essential Oil Content
4. Discussion
4.1. Chlorophyll Content
4.2. Leaf Temperature
4.3. Water Potential
4.4. Gas-Exchange Measurements
4.5. Chlorophyll Fluorescence
4.6. Dry Herb Yield
4.7. Essential Oil Content
5. Conclusions
Author Contributions
Funding
Acknowledgments
Conflicts of Interest
References
- Parry, M.A.J.; Flexas, J.; Medrano, H. Prospects for crop production under drought: Research priorities and future directions. Ann. Appl. Biol. 2005, 147, 211–226. [Google Scholar] [CrossRef]
- Debaeke, P.; Aboudrare, A. Adaptation of crop management to water-limited environments. Europ. J. Agron. 2004, 21, 433–446. [Google Scholar] [CrossRef]
- Jacobsen, S.E.; Jensen, C.R.; Liu, F. Improving crop production in the arid Mediterranean climate. Field Crops Res. 2012, 128, 34–47. [Google Scholar] [CrossRef]
- Blum, A. Plant Breeding for Water-Limited Environments; Springer: New York, NY, USA; Dordrecht, The Netherlands; Heidelberg, Germany; London, UK, 2011; ISBN 978-1-4419-7490-7. [Google Scholar] [CrossRef]
- Kalamartzis, I.; Dordas, C.; Georgiou, P.; Menexes, G. The Use of Appropriate Cultivar of Basil (Ocimum basilicum) Can Increase Water Use Efficiency under Water Stress. Agronomy 2020, 10, 70. [Google Scholar] [CrossRef]
- Darrah, H.H. The Cultivated Basils; Buckeye Printing Company, Independence: St. Louis, MO, USA, 1988. [Google Scholar]
- Simon, J.E.; Quinn, J.; Murray, R.G. Basil: A Source of Essential Oils. In Advances in New Crops; Janick, J., Simon, J.E., Eds.; Timber Press: Portland, OR, USA, 1990; pp. 484–489. [Google Scholar]
- Carovic-Stanko, K.; Liber, Z.; Besendorfer, V.; Javornik, B.; Bohanec, B.; Kolak, I.; Satovic, Z. Genetic relations among basil taxa (Ocimum L.) based on molecular markers, nuclear DNA content, and chromosome number. Plant Syst. Evol. 2010, 285, 13–22. [Google Scholar] [CrossRef]
- Makri, O.; Kintzios, S. Ocimum sp. (basil): Botany, cultivation, pharmaceutical properties, and biotechnology. J. Herbs Spices Med. Plants 2007, 13, 123–150. [Google Scholar] [CrossRef]
- Juliani, H.R.; Simon, J.E. Antioxidant activity of basil. In Trends in New Crops and New Uses; Janic, J., Whipkey, A., Eds.; ASHS Press: Alexandria, VA, USA, 2002; pp. 575–579. [Google Scholar]
- Ekren, S.; Sönmez, C.; Özcakal, E.; Kurttas, Y.S.K.; Bayram, E.; Gürgülü, H. The effect of different irrigation water levels on yield and quality characteristics of purple basil (Ocimum basilicum L.). Agric. Water Manag. 2012, 109, 155–161. [Google Scholar] [CrossRef]
- Yassen, M.; Ram, P.; Anju, Y.; Singh, K. Response of Indian basil (Ocimum basilicum L.) to irrigation and nitrogen schedule in Central Uttar Pradesh. Ann. Plant Physiol. 2003, 17, 177–181. [Google Scholar]
- Omidbaigi, R.; Hassani, A.; Sefidkon, F. Essential oil content and composition of sweet basil (Ocimum basilicum L.) at different irrigation regimes. J. Ess. Oil Bear. Plants 2003, 6, 104–108. [Google Scholar] [CrossRef]
- Singh, M. Effect of nitrogen and irrigation on the yield and quality of sweet basil (Ocimum basilicum L.). J. Spices Aromat. Crops 2003, 11, 151–154. [Google Scholar]
- Khalid, K.A. Influence of water stress on growth, essential oil and chemical composition of herbs (Ocimum sp.). Int. Agrophys. 2006, 20, 289–296. [Google Scholar]
- Asadollahi, A.; Mirza, M.; Abbaszadeh, B.; Azizpour, S.; Keshavarzi, A. Comparison of Essential oil from Leaves and Inflorescence of three Basil (Ocimum basilicum L.). Populations under Drought Stress. Int. J. Agron. Plant Prod. 2013, 4, 2764–2767. [Google Scholar]
- Kulak, M.; Ozkan, A.; Bindak, R. A bibliometric analysis of the essential oil-bearing plants exposed to the water stress: How long way we have come and how much further? Sci. Hortic. 2019, 246, 418–436. [Google Scholar] [CrossRef]
- Brennan, J.P.; Martin, P.J. Returns to investment in new breeding technologies. Euphytica 2007, 157, 337–349. [Google Scholar] [CrossRef]
- Lawlor, D.W. Genetic engineering to improve plant performance under drought: Physiological evaluation of achievements, limitations, and possibilities. J. Exper. Bot. 2013, 64, 83–108. [Google Scholar] [CrossRef] [PubMed]
- Dordas, C.; Papathanasiou, F.; Lithourgidis, A.; Petrevska, J.K.; Papadopoulos, I.; Pankou, C.; Gekas, F.; Ninou, E.; Mylonas, I.; Sistanis, I.; et al. Evaluation of physiological characteristics as selection criteria for drought tolerance in maize inbred lines and their hybrids. Maydica 2018, 63, 1–14. [Google Scholar]
- Ober, E.S.; Le Bloa, M.; Clark, C.J.A.; Royal, A.; Jaggard, K.W.; Pidgeon, J.D. Evaluation of physiological traits as indirect selection criteria for drought tolerance in sugar beet. Field Crops Res. 2005, 91, 231–249. [Google Scholar] [CrossRef]
- Subrahmanyam, D.; Subash, N.; Haris, A.; Sikka, A.K. Influence of water stress on leaf photosynthetic characteristics in wheat cultivars differing in their susceptibility to drought. Photosynthetica 2006, 44, 125–129. [Google Scholar] [CrossRef]
- Khan, H.U.R.; Link, W.; Hocking, T.J.; Stoddard, F.L. Evaluation of physiological traits for improving drought tolerance in faba bean (Vicia faba L.). Plant Soil 2007, 292, 205–217. [Google Scholar] [CrossRef]
- Hura, T.; Grzesiak, S.; Hura, K.; Thiemt, E.; Tokarz, K.; Wędzony, M. Physiological and biochemical tools useful in drought-tolerance detection in genotypes of winter triticale: Accumulation of ferulic acid correlates with drought tolerance. Ann. Bot. 2007, 100, 767–775. [Google Scholar] [CrossRef] [PubMed]
- Tribulato, A.; Toscano, S.; Di Lorenzo, V.; Romano, D. Effects of Water Stress on Gas Exchange, Water Relations and Leaf Structure in Two Ornamental Shrubs in the Mediterranean Area. Agronomy 2019, 9, 381. [Google Scholar] [CrossRef]
- Sánchez-Reinoso, A.D.; Ligarreto-Moreno, G.A.; Restrepo-Díaz, H. Chlorophyll Fluorescence Parameters as an Indicator to Identify Drought Susceptibility in Common Bush Bean. Agronomy 2019, 9, 526. [Google Scholar] [CrossRef]
- Ahmed, H.G.M.-D.; Li, S.M.; Azmat, M.A.; Rizwan, M.; Maqsood, R.H.; Khan, S.H. Selection Criteria for Drought-Tolerant Bread Wheat Genotypes at Seedling Stage. Sustainability 2019, 11, 2584. [Google Scholar] [CrossRef]
- Puglisi, I.; Nicolosi, E.; Vanella, D.; Piero, A.R.L.; Stagno, F.; Saitta, D.; Roccuzzo, G.; Consoli, S.; Baglieri, A. Physiological and Biochemical Responses of Orange Trees to Dierent Deficit Irrigation Regimes. Plants 2019, 10, 423. [Google Scholar]
- Li, R.H.; Guo, P.G.; Baum, M.; Grando, S.; Ceccarelli, S. Evaluation of chlorophyll content and fluorescence parameters as indicators of drought tolerance in barley. Agric. Sci. China 2006, 5, 751–757. [Google Scholar] [CrossRef]
- Fotovat, R.; Valizadeh, M.; Toorchi, M. Association between water-use efficiency components and total chlorophyll content (SPAD) in wheat (Triticum aestivum L.) under well-watered and drought stress conditions. J. Food Agric. Environ. 2007, 5, 225–227. [Google Scholar]
- Silva, M.A.; Jifon, J.L.; Da Silva, J.A.G.; Sharma, V. Use of physiological parameters as fast tools to screen for drought tolerance in sugarcane–Braz. J. Plant Physiol. 2007, 19, 193–201. [Google Scholar]
- Royo, C.; García del Moral, L.F.; Aparicio, N.; Villegas, D.; Casadesús, J.; Araus, J.L. Tools for improving the efficiency of durum wheat selection under Mediterranean conditions. In Seminar on Durum Wheat Improvement in the Mediterranean Region; New Challenges: Zaragoza, Spain, 2000; pp. 63–70. [Google Scholar]
- O’Neill, P.M.; Shanahan, J.F.; Schepers, J.S. Use of chlorophyll fluorescence assessments to differentiate corn hybrid response to variable water conditions. Crop Sci. 2006, 46, 681–687. [Google Scholar] [CrossRef]
- Sayar, R.; Khemira, H.; Kameli, A.; Mosbahi, M. Physiological tests as predictive appreciation for drought tolerance in durum wheat (Triticum durum Desf.). Agron. Res. 2008, 6, 79–90. [Google Scholar]
- Dane, J.H.; Hopmans, J.W. Pressure Plate Extractor. In Methods of Soil Analysis; Dane, J.H., Topp, E.C., Eds.; Part 4: Physical Methods. SSSA Book Series 5; SSSA: Madison, WI, USA, 2002; pp. 688–690. [Google Scholar]
- Karagiannioy, I.; Dordas, C. Evaluation of basil genotypes using physiological and agronomic characteristics. In NAROSSA® 2016. In Proceedings of the Magdeburg, International Conference for Renewable Resources and Plant Biotechnology, Magdeburg, Germany, 13 June 2016. [Google Scholar]
- Allen, R.G.; Pereira, L.S.; Raes, D.; Smith, M. Crop Evapotranspiration-Guidelines for Computing Crop Water Requirements; FAO Irrigation and Drainage Paper 56; FAO: Rome, Italy, 1998. [Google Scholar]
- Ghamarnia, H.; Amirkhani, D.; Arji, I. Basil (Ocimum basilicum L) Water Use, Crop Coefficients and SIMDualKc Model Implementing in a Semi-arid Climate. Int. J. Plant Soil Sci. 2015, 4, 535–547. [Google Scholar] [CrossRef]
- Wichtl, M. Die Pharmakognostichchemische Analys; Band 12. Akademische Verlagsgesellschaft: Frankfurt, Germany, 1971. [Google Scholar]
- von Caemmeter, S.; Farquhar, S. Some relationships between the biochemistry of photosynthesis and the gas exchange of leaves. Planta 1981, 153, 376–387. [Google Scholar] [CrossRef]
- Steel, R.G.D.; Torrie, J.H.; Dickey, D.A. Principles and Procedures of Statistics: A Biometrical Approach, 2nd ed.; McGraw-Hill: New York, NY, USA, 1997. [Google Scholar]
- Gomez, K.; Gomez, A. Statistical Procedures for Agricultural Research; John Willey & Sons, Inc: Singapore, 1984. [Google Scholar]
- Castonguay, Y.; Markhart, A.H. Saturated rates of photosynthesis in water stressed leaves of common bean and tepary bean. Crop. Sci. 1991, 31, 1605–1611. [Google Scholar] [CrossRef]
- Ninou, E.; Tsialtas, J.T.; Dordas, C.A.; Papakosta, D.K. Effect of irrigation on leaf and gas exchange physiology, seed yield and quality of dwarf dry bean (Phaseolus vulgaris L.) grown under Mediterranean conditions. Agric. Water Manag. 2012, 116, 235–241. [Google Scholar] [CrossRef]
- Viera, H.J.; Bergamaschi, H.; Angelocci, L.R.; Libardi, P.L. Performance of two bean cultivars under two water availability regimes. II. Stomatal resistance to vapour diffusion, transpiration flux density and water potential in the plant (in Portugal). Pesqui. Agropeularia Bras. 1991, 9, 1045–1053. [Google Scholar]
- Lawlor, D.W.; Tezara, W. Causes of decreased photosynthetic rate and metabolic capacity in water-deficient leaf cells: A critical evaluation of mechanisms and integration of processes. Ann. Bot. 2009, 103, 561–579. [Google Scholar] [CrossRef] [PubMed]
- Nemeskeri, E.; Helyes, L. Physiological Responses of Selected Vegetable Crop Species to Water Stress. Agronomy 2019, 9, 447. [Google Scholar] [CrossRef]
- Abdul-Hamid, A.F.; Kubota, F.A.; Morokuma, M. Photosynthesis, transpiration, dry matter accumulation and yield performance of mungbean plant in response to water stress. J. Fac. Agric. Kyushu Univ. 1990, 1–2, 81–92. [Google Scholar]
- Chaves, M.M.; Pereira, J.S.; Maroco, J.; Rodrigues, M.L.; Ricardo, C.P.P.; Osório, M.L.; Carvalho, I.; Faria, T.; Pinheiro, C. How plants cope with water stress in the field. Photosynthesis and growth. Ann. Bot. 2002, 89, 907–916. [Google Scholar] [CrossRef]
- Cornic, G.; Fresneau, C. Photosynthetic carbon reduction and carbon oxidation cycles are the main electron sinks for photosystem II activity during a mild drought. Ann. Bot. 2002, 89, 887–894. [Google Scholar] [CrossRef]
- Reddy, A.R.; Chaitanya, K.V.; Vivekanandan, M. Drought induced responses of photosynthesis and antioxidant metabolism in higher plants. J. Plant Physiol. 2004, 161, 1189–1202. [Google Scholar] [CrossRef]
- Rhizopoulou, S.; Diamantoglou, S. Water stress induced diurnal variations in leaf water relations, stomatal conductance, soluble sugars, lipids and essential oil content of Origanum majorana L. J. Hortic. Sci. 1991, 66, 119–125. [Google Scholar] [CrossRef]
- Misra, A.; Srivastava, N.K. Influence of water stress on Japanese mint. J. Herbs. Spices Med. Plants 2000, 7, 51–58. [Google Scholar] [CrossRef]
- Valtcho, D.Z.; Callahan, A.; Cantrell, C.L. Yield and Oil Composition of 38 Basil (Ocimum basilicum L.) Accessions Grown in Mississippi. J. Agric. Food Chem. 2008, 56, 241–245. [Google Scholar]
- Chaves, M.M.; Oliveira, M.M. Mechanisms underlying plant resilience to water deficits: Prospects for water-saving agriculture. J. Exp. Bot. 2004, 55, 2365–2384. [Google Scholar] [CrossRef] [PubMed]
- Lawlor, D.W. Limitation to photosynthesis in water-stressed leaves: Stomata vs. metabolism and the role of ATP. Ann. Bot. 2002, 89, 871–885. [Google Scholar]
- Christensen, C.A.; Feldmann, K.A. Biotechnology approaches to engineering drought tolerant crops. In Advances in Molecular Breeding toward Drought and Salt Tolerant Crops; Jenks, M.A., Hasegawa, P.M., Jain, S.M., Eds.; Springer: Berlin/Heilderberg, Germany, 2007; pp. 333–357. [Google Scholar]


| Mean Temperature (°C) | Rainfall (mm) | |||||
|---|---|---|---|---|---|---|
| Month | 2015 | 2016 | 30 Years Average | 2015 | 2016 | 30 Years Average |
| March | 9.1 | 11.33 | 9.6 | 99.40 | 129.40 | 31 |
| April | 13.5 | 14.56 | 13.9 | 14.40 | 90.00 | 38 |
| May | 20.1 | 19.22 | 19.3 | 19.80 | 73.00 | 44 |
| June | 23.2 | 25.87 | 24.5 | 96.20 | 15.20 | 32 |
| July | 27.5 | 27.85 | 26.7 | 8.20 | 1.20 | 31 |
| August | 27.1 | 27.11 | 26 | 1.08 | 0.83 | 24 |
| Parameters | Growth Stages (S) | Year (Y) | Irrigation (W) | Genotype (G) | G × Y | W × Y | S × Y | G × S | W × S | G × W | G × Y × W | G × W × S | W × Y × S | G × Y × S | G × Y × W × S |
|---|---|---|---|---|---|---|---|---|---|---|---|---|---|---|---|
| Chlorophyll content | *** | *** | NS | *** | *** | NS | *** | *** | NS | ** | NS | NS | NS | NS | NS |
| Chlorophyll Fluorescence | *** | NS | NS | *** | *** | NS | *** | *** | NS | NS | NS | NS | NS | *** | NS |
| Leaf temperature | *** | * | *** | *** | NS | NS | * | *** | * | NS | NS | NS | NS | *** | * |
| Essential oil content | *** | NS | ** | *** | *** | NS | *** | *** | NS | NS | NS | * | NS | * | ** |
| Dry weight of herbal material | *** | *** | ** | *** | *** | NS | *** | *** | NS | NS | NS | NS | NS | *** | NS |
| Water potential | NS | *** | *** | *** | *** | *** | * | NS | *** | ** | ** | NS | *** | NS | * |
| Assimilation rate CO2 (A) | *** | NS | ** | ** | NS | NS | ** | *** | NS | NS | NS | NS | NS | *** | NS |
| Stomatal conductance (gs) | *** | * | *** | *** | *** | ** | *** | NS | NS | NS | NS | NS | NS | NS | NS |
| Evapotranspiration (E) | *** | * | *** | *** | *** | ** | *** | NS | NS | NS | NS | NS | NS | NS | NS |
| Internal leaf CO2 concentration (ci) | *** | ** | NS | *** | ** | NS | *** | *** | NS | NS | NS | NS | NS | *** | * |
| Intrinsic Water use efficiency (WUE A/gs) | *** | NS | ** | *** | *** | NS | *** | *** | * | NS | NS | NS | NS | *** | ** |
| Cultivars | Irrigat. Treatments | Stage | Chlorophyll Content | Leaf Temperature | Water Potential | |||||
|---|---|---|---|---|---|---|---|---|---|---|
| 2015 | 2016 | 2015 | 2016 | 2015 | 2016 | |||||
| Transformed 1 | Actual 2 | Transformed 1 | Actual 2 | |||||||
| Mrs Burns | d40 | 1rst GS | 35.28 | 40.90 | 1.487 | 29.72 | 1.476 | 28.90 | ||
| d70 | 34.23 | 37.28 | 1.481 | 29.28 | 1.457 | 27.66 | ||||
| d100 | 35.10 | 38.15 | 1.485 | 29.58 | 1.453 | 27.38 | ||||
| d40 | 2nd GS | 29.40 | 31.58 | 1.525 | 32.54 | 1.507 | 31.13 | 9.90 | 4.94 | |
| d70 | 29.70 | 33.10 | 1.500 | 30.63 | 1.481 | 29.25 | 4.28 | 2.90 | ||
| d100 | 28.98 | 31.28 | 1.494 | 30.21 | 1.465 | 28.16 | 2.85 | 2.79 | ||
| d40 | 3rd GS | 26.95 | 27.55 | 1.509 | 31.29 | 1.468 | 28.41 | 11.00 | 3.62 | |
| d70 | 27.23 | 26.08 | 1.517 | 31.90 | 1.481 | 29.25 | 5.16 | 3.50 | ||
| d100 | 31.10 | 27.98 | 1.505 | 30.98 | 1.436 | 26.35 | 6.04 | 3.55 | ||
| Cinnamon | d40 | 1rst GS | 41.80 | 47.50 | 1.495 | 30.25 | 1.499 | 30.59 | ||
| d70 | 41.80 | 45.73 | 1.489 | 29.81 | 1.483 | 29.41 | ||||
| d100 | 42.40 | 47.45 | 1.498 | 30.49 | 1.476 | 28.96 | ||||
| d40 | 2nd GS | 38.98 | 43.18 | 1.558 | 35.23 | 1.529 | 32.91 | 15.05 | 4.41 | |
| d70 | 38.47 | 40.55 | 1.509 | 31.33 | 1.501 | 30.73 | 6.67 | 2.83 | ||
| d100 | 35.90 | 39.83 | 1.493 | 30.11 | 1.500 | 30.62 | 3.63 | 3.46 | ||
| d40 | 3rd GS | 34.68 | 39.10 | 1.525 | 32.48 | 1.491 | 30.03 | 10.63 | 3.66 | |
| d70 | 31.78 | 36.63 | 1.513 | 31.60 | 1.471 | 28.60 | 10.62 | 3.79 | ||
| d100 | 34.50 | 36.18 | 1.501 | 30.70 | 1.468 | 28.54 | 7.71 | 4.02 | ||
| Sweet | d40 | 1rst GS | 36.83 | 38.28 | 1.545 | 34.15 | 1.511 | 31.46 | ||
| d70 | 35.08 | 39.33 | 1.515 | 31.75 | 1.502 | 30.75 | ||||
| d100 | 33.95 | 37.85 | 1.484 | 29.48 | 1.530 | 32.98 | ||||
| d40 | 2nd GS | 33.63 | 38.13 | 1.507 | 31.18 | 1.483 | 29.45 | 14.20 | 4.17 | |
| d70 | 26.73 | 34.98 | 1.497 | 30.41 | 1.465 | 28.29 | 6.15 | 2.93 | ||
| d100 | 26.68 | 35.53 | 1.502 | 30.80 | 1.467 | 28.47 | 2.55 | 2.79 | ||
| d40 | 3rd GS | 35.28 | 35.78 | 1.487 | 29.70 | 1.450 | 27.22 | 10.09 | 2.83 | |
| d70 | 30.80 | 36.88 | 1.475 | 28.91 | 1.443 | 26.75 | 10.52 | 2.65 | ||
| d100 | 29.30 | 34.43 | 1.478 | 29.09 | 1.450 | 27.27 | 10.57 | 2.41 | ||
| Red Rubin | d40 | 1rst GS | 40.25 | 40.70 | 1.559 | 35.37 | 1.508 | 31.27 | ||
| d70 | 38.00 | 40.10 | 1.532 | 33.03 | 1.545 | 34.13 | ||||
| d100 | 37.40 | 41.70 | 1.496 | 30.37 | 1.494 | 30.24 | ||||
| d40 | 2nd GS | 27.90 | 40.05 | 1.526 | 32.56 | 1.479 | 29.17 | 9.70 | 3.97 | |
| d70 | 27.63 | 38.50 | 1.521 | 32.24 | 1.468 | 28.42 | 4.15 | 2.70 | ||
| d100 | 30.68 | 40.93 | 1.506 | 31.09 | 1.464 | 28.22 | 1.66 | 3.38 | ||
| d40 | 3rd GS | 34.35 | 34.35 | 1.493 | 30.24 | 1.450 | 27.24 | 2.74 | 2.69 | |
| d70 | 31.68 | 31.68 | 1.491 | 29.98 | 1.459 | 27.82 | 10.15 | 2.82 | ||
| d100 | 34.08 | 34.08 | 1.491 | 30.04 | 1.451 | 27.34 | 2.97 | 2.50 | ||
| Thai | d40 | 1rst GS | 37.00 | 35.55 | 1.554 | 34.93 | 1.463 | 28.06 | ||
| d70 | 35.70 | 41.20 | 1.528 | 32.76 | 1.459 | 27.83 | ||||
| d100 | 35.28 | 40.60 | 1.492 | 30.03 | 1.481 | 29.33 | ||||
| d40 | 2nd GS | 28.83 | 38.30 | 1.513 | 31.62 | 1.500 | 30.80 | 14.67 | 3.27 | |
| d70 | 30.85 | 37.95 | 1.491 | 29.99 | 1.461 | 27.99 | 4.45 | 3.41 | ||
| d100 | 30.48 | 37.75 | 1.479 | 29.1 | 1.464 | 28.24 | 1.61 | 3.10 | ||
| d40 | 3rd GS | 37.48 | 34.35 | 1.485 | 29.69 | 1.459 | 27.84 | 5.81 | 2.67 | |
| d70 | 41.80 | 40.40 | 1.481 | 29.33 | 1.449 | 27.16 | 5.44 | 2.40 | ||
| d100 | 37.03 | 39.43 | 1.473 | 28.77 | 1.456 | 27.61 | 8.25 | 2.30 | ||
| LSD0.05 | 4.78 | 4.78 | 0.031 | 0.031 | 3.47 | 3.47 | ||||
| CV% | 9.5 | 5.1 | 47.2 | |||||||
| Cultivars | Irrigation Treatment | Stage | Stomatal Conductance | Evapotranspiration | Internal Leaf CO2 Concentration | Intrinsic Water Use Efficiency | ||||
|---|---|---|---|---|---|---|---|---|---|---|
| 2015 | 2016 | 2015 | 2016 | 2015 | 2016 | 2015 | 2016 | |||
| Mrs Burns | d40 | Beginning of flowering | 0.47 | 0.15 | 5.07 | 3.57 | 361.97 | 220.47 | 4.36 | 58.94 |
| d70 | 0.34 | 0.15 | 4.90 | 3.06 | 383.35 | 198.64 | 10.84 | 69.34 | ||
| d100 | 0.45 | 0.17 | 5.59 | 3.17 | 357.13 | 207.83 | 13.17 | 60.88 | ||
| d40 | Full bloom | 0.25 | 0.10 | 3.49 | 1.75 | 288.61 | 188.93 | 39.24 | 94.21 | |
| d70 | 0.19 | 0.12 | 3.25 | 2.46 | 264.02 | 248.94 | 47.27 | 77.47 | ||
| d100 | 0.34 | 0.13 | 4.85 | 2.81 | 246.69 | 202.87 | 36.10 | 103.51 | ||
| d40 | End of flowering | 0.11 | 0.06 | 2.74 | 2.19 | 196.28 | 174.38 | 90.81 | 109.15 | |
| d70 | 0.24 | 0.14 | 4.72 | 3.23 | 247.28 | 180.67 | 51.72 | 83.35 | ||
| d100 | 0.31 | 0.16 | 6.04 | 2.52 | 264.97 | 232.08 | 42.29 | 86.31 | ||
| Cinnamon | d40 | Beginning of flowering | 0.48 | 0.09 | 5.33 | 2.22 | 356.27 | 235.20 | 5.45 | 59.93 |
| d70 | 0.36 | 0.21 | 5.15 | 4.23 | 344.20 | 233.03 | 13.62 | 47.43 | ||
| d100 | 0.33 | 0.16 | 5.31 | 3.84 | 356.72 | 233.63 | 11.05 | 54.36 | ||
| d40 | Full bloom | 0.19 | 0.11 | 2.79 | 1.94 | 274.89 | 183.82 | 49.94 | 88.22 | |
| d70 | 0.24 | 0.16 | 3.67 | 2.75 | 276.95 | 225.09 | 37.78 | 65.09 | ||
| d100 | 0.42 | 0.19 | 5.30 | 2.85 | 266.67 | 227.93 | 29.59 | 74.89 | ||
| d40 | End of flowering | 0.11 | 0.10 | 2.57 | 2.78 | 218.06 | 195.00 | 131.48 | 81.87 | |
| d70 | 0.11 | 0.13 | 3.30 | 2.98 | 186.83 | 216.14 | 129.09 | 72.03 | ||
| d100 | 0.40 | 0.12 | 6.35 | 2.40 | 249.22 | 224.33 | 38.44 | 71.32 | ||
| Sweet | d40 | Beginning of flowering | 0.15 | 0.16 | 2.70 | 2.54 | 240.03 | 180.07 | 67.82 | 68.58 |
| d70 | 0.18 | 0.20 | 3.52 | 3.17 | 243.88 | 218.40 | 59.00 | 54.77 | ||
| d100 | 0.34 | 0.20 | 4.98 | 2.83 | 234.61 | 244.90 | 46.12 | 62.12 | ||
| d40 | Full bloom | 0.07 | 0.15 | 2.30 | 3.56 | 144.17 | 183.73 | 166.87 | 75.07 | |
| d70 | 0.10 | 0.14 | 2.65 | 3.31 | 153.45 | 192.73 | 106.55 | 78.34 | ||
| d100 | 0.09 | 0.17 | 2.73 | 2.54 | 144.56 | 231.27 | 144.85 | 65.41 | ||
| d40 | End of flowering | 0.11 | 0.10 | 2.45 | 2.73 | 252.11 | 170.37 | 116.78 | 94.50 | |
| d70 | 0.17 | 0.10 | 3.50 | 2.55 | 293.28 | 158.33 | 50.02 | 102.43 | ||
| d100 | 0.11 | 0.25 | 3.05 | 4.08 | 237.28 | 226.60 | 99.18 | 55.34 | ||
| Red Rubin | d40 | Beginning of flowering | 0.23 | 0.12 | 3.17 | 2.25 | 298.67 | 209.99 | 38.03 | 69.08 |
| d70 | 0.33 | 0.16 | 4.45 | 2.42 | 299.83 | 212.35 | 27.73 | 69.13 | ||
| d100 | 0.42 | 0.15 | 5.68 | 2.17 | 274.83 | 256.27 | 23.98 | 70.48 | ||
| d40 | Full bloom | 0.07 | 0.18 | 1.94 | 3.74 | 164.22 | 191.93 | 138.14 | 64.44 | |
| d70 | 0.12 | 0.24 | 2.69 | 4.39 | 207.11 | 248.40 | 95.60 | 58.44 | ||
| d100 | 0.28 | 0.24 | 4.40 | 2.58 | 244.53 | 291.27 | 49.11 | 50.13 | ||
| d40 | End of flowering | 0.10 | 0.17 | 2.62 | 3.74 | 182.22 | 197.67 | 139.56 | 68.68 | |
| d70 | 0.10 | 0.23 | 2.83 | 4.01 | 216.78 | 236.20 | 109.85 | 51.94 | ||
| d100 | 0.15 | 0.18 | 3.43 | 3.31 | 257.56 | 190.62 | 69.61 | 80.02 | ||
| Thai | d40 | Beginning of flowering | 0.23 | 0.15 | 3.16 | 2.14 | 296.64 | 193.53 | 38.41 | 83.36 |
| d70 | 0.36 | 0.32 | 4.01 | 3.25 | 302.75 | 239.00 | 25.87 | 52.42 | ||
| d100 | 0.37 | 0.23 | 5.21 | 3.37 | 250.11 | 199.23 | 42.64 | 68.16 | ||
| d40 | Full bloom | 0.05 | 0.13 | 1.80 | 3.02 | 153.22 | 200.72 | 161.11 | 69.62 | |
| d70 | 0.10 | 0.15 | 2.55 | 3.33 | 187.61 | 186.54 | 88.60 | 83.11 | ||
| d100 | 0.15 | 0.17 | 3.57 | 2.48 | 209.44 | 263.67 | 61.84 | 61.06 | ||
| d40 | End of flowering | 0.09 | 0.13 | 2.02 | 2.72 | 388.89 | 213.73 | 70.24 | 76.42 | |
| d70 | 0.09 | 0.26 | 2.66 | 4.10 | 185.69 | 252.73 | 121.93 | 48.00 | ||
| d100 | 0.17 | 0.24 | 3.96 | 4.16 | 257.22 | 228.82 | 54.11 | 58.13 | ||
| LSD0.05 | 0.12 | 0.12 | 1.39 | 1.39 | 63.39 | 63.39 | 34.99 | 34.99 | ||
| CV% | 43.1 | 29.5 | 19.4 | 36.4 | ||||||
| Cultivars | Stage | Chlorophyll Fluorescence | Assimilation Rate CO2 | ||||
|---|---|---|---|---|---|---|---|
| 2015 | 2016 | 2015 | 2016 | ||||
| Transformed 1 | Actual 2 | Transformed 1 | Actual 2 | ||||
| Mrs Burns | Beginning of flowering | 0.65 | 0.72 | 0.57 | 3.64 | 0.99 | 9.63 |
| Full bloom | 0.75 | 0.65 | 1.03 | 10.30 | 1.03 | 10.34 | |
| End of flowering | 0.73 | 0.64 | 1.09 | 11.55 | 1.00 | 9.53 | |
| Cinnamon | Beginning of flowering | 0.62 | 0.76 | 0.62 | 3.68 | 0.90 | 7.50 |
| Full bloom | 0.70 | 0.64 | 1.02 | 9.71 | 1.06 | 10.87 | |
| End of flowering | 0.73 | 0.67 | 1.16 | 14.02 | 0.95 | 8.32 | |
| Sweet | Beginning of flowering | 0.74 | 0.64 | 1.08 | 11.24 | 1.08 | 11.45 |
| Full bloom | 0.73 | 0.66 | 1.07 | 11.07 | 1.06 | 10.54 | |
| End of flowering | 0.59 | 0.61 | 1.01 | 9.69 | 1.07 | 11.02 | |
| Red Rubin | Beginning of flowering | 0.67 | 0.67 | 1.00 | 9.60 | 1.00 | 9.38 |
| Full bloom | 0.72 | 0.68 | 1.03 | 10.07 | 1.07 | 11.04 | |
| End of flowering | 0.54 | 0.62 | 1.06 | 10.87 | 1.10 | 11.68 | |
| Thai | Beginning of flowering | 0.69 | 0.63 | 1.02 | 10.31 | 1.11 | 12.41 |
| Full bloom | 0.73 | 0.67 | 0.98 | 8.81 | 1.04 | 10.04 | |
| End of flowering | 0.57 | 0.61 | 0.97 | 8.70 | 1.08 | 11.39 | |
| LSD0.05 | 0.04 | 0.04 | 0.11 | 0.11 | |||
| CV% | 6.7 | 31.2 | |||||
| Irrigation Treatment | Assimilation Rate CO2 | |
|---|---|---|
| Transformed 1 | Actual 2 | |
| d40 | 0.96 | 8.86 |
| d70 | 1.01 | 9.90 |
| d100 | 1.05 | 11.08 |
| LSD0.05 | 0.05 | |
| CV% | 31.6 | |
© 2020 by the authors. Licensee MDPI, Basel, Switzerland. This article is an open access article distributed under the terms and conditions of the Creative Commons Attribution (CC BY) license (http://creativecommons.org/licenses/by/4.0/).
Share and Cite
Kalamartzis, I.; Menexes, G.; Georgiou, P.; Dordas, C. Effect of Water Stress on the Physiological Characteristics of Five Basil (Ocimum basilicum L.) Cultivars. Agronomy 2020, 10, 1029. https://doi.org/10.3390/agronomy10071029
Kalamartzis I, Menexes G, Georgiou P, Dordas C. Effect of Water Stress on the Physiological Characteristics of Five Basil (Ocimum basilicum L.) Cultivars. Agronomy. 2020; 10(7):1029. https://doi.org/10.3390/agronomy10071029
Chicago/Turabian StyleKalamartzis, Iakovos, George Menexes, Pantazis Georgiou, and Christos Dordas. 2020. "Effect of Water Stress on the Physiological Characteristics of Five Basil (Ocimum basilicum L.) Cultivars" Agronomy 10, no. 7: 1029. https://doi.org/10.3390/agronomy10071029
APA StyleKalamartzis, I., Menexes, G., Georgiou, P., & Dordas, C. (2020). Effect of Water Stress on the Physiological Characteristics of Five Basil (Ocimum basilicum L.) Cultivars. Agronomy, 10(7), 1029. https://doi.org/10.3390/agronomy10071029