
Vibration and Sound Response of Glass-Fiber-Reinforced Polyamide 6 Using Microcellular-Foaming-Process-Applied Injection Molding Process


Abstract
:1. Introduction
2. Materials and Methods
2.1. Material
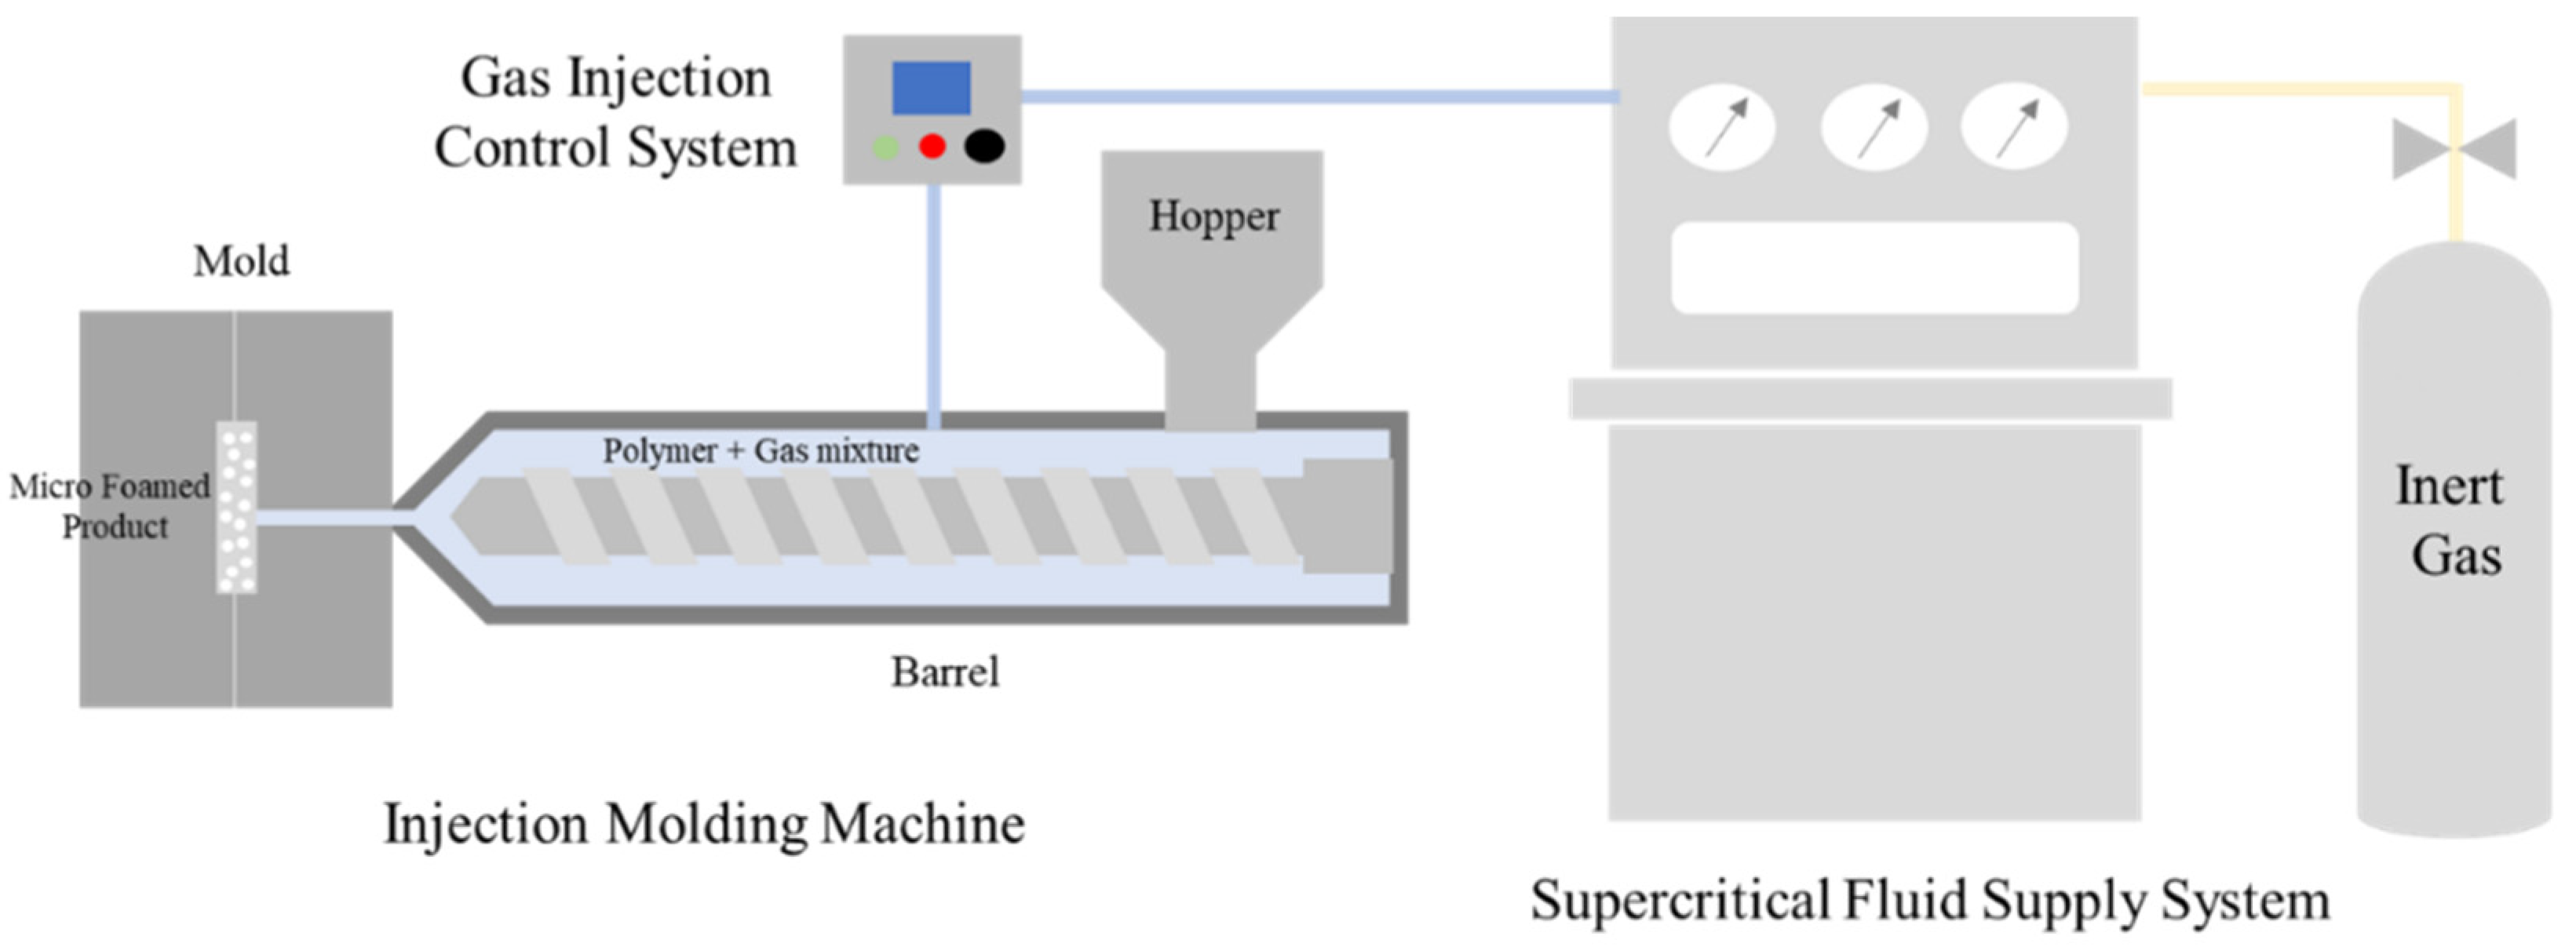
2.2. Microcellular-Foaming-Applied Injection Molding Process
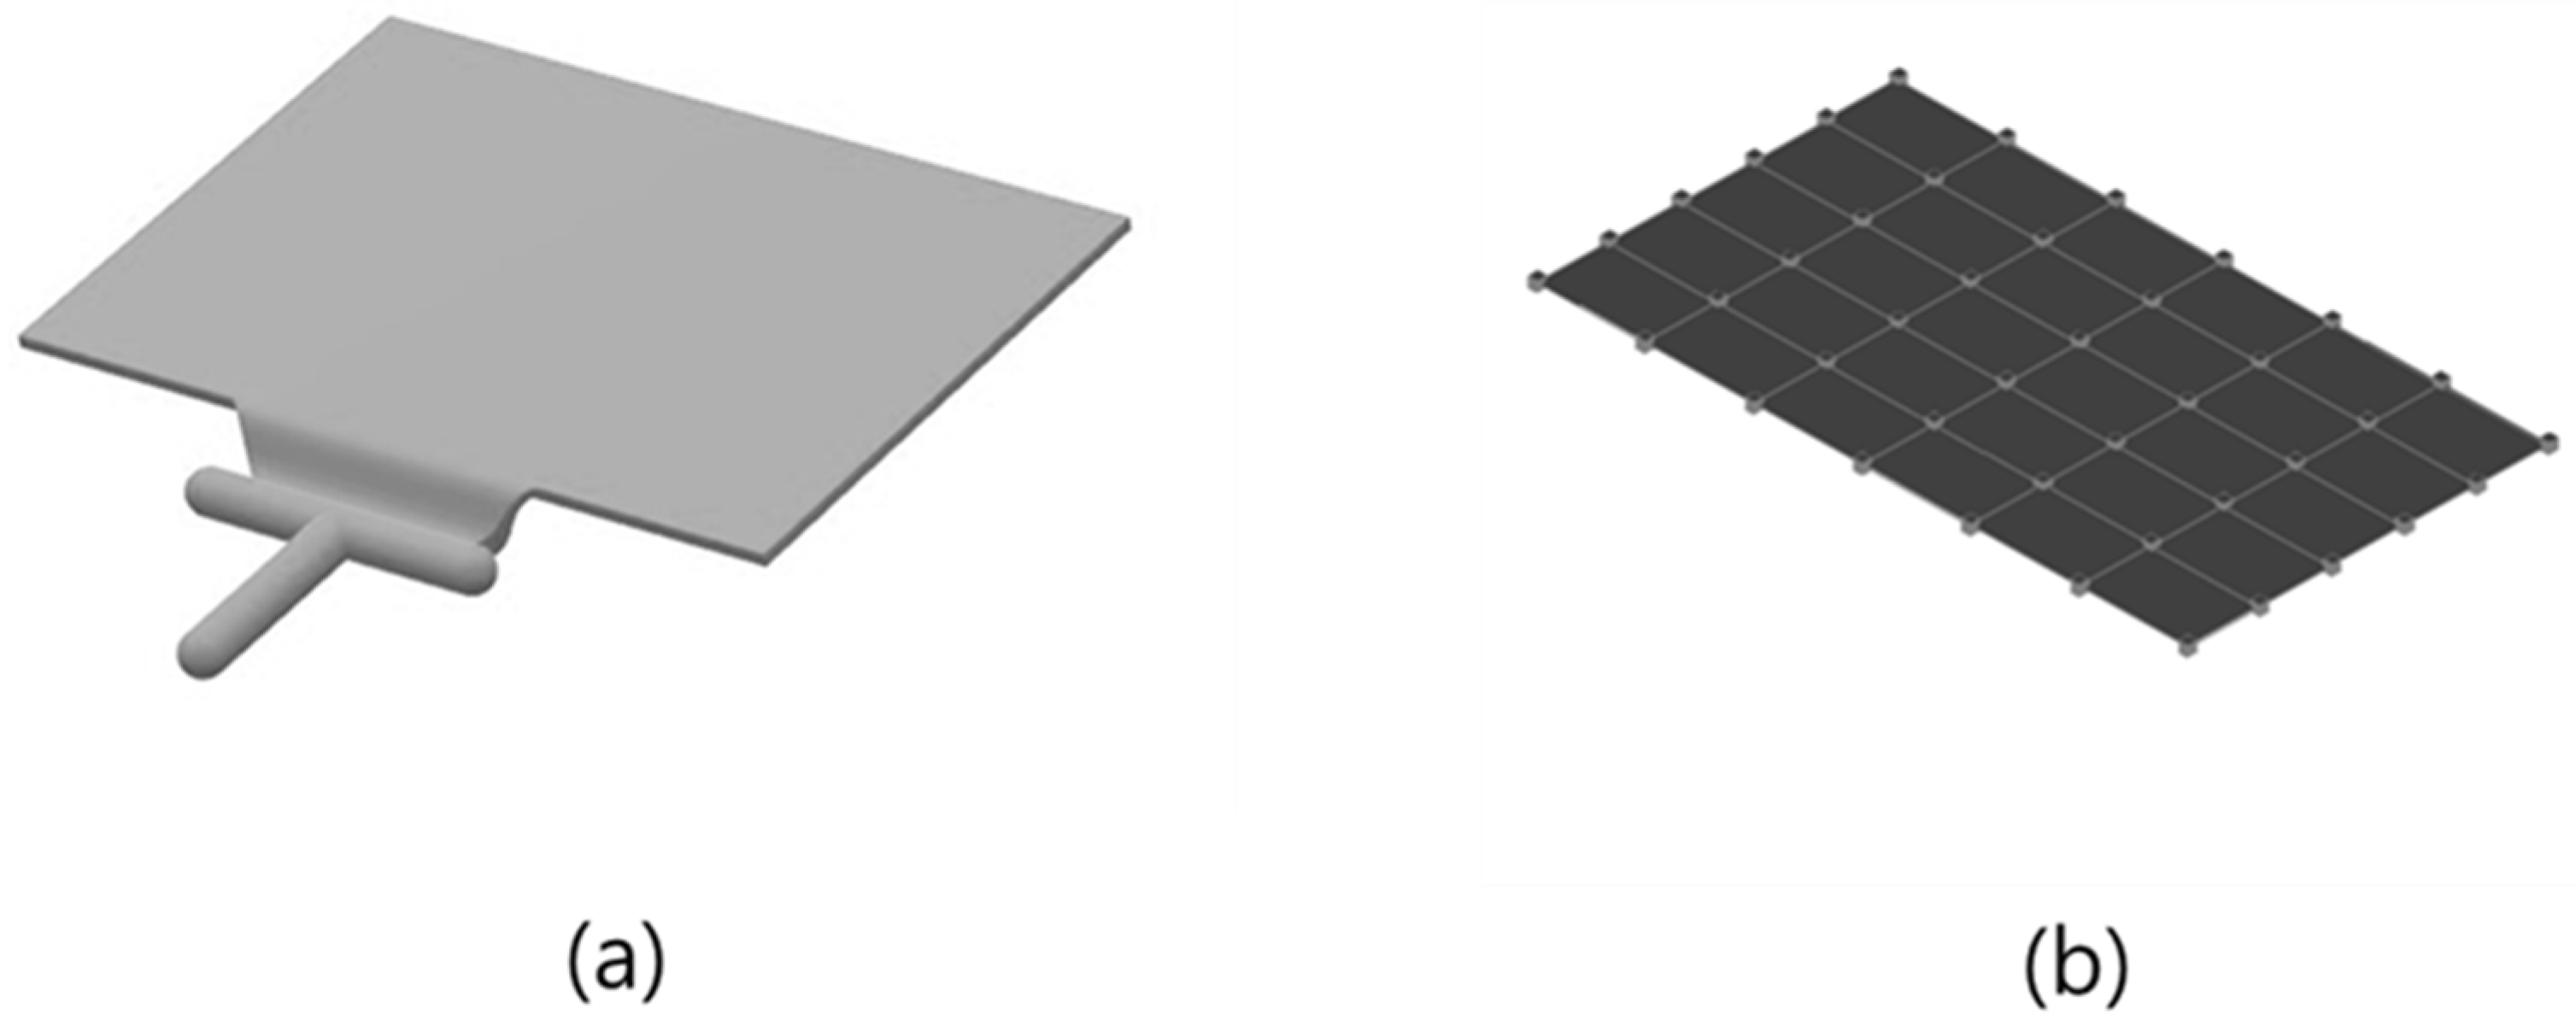
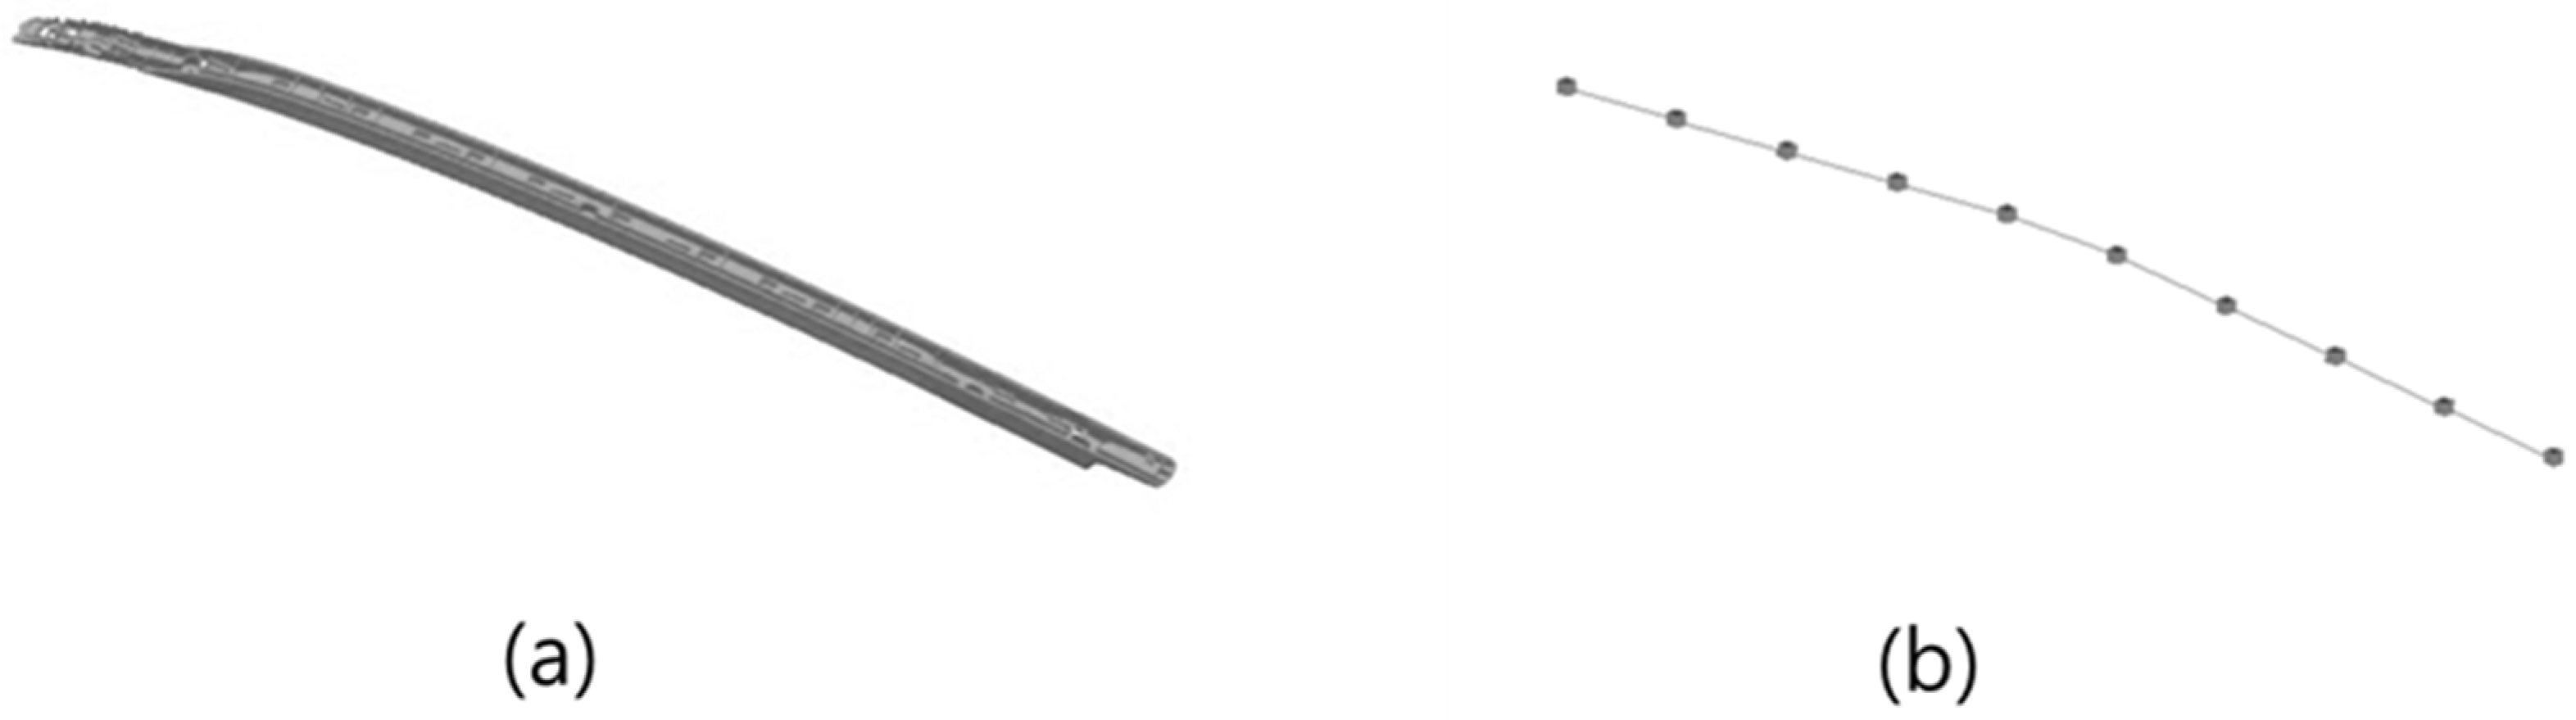
2.3. Test Specimens
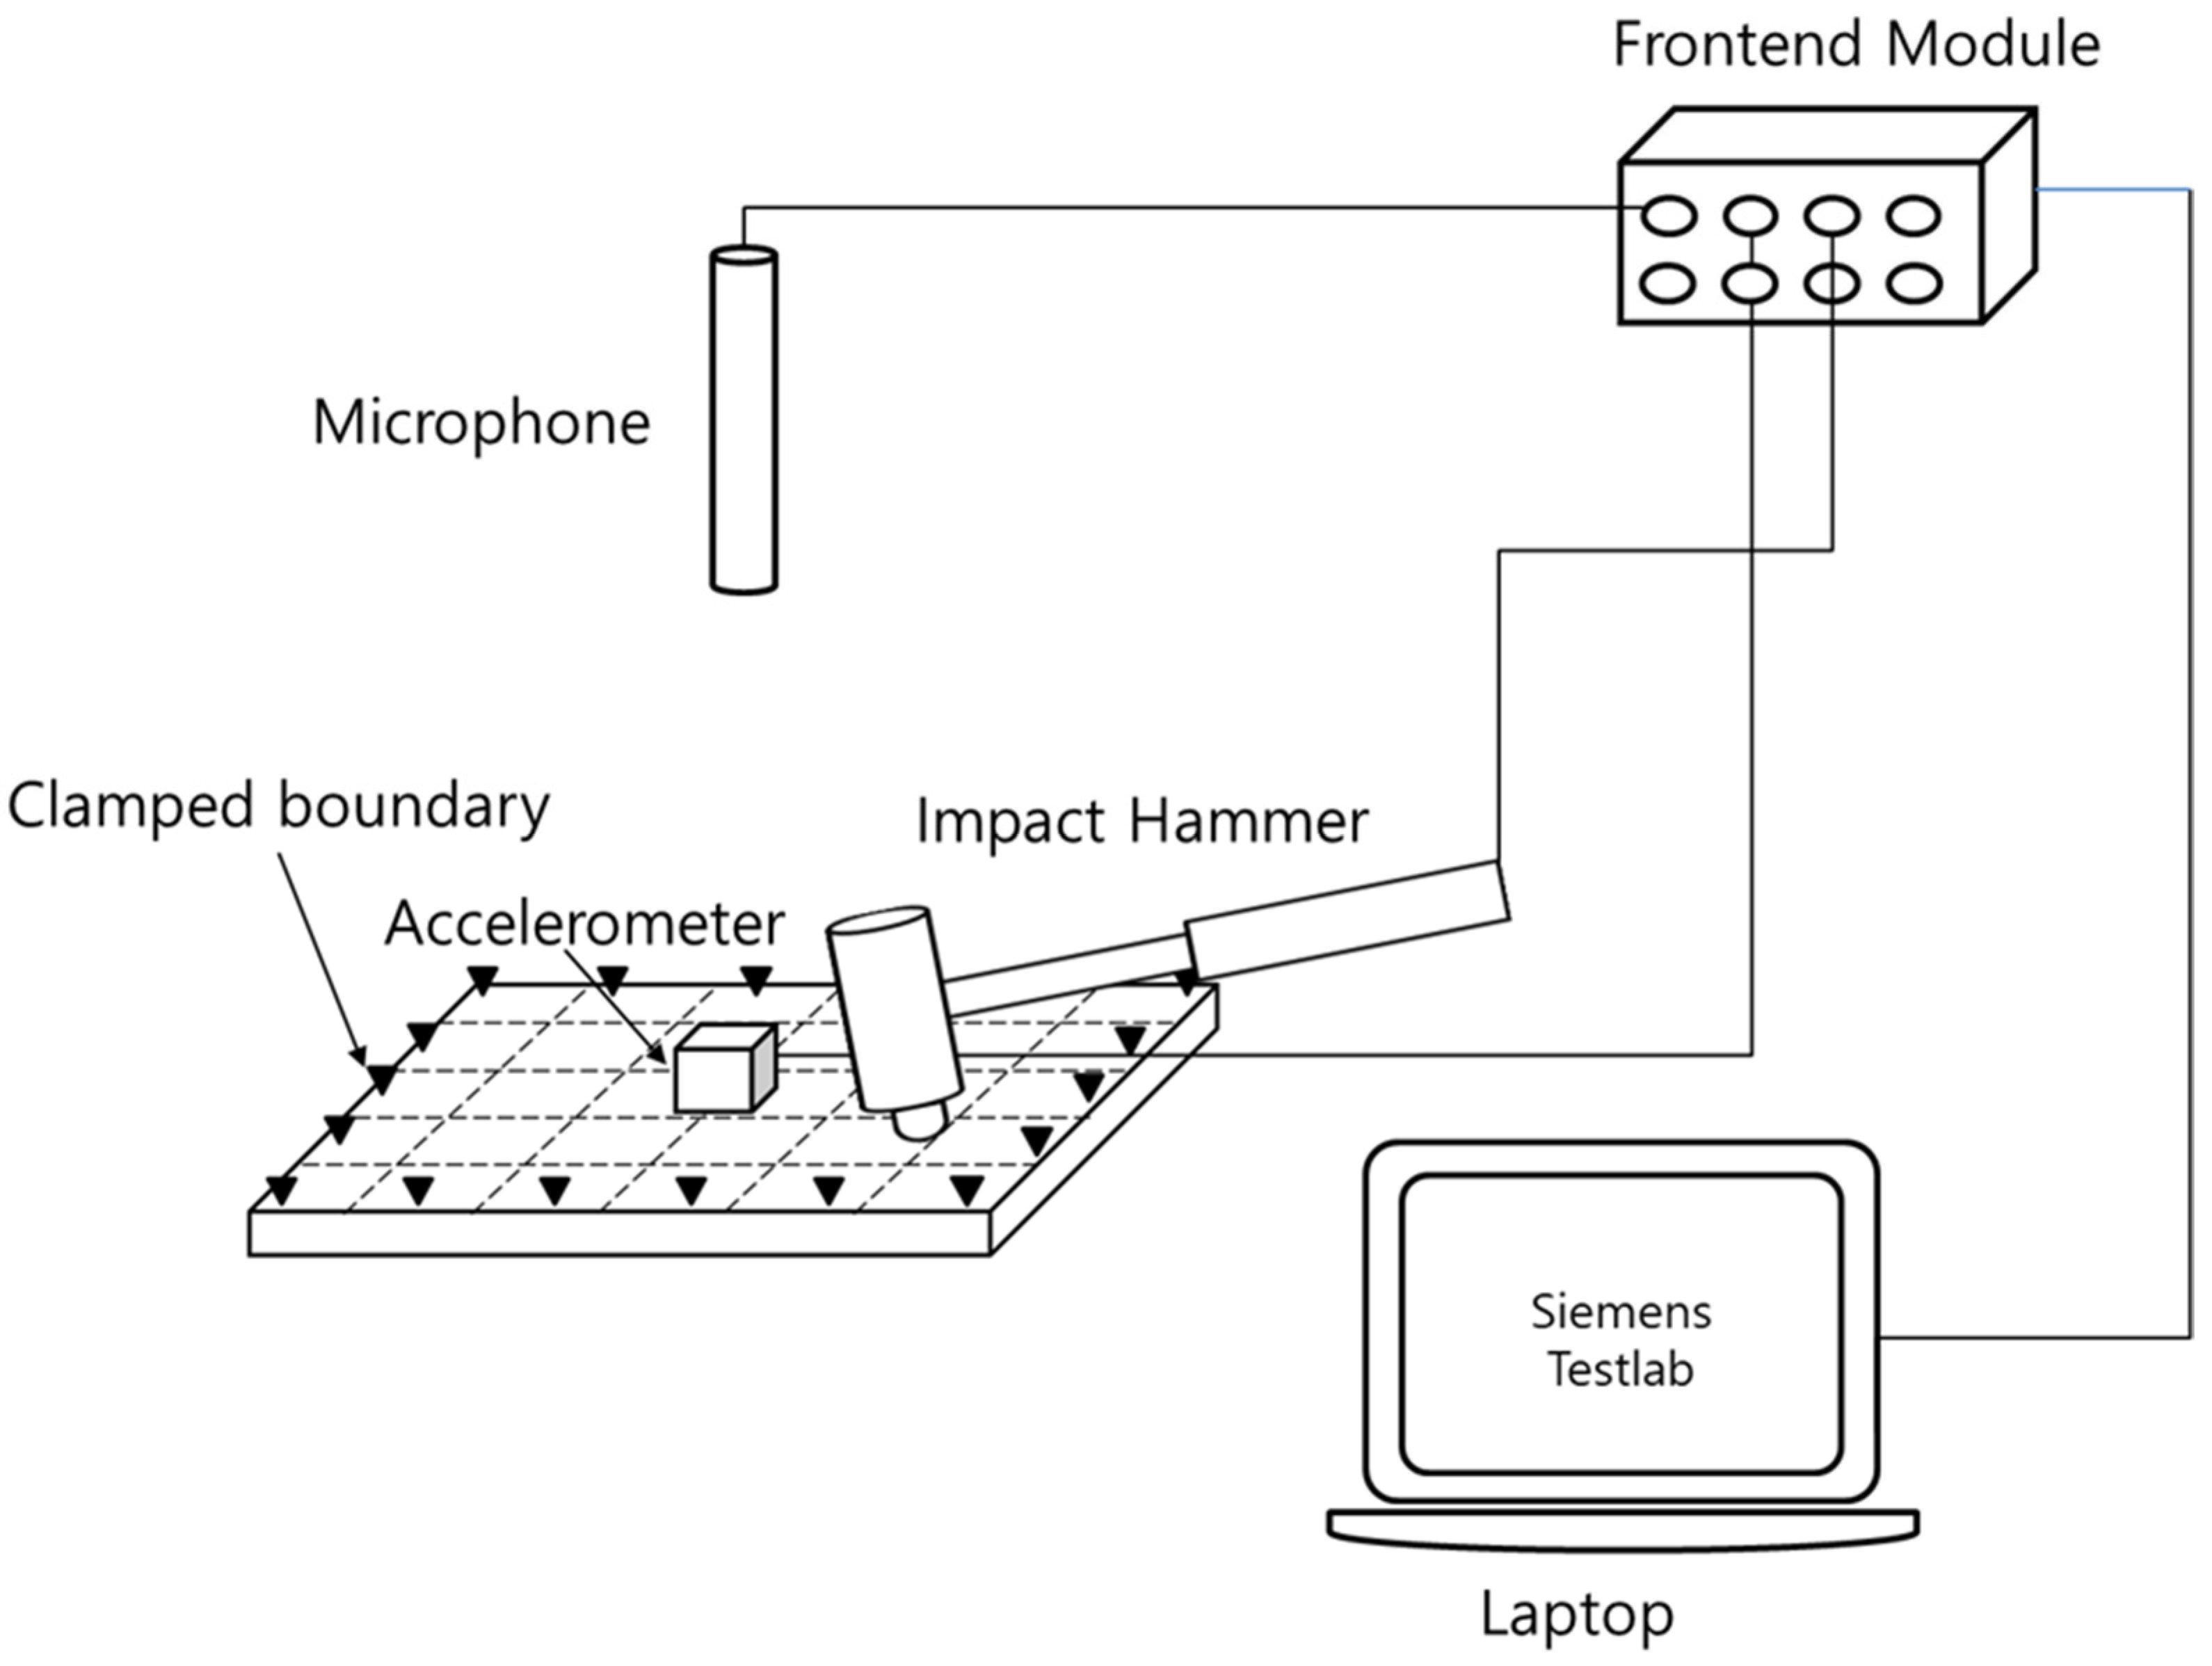
2.4. Acoustic and Vibration Characteristics
2.5. Mechanical Properties
2.6. Cell Morphology
3. Results and Discussion
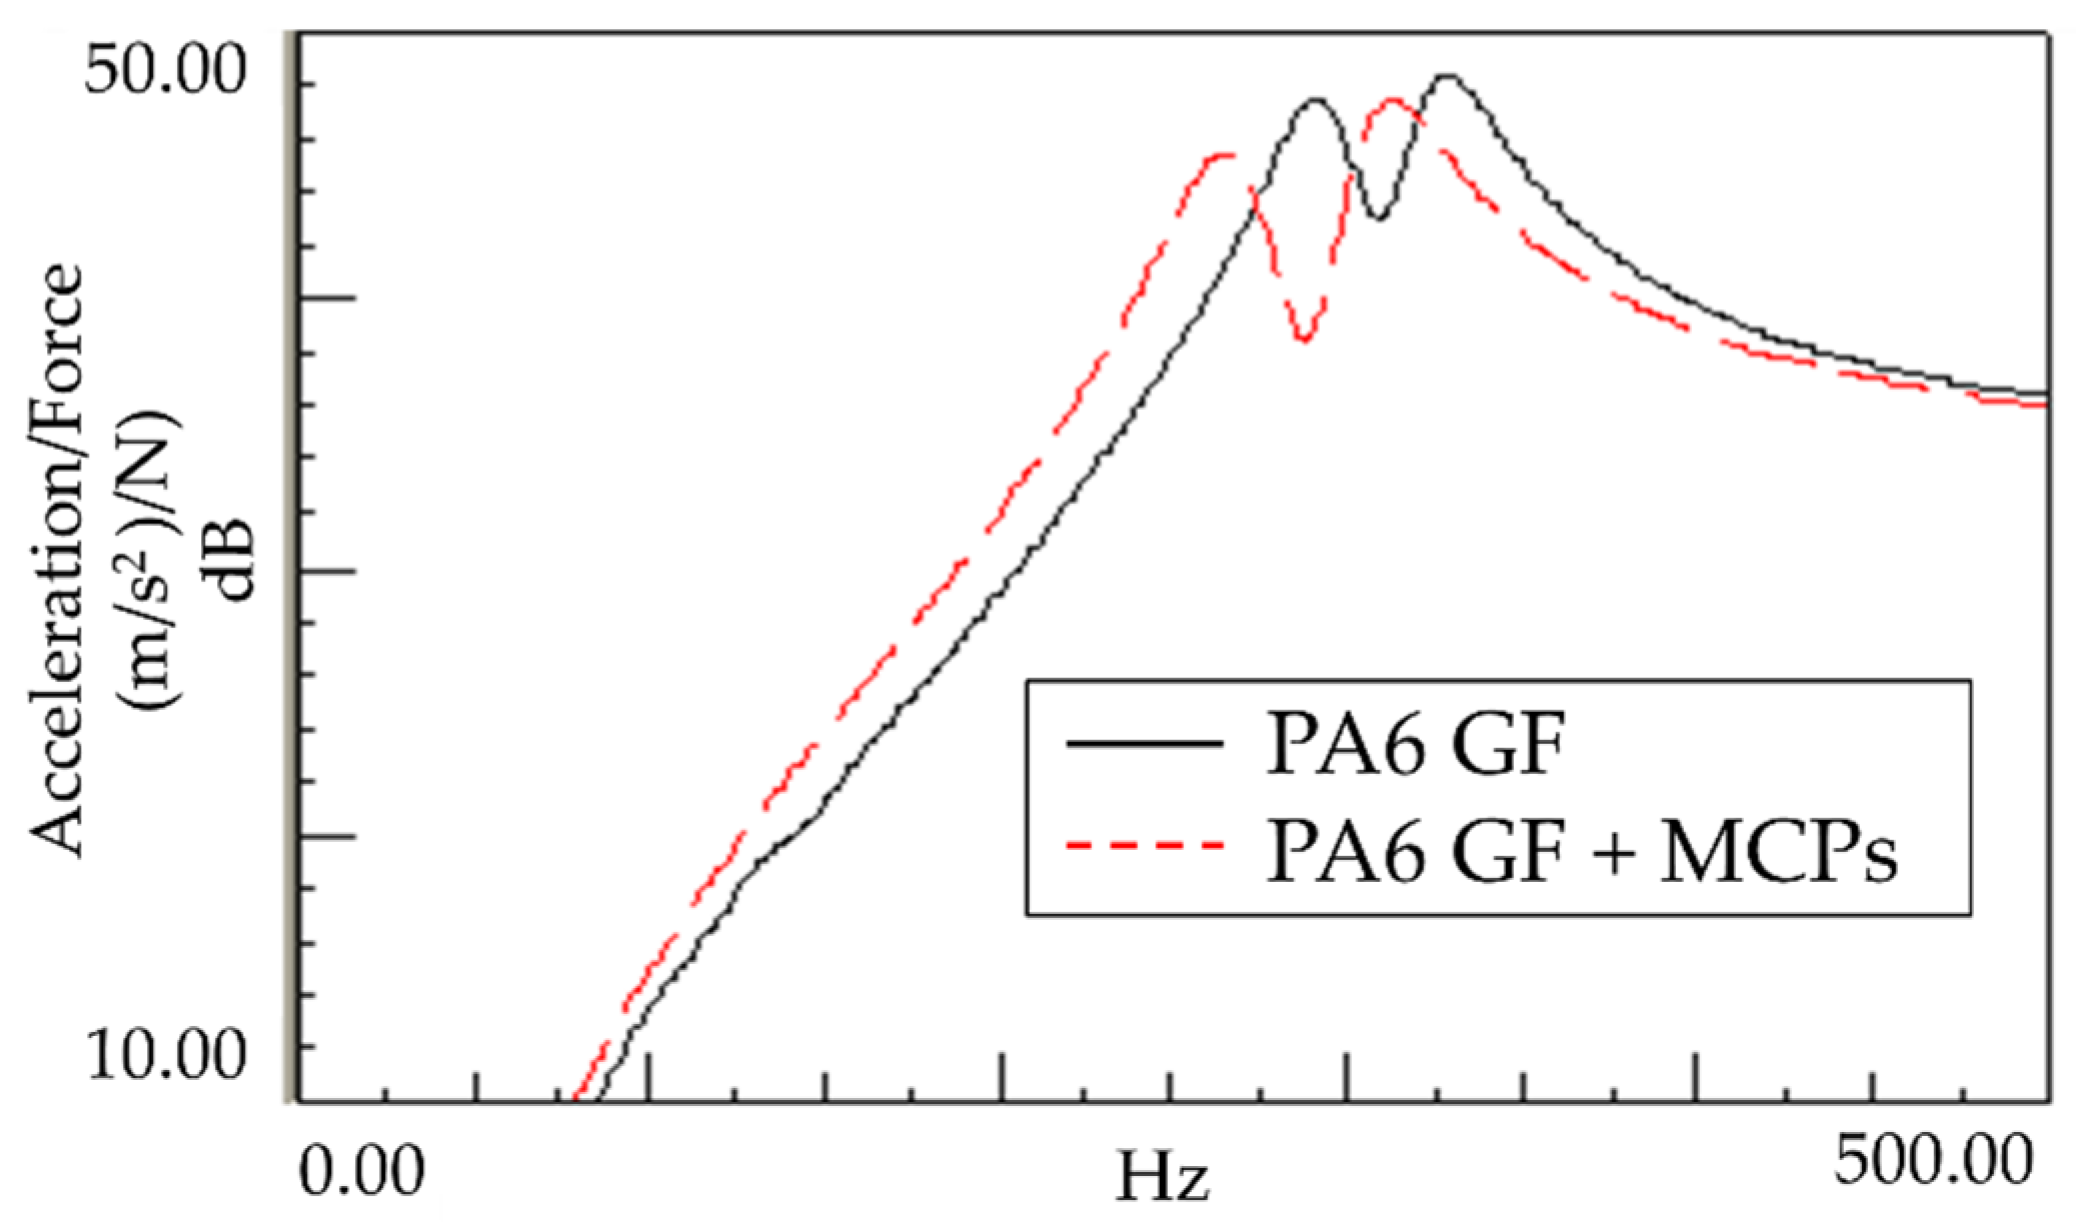
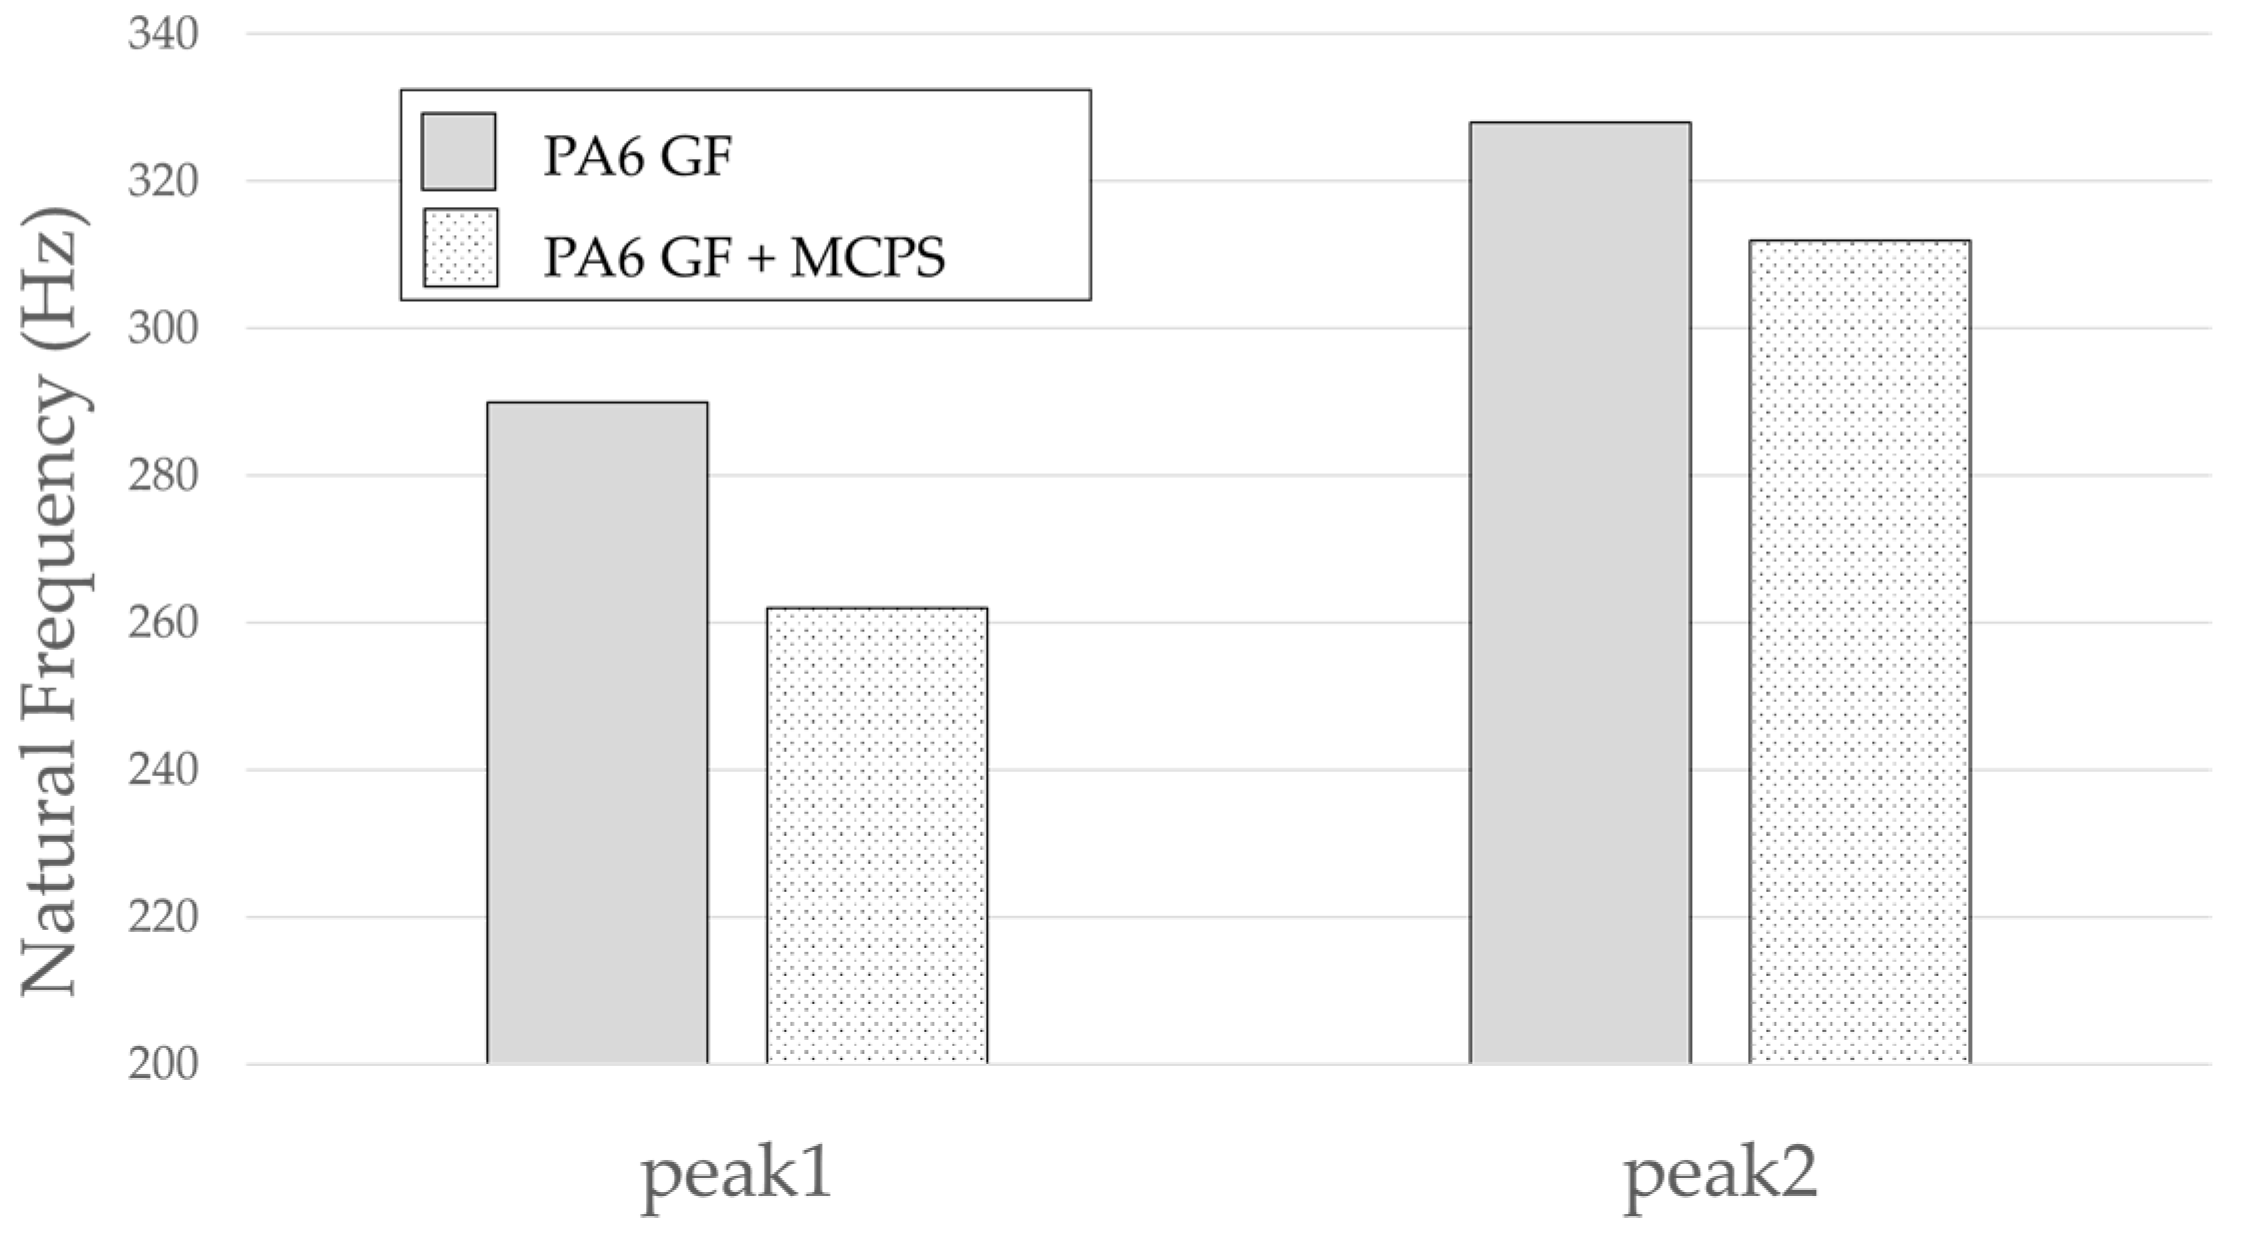
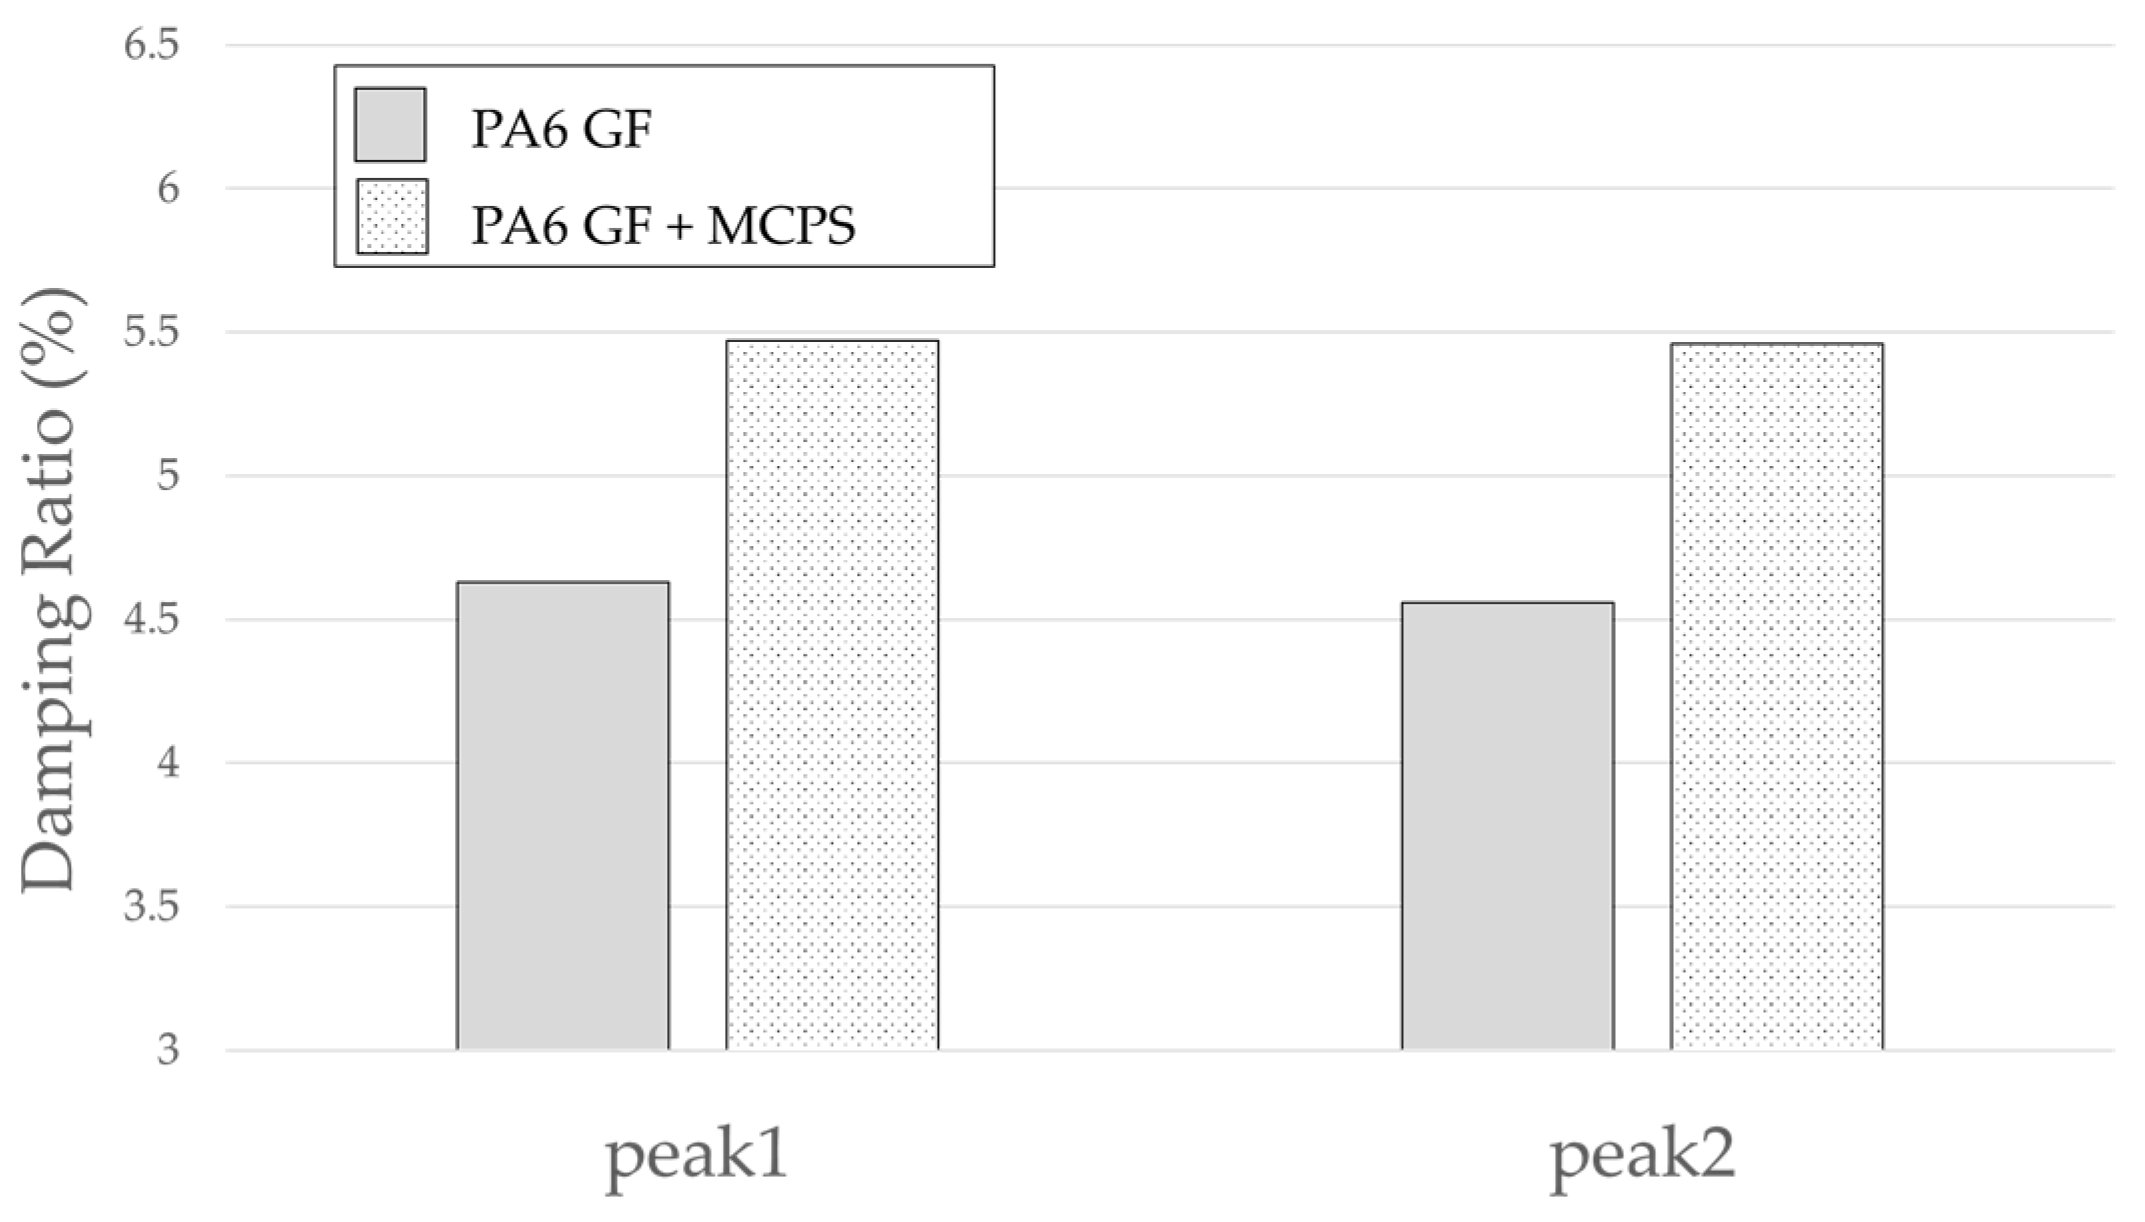
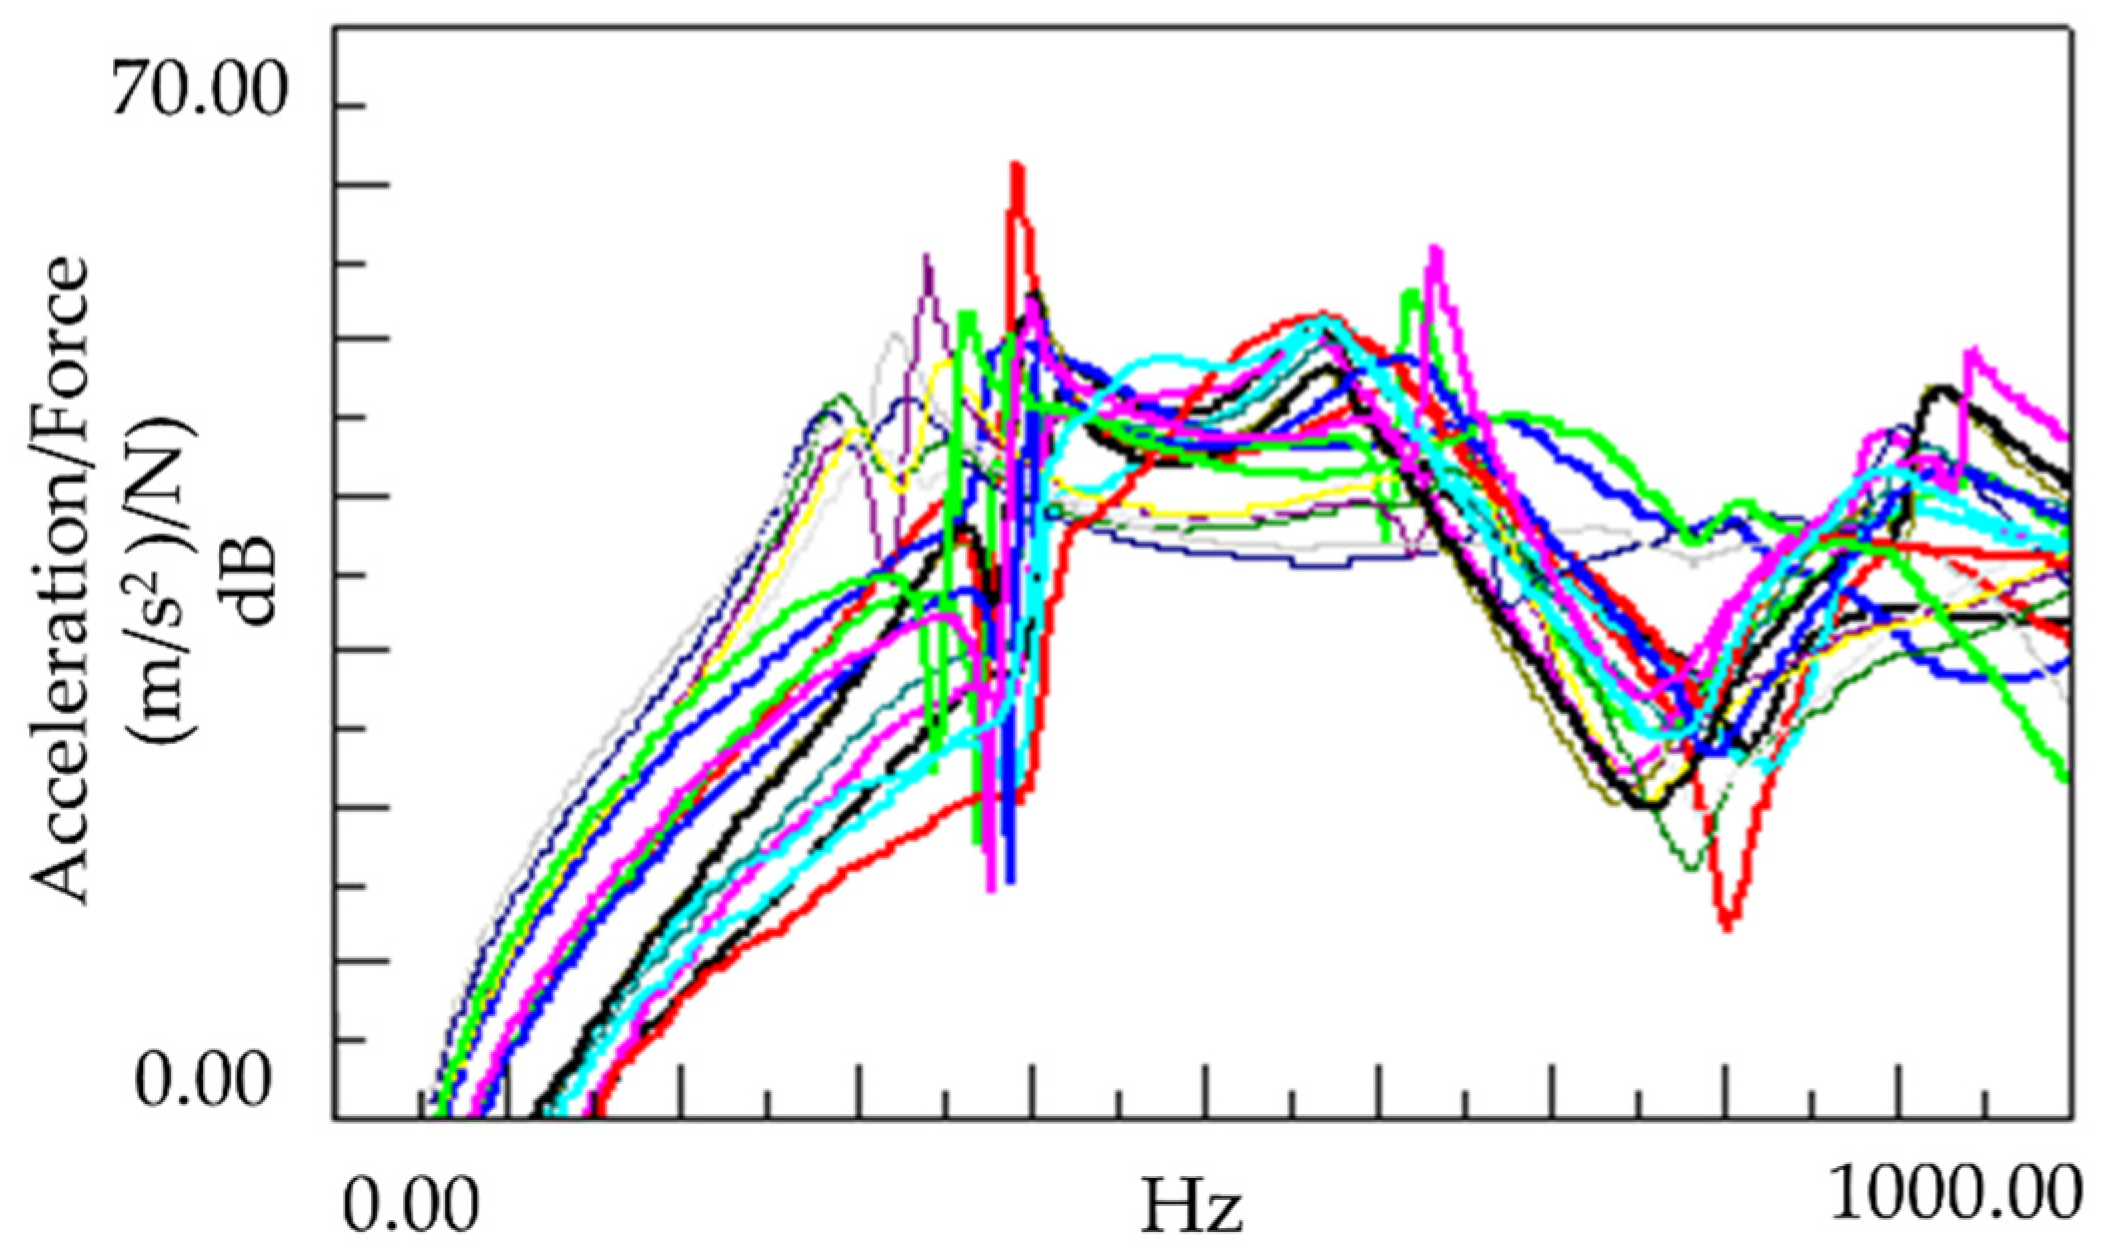
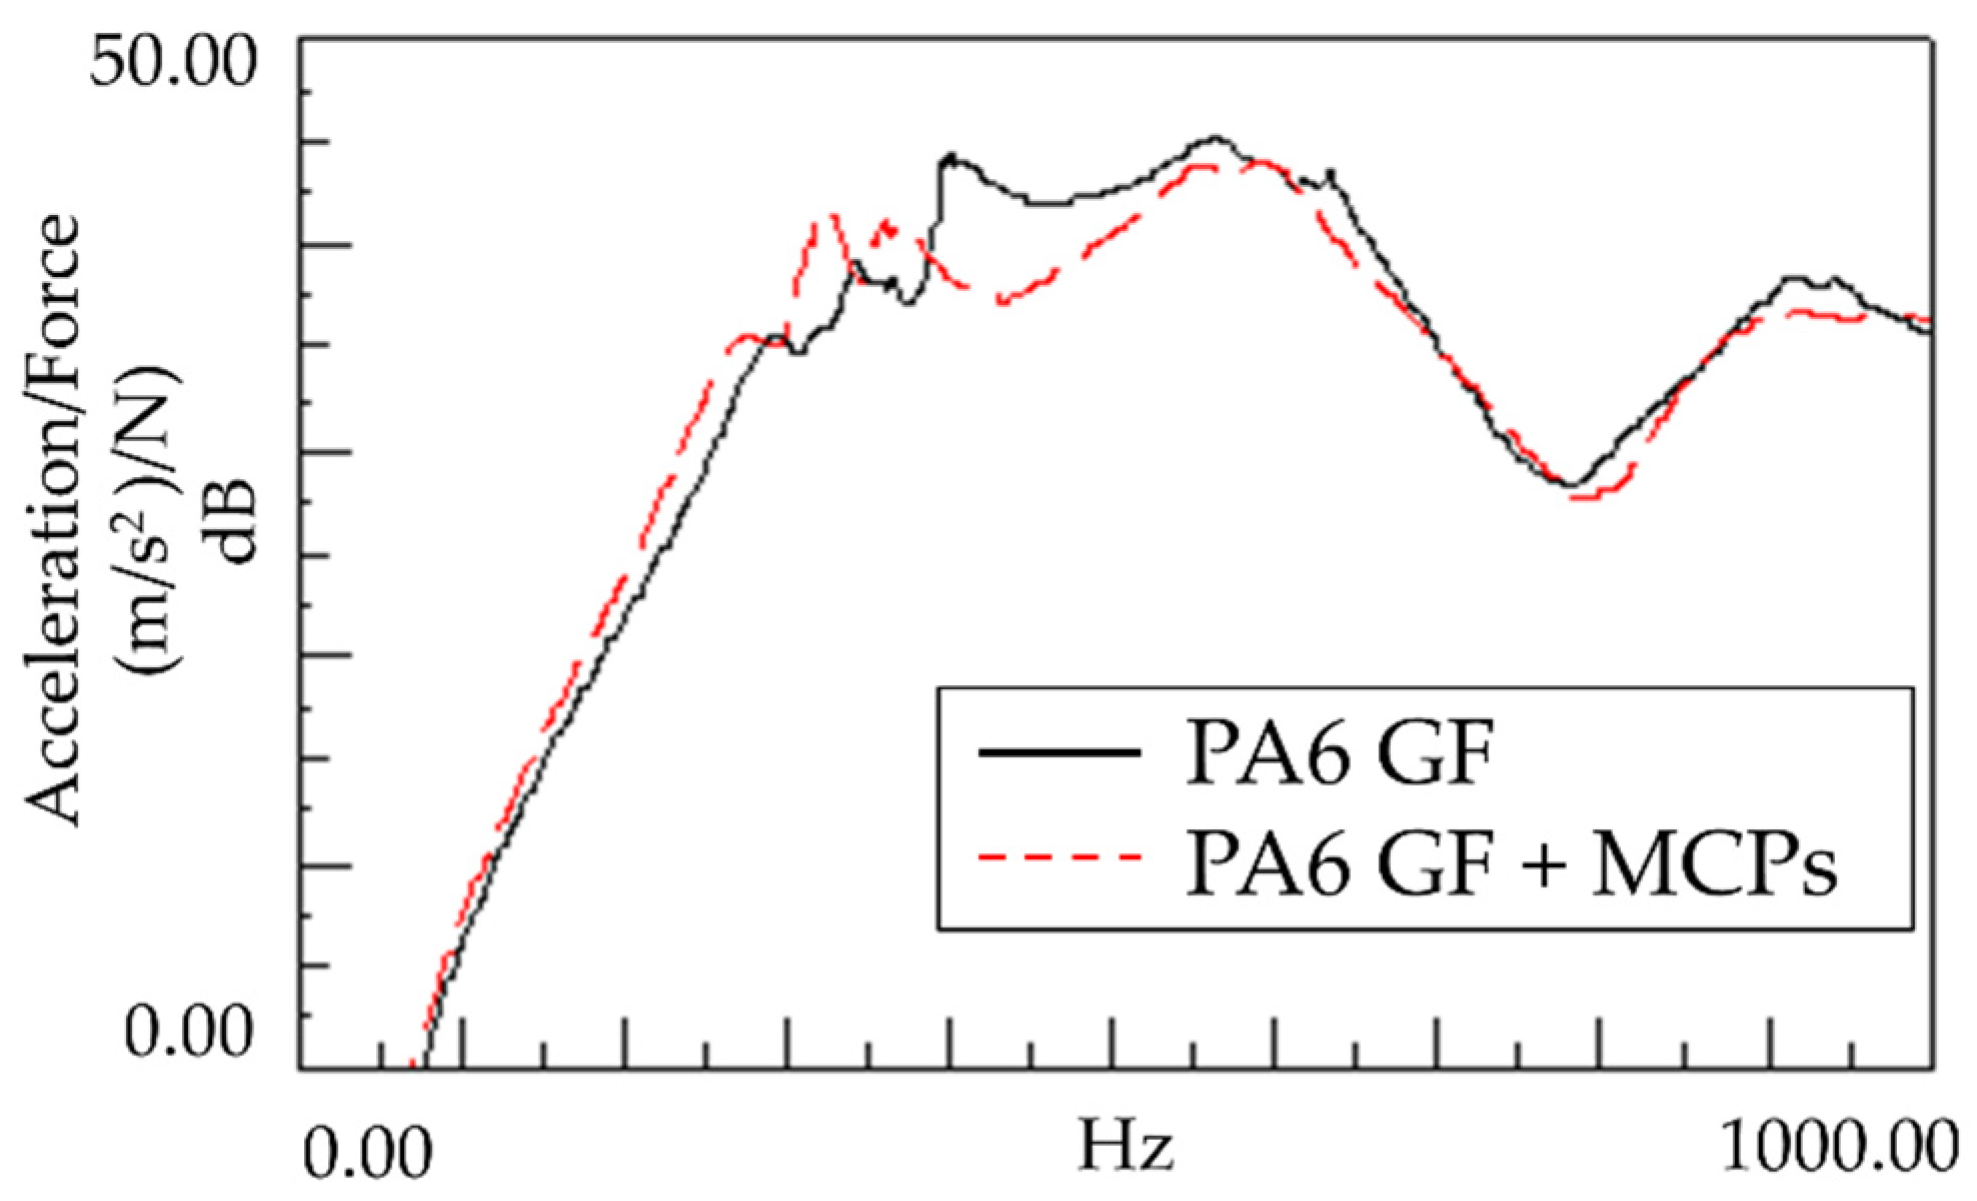
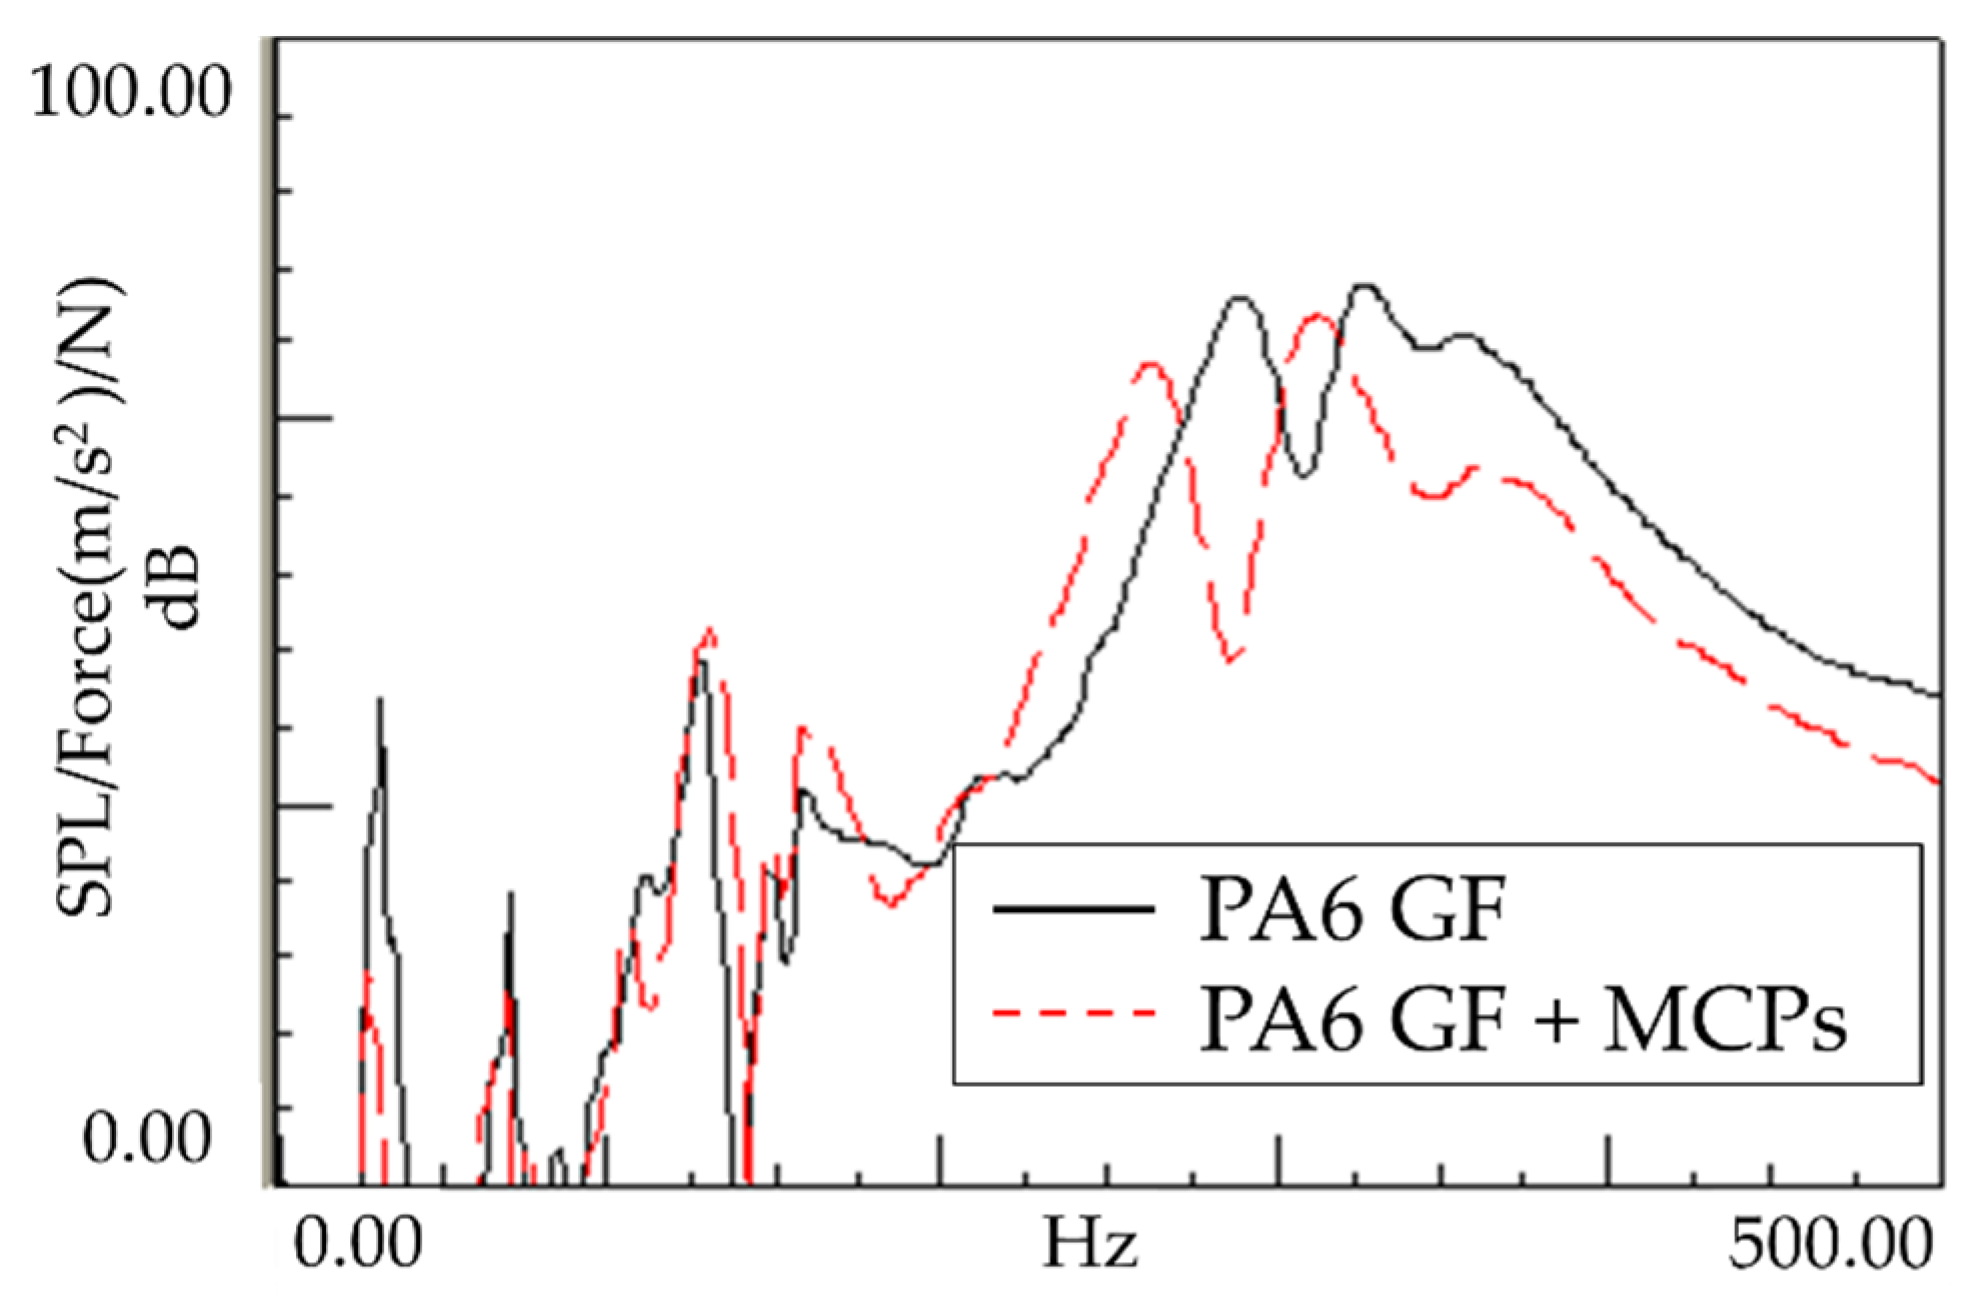
3.1. Vibration Response of Plate Specimen
3.2. Sound Response of Plate Specimen
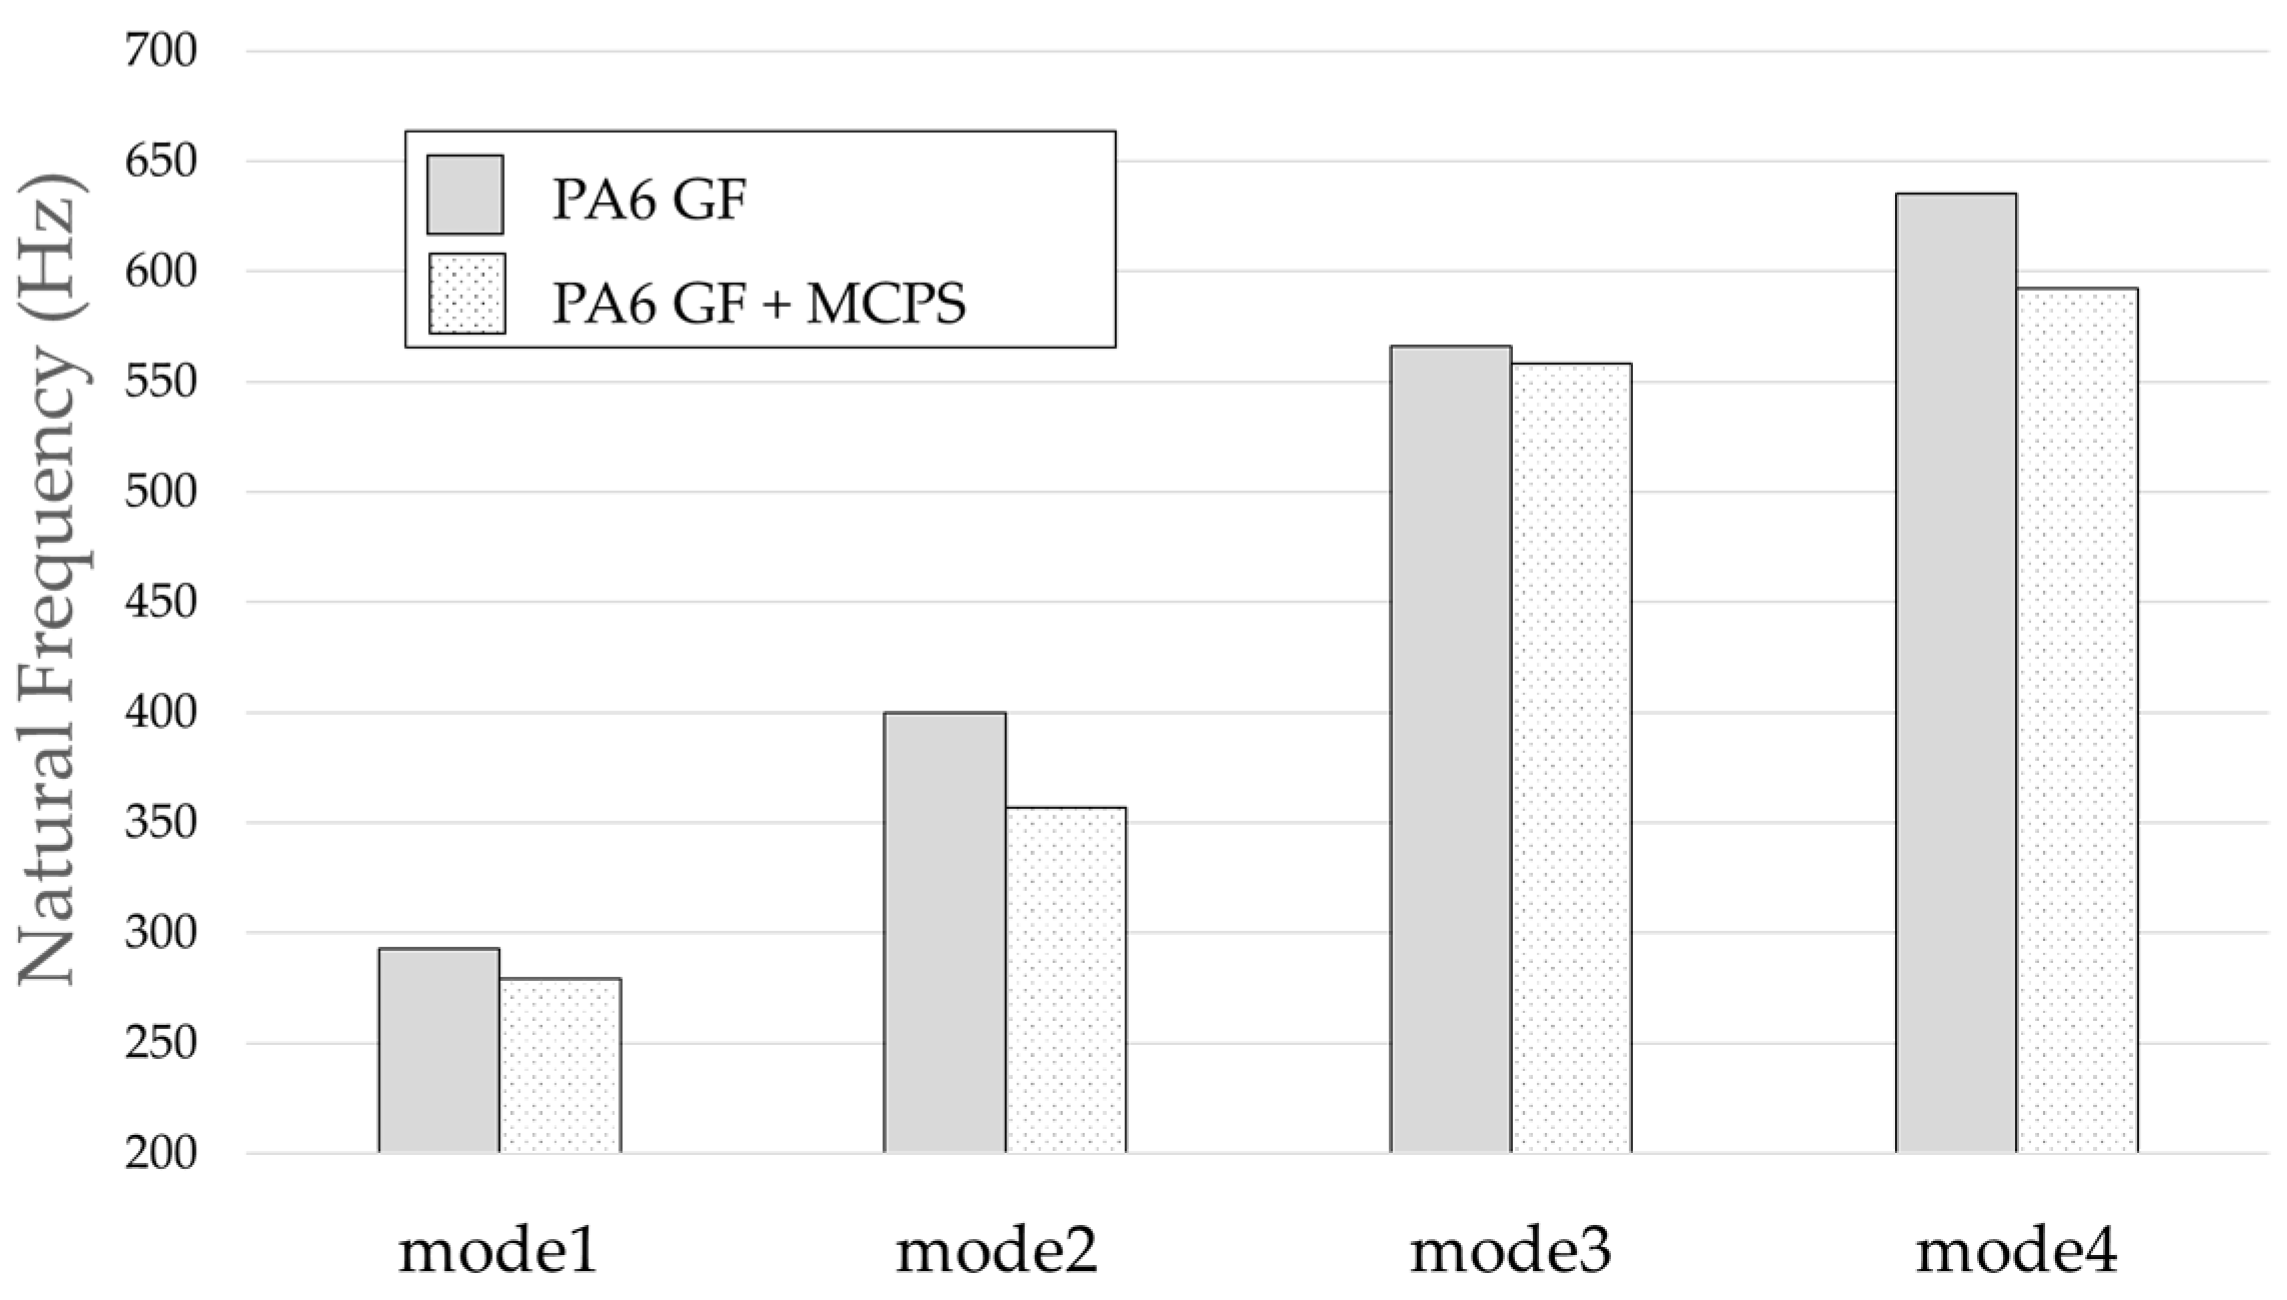
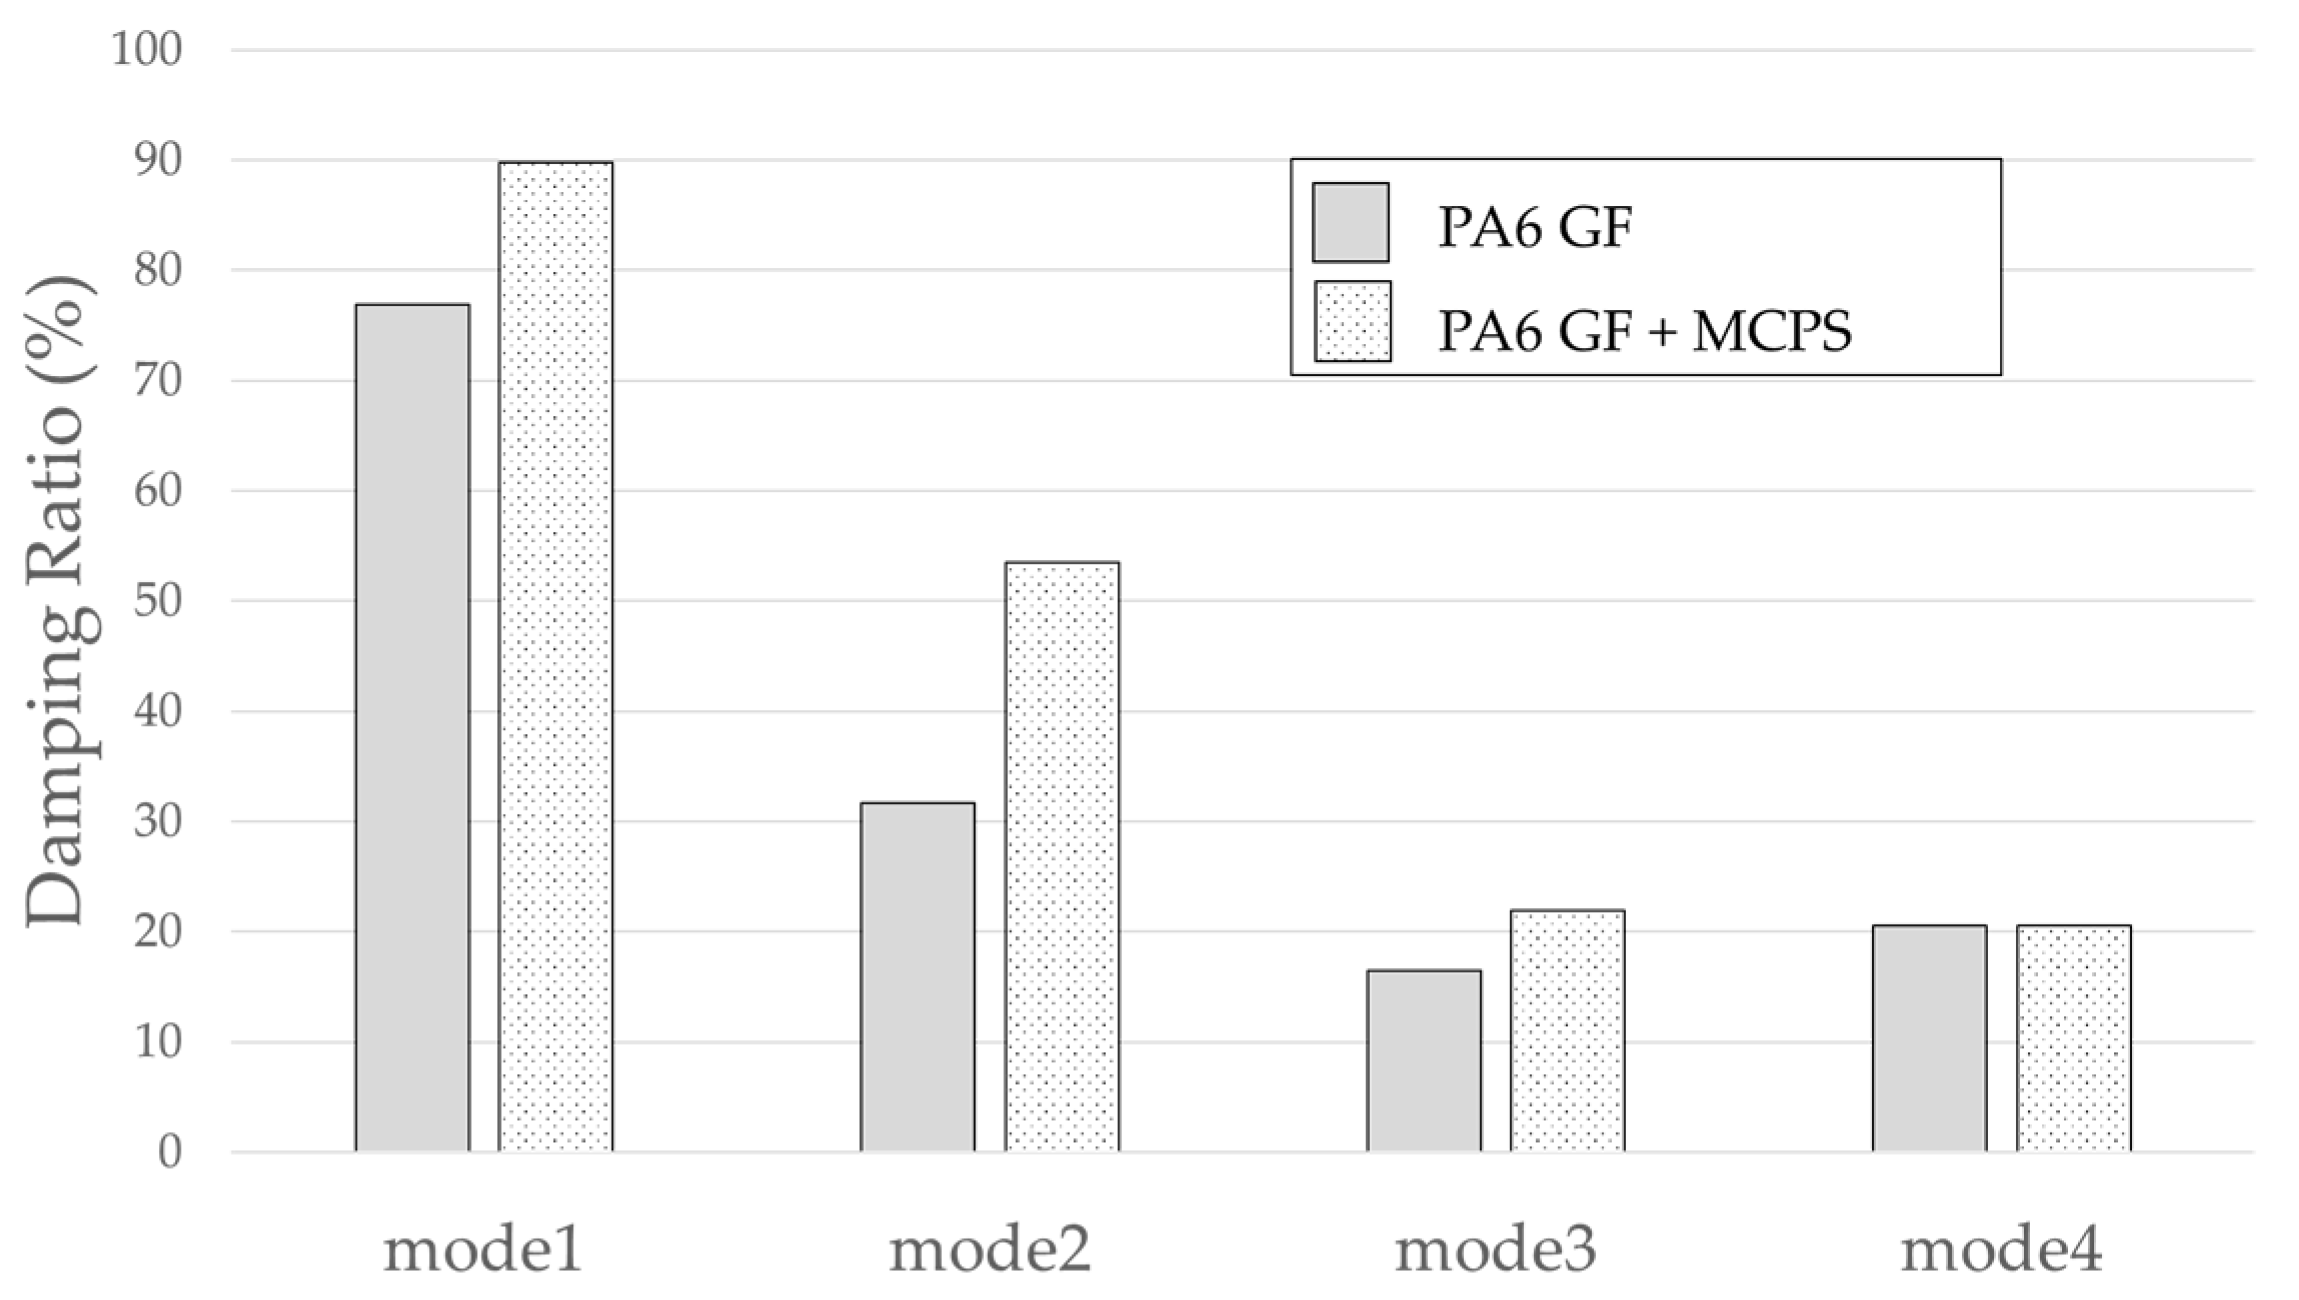
3.3. Natural Frequencies and Mode Shapes of Plate Specimen
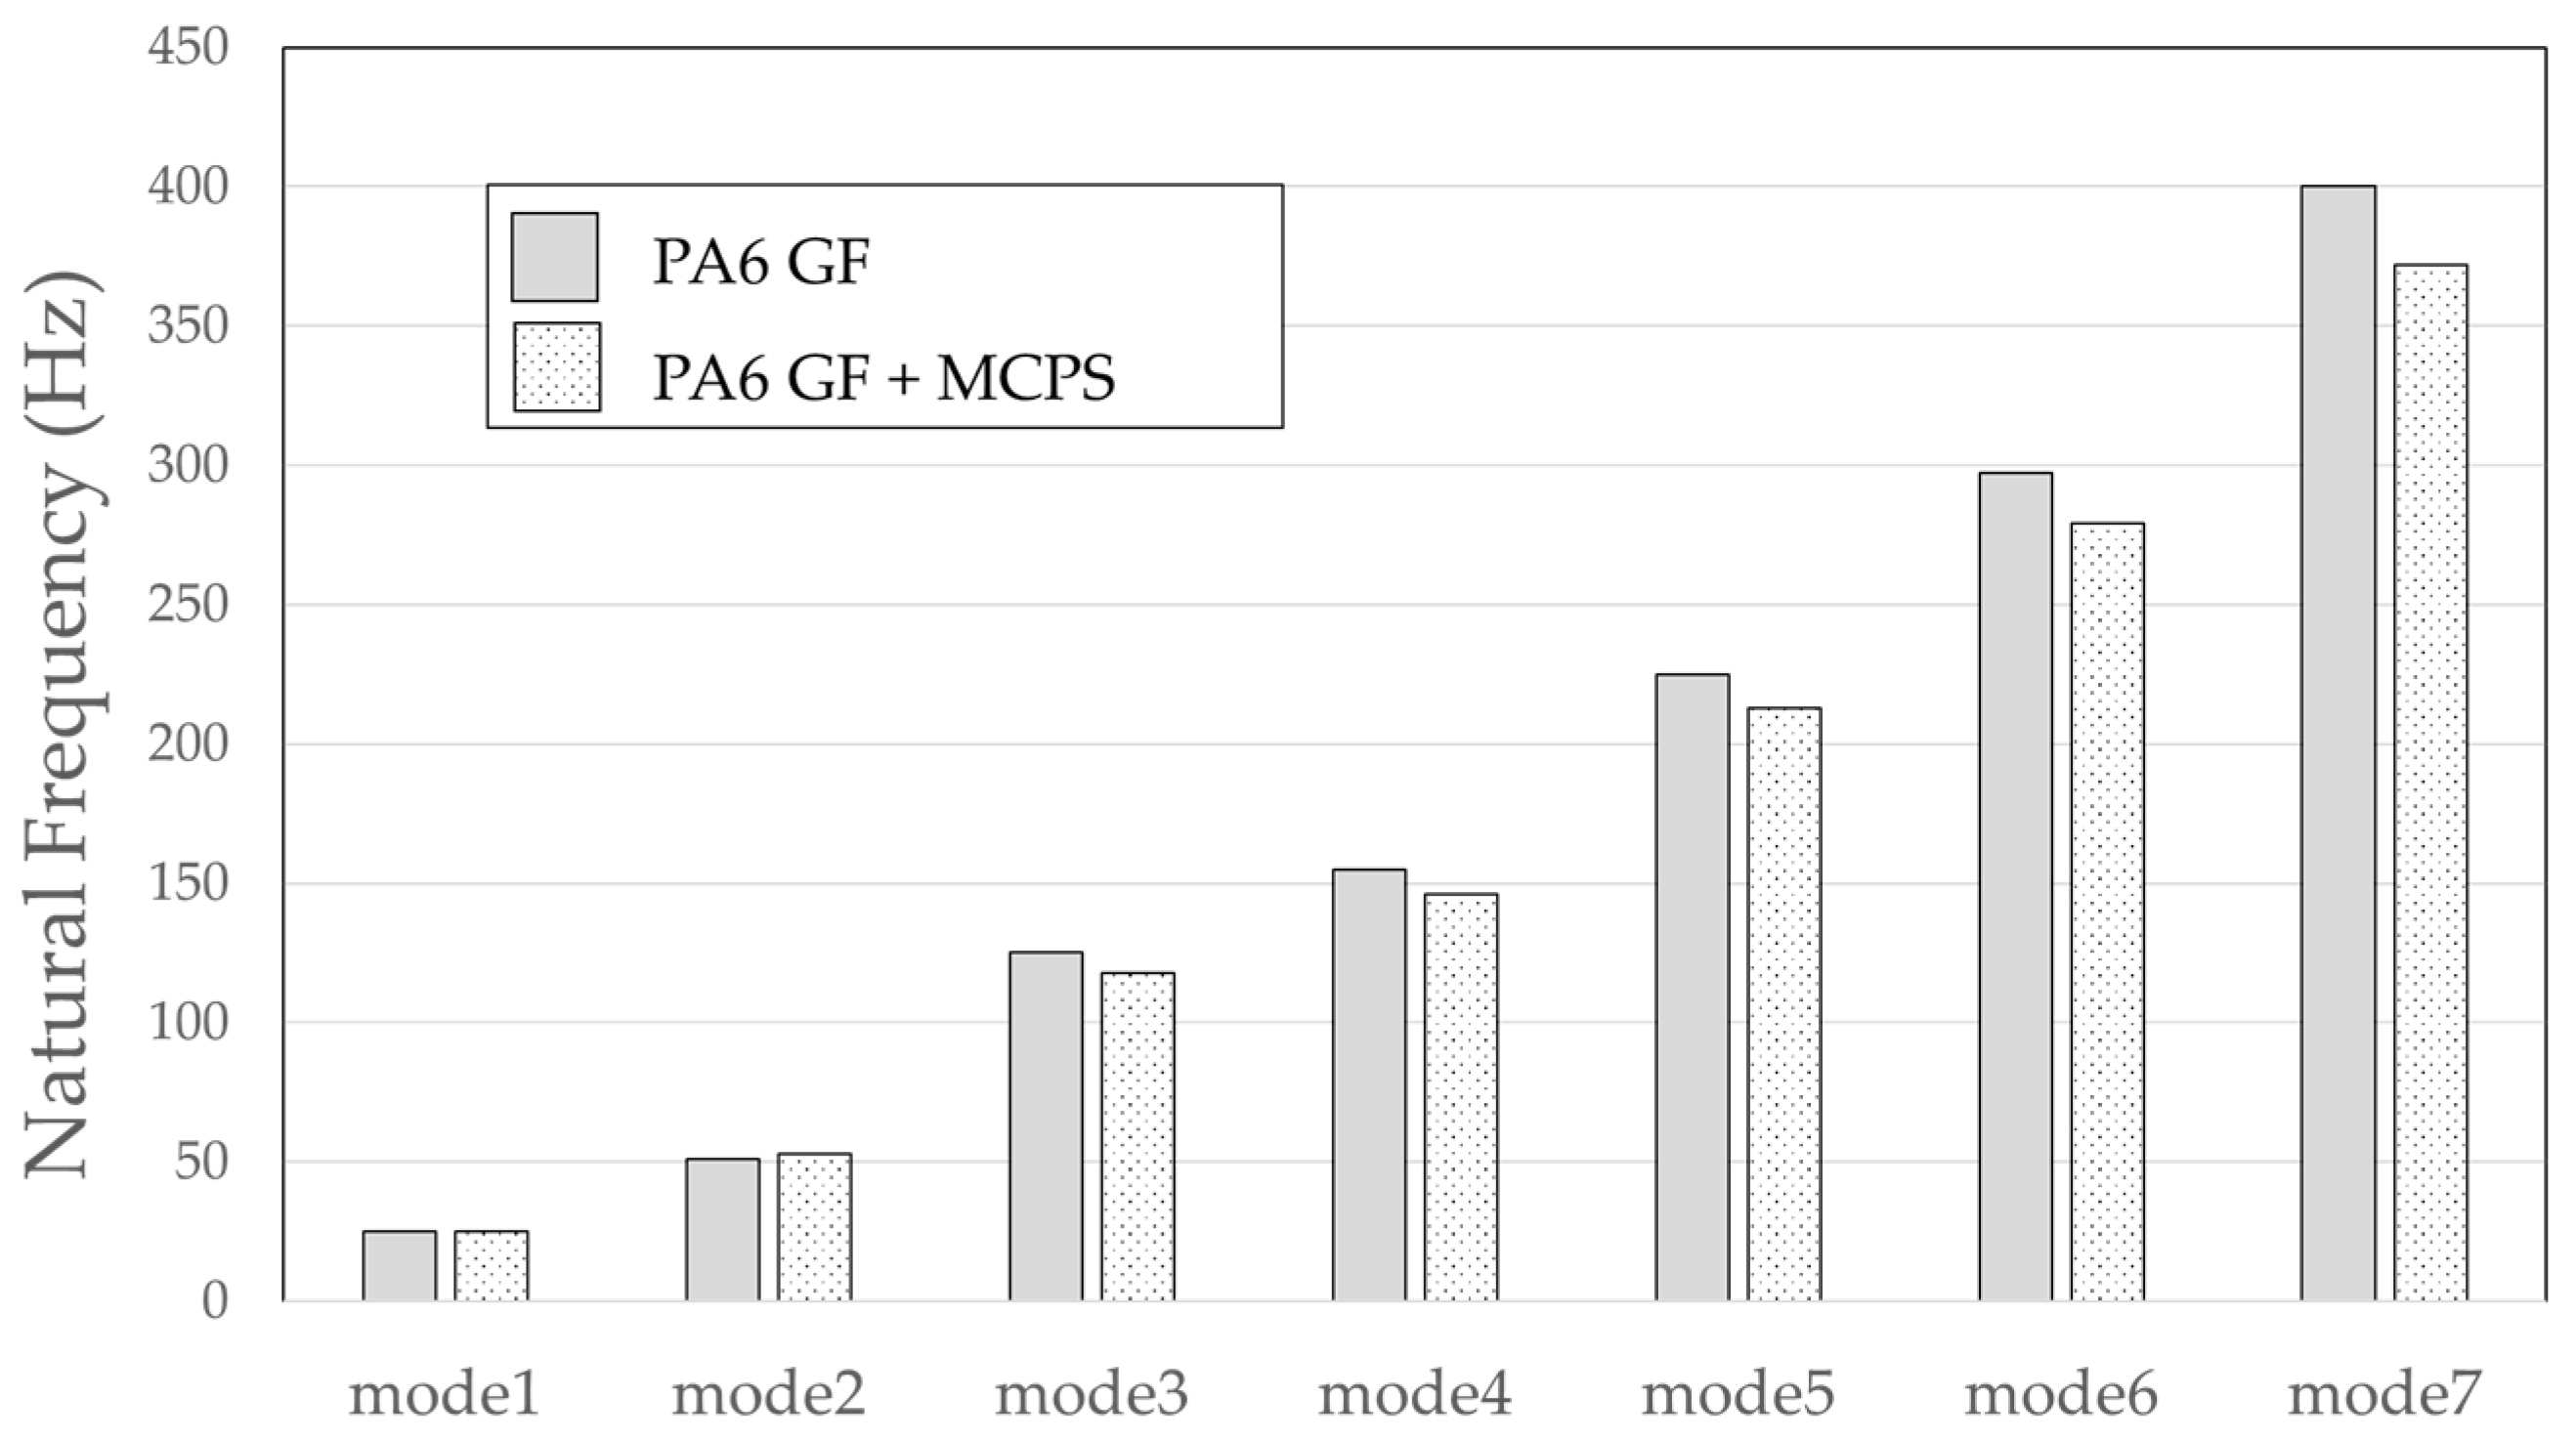
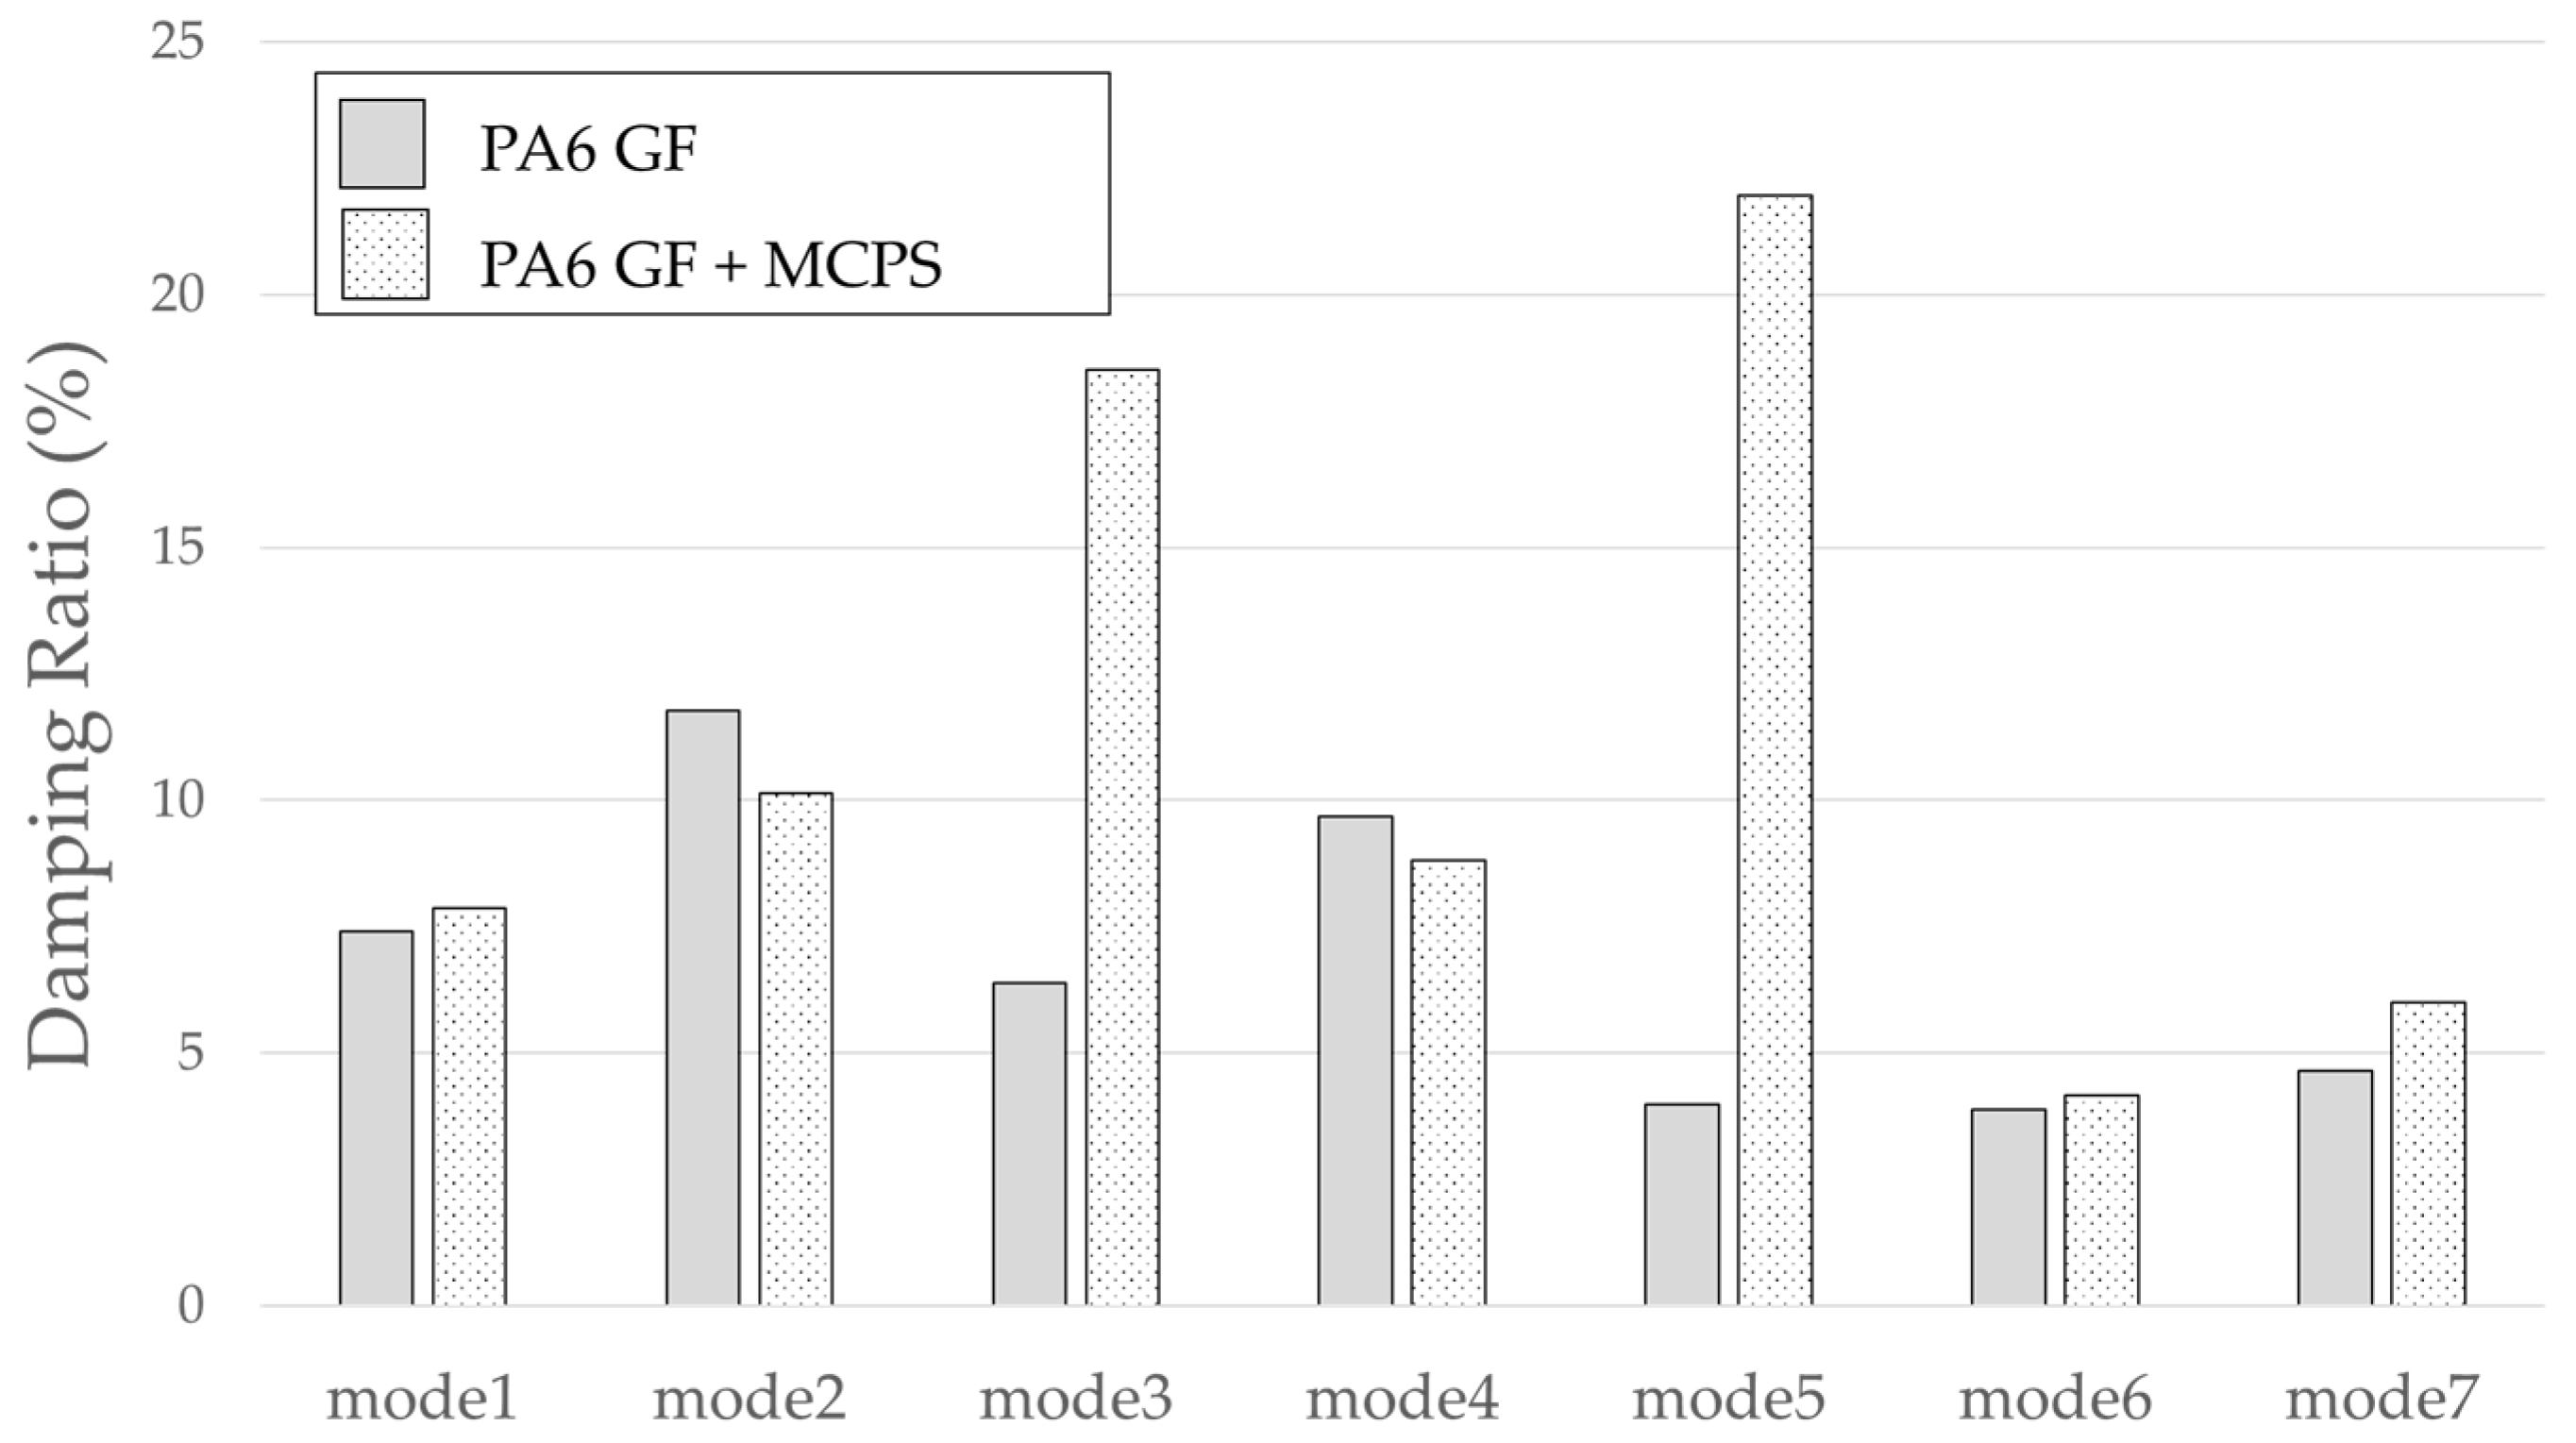
3.4. Natural Frequencies and Mode Shapes of Roof-Rack Specimen
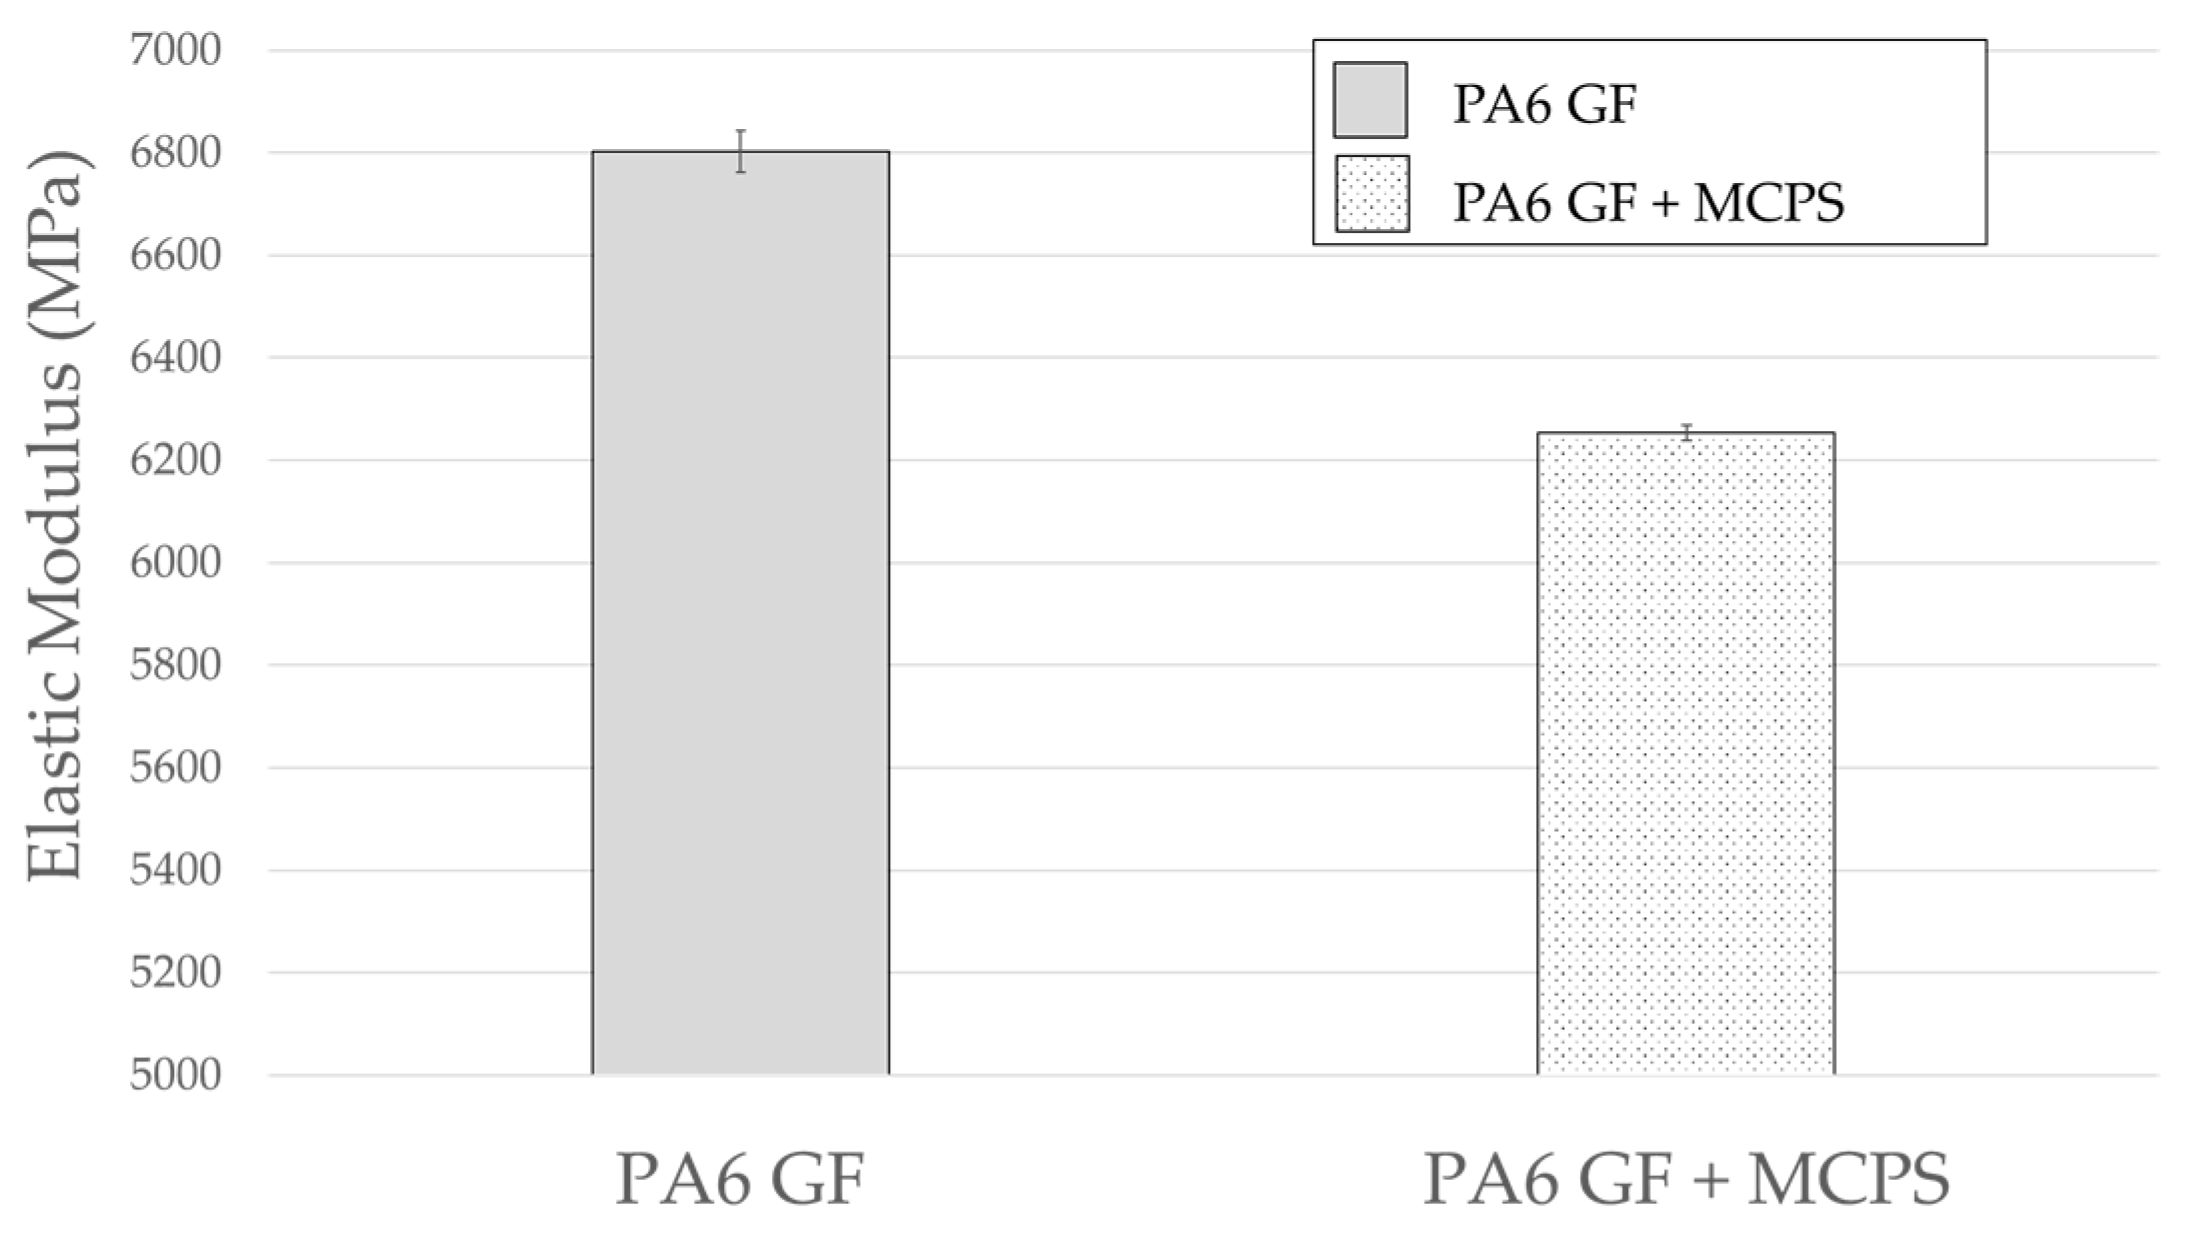
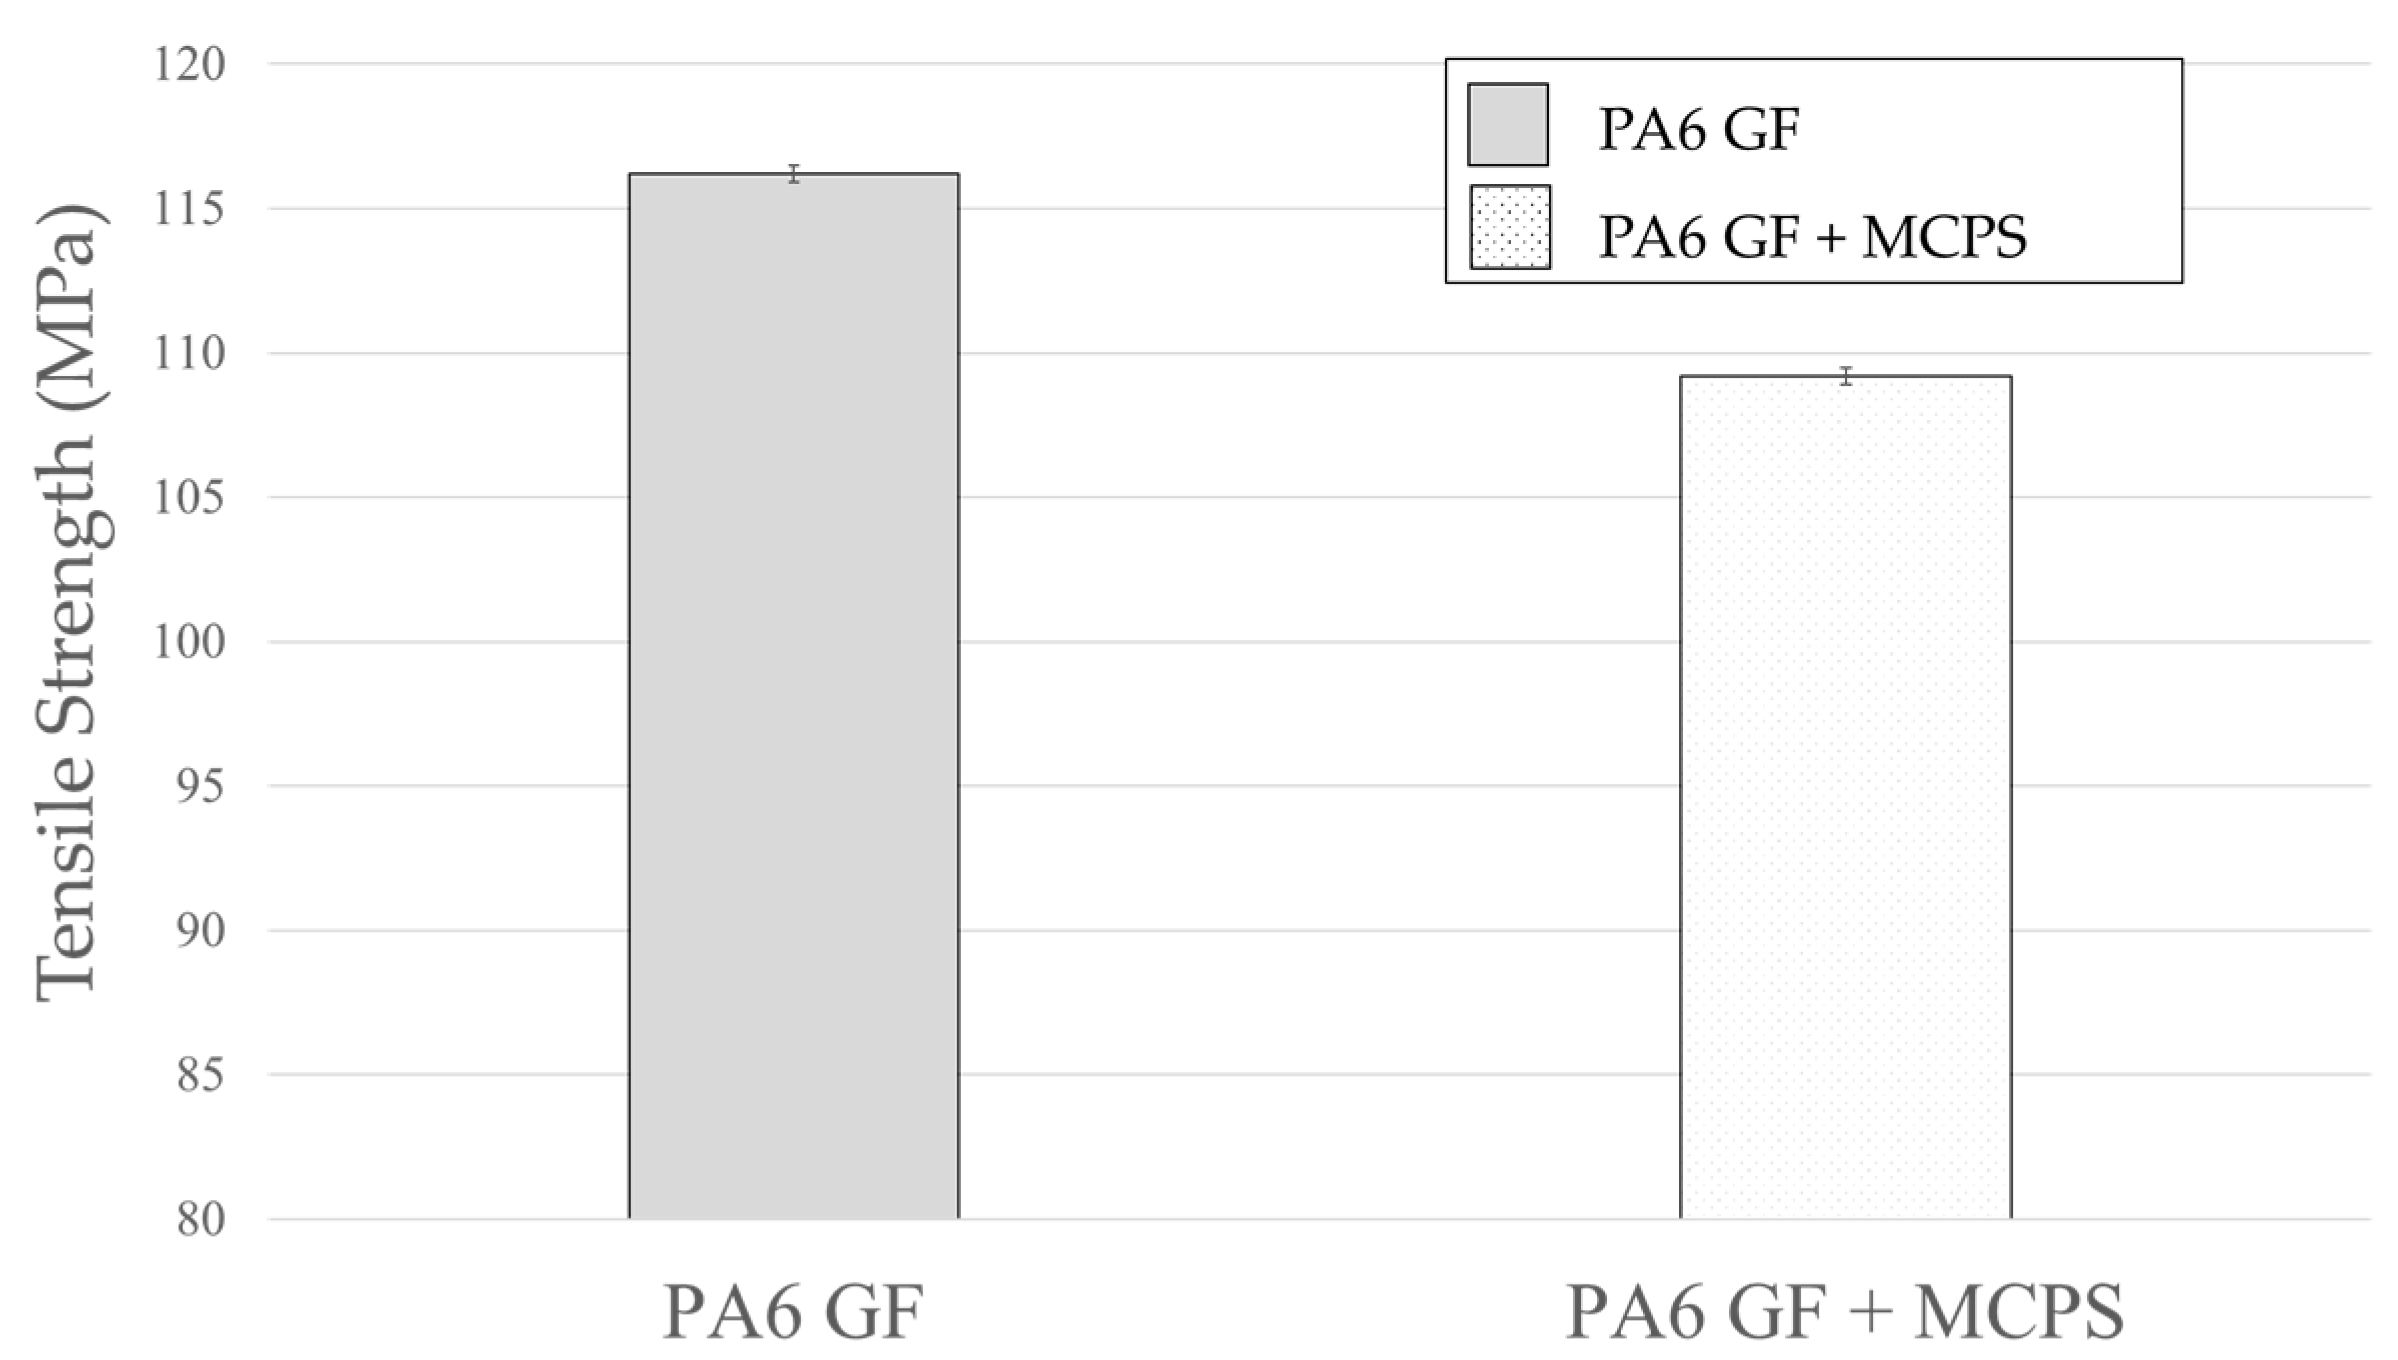
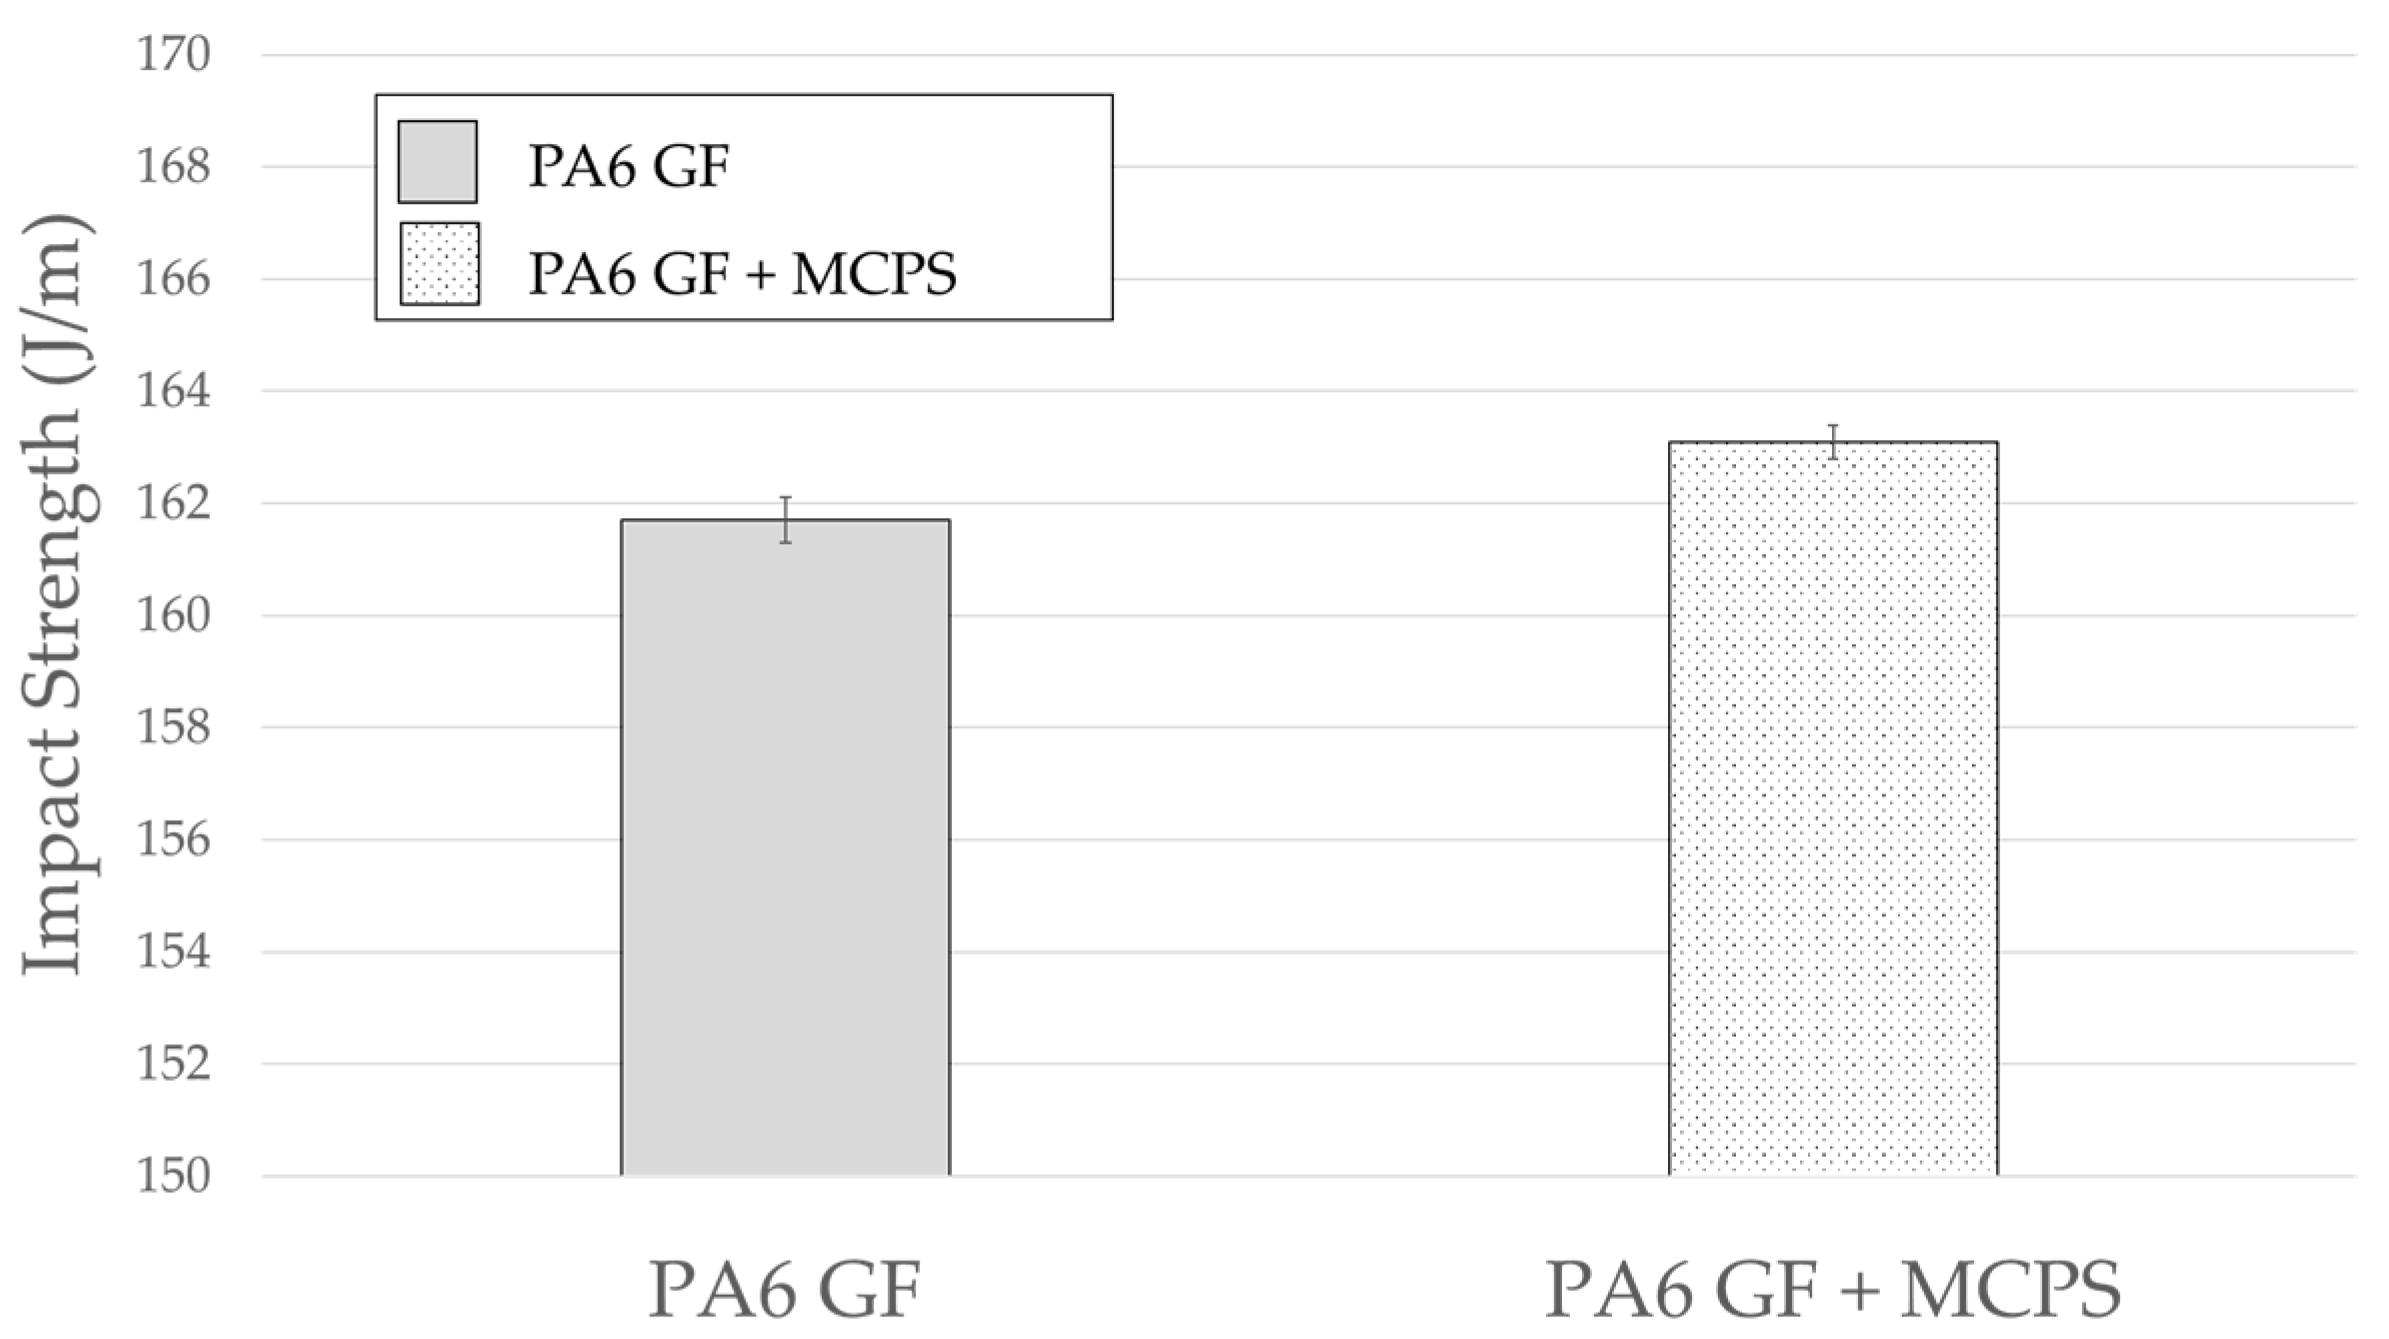
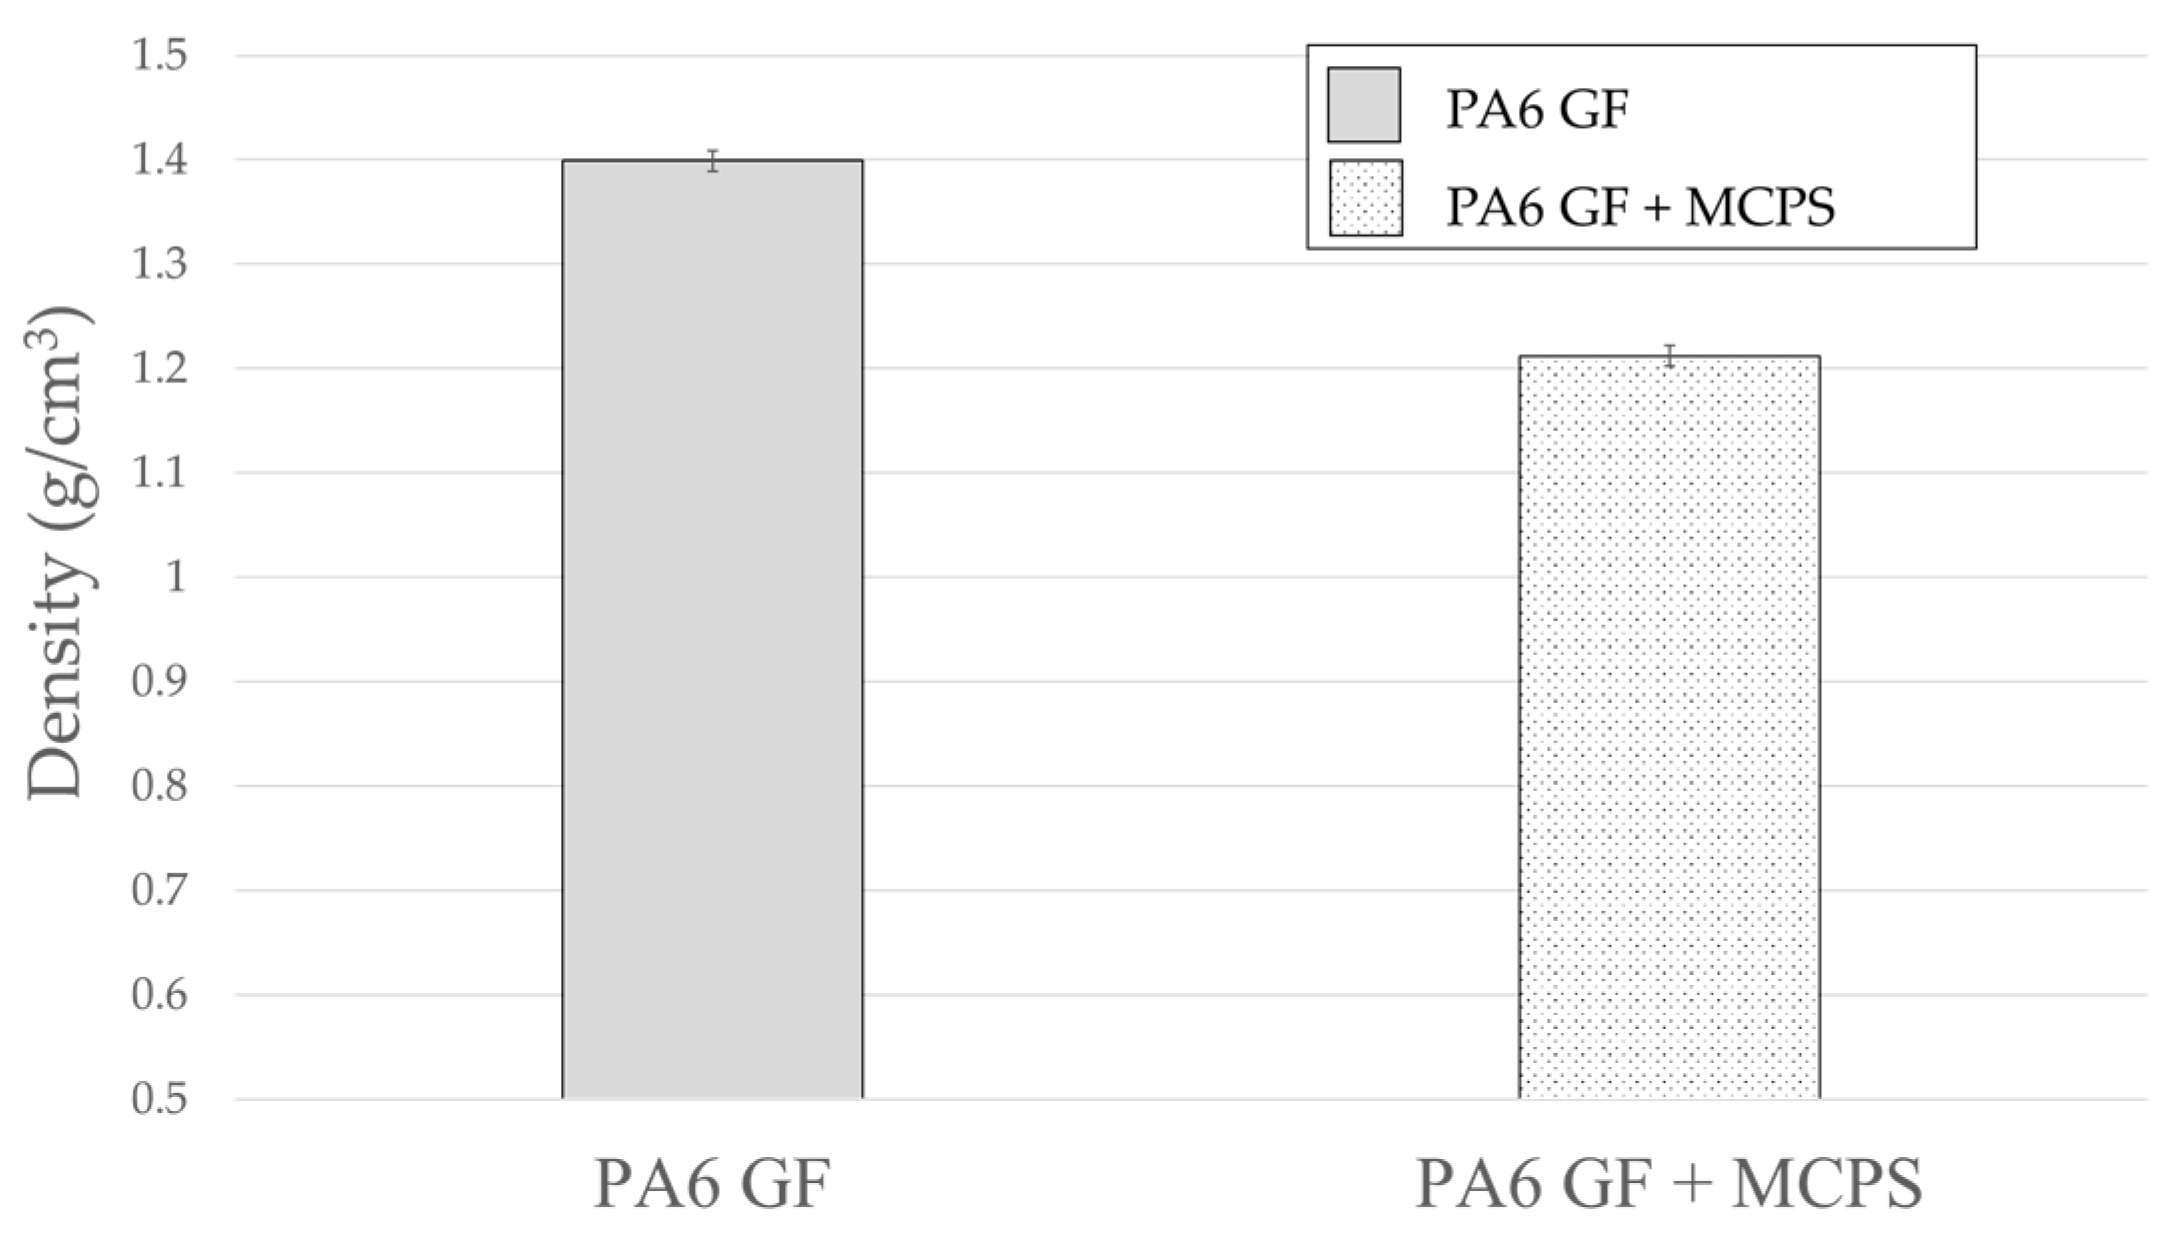
3.5. Mechanical Properties
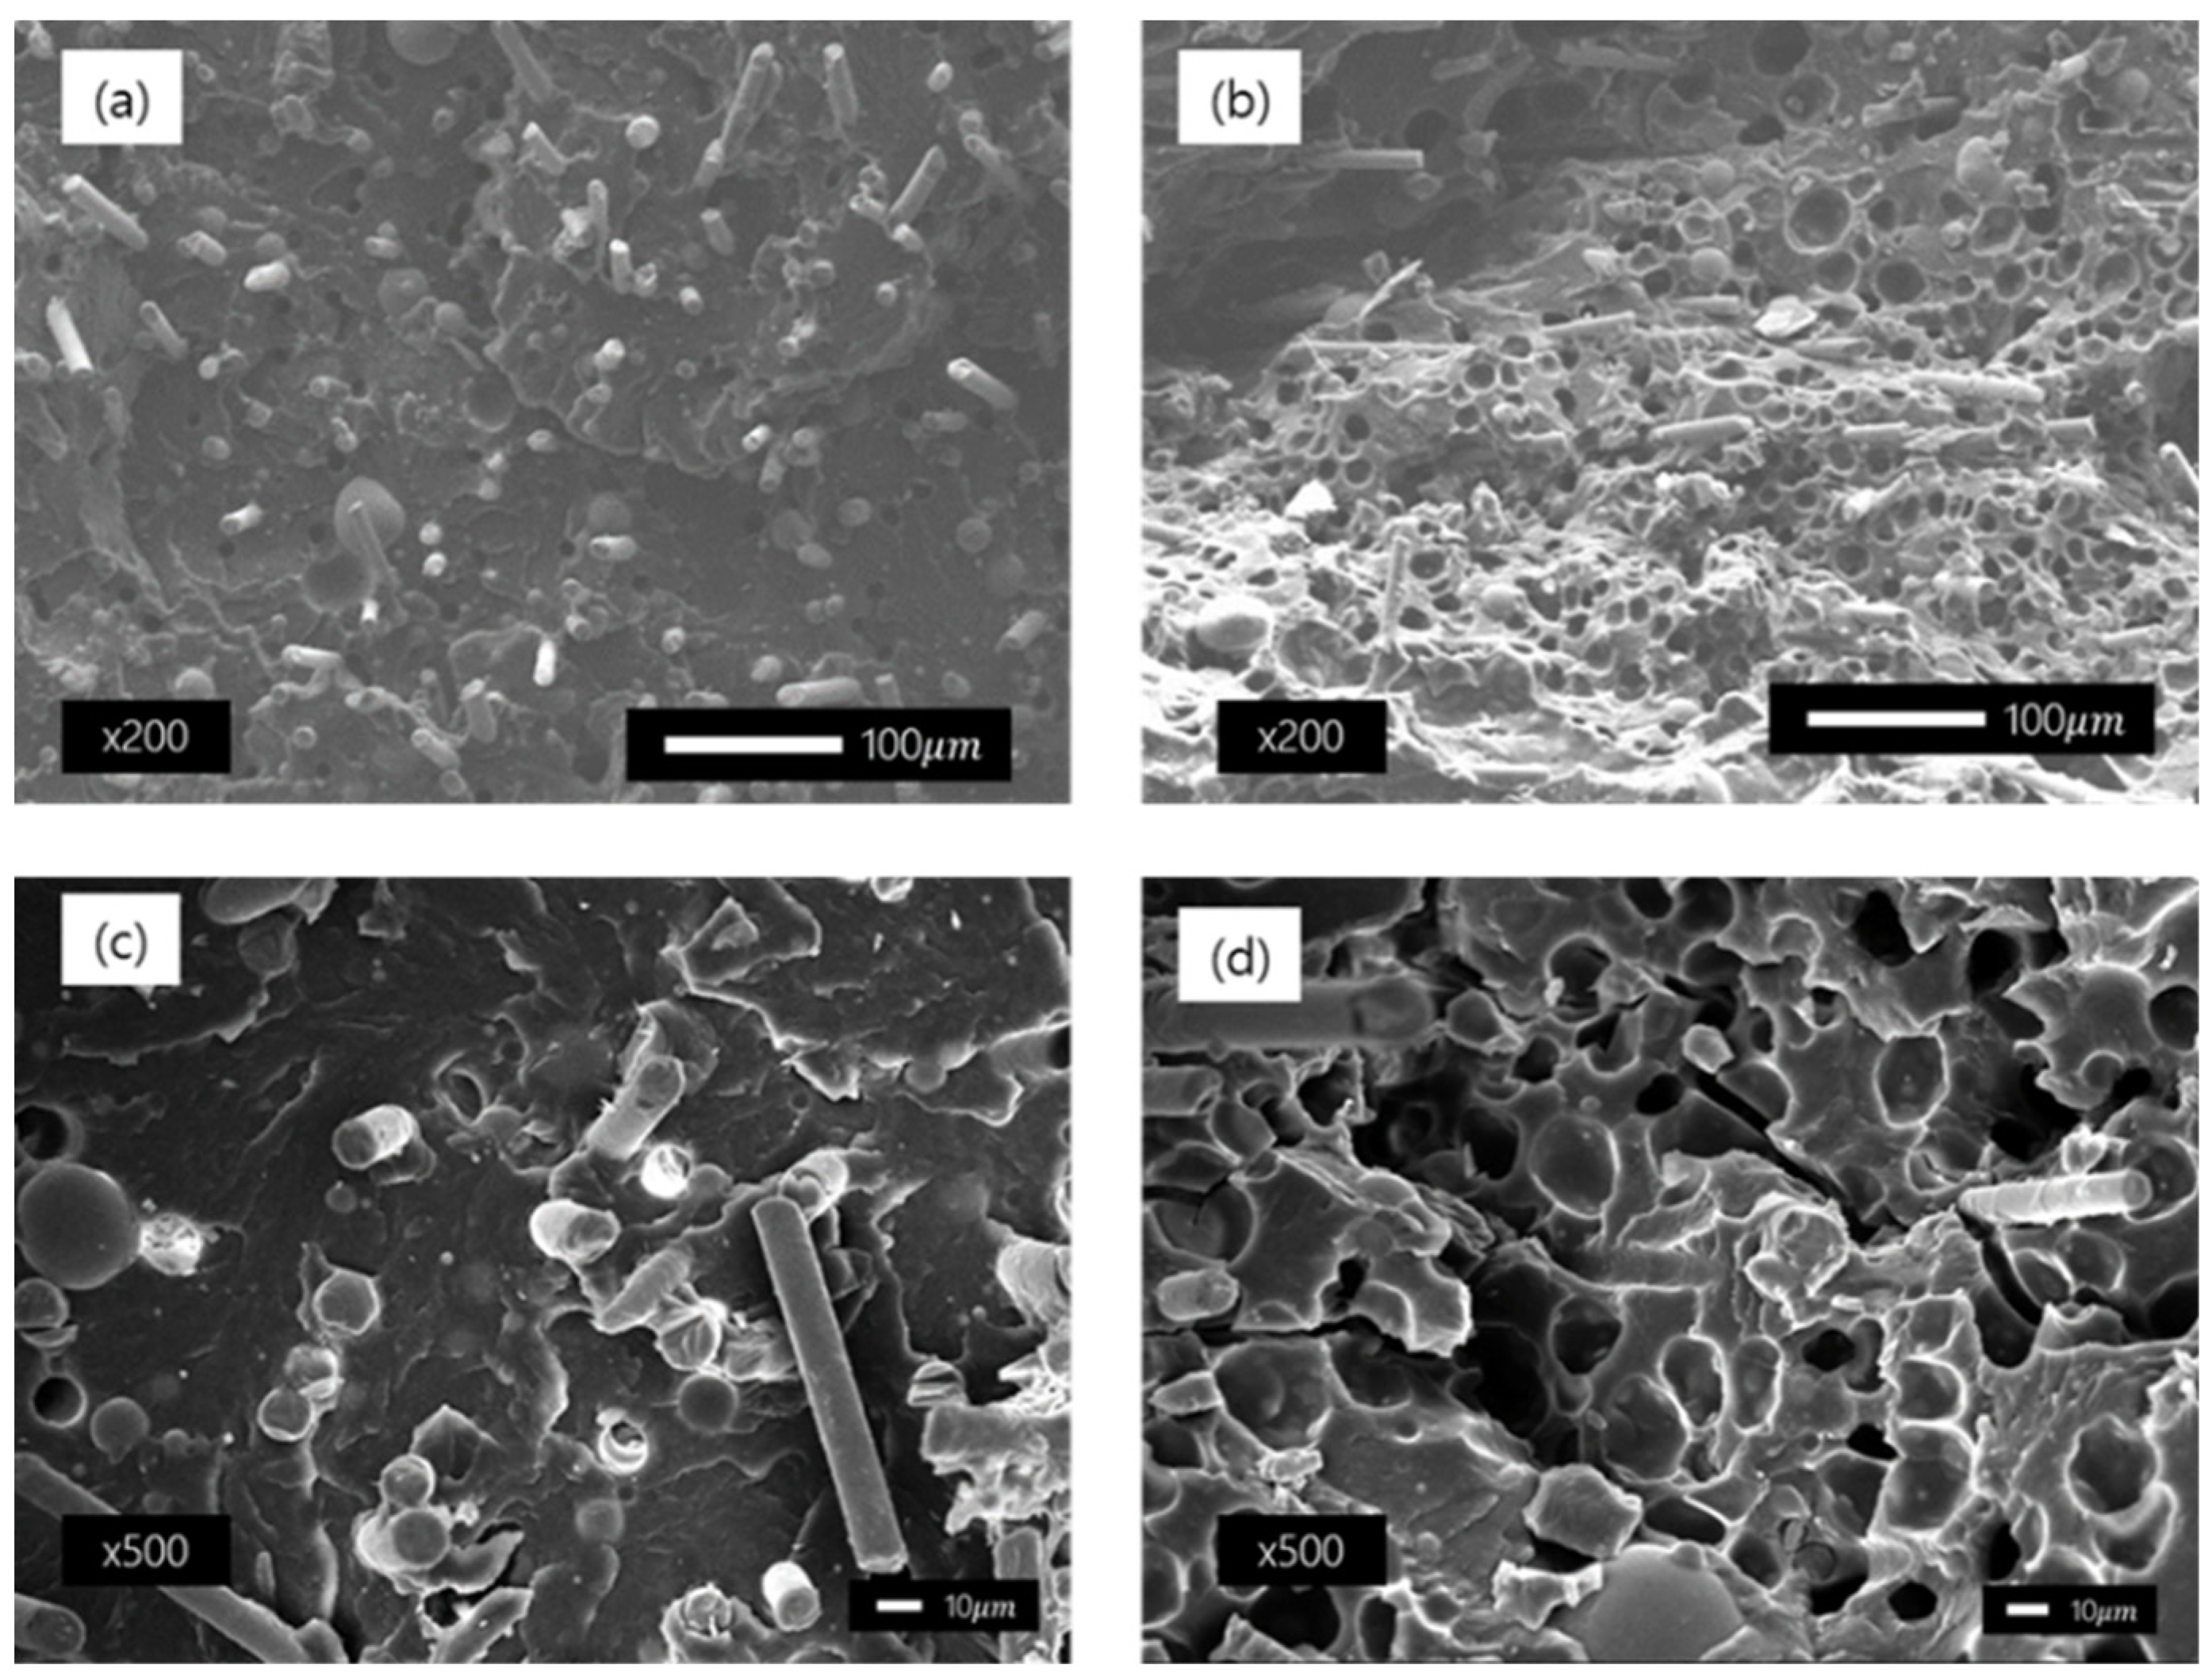
3.6. Cell Morphology
4. Conclusions
Author Contributions
Funding
Institutional Review Board Statement
Informed Consent Statement
Data Availability Statement
Conflicts of Interest
References
- Dipen, K.R.; Durgesh, D.P.; Pradeep, L.M.; Emanoil, L. Fiber-Reinforced Polymer Composites: Manufacturing, Properties, and Applications. Polymers 2019, 11, 1667. [Google Scholar] [CrossRef] [Green Version]
- Sherif, G.; Chukov, D.; Tcherdyntsev, V.; Torokhov, V. Effect of formation route on the mechanical properties of the polyethersulfone composites reinforced with glass fibers. Polymers 2019, 11, 1364. [Google Scholar] [CrossRef] [PubMed] [Green Version]
- Nobe, R.; Qiu, J.; Kudo, M.; Ito, K.; Kaneko, M. Effects of SCF content, injection speed, and CF content on the morphology and tensile properties of microcellular injection-molded CF/PP composites. Polym. Eng. Sci. 2019, 59, 1371–1380. [Google Scholar] [CrossRef]
- Liu, T.; Butaud, P.; Placet, V.; Ouiss, M. Damping behavior of plant fiber composites: A review. Compos. Struct. 2012, 275, 114392. [Google Scholar] [CrossRef]
- Gibson, R.F.; Ayrinde, E.O.; Wen, Y.F. Vibrations of carbon nanotubes and their composites: A review. Compos. Sci. Technol. 2007, 67, 1–28. [Google Scholar] [CrossRef]
- Duc, F.; Bourban, P.E.; Plummer, C.J.G.; Månson, J.-A.E. Damping of thermoset and thermoplastic flax fibre composites. Compos. Part A 2014, 64, 115–123. [Google Scholar] [CrossRef]
- Haim, A. Stability of composite stringer-stiffened panels. In Stability and Vibrations of Thin Walled Composite Structures; Woodhead Publishing: Sawston, UK; Cambridge, UK, 2017; pp. 461–507. [Google Scholar]
- Guen, M.J.L.; Newman, R.H.; Fernyhough, A.; Emms, G.W.; Staiger, M.P. The damping–modulus relationship in flax–carbon fibre hybrid composites. Compos. Part B Eng. 2016, 89, 27–33. [Google Scholar] [CrossRef]
- Lee, S.K.; Kim, M.W.; Park, C.J.; Chol, M.J.; Kim, G.; Cho, J.M.; Choi, C.H. Effect of fiber orientation on acoustic and vibration response of a carbon fiber/epoxy composite plate: Natural vibration mode and sound radiation. Int. J. Mech. Sci. 2016, 117, 162–173. [Google Scholar] [CrossRef]
- Kim, C.J. Comparison of Mode Shapes of Carbon-Fiber-Reinforced Plastic Material Considering Carbon Fiber Direction. Crystals 2021, 11, 311. [Google Scholar] [CrossRef]
- Li, H.; Ren, X.; Yu, C.; Xiong, J.; Wang, X.; Zhao, J. Investigation of vibro-acoustic characteristics of FRP plates with porous foam core. Int. J. Mech. Sci. 2021, 209, 106697. [Google Scholar] [CrossRef]
- Mohammed, Y.A.; Mohamed, K.H.; Ahmed, F.M.; Khalil, A. A Novel and Highly Effective Natural Vibration Modal Analysis to Predict Nominal Strength of Open Hole Glass Fiber Reinforced Polymer Composites Structure. Polymers 2021, 13, 1251. [Google Scholar] [CrossRef]
- Cha, S.W. A Microcellular Foaming/Forming Process Performed at Ambient Temperature and a Super Microcellular Foaming Process. Ph.D. Thesis, Massachusetts Institute of Technology, Cambridge, MA, USA, 1994. [Google Scholar]
- Cha, S.W.; Cho, S.H.; Sohn, J.S.; Ryu, Y.; Ahn, J. Reflectance according to Cell Size, Foaming Ratio, and Refractive Index of Microcellular Foamed Amorphous Polymer. Int. J. Mol. Sci. 2019, 20, 6068. [Google Scholar] [CrossRef] [PubMed] [Green Version]
- Moon, Y.; Cha, S.W.; Seo, J.H. Bubble nucleation and growth in microcellular injection molding processes. Polym. Plast. Technol. Eng. 2008, 47, 420–426. [Google Scholar] [CrossRef]
- Zhao, J.; Wang, G.; Chen, Z.; Huang, Y.; Wang, C.; Zhang, A.; Park, C.B. Microcellular injection molded outstanding oleophilic and sound-insulating PP/PTFE nanocomposite foam. Compos. Part B 2021, 215, 108786. [Google Scholar] [CrossRef]
- Jun, Y.S.; Hyun, B.G.; Hamidinejad, M.; Habibpour, S.; Yu, A.; Park, C.B. Maintaining electrical conductivity of microcellular MWCNT/TPU composites after deformation. Compos. Part B Eng. 2021, 223, 109–113. [Google Scholar] [CrossRef]
- Kim, H.K.; Sohn, J.S.; Ryu, Y.; Kim, S.W.; Cha, S.W. Warpage Reduction of Glass Fiber Reinforced Plastic Using Microcellular Foaming Process Applied Injection Molding. Polymers 2019, 11, 360. [Google Scholar] [CrossRef] [Green Version]
- Ryu, Y.; Sohn, J.S.; Yun, C.-S.; Cha, S.W. Shrinkage and Warpage Minimization of Glass-Fiber-Reinforced Polyamide 6 Parts by Microcellular Foam Injection Molding. Polymers 2020, 12, 889. [Google Scholar] [CrossRef]
- Mali, K.D.; Singru, P.M. Study on the Effect of the Impact Location and the Type of Hammer Tip on the Frequency Response Function (FRF) in Experimental Modal Analysis of Rectangular Plates. IOP Conf. Ser. Mater. Sci. Eng. 2018, 330, 012102. [Google Scholar] [CrossRef] [Green Version]
- Nofar, M.; Jahni, D.; Rizvi, G.; Park, C.B. Development of high void fraction polylactide composite foams using injection molding: Crystallization and foaming behaviors. Chem. Eng. J. 2015, 262, 78–87. [Google Scholar]
- Takada, M.; Hasegawa, S.; Ohshima, M. Crystallization kinetics of poly(l-lactide) in contact with pressurized CO2. Polym. Eng. Sci. 2004, 44, 186–196. [Google Scholar] [CrossRef]
- Nofar, M.; Zhu, W.; Park, C.B. Effect of dissolved CO2 on the crystallization behavior of linear and branched PLA. Polymer 2012, 53, 3341–3353. [Google Scholar] [CrossRef]
- Yousefi, A.H.; Memarzadeh, P.; Afshari, H.; Hosseini, S.J. Dynamic characteristics of truncated conical panels made of FRPs reinforced with agglomerated CNTs. Structures 2021, 33, 4701–4717. [Google Scholar] [CrossRef]
- Murugan, R.; Muthukumar, V.; Pradeepkumar, K.; Muthukumaran, A.; Rajesh, V. Influence of Fiber Orientation on Mechanical Properties and Free Vibration Characteristics of Glass/Hemp Hybrid Composite Laminates. Lecture Notes in Mechanical Engineering; Springer Nature: Berlin/Heidelberg, Germany, 2021; pp. 881–889. [Google Scholar]


| 1st Peak | 2nd Peak | ||
|---|---|---|---|
| PA6 | Natural Frequency (Hz) | 290 | 328 |
| Q factor | 10.79 | 10.97 | |
| Damping Ratio (%) | 4.63 | 4.56 | |
| PA6 + MCPs | Natural Frequency (Hz) | 262 | 312 |
| Q factor | 9.14 | 9.16 | |
| Damping Ratio (%) | 5.47 | 5.46 |
| Mode 1 | Mode 2 | Mode 3 | Mode 4 | ||
|---|---|---|---|---|---|
| PA6 | Natural Frequency (Hz) | 293 | 400 | 566 | 635 |
| Q factor | 0.65 | 1.58 | 3.04 | 2.43 | |
| Damping Ratio (%) | 76.84 | 31.67 | 16.43 | 20.57 | |
| PA6+MCPs | Natural Frequency (Hz) | 270 | 357 | 558 | 592 |
| Q factor | 0.56 | 0.93 | 2.28 | 2.44 | |
| Damping Ratio (%) | 89.76 | 53.5 | 21.9 | 20.53 |
| PA6 GF | PA6 GF + MCPs | |
|---|---|---|
| Mode 1 |  | 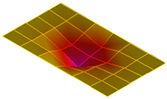 |
| Mode 2 | 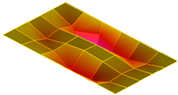 | 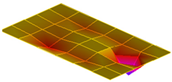 |
| Mode 3 | 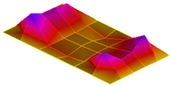 | 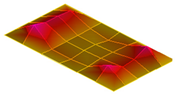 |
| Mode 4 |  | 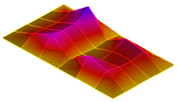 |
| Mode 1 | Mode 2 | Mode 3 | Mode 4 | Mode 5 | Mode 6 | Mode 7 | ||
|---|---|---|---|---|---|---|---|---|
| PA6 GF | Natural Frequency (Hz) | 25 | 51 | 125 | 155 | 225 | 297 | 400 |
| Q Factor | 6.76 | 4.24 | 7.82 | 5.17 | 12.56 | 12.89 | 10.72 | |
| Damping Ratio (%) | 7.40 | 11.78 | 6.39 | 9.67 | 3.98 | 3.88 | 4.66 | |
| PA6 GF + MCPs | Natural Frequency (Hz) | 25 | 53 | 118 | 146 | 213 | 279 | 372 |
| Q Factor | 6.36 | 4.94 | 2.70 | 5.68 | 2.28 | 12.02 | 8.33 | |
| Damping Ratio (%) | 7.86 | 10.13 | 18.50 | 8.81 | 21.95 | 4.16 | 6.00 |
| PA6 GF | PA6 GF + MCPs | |
|---|---|---|
| Mode 1 | 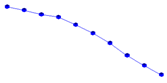 | 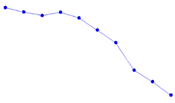 |
| Mode 2 |  | 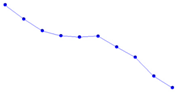 |
| Mode 3 |  |  |
| Mode 4 |  |  |
Publisher’s Note: MDPI stays neutral with regard to jurisdictional claims in published maps and institutional affiliations. |
© 2022 by the authors. Licensee MDPI, Basel, Switzerland. This article is an open access article distributed under the terms and conditions of the Creative Commons Attribution (CC BY) license (https://creativecommons.org/licenses/by/4.0/).
Share and Cite
Kim, H.K.; Kim, J.; Kim, D.; Ryu, Y.; Cha, S.W. Vibration and Sound Response of Glass-Fiber-Reinforced Polyamide 6 Using Microcellular-Foaming-Process-Applied Injection Molding Process. Polymers 2022, 14, 173. https://doi.org/10.3390/polym14010173
Kim HK, Kim J, Kim D, Ryu Y, Cha SW. Vibration and Sound Response of Glass-Fiber-Reinforced Polyamide 6 Using Microcellular-Foaming-Process-Applied Injection Molding Process. Polymers. 2022; 14(1):173. https://doi.org/10.3390/polym14010173
Chicago/Turabian StyleKim, Hyun Keun, Jaehoo Kim, Donghwi Kim, Youngjae Ryu, and Sung Woon Cha. 2022. "Vibration and Sound Response of Glass-Fiber-Reinforced Polyamide 6 Using Microcellular-Foaming-Process-Applied Injection Molding Process" Polymers 14, no. 1: 173. https://doi.org/10.3390/polym14010173
APA StyleKim, H. K., Kim, J., Kim, D., Ryu, Y., & Cha, S. W. (2022). Vibration and Sound Response of Glass-Fiber-Reinforced Polyamide 6 Using Microcellular-Foaming-Process-Applied Injection Molding Process. Polymers, 14(1), 173. https://doi.org/10.3390/polym14010173