X-ray Structure Refinement and Vibrational Spectroscopy of Metavauxite FeAl2(PO4)2(OH)2·8H2O

 ,
,  , and
, and
Abstract
1. Introduction
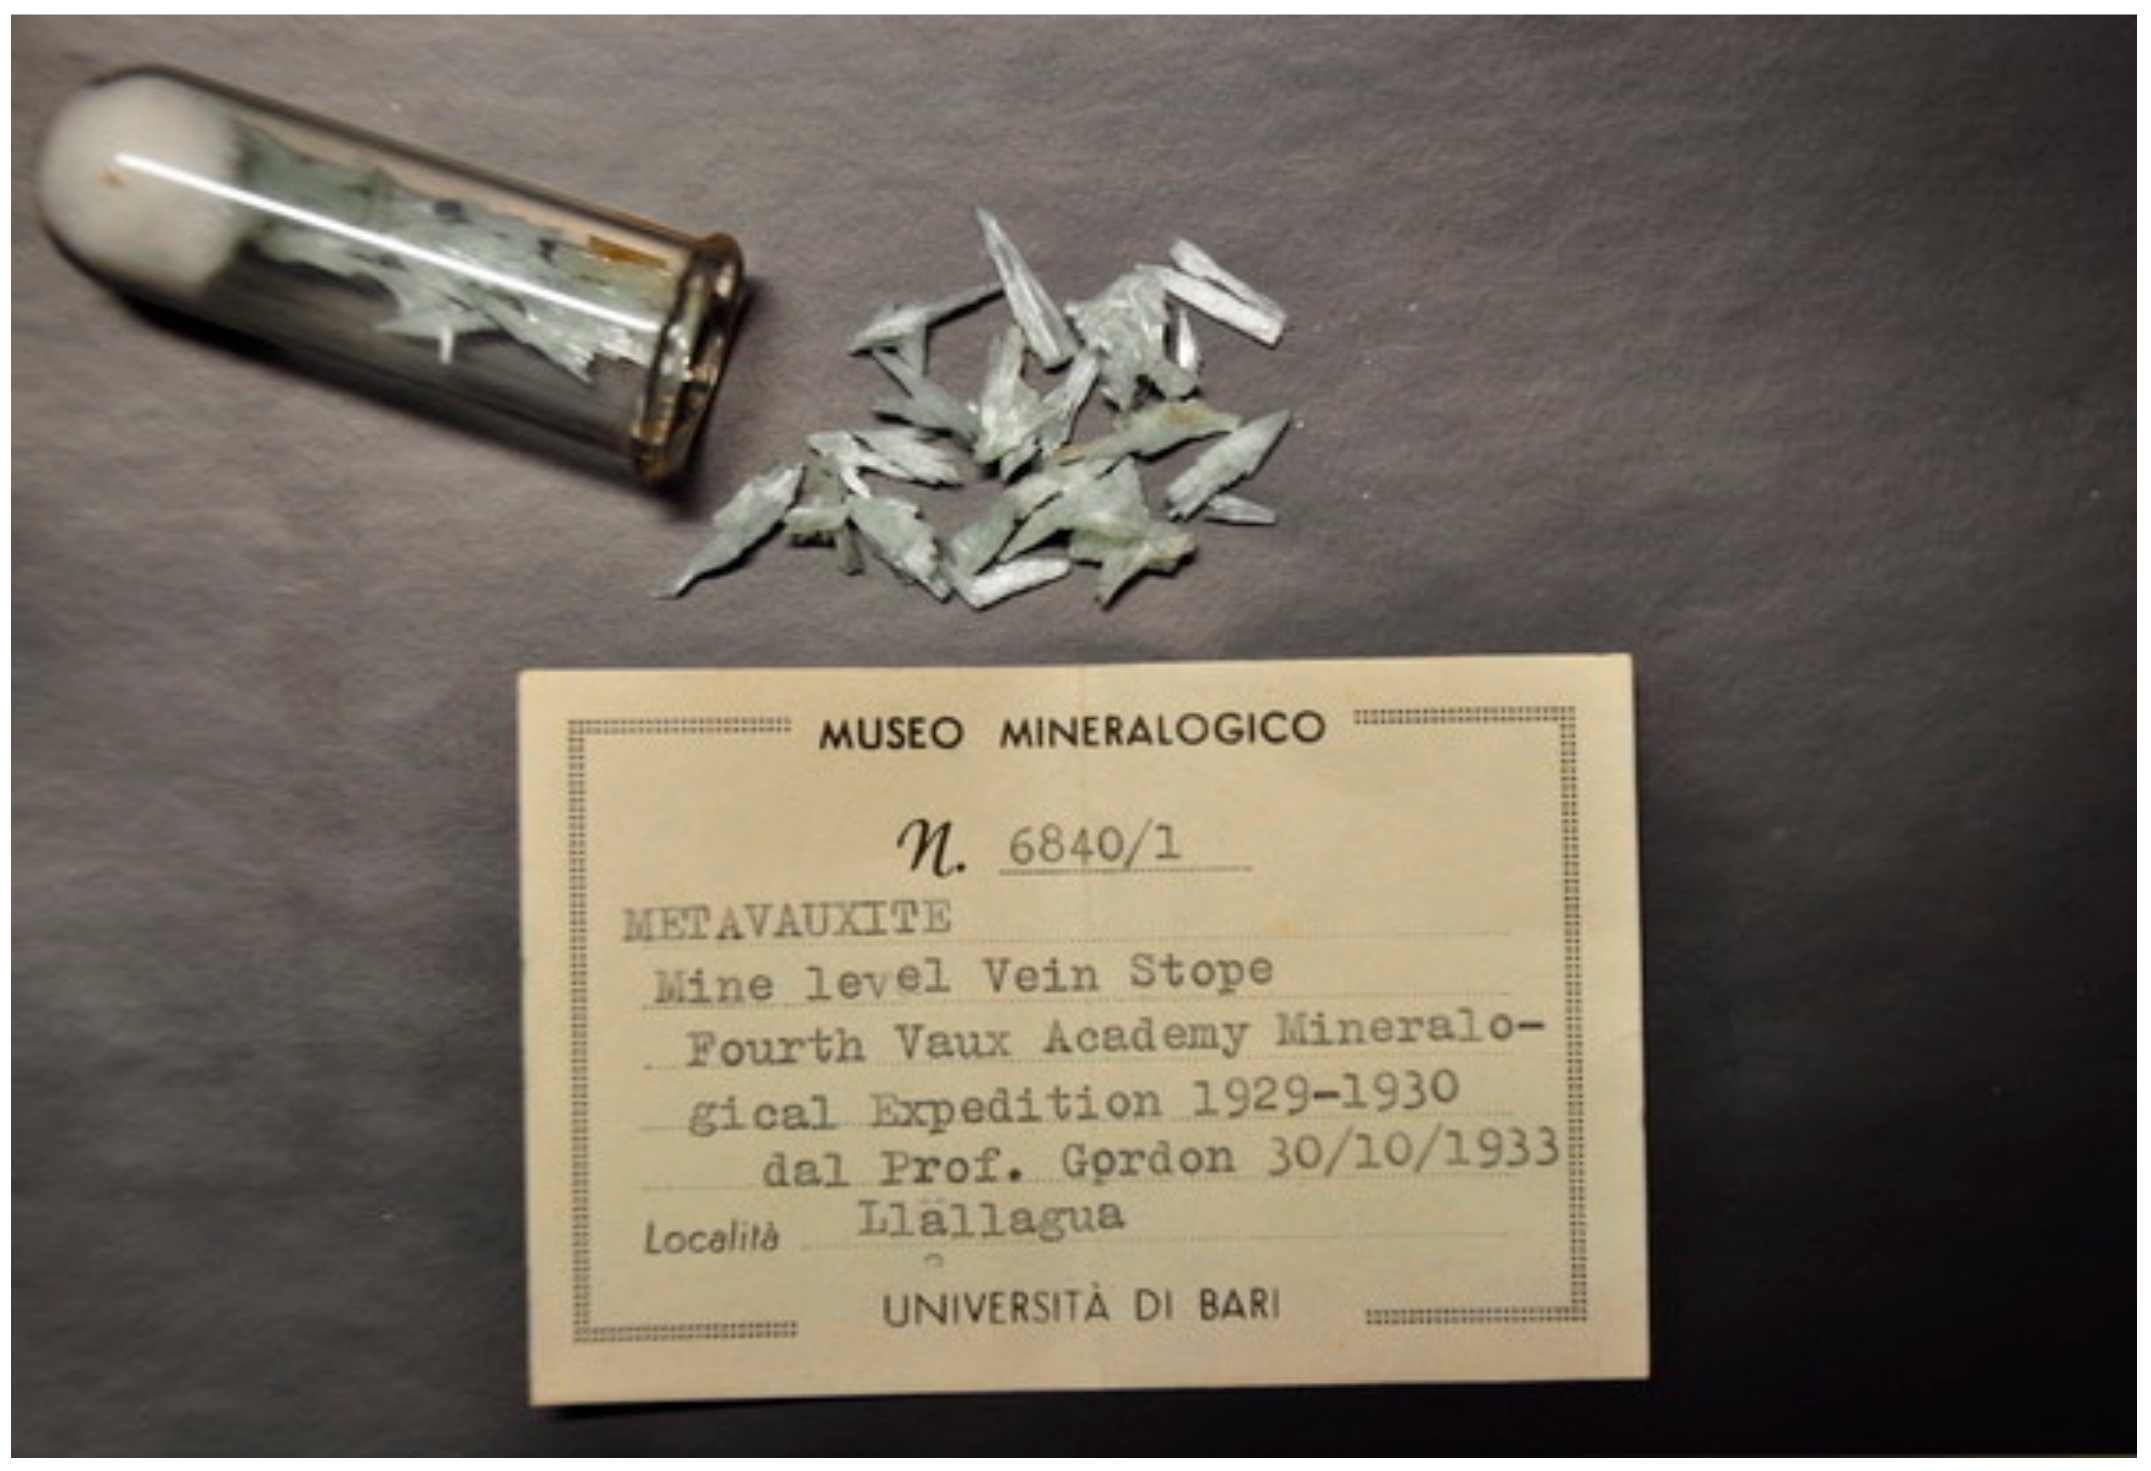
2. Studied Sample and Experimental Methods
3. Results and Discussion
3.1. Microchemical Composition of the Studied Sample
3.2. X-ray Structure Refinement
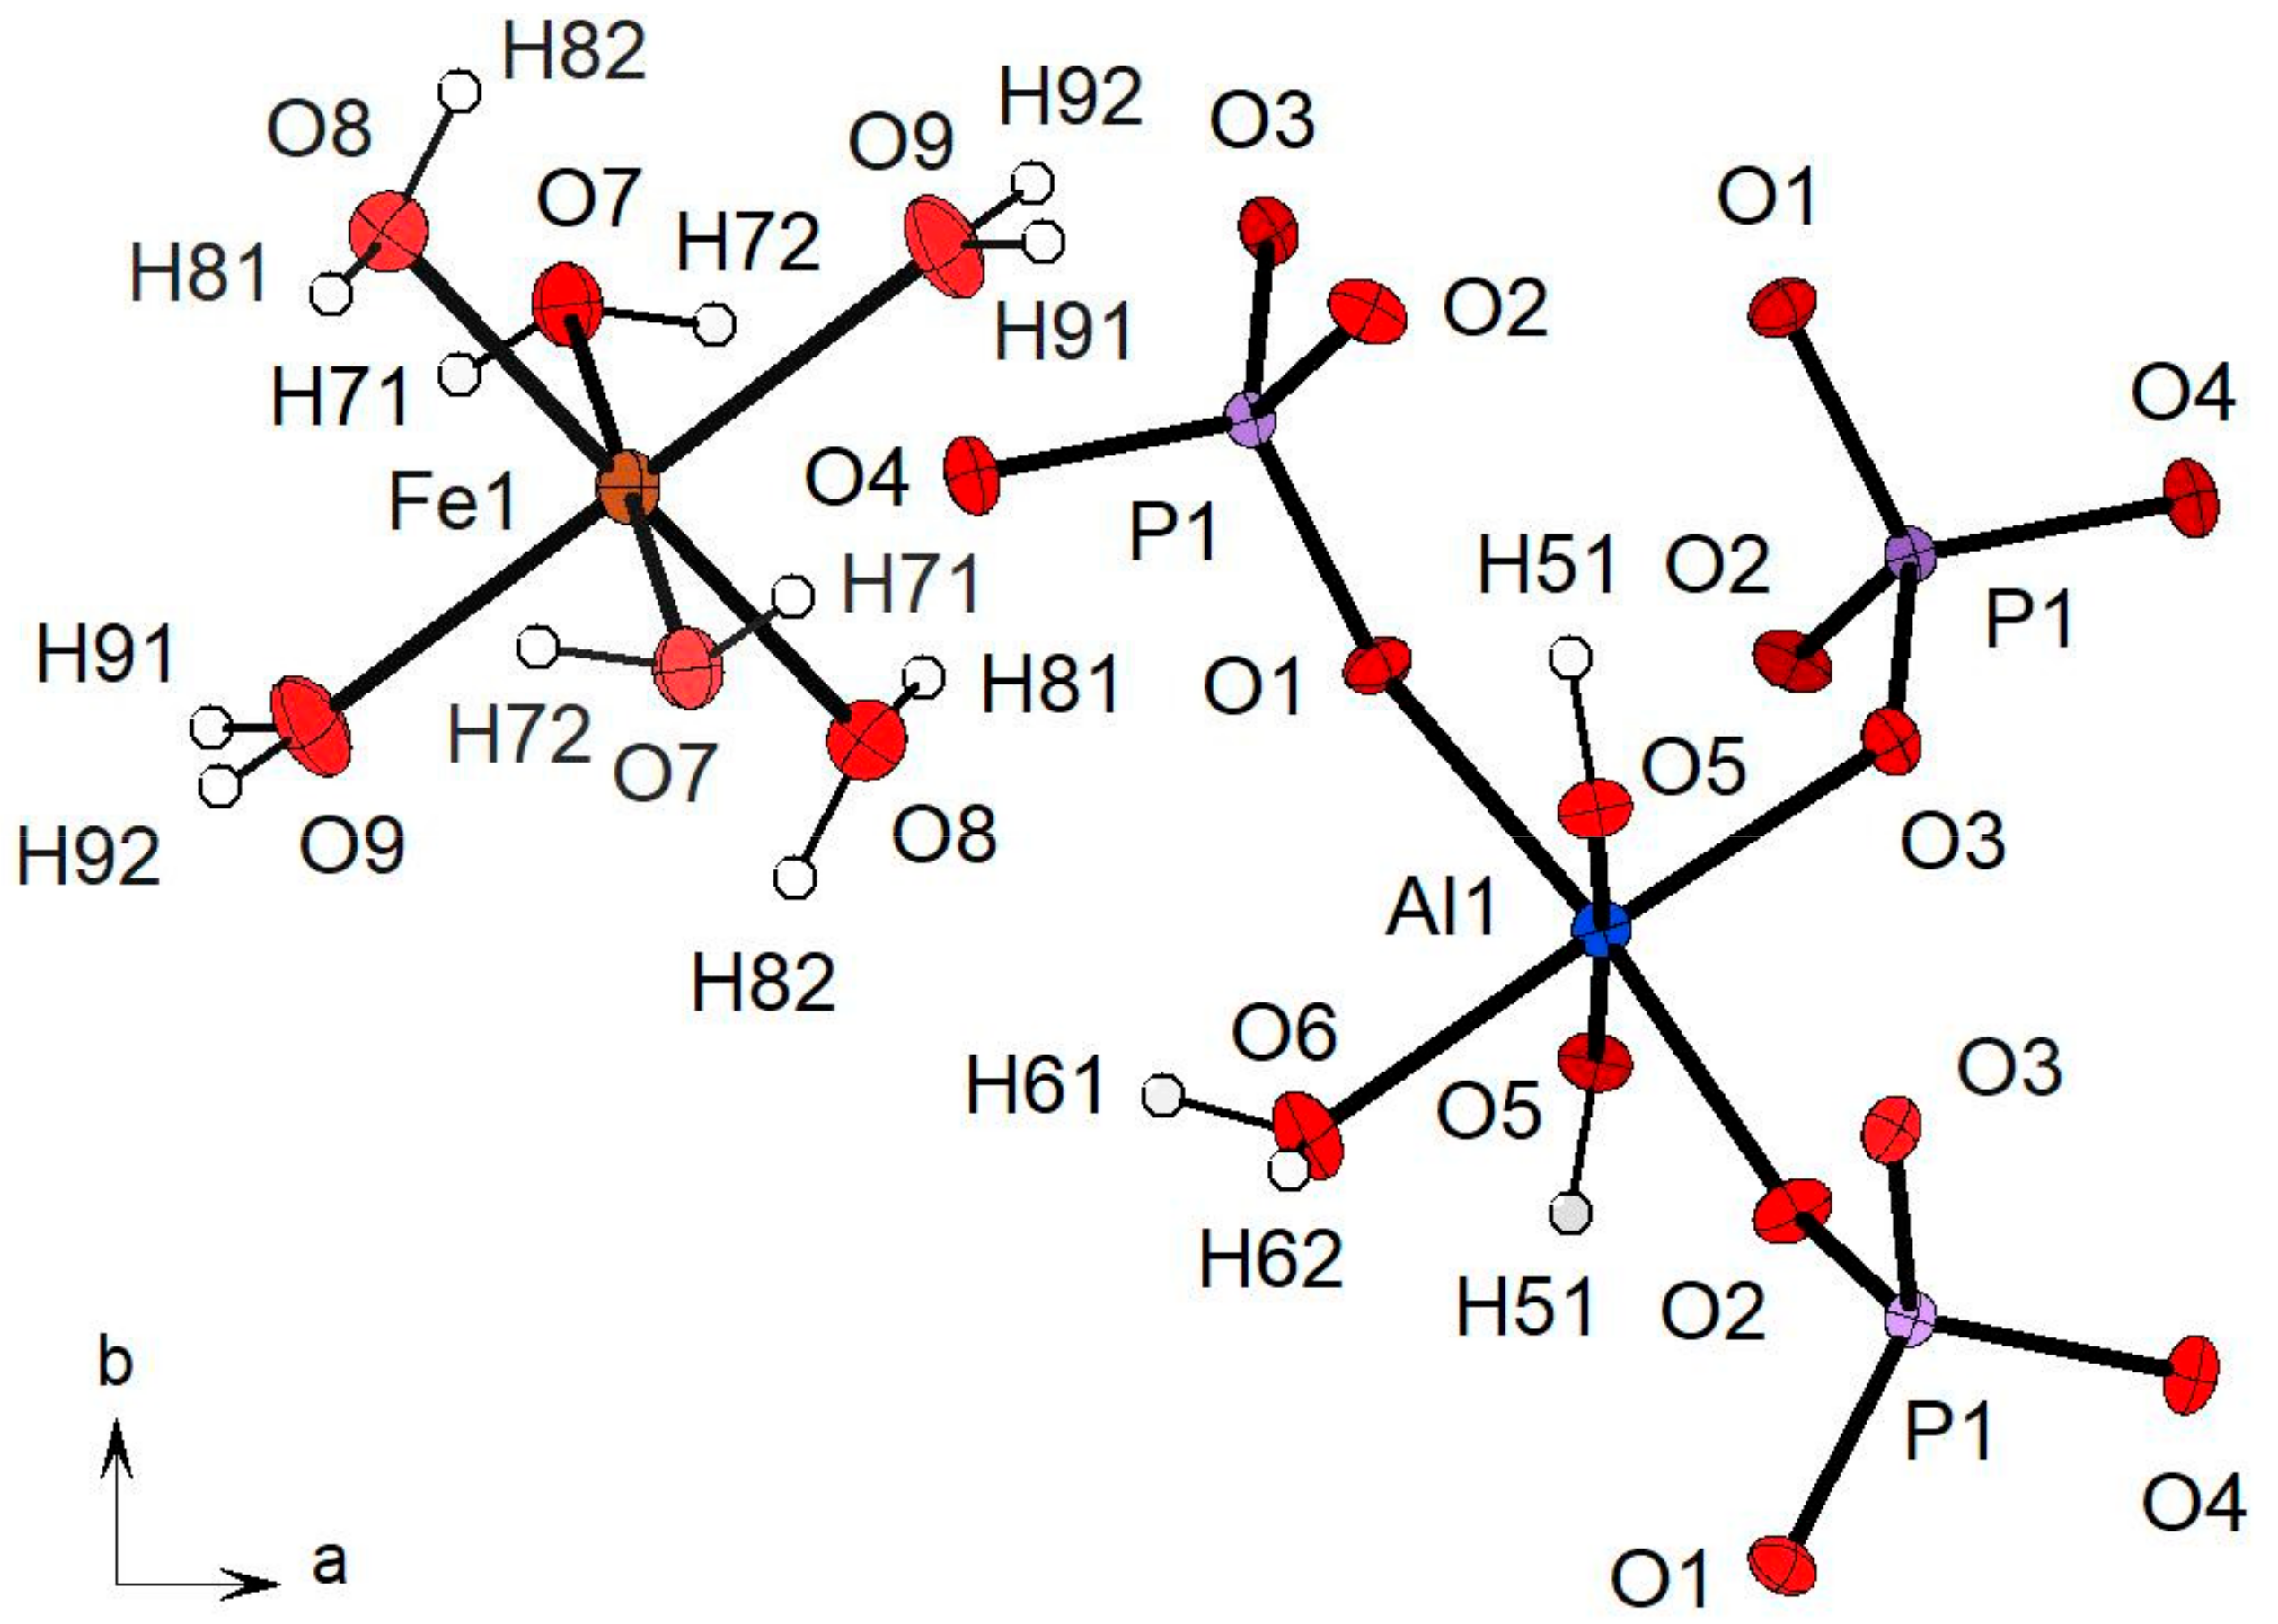
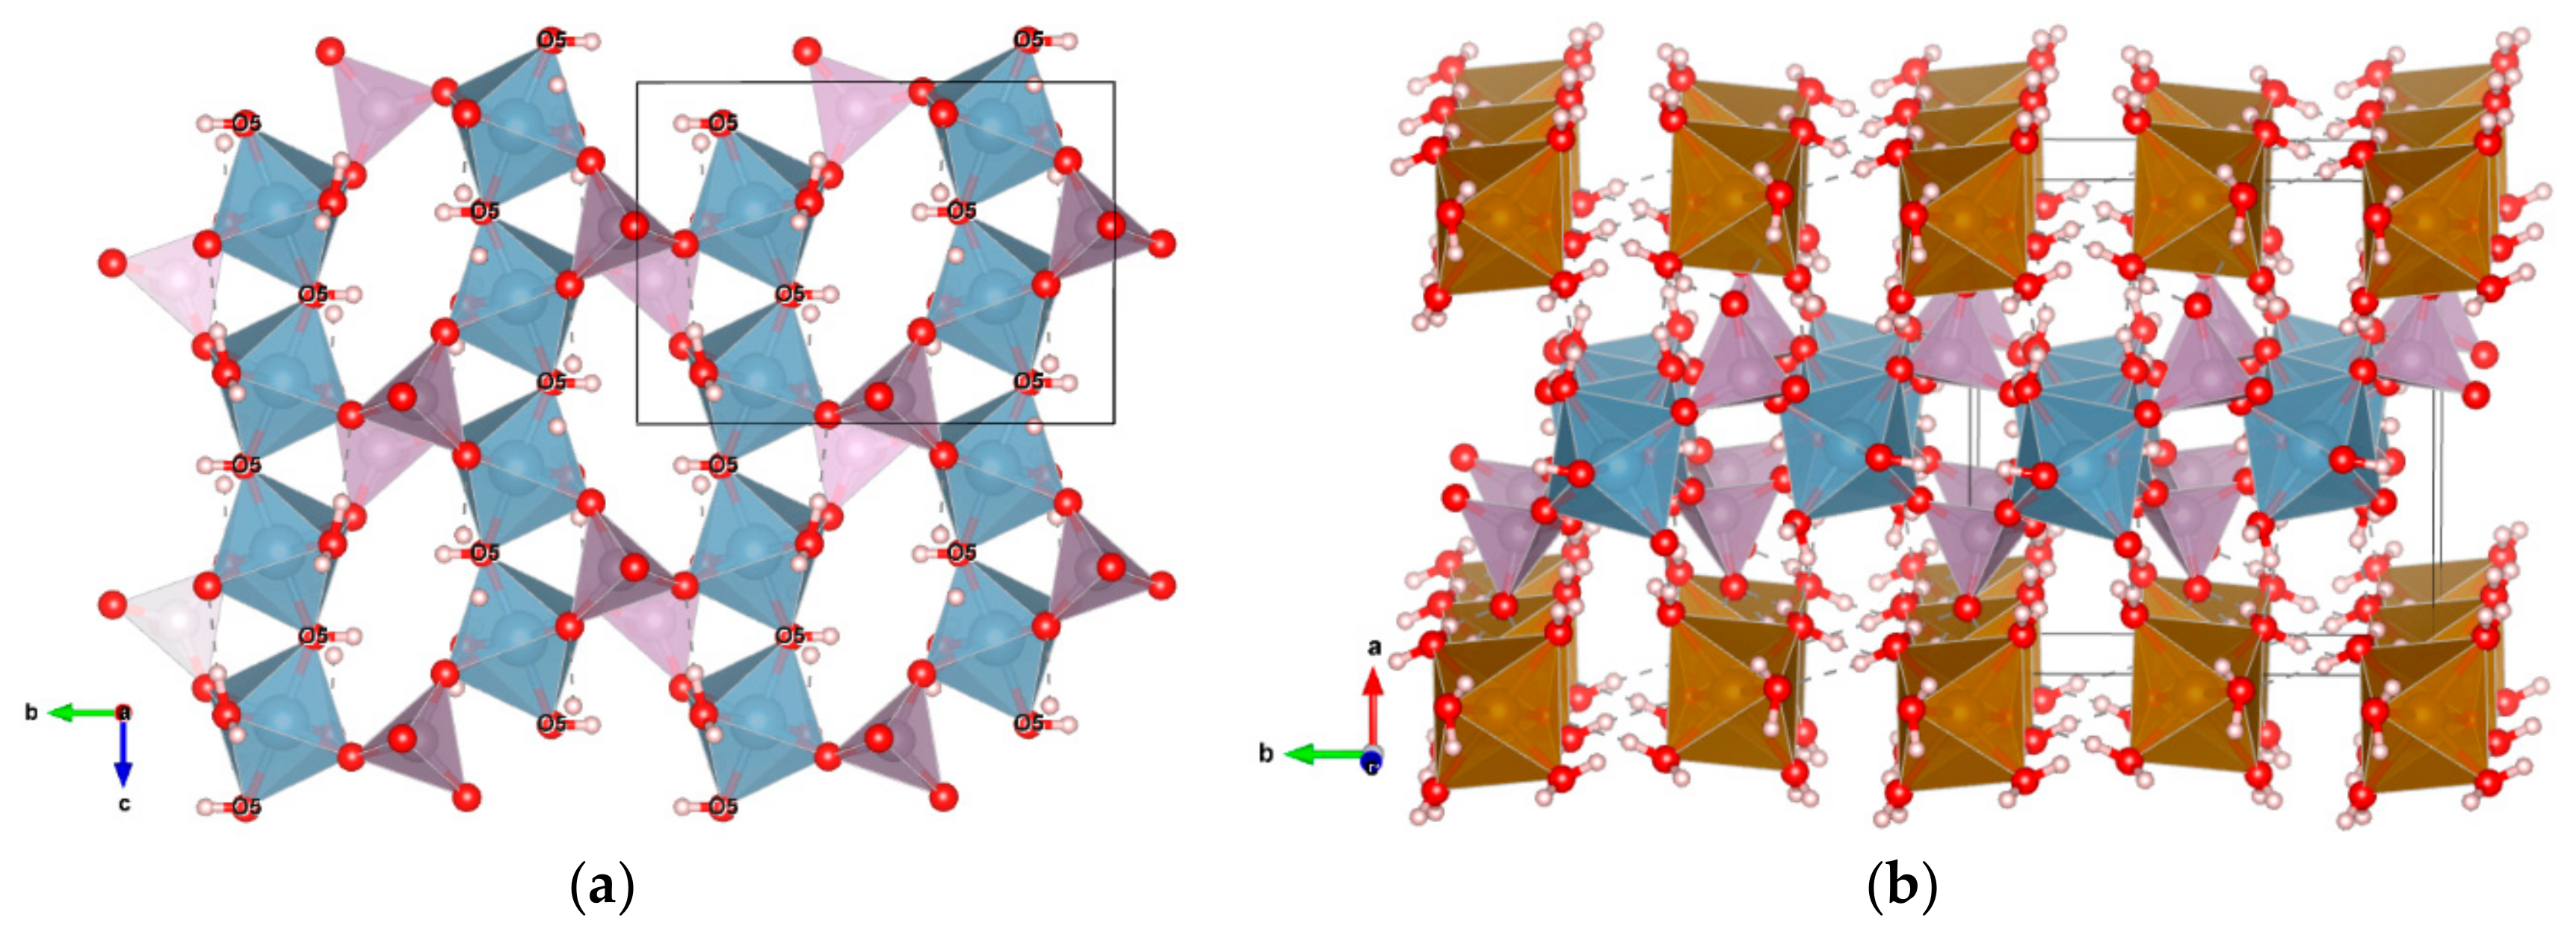
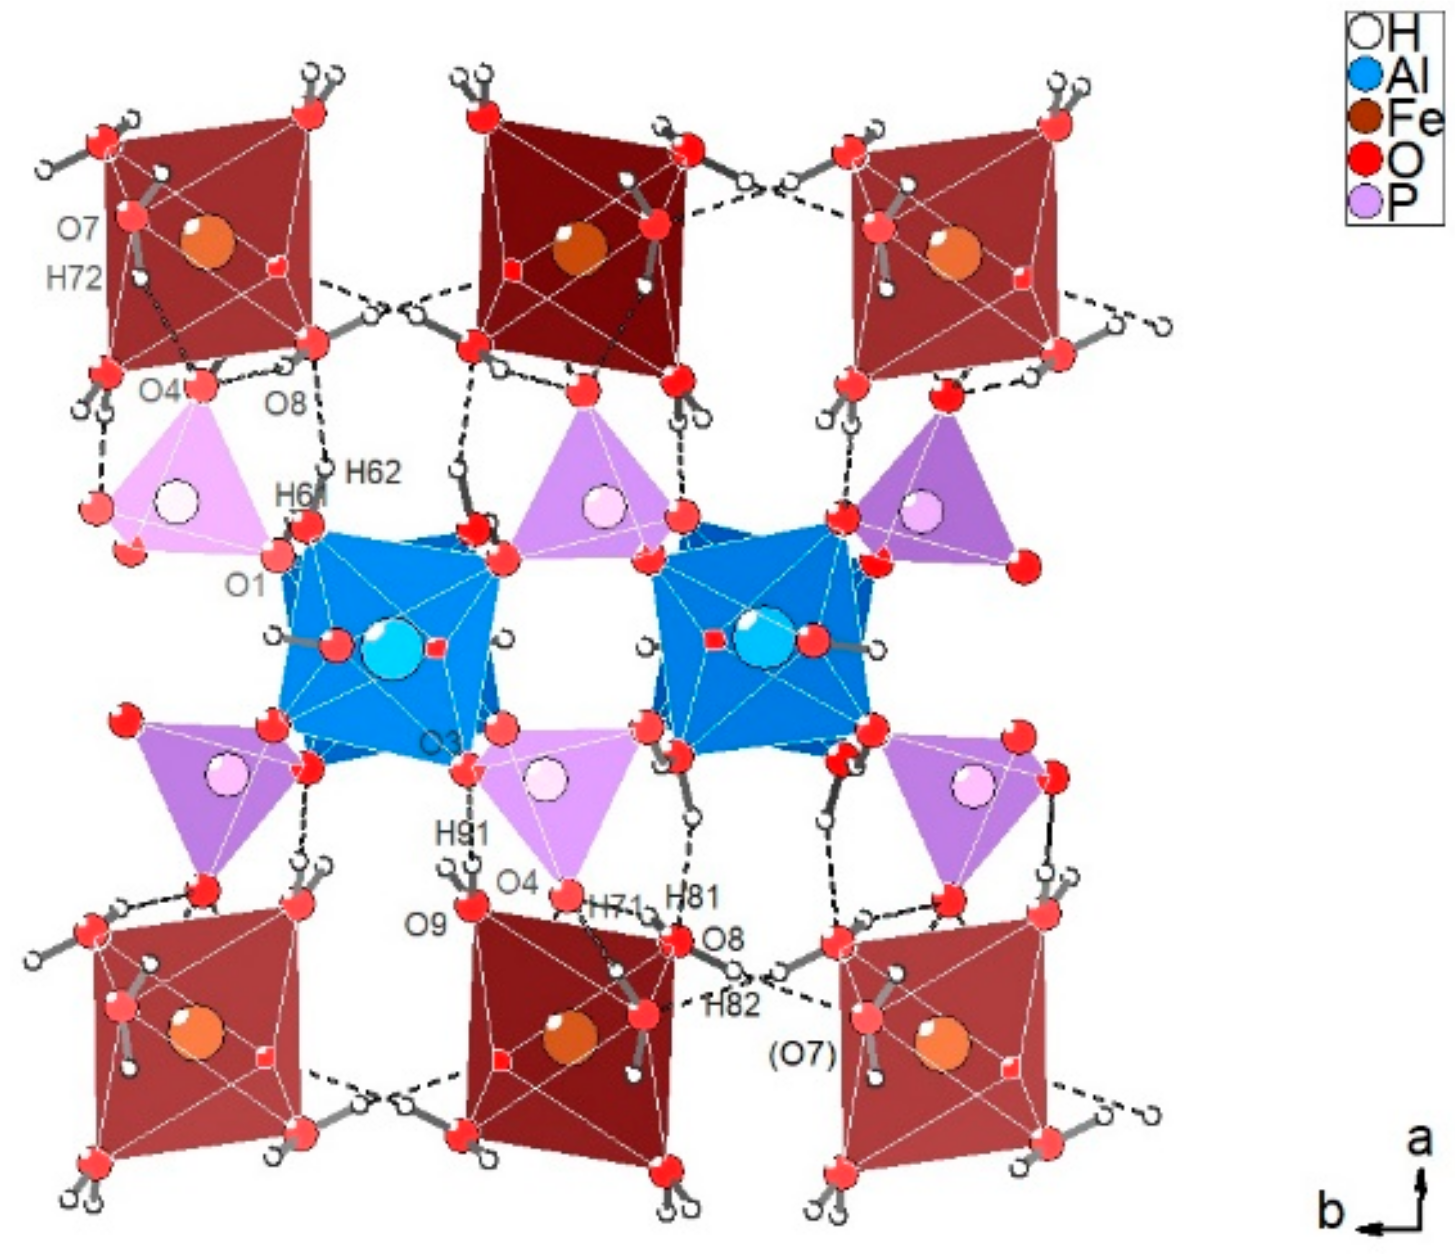
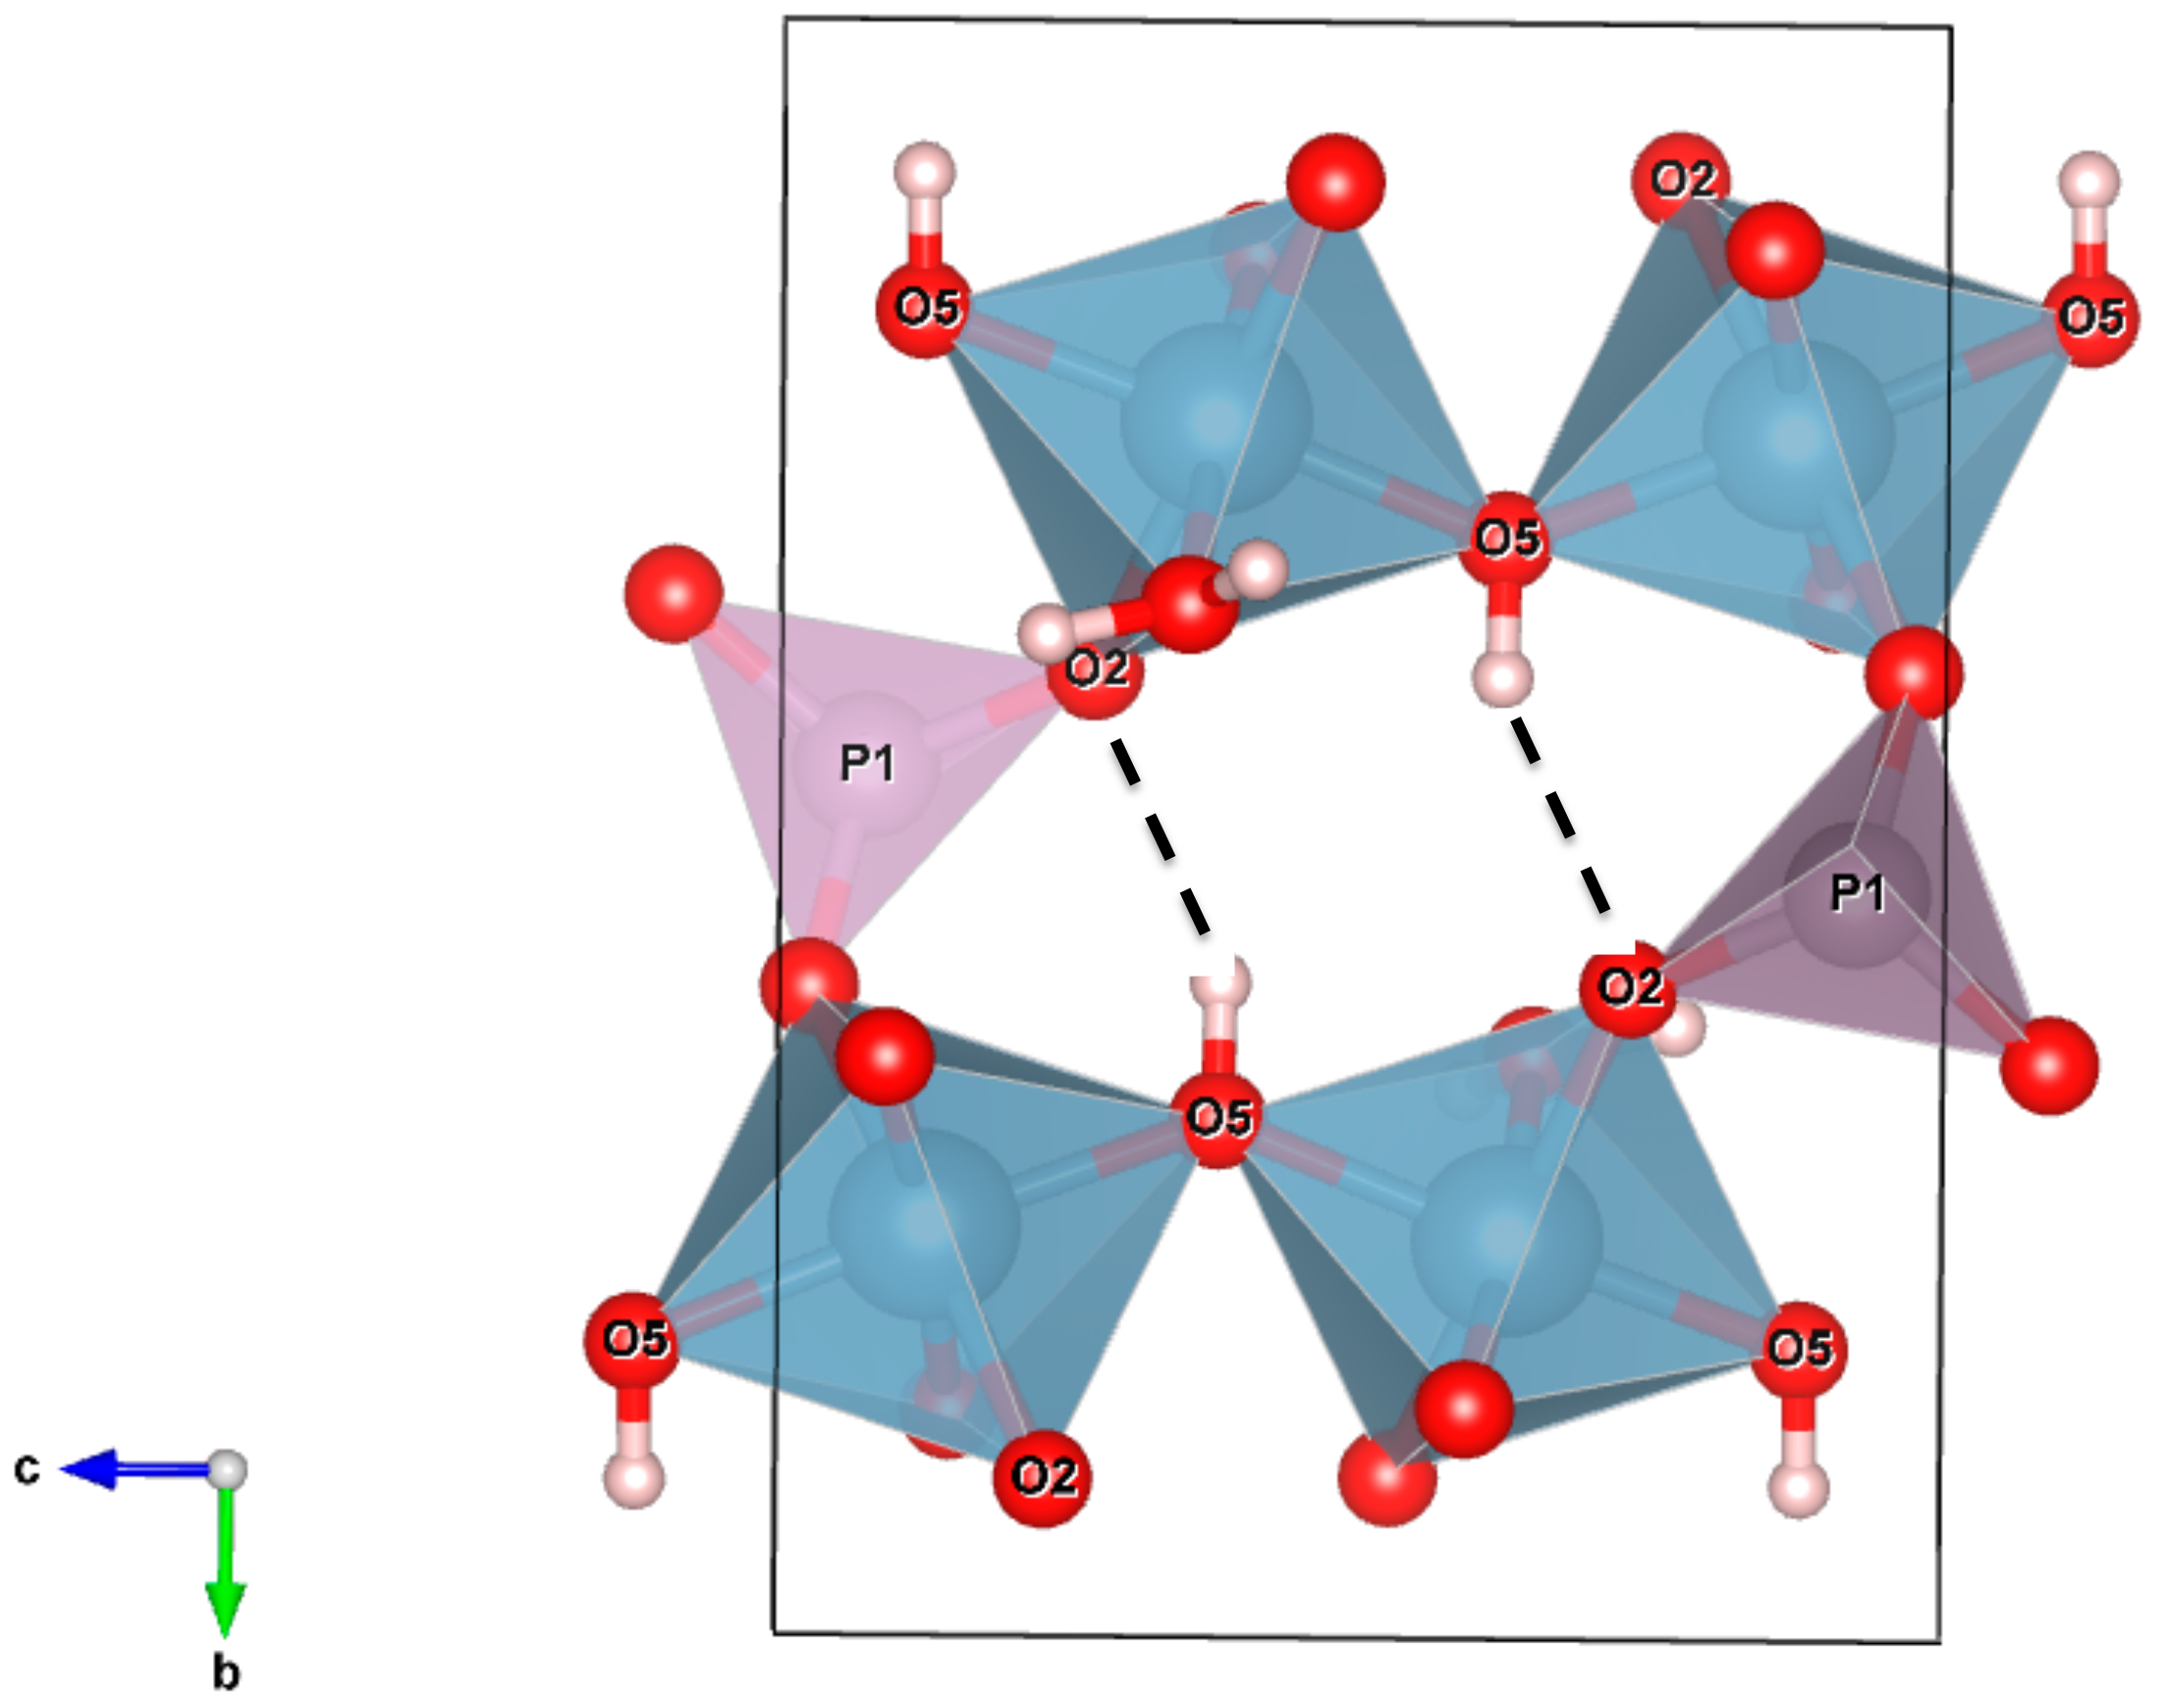
3.2.1. Description of the Structure
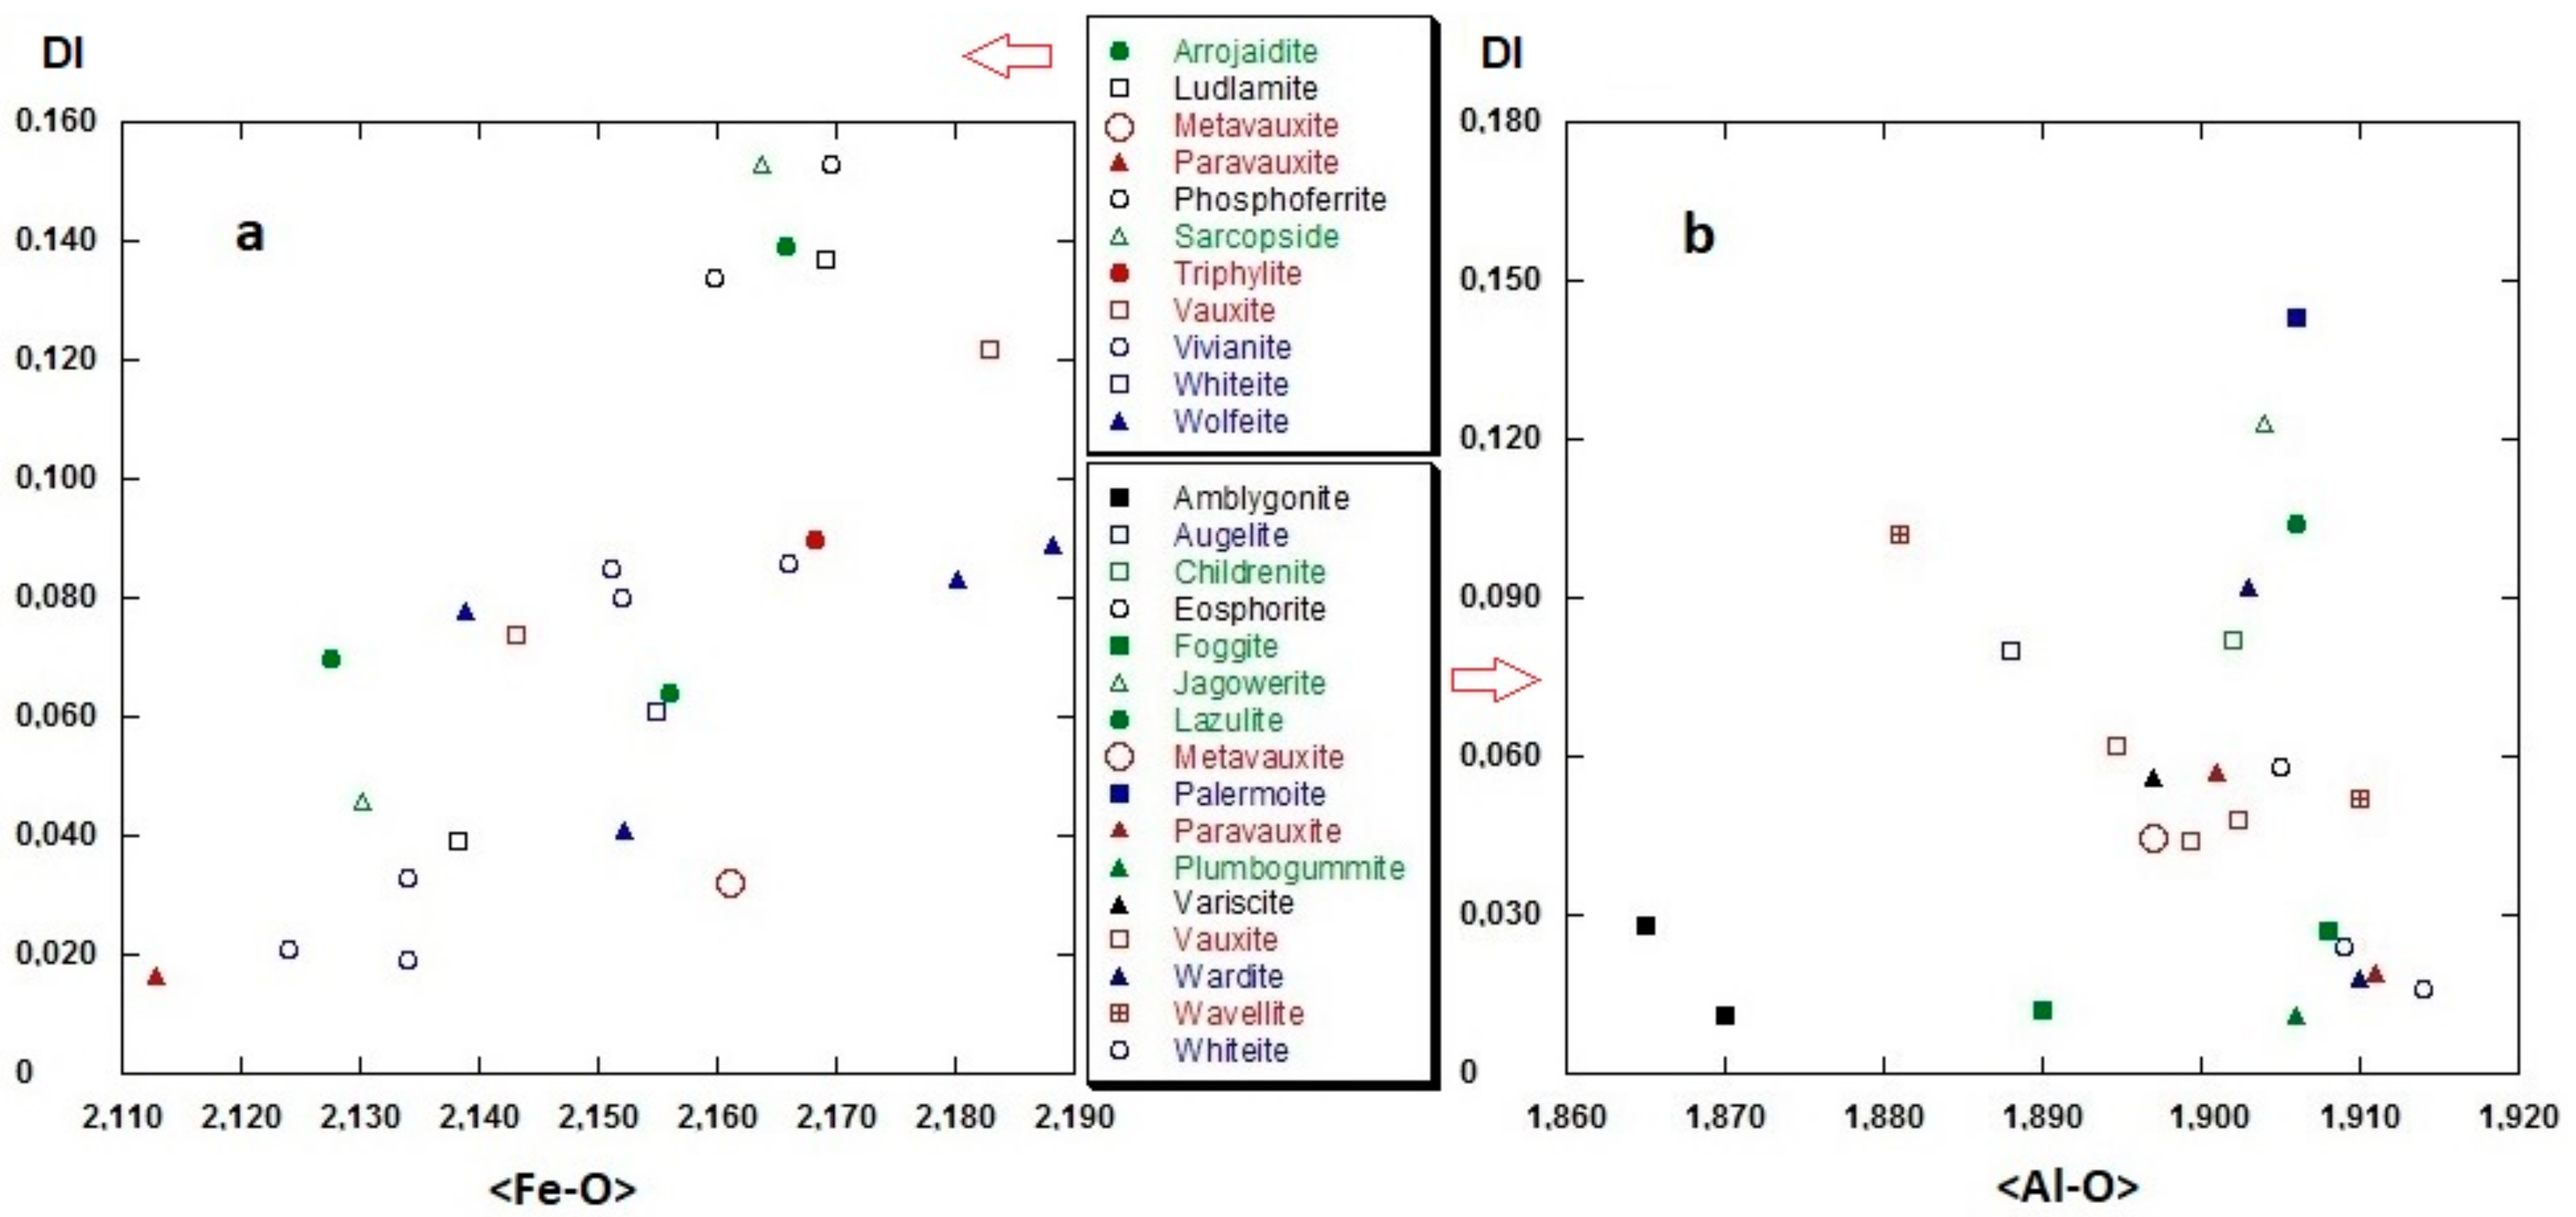
3.2.2. Polyhedral Distortion
3.2.3. Hydrogen Bonding Network
3.2.4. Related Phases
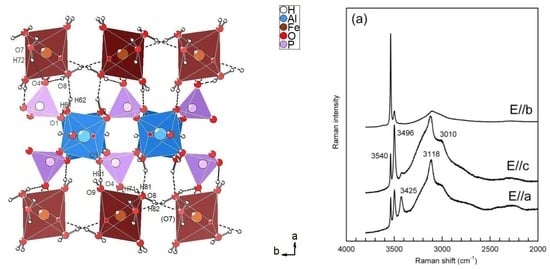
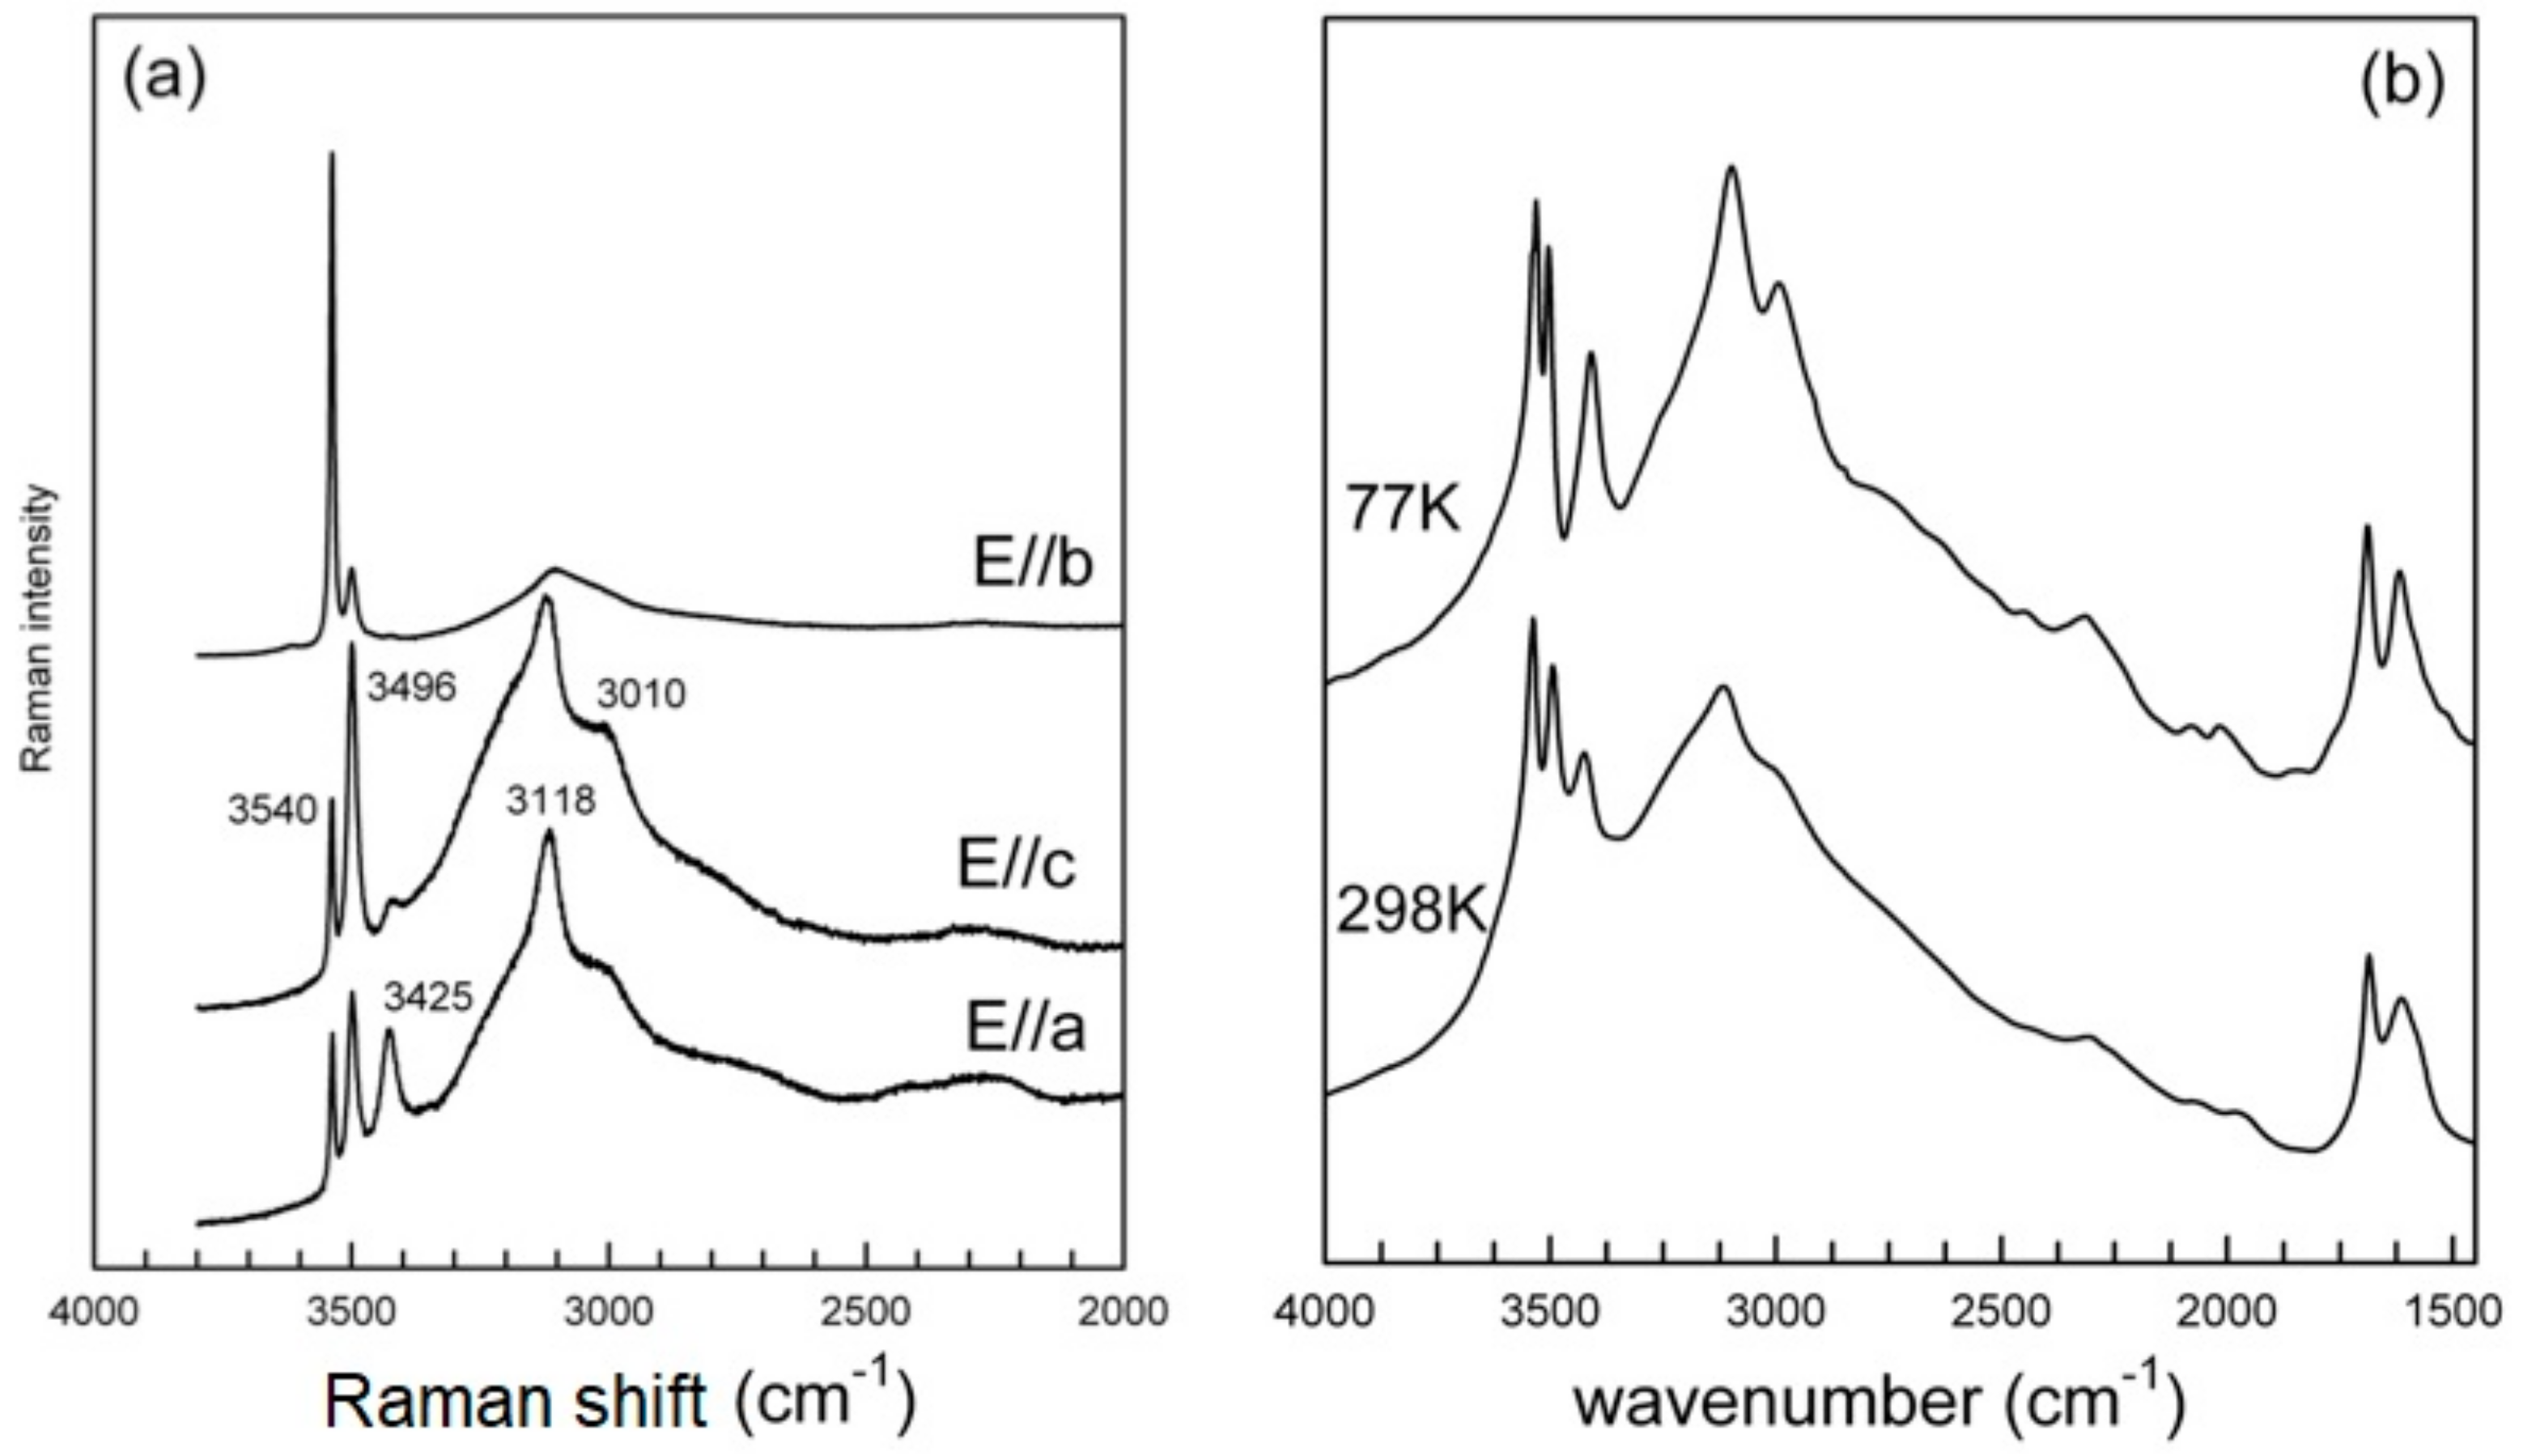
3.3. Infrared and Raman Spectroscopy
3.3.1. The H2O/OH Bands
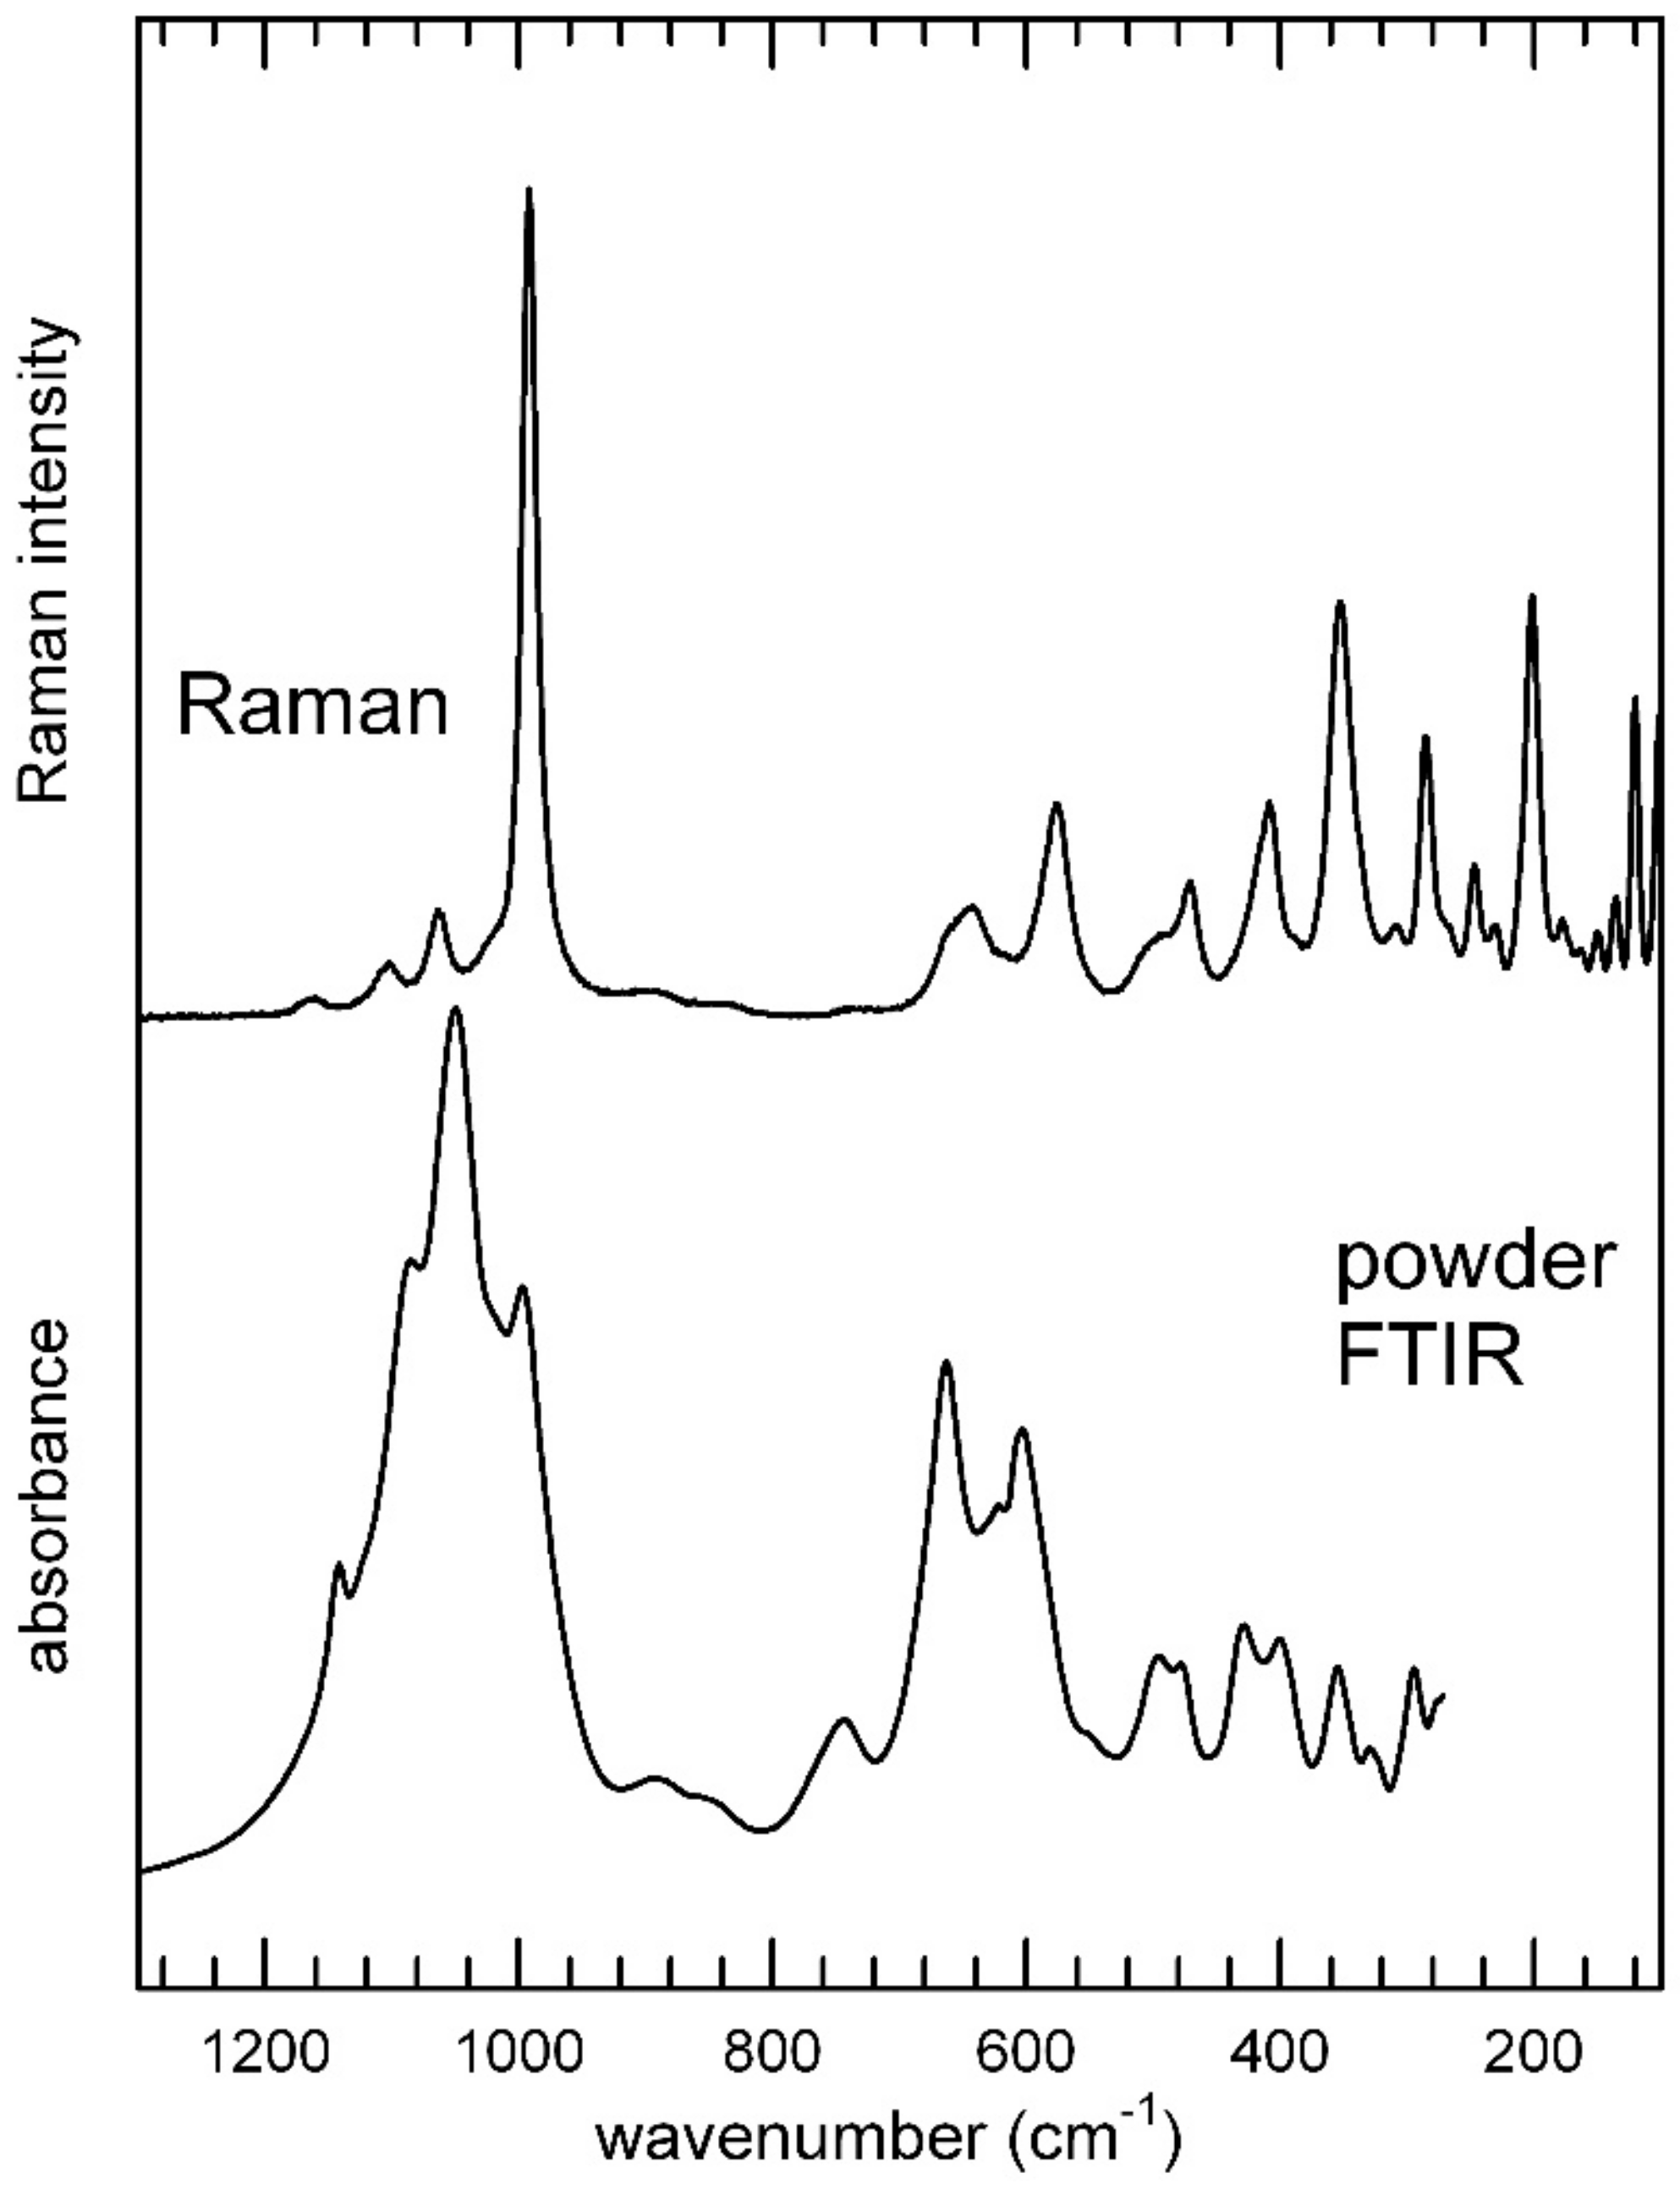
3.3.2. The Low-Frequency Region
4. Conclusions
Author Contributions
Funding
Acknowledgments
Conflicts of Interest
References
- Baur, W.H. The crystal structure of paravauxite, FeAl2(PO4)2(OH)2·8H2O. Neues Jahrbuch Für Mineralogie Monatshafte 1969, 1969, 430–433. [Google Scholar]
- Frost, R.L.; Scholz, R.; Lópes, A.; Xi, Y.; Gobac, Ž.Ž.; Horta, L.F.C. Raman and infrared spectroscopic characterization of the phosphate mineral paravauxite Fe2+Al2(PO4)2(OH)2·8H2O. Spectrochim. Acta A 2013, 116, 491–496. [Google Scholar] [CrossRef] [PubMed]
- Gatta, G.D.; Vignola, P.; Meven, M. On the complex H-bonding network in paravauxite, Fe2+Al2(PO4)2(OH)2·8H2O: A single-crystal neutron diffraction study. Mineral. Mag. 2014, 78, 841–850. [Google Scholar] [CrossRef]
- Baur, W.H.; Rama Rao, B. The crystal structure and the chemical composition of vauxite. Am. Mineral. 1968, 53, 1025–1028. [Google Scholar]
- Ventruti, G.; Schingaro, E.; Monno, A.; Lacalamita, M.; Della Ventura, G.; Bellatreccia, F.; Cuocci, C.; Capitelli, F. Structure refinement, and vibrational spectroscopy of vauxite from the type locality, Lallagua (Bolivia). Can. Mineral. 2016, 54, 163–176. [Google Scholar] [CrossRef]
- Scholz, R.; Frost, R.L.; Frota, L.; Belotti, F.M.; López, A. SEM, EDX and vibrational spectroscopy of the phosphate mineral vauxite from Llallagua, Bolívia. Spectrochim. Acta A 2015, 151, 149–155. [Google Scholar] [CrossRef]
- Araki, T.; Zoltai, T. The crystal structure of wavellite. Z. Krist. Cryst. Mater. 1968, 127, 21–33. [Google Scholar] [CrossRef]
- Capitelli, F.; Della Ventura, G.; Bellatreccia, F.; Sodo, A.; Saviano, M.; Ghiara, M.R.; Rossi, M. Crystal-chemical study of wavellite from Zbirov, Czech Republic. Mineral. Mag. 2014, 78, 1057–1070. [Google Scholar] [CrossRef]
- Baur, W.H.; Rama Rao, B. The crystal structure of metavauxite. Naturwissenschaften 1967, 21, 561–562. [Google Scholar] [CrossRef]
- Blanchard, F.N.; Abernathy, S.A. X-ray powder diffraction data for phosphate minerals: Vauxite, metavauxite, vivianite, Mn-heterosite, scorzalite, and lazulite. Fla. Sci. 1980, 43, 257–265. [Google Scholar]
- Hawthorne, F.C. Structure and chemistry of phosphate minerals. Mineral. Mag. 1998, 62, 141–164. [Google Scholar] [CrossRef]
- Gordon, S.G. Preliminary notes on metavauxite. Am. Mineral. 1927, 12, 264. [Google Scholar]
- Gordon, S.G. The mineralogy of the tin mines of Cerro de Llallagua, Bolivia. Acad. Nat. Sci. Phila. Proc. 1944, 96, 279–359. [Google Scholar]
- Reed, S.J.B. Electron Microprobe Analysis and Scanning Electron Microscopy in Geology; Cambridge University Press: Cambridge, UK, 1975. [Google Scholar]
- Bruker. SAINT; Bruker AXS Inc.: Madison, WI, USA, 2003. [Google Scholar]
- Bruker. APEX2; Bruker AXS Inc.: Madison, WI, USA, 2003. [Google Scholar]
- Sheldrick, G.M. Program for Empirical Absorption Correction of Area Detector Data; University of Gottingen: Göttingen, Germany, 1996. [Google Scholar]
- Sheldrick, G.M. XPREP; Bruker-Nonius AXS: Madison, WI, USA, 2003. [Google Scholar]
- Betteridge, P.W.; Carruthers, J.R.; Cooper, R.I.; Prout, K.; Watkin, D.J. CRYSTALS version 12: Software for guided crystal structure analysis. J. Appl. Crystallogr. 2003, 36, 1487. [Google Scholar] [CrossRef]
- Ventruti, G.; Della Ventura, G.; Bellatreccia, F.; Lacalamita, M.; Schingaro, E. Hydrogen bond system and vibrational spectroscopy of the iron sulfate fibroferrite, Fe(OH)SO4 5H2O. Eur. J. Mineral. 2016, 28, 943–952. [Google Scholar] [CrossRef]
- Brandenburg, K. DIAMOND—Visual Crystal Structure Information System, Version 3.1c; Crystal Impact: Bonn, Germany, 1999. [Google Scholar]
- Momma, K.; Izumi, F. VESTA 3 for three-dimensional visualization of crystal, volumetric and morphology data. J. Appl. Crystallogr. 2011, 44, 1272–1276. [Google Scholar] [CrossRef]
- Moore, P.B. Crystal chemistry of basic iron phosphates. Am. Mineral. 1970, 55, 135–169. [Google Scholar]
- Fachinformationszentrum Karlsruhe. Inorganic Crystal Structure Database (ICSD) Version 2018-2; Fachinformationszentrum Karlsruhe: Eggenstein-Leopoldshafen, Germany, 2018. [Google Scholar]
- Huminicki, D.M.C.; Hawthorne, F.C. The crystal chemistry of phosphate minerals. Rev. Mineral. Geochem. 2002, 48, 123–253. [Google Scholar] [CrossRef]
- Capitelli, F.; Chita, G.; Cavallo, A.; Bellatreccia, F.; Della Ventura, G. Crystal-Structure of whiteite-(CaFeMg) from Crosscut Creek, Canada. Z. Krist. Cryst. Mater. 2011, 226, 731–738. [Google Scholar] [CrossRef]
- Capitelli, F.; Saviano, M.; Ghiara, M.R.; Rossi, M. Crystal chemical investigation of Al2(PO4)(OH)3 augelite from Rapid Creek, Yukon, Canada. Z. Krist. Cryst. Mater. 2014, 229, 8–16. [Google Scholar]
- Kobashi, D.; Kohara, S.; Yamakawa, J.; Kawahara, A. Structure d’un Diphosphate Synthétique de Cobalt: Co2P2O7. Acta Crystallogr. C 1997, 53, 1523–1525. [Google Scholar] [CrossRef]
- Shannon, R.D. Revised effective ionic radii and systematic studies of interatomic distances in halides and chalcogenides. Acta Crystallogr. A 1976, 32, 751–767. [Google Scholar] [CrossRef]
- Harcharras, M.; Capitelli, F.; Ennaciri, A.; Brouzi, K.; Moliterni, A.G.G.; Mattei, G.; Bertolasi, V. Synthesis, X-ray crystal structure and vibrational spectroscopy of the acidic pyrophosphate KMg0.5H2P2O7·H2O. J. Solid State Chem. 2003, 176, 27–32. [Google Scholar] [CrossRef]
- Brown, I.D.; Altermatt, D. Bond-Valence Parameters Obtained from a Systematic Analysis of the Inorganic Crystal Structure Database. Acta Crystallogr. B 1985, 41, 244–247. [Google Scholar] [CrossRef]
- Brown, I.D. Topology and chemistry. Struct. Chem. 2002, 13, 339–355. [Google Scholar] [CrossRef]
- Ferraris, G.; Ivaldi, G. Bond valence vs. bond length in O…O hydrogen bonds. Acta Crystallogr. B 1988, 44, 341–344. [Google Scholar] [CrossRef]
- Fanfani, L.; Tomassini, M.; Zanazzi, P.F.; Zanzari, A.R. The crystal structure of strunzite, a contribution to the crystal chemistry of basic ferric-manganous hydrated phosphates. Tschermaks Mineralogische Und Petrographische Mitteilungen 1978, 25, 77–87. [Google Scholar] [CrossRef]
- Baur, W.H. A comparison of the crystal structures of pseudolaueite and laueite. Am. Mineral. 1969, 54, 1312–1323. [Google Scholar]
- Krivovichev, S.; Filatov, S.; Semenova, T. On the systematics and description of polyions of linked polyhedra. Z. Krist. Cryst. Mater. 1997, 212, 411–417. [Google Scholar] [CrossRef]
- Available online: https://www.mindat.org/ min-2621.html (accessed on 5 May 2019).
- Libowitzky, E. Correlation of O-H stretching frequencies and O-H…O hydrogen bond lengths in minerals. Monatsh. Chem. 1999, 130, 1047–1059. [Google Scholar]
- Adler, H.H. Infrared spectra of phosphate minerals: Symmetry and substitutional effects in the pyromorphite series. Am. Mineral. 1964, 49, 1002–1015. [Google Scholar]
- Ross, S.D. Phosphates and other oxy-anions of group V. In Mineralogical Society Monograph 4: The Infrared Spectra of Minerals; Farmer, V.C., Ed.; Mineralogical Society of Great Britain and Ireland: Twickenham, UK, 1974. [Google Scholar]
- Frost, R.L.; Martens, W.; Williams, P.A.; Kloprogge, J.T. Raman and infrared spectroscopic study of the vivianite-group phosphates vivianite, baricite and bobierrite. Mineral. Mag. 2002, 66, 1063–1073. [Google Scholar] [CrossRef]
- Capitelli, F.; Chita, G.; Ghiara, M.R.; Rossi, M. Crystal chemical investigation of Fe3(PO4)2∙8H2O vivianite minerals. Z. Krist. Cryst. Mater. 2012, 227, 92–101. [Google Scholar] [CrossRef]
- Ventruti, G.; Della Ventura, G.; Lacalamita, M.; Sbroscia, M.; Sodo, A.; Plaisier, J.R.; Cinque, G.; Schingaro, E. Crystal-chemistry and vibrational spectroscopy of ferrinatrite, Na3[Fe(SO4)3] 3H2O, and its high-temperature decomposition. Phys. Chem. Min. 2019, 64, 119–131. [Google Scholar] [CrossRef]
- Frost, R.L.; Čejka, J.; Weier, M.; Martens, W.N. A Raman spectroscopic study of the uranyl phosphate mineral parsonsite. J. Raman Spectrosc. 2006, 37, 879–891. [Google Scholar] [CrossRef]


| Empirical Formula | H18Al2FeO18P2 |
|---|---|
| Formula weight | 477.89 |
| Temperature (K) | 293(2) |
| Wavelength (Å) | 0.71069 |
| Crystal system; space group | Monoclinic; P21/c |
| a, b, c (Å) | 10.2449(5), 9.5867(5), 6.9626(3) |
| β (°) | 97.889(3) |
| V (Å3) | 677.36(6) |
| Z, ρcalc. (g·cm−3) | 2, 2.343 |
| μ (mm−1) | 1.584 |
| F(000) | 488 |
| Crystal size (mm) | 0.35 × 0.25 × 0.25 |
| Shape, Color | prismatic, colorless |
| θ range for data collection | 3.64 to 36.37 deg. |
| Limiting indices | −17 ≤ h ≤ 17, −15 ≤ k ≤ 15, −8 ≤ l ≤ 11 |
| Refl. collected/unique | 15071/3273 [Rint = 0.084] |
| Completeness | 99.5% |
| Max. and min. transmission | 0.6227 and 0.7471 |
| Refinement method a | FMLS on F2 |
| Data/restraints/parameters | 2018/9/133 |
| GOF | 0.780 |
| Final R indices [I>3σ(I)] | R1 = 0.0381, wR2 = 0.1005 |
| R indices (all data) | R1 = 0.0759, wR2 = 0.1369 |
| Larg. diff. peak/hole (e·Å−3) | 0.84/−0.68 |
| Atom | Site | x/a | y/b | z/c | Ueq |
|---|---|---|---|---|---|
| Fe1 | 2a | 0 | 0.5 | 0.5 | 0.0132(2) |
| Al1 | 4e | 0.51123(7) | 0.25360(7) | 0.12761(9) | 0.0083(3) |
| P1 | 4e | 0.32683(6) | 0.53757(6) | 0.07485(8) | 0.0078(2) |
| O1 | 4e | 0.39385(17) | 0.40061(17) | 0.0272(2) | 0.0113(7) |
| O2 | 4e | 0.61134(18) | 0.09723(18) | 0.2301(2) | 0.0128(7) |
| O3 | 4e | 0.66313(16) | 0.35767(18) | 0.0919(2) | 0.0105(7) |
| O4 | 4e | 0.18026(17) | 0.50637(19) | 0.0804(3) | 0.0135(7) |
| O5 | 4e | 0.50787(17) | 0.32012(18) | 0.3784(2) | 0.0108(7) |
| O6 | 4e | 0.35714(19) | 0.1391(2) | 0.1495(3) | 0.0163(8) |
| O7 | 4e | 0.03165(19) | 0.3990(2) | 0.7827(3) | 0.0167(8) |
| O8 | 4e | −0.12527(19) | 0.6415(2) | 0.6185(3) | 0.0174(8) |
| O9 | 4e | 0.1659(2) | 0.6331(2) | 0.5704(3) | 0.0236(10) |
| H51 | 4e | 0.495(3) | 0.405(3) | 0.380(5) | 0.0130 |
| H61 | 4e | 0.281(3) | 0.161(4) | 0.091(5) | 0.0200 |
| H62 | 4e | 0.348(4) | 0.120(4) | 0.271(4) | 0.0200 |
| H71 | 4e | 0.087(3) | 0.438(4) | 0.867(5) | 0.0200 |
| H72 | 4e | −0.046(3) | 0.411(4) | 0.822(5) | 0.0200 |
| H81 | 4e | −0.155(4) | 0.606(4) | 0.727(5) | 0.0210 |
| H82 | 4e | −0.088(4) | 0.719(3) | 0.662(5) | 0.0210 |
| H91 | 4e | 0.218(4) | 0.635(4) | 0.675(5) | 0.0290 |
| H92 | 4e | 0.213(4) | 0. 668(4) | 0.493(5) | 0.0290 |
| Fe1–H2O7 I | 2.1776(19) | Al1–O1 | 1.9211(17) | P1–O3 III | 1.5494(17) |
| Fe1–H2O7 II | 2.1776(19) | Al1–O2 | 1.8994(18) | P1–O4 | 1.5367(18) |
| Fe1–H2O8 I | 2.1113(19) | Al1–O3 | 1.8934(18) | P1–O2 IV | 1.5285(17) |
| Fe1–H2O8 II | 2.1113(19) | Al1–O5H | 1.8636(16) | P1–O1 | 1.5388(18) |
| Fe1–H2O9 I | 2.128(2) | Al1–O5IH | 1.8695(17) | <P1–O> | 1.5384 |
| Fe1–H2O9 II | 2.128(2) | Al1–H2O6 | 1.9459(19) | ||
| <Fe1–O> | 2.139 | <Al1–O> | 1.899 |
| D-H…A | D-H | H…A | D…A | D-H-A |
|---|---|---|---|---|
| O5–H51…O2 I | 0.83(3) | 2.22(3) | 2.978(2) | 152(3) |
| O6–H61…O8 II | 0.86(3) | 2.02(3) | 2.812(3) | 154(4) |
| O6–H62…O1 III | 0.88(3) | 1.79(3) | 2.632(2) | 158(4) |
| O7–H71…O4 IV | 0.84(3) | 1.78(3) | 2.609(3) | 167(4) |
| O7–H72…O4 V | 0.88(3) | 1.80(3) | 2.648(3) | 161(4) |
| O8–H81…O4 V | 0.92(3) | 1.76(3) | 2.654(3) | 161(4) |
| O8–H82…O7 VI | 0.87(3) | 1.85(3) | 2.703(3) | 169(4) |
| O9–H91…O3 VII | 0.84(3) | 1.89(3) | 2.734(2) | 179(4) |
| O9–H92…O3 I | 0.85(3) | 2.33(3) | 3.086(3) | 148(4) |
| O1 | O2 | O3 | O4 | O5 | O6 | O7 | O8 | O9 | ∑ | |
|---|---|---|---|---|---|---|---|---|---|---|
| Fe1 | 0.302×2 | 0.361×2 | 0.345x2 | 2.016 | ||||||
| Al1 | 0.482 | 0.511 | 0.519 | 0.563 | 0.451 | 3.080 | ||||
| 0.554 | ||||||||||
| P1 | 1.235 | 1.270 | 1.200 | 1.242 | 4.947 | |||||
| ∑v | ||||||||||
| H51 | 0.135 | 0.865 | 1.000 | |||||||
| H61 | 0.821 | 0.179 | 1.000 | |||||||
| H62 | 0.265 | 0.735 | 1.000 | |||||||
| H71 | 0.280 | 0.720 | 1.000 | |||||||
| H72 | 0.255 | 0.745 | 1.000 | |||||||
| H81 | 0.255 | 0.745 | 1.000 | |||||||
| H82 | 0.225 | 0.775 | 1.000 | |||||||
| H91 | 0.210 | 0.790 | 1.000 | |||||||
| ∑vH | 1.982 | 1.916 | 2.045 | 2.032 | 1.982 | 2.007 | 1.992 | 2.060 | 2.019 |
| Infrared | Raman | Assignment |
|---|---|---|
| 3494 (3502), 3424 (3410), 3115 (3097), 3000 (2992) | 3496, 3425, 3188, 3010 | ν3(H2O), 2ν2(H2O) |
| 1683 (1688), 1612 (1616) | 1676, 1698 | ν2(H2O) |
| 1142, 1084, 1049 | 1159, 1102, 1063 | ν3(PO4) |
| 997 | 992 | ν1(PO4) |
| 743, 662, 621, 603, 550, 495, 478, 427, 400 | 656, 642, 575, 495, 471, 408 | ν4(PO4) |
| 354, 327, 294 | 353, 303, 285, 248, 246, 230, 177, 163, 150, 136, 120, 100, 92 | ν2(PO4)/ν(Fe-O,OH) |
© 2019 by the authors. Licensee MDPI, Basel, Switzerland. This article is an open access article distributed under the terms and conditions of the Creative Commons Attribution (CC BY) license (http://creativecommons.org/licenses/by/4.0/).
Share and Cite
Della Ventura, G.; Capitelli, F.; Capitani, G.; Ventruti, G.; Monno, A. X-ray Structure Refinement and Vibrational Spectroscopy of Metavauxite FeAl2(PO4)2(OH)2·8H2O. Crystals 2019, 9, 297. https://doi.org/10.3390/cryst9060297
Della Ventura G, Capitelli F, Capitani G, Ventruti G, Monno A. X-ray Structure Refinement and Vibrational Spectroscopy of Metavauxite FeAl2(PO4)2(OH)2·8H2O. Crystals. 2019; 9(6):297. https://doi.org/10.3390/cryst9060297
Chicago/Turabian StyleDella Ventura, Giancarlo, Francesco Capitelli, Giancarlo Capitani, Gennaro Ventruti, and Alessandro Monno. 2019. "X-ray Structure Refinement and Vibrational Spectroscopy of Metavauxite FeAl2(PO4)2(OH)2·8H2O" Crystals 9, no. 6: 297. https://doi.org/10.3390/cryst9060297
APA StyleDella Ventura, G., Capitelli, F., Capitani, G., Ventruti, G., & Monno, A. (2019). X-ray Structure Refinement and Vibrational Spectroscopy of Metavauxite FeAl2(PO4)2(OH)2·8H2O. Crystals, 9(6), 297. https://doi.org/10.3390/cryst9060297