Abstract
The presence of highly electronegative atoms in Li-ion batteries anticipates the formation of σ-hole regions that may strongly affect the ionic conductivity. The σ-hole consists of a region of positive electrostatic potential extending in the direction of the covalent bond between atoms of groups IV–VII due to anisotropic charge distribution. Graphite electrodes in Li-ion batteries that become halogenated due to the electrolyte, as well as some solid electrolyte materials, can exhibit these σ-holes. Since Li-ions should be able to drift in any part of the battery, the fact that they can be attracted and eventually absorbed by regions of strong negative potentials produced by high-electronegativity counterions becomes detrimental to ionic conductivity. Therefore, the presence of positive well-defined regions, repulsive to the Li-ions, might act as lubricant for Li-ions drifting through electrolytes, thus improving the Li-ion conductivity. In addition, the σ-holes might also have a strong effect on the formation of the passivating layer, known as the solid electrolyte interphase (SEI) at electrode surfaces, which is of paramount importance for the performance of rechargeable batteries. Here we investigate the existence of σ-holes on surfaces of graphite anodes and of a few solid electrolytes by examining the electrostatic potentials calculated using density functional theory.
Keywords:
sigma-holes; iso-electrostatic potential; solid electrolytes; Li3PS4; Li7P2S8I; PF6; graphite; MEP 1. Introduction
σ-holes are particular electronic arrangements where a region of positive electrostatic potential extends in the direction of the covalent bond between atoms of groups IV–VII due to anisotropic charge distribution. Graphite electrodes in Li-ion batteries that become halogenated due to electrolyte decomposition, as well as of some solid electrolyte materials, can exhibit these σ-holes. The importance of these electronic distributions is that they can favor ionic or electronic motion in directions that would not be possible in their absence. Here, we study them in relation to battery materials, where ionic and electronic transport is of utmost importance.
In particular, the formation of a solid electrolyte interphase (SEI) between anode and electrolyte in Li-ion batteries takes place due to the leakage of electrons from the negative anode (generally graphite) to the electrolyte (solutions based on ethylene-carbonate) in a complex set of reactions involving the counterions and any other additives inserted in the electrolyte to improve their chemical behavior. The leaked electron reacts with the components of the electrolyte, forming a variety of moieties that settle down on the surface of the anode. The SEI thus grows as more electrons are leaked; however, the rate of leakage decreases as the thickness of the SEI increases. Usually, a commercial battery reaches such passivation in the very first cycle of its use or, at most, in the initial cycles (a few hours). This explains why drift velocities of Li-ions in rechargeable batteries are extremely slow, ~1 mm/h. Electrolytes of present batteries are usually in liquid phase. This is usually the state of matter that allows the best conductivity of positive ions while maintaining good contact to the electrodes. Thus, a typical Li-ion rechargeable battery uses LiCoO2 as the positive electrode (cathode) [1], graphite as the negative electrode (anode), and a liquid electrolyte solution of LiPF6 dissolved in ethylene carbonate (EC) [2,3]. However, present requirements of higher energy and power for transportation and storage backup for electrical grids demand a radical change of these typical components of a battery. To satisfy energy density requirements, proposed materials include sulfur for cathodes [4] along with lithium metal for anodes [5]. Both materials bring new challenges; one of them is the formation of dendrites [6], which may cause internal short-circuits in the battery, which is a severe safety issue. One possible solution to avoid the formation of dendrites is the use of solid electrolytes simply because they offer better resistance to the growth of dendrites than liquids [7]. Interfacial behavior of the solid electrolytes with anode materials, such as silicon, have been studied [8,9,10,11,12]. A downside of solid electrolytes is their ionic conductivity, which is on the order of 10−3 S cm−1 [13], lower than the ones obtained for organic liquid electrolytes, which are on the order of 10−2 S cm−1 [14]. In spite of the vast research in this field, practical solid electrolytes still do not meet the desired level of ionic conductivities and have the problem of poor interfacial contact (solid-to-solid) to the electrodes. However, a few solid electrolyte materials have shown promising high ionic conductivity, becoming possible options for higher-capacity batteries, including, for example: Li3PS4 [15], Li6PS5Cl [16], and Li7P2S8I [17]. Li7P2S8I (LPSI), was intensively studied as a solid electrolyte because it exhibits a high Li ionic conductivity of 0.64 mS cm−1, and it has high electrochemical stability, being able to stand voltages up to 10 V (vs. Li/Li+) at room temperature [17,18]. Therefore, understanding and being able to predict their ionic conductivity mechanisms as a function of their electronic structure is necessary.
The σ-hole designates the electron-deficient outer lobe of a half-filled p orbital involved in forming a covalent bond between atoms of groups IV–VII. It involves a region of positive electrostatic potential which can interact attractively (non-covalently) with negative sites on other molecules. In this work, we report the presence of σ-holes or, in general, exposed regions of positive potential in places that were previously thought to exhibit negative charge, including, for example, the outer portions of halogen atoms opposite a bond with another nonmetal element [19,20,21,22,23]. The susceptibility of this positive charge to nonbonding interactions with its neighbors [24,25,26], as well as the possibility of its repulsion of other positively charged species, make these examinations necessary for further innovations in materials.
2. Methodology
The term is known in DFT as the external potential, , which uniquely determines the density , or vice versa, in Coulomb’s Law, . Here, represents charge on nucleus at position . Each term contributes independently for the nuclei and electrons, respectively [27]. Thus, as concluded earlier [28], the electrostatic potential function is a transformation of the electron density and therefore of the wavefunction, containing all information available in both, and with the additional feature of presenting such information in a more suitable way to study interactions between molecules (intermolecular), as well as interactions in molecules (intramolecular). Poisson’s equation, beyond previously-explored classical methods, relates electrostatic potential with surrounding electron density through the equation , where represents the three-dimensional Dirac delta function. Important interactions include the phenomena at the boundary between positive and negative regions of a molecule, cluster, or crystal, which are of utmost interest for all kinds of physical and chemical interactions with other systems. Interactions that are almost otherwise impossible to track with electron density and wavefunction properties can be revealed with these DFT models [29]. Molecular electrostatic potentials (MEPs), in recent applications, have become powerful means of analyzing sensitive binding mechanisms, such as the pairing of DNA bases [28,30] and the handling of volatile materials that require precise detection of minute traces [31]. MEP’s ability to serve as a logic gate has also found use in information processing as a basis for data operations [32,33,34,35,36].
All calculations of extended systems (crystals and surfaces) were performed using the program Vienna ab initio simulation package (VASP) [37,38,39] and those of finite systems (molecules) using the Gaussian-09 program [40]. For the extended systems, DFT with periodic boundary conditions and the projector augmented wave (PAW) [41] method were used. In this method, the generalized pseudopotential [42] and the linear augmented-plane-wave (LAPW) [43] are combined, allowing high-quality first-principle calculations. The PBE [44] functional (for extended systems) and the Becke three-parameter hybrid exchange functional [45] with the first-principles generalized gradient approximation correlation functional Perdew-Wang-91 [46], B3PW91 (for molecular systems). An augmented plane-wave basis set with maximum energy of 300–400 eV was used for extended systems and the double-ξ plus polarization 6-31G(d) basis set was used for molecules [47,48].
The material used to study the crystallographic surfaces is modeled as a slab of the crystal structure (graphite, Li7P2S8I [17], and Li3PS4 [15]) with a vacuum above periodicity parallel to the slab on the order of 18 Å, large enough to isolate the surface from its periodic images. The materials chosen for this study are: graphite, the most used material in commercial Li-ion batteries, and the solid electrolytes Li7P2S8I and Li3PS4, both of which are of interest given their systems containing σ-holes; the electrostatic potentials of the solid electrolytes are calculated at (010) and (001) surfaces, respectively (Figure 1).
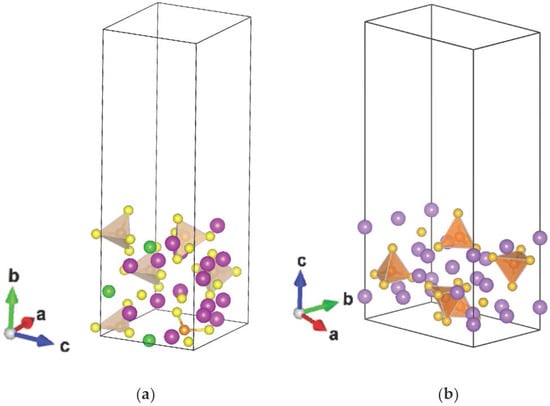
Figure 1.
Slab model to study electrostatic potential at (a) (010) surface for Li7P2S8I and (b) (001) surface for Li3PS4.
3. Results and Discussion
The iso-MEP surfaces of the benzene molecule are illustrated in Figure 2. The positive region (blue) expands on the neighborhood of all atoms due to the strong effect of the nuclei. By contrast, the negative regions above and below the plane of the molecule are due to the pi-electrons, leading to a net negative surface. The two cases shown in Figure 2 and Figure 3 illustrate very clearly the effect of the isopotential surfaces. The typical way to display a MEP is to use isodensity surfaces mapped with MEP values. These colorful pictures provide a good qualitative idea of the MEP distribution around a molecule. From the figures, we can see the new approach can be used to show the domains at which the σ-hole is active in halogenated compounds, which the MEP spectrum tends to miss by illustrating the potential on isodensities.
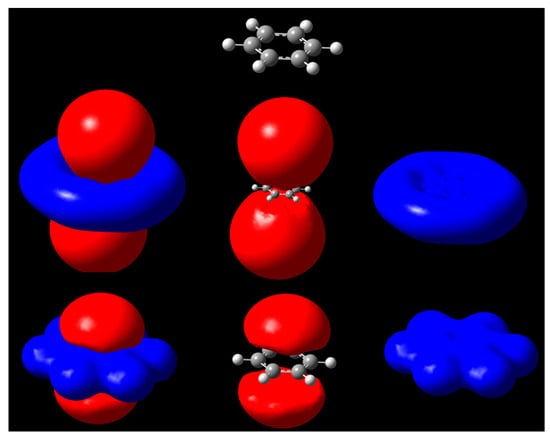
Figure 2.
Isopotential surfaces of benzene, separated between negative (red) and positive (blue) regions corresponding to the same absolute value of potential. Isopotential pairs are ±0.03 (second row) and ±0.3 V (bottom). A molecule is depicted for position reference.
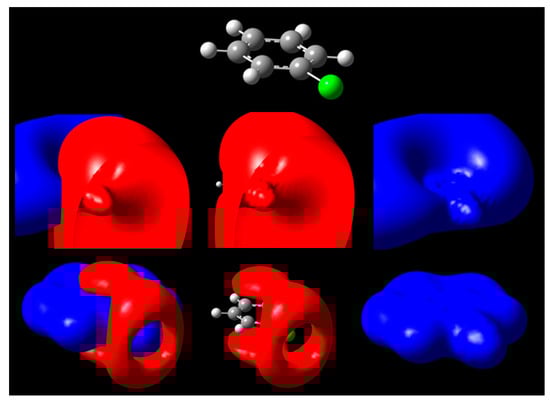
Figure 3.
Isopotential surfaces of PhCl, separated between negative (red) and positive (blue) regions. Isopotential pairs are ±0.03 (second row) and ±0.3 V (bottom). A molecule is depicted for position reference.
A second case is given by chlorobenzene C6H5Cl, shown in Figure 3. For the halogen substituent chlorine, a negative surface covers the positive at low voltages close to 0, but at ±0.3 V, the presence of a σ-hole exposes the positive region underneath. We can attribute this effect to anisotropic distribution of charge leading to accumulation along the equatorial regions of chlorine when it participates in a covalent bond. Therefore, the outermost portion of the halogen atom along the C-Cl bond axis is left vulnerable to possible nonbonding interactions if a negative charge approaches that site (Figure 3). At potentials close to 0, such as 30 mV, the hole is not yet present, while on existing isodensity surfaces of PhCl and halogenated benzenes, it would appear exposed [21]. Notable differences for the larger halogens include larger σ-hole circumference at identical isopotential values [24]; the size of the exposed region for phenyl halogens follows the trend PhI > PhBr > PhCl at the ±0.3 V isopotentials. This approach confirms existing literature about increasing halogen capabilities of participating in these types of nonbonding interactions due to differences in size [49,50].
Next, we look to take this method to PF6−, the anion of lithium hexafluorophosphate, LiPF6, one of the most common salts for Li-ion batteries. Its neutral form has not been reported, but may exist for a very short period of time if removal of an electron from the PF6− anion is achieved, upon which the molecule decomposes into PF5 with the release of one of its fluorine substituents [51]. Its negative ion exists in solution (Figure 4). The neutral structure of PF6 has lower symmetry than its anion, with each molecule exhibiting D4h and Oh point group symmetries, respectively. Two negative caps of potential along the shorter axis of neutral PF6 are observed (Figure 3a) while Figure 3b shows a highly negative MEP map of PF6−, but still revealing relative positivity at each of the six caps on the outermost portions of the substituent fluorine atoms along the P-F bond axis.
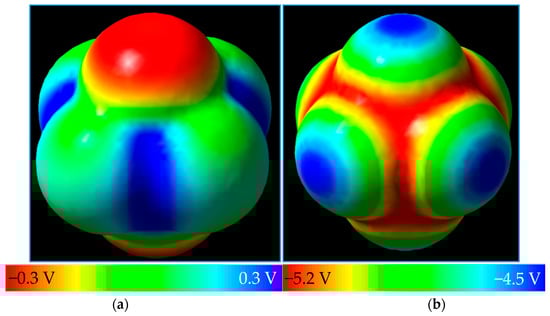
Figure 4.
(a) PF6 around its C4 axis with MEP surface color-coded on the isodensity surface of 0.0004 e/bohr3; and (b) the PF6− anion and its MEP surface plotted on the electron density surface of 0.0004 e/bohr3.
We can infer, at least in part, the existence of σ-holes in these molecules, even if only exhibited over a small range. For neutral PF6, moving over a short range from ±0.30 to ±0.35 V gives us a fleeting instance of a σ-hole, which disappears quickly as we reach nuclear domain potentials close to the atoms (Figure 5).
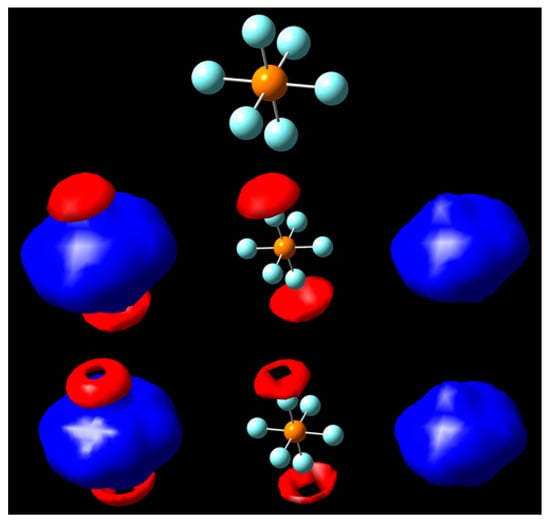
Figure 5.
Isopotential surfaces of PF6, separated between negative (red) and positive (blue) regions. Isopotential pairs are ±0.30 (second row) and ±0.325 V (bottom). A molecule is given for position reference.
The negative ion, PF6−, gives us a better look at the σ-hole when moving in isopotential ranges beyond ±5 V (Figure 6). Holes can be seen on the fluorine caps as predicted by the isodensity surface in Figure 6, and later the phosphorus center becomes visible underneath the negative region, with the equatorial regions of fluorine being the last portions to erode around the ±5.7 V isopotential value.
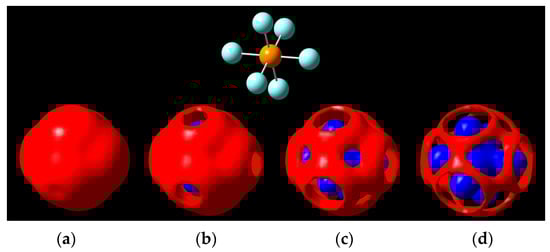
Figure 6.
Isopotential surfaces of PF6−, separated between negative (red) and positive (blue) regions. Isopotential pairs are (a) ±5.1 V; (b) ±5.3 V; (c) ±5.5 V; and (d) ±5.7 V. A molecule is given for position reference (top).
With this in mind, we expand the concept of MEP to extended systems such as crystal electrostatic potentials (CEP) and their surfaces. The first case that calls our attention is the (001) surface of graphite, one of the multiple possible orientations of graphite in batteries. Although in disordered carbons, other graphite facets may be exposed, the one chosen is the most favorable to Li ion intercalation. Even in passivated surfaces such as those H-terminated, the attachment of halogen atoms from the electrolyte is highly possible. To some extent, the σ-hole was observed when fluorine was tested (Figure 7). Fluorine comes directly from the decomposition of PF6− on the surface or about the electrode, producing a σ-hole from −2.80 to −2.75 V; for other potentials there is no sigma-hole formation.
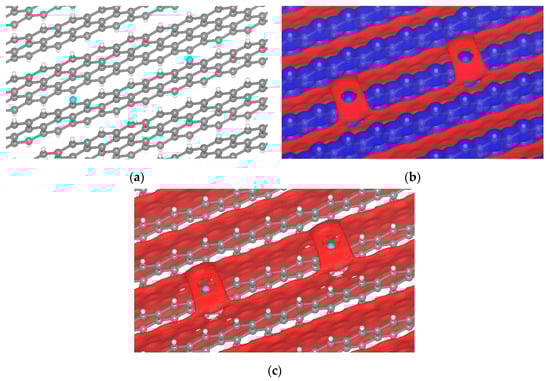
Figure 7.
Passivated H-terminated (001) surface. (a) Crystal of passivated graphite with fluorine. Isopotential surface of graphite with a fluorine atom, separated between negative (red) and positive (blue) regions; (b) graphite atomic conformation and isopotential ±2.8 V; and (c) graphite atomic conformation and isopotential −2.8 V.
The electrolyte will react with the anode surface during the first charge [52,53], producing a multicomponent SEI layer. The SEI components may have halogen atoms, such as Cl and I, depending on the electrolyte. A σ-hole was observed when chlorine was on the graphite surface (Figure 8). Chlorine comes from the decomposition of Li6PS5Cl during the reaction of the first charge. The chlorine produces a small σ-hole from −2.55 to −2.3 V, and for other potentials there is no sigma-hole formation.
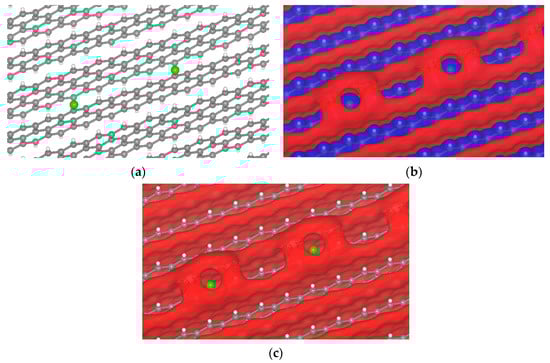
Figure 8.
Passivated H-terminated (001) surface. (a) Crystal of passivated graphite with chlorine. Isopotential surface of graphite with chlorine atom, separated between negative (red) and positive (blue) regions; (b) graphite atomic conformation and isopotential ±2.3 V; and (c) graphite atomic conformation and isopotential −2.3 V.
In the case of the iodine atom, the formation of the σ-hole was observed (Figure 9). We found that the σ-hole is larger than that of Cl and F, corroborating earlier visualizations of isolated molecules. The iodine atoms might come from the decomposition of small regions of the Li7P2S8I solid electrolyte; however, at this point this is just an assumption. The I atom produces a large σ-hole, while Cl produces a small one, and F an even smaller one. This is directly related to their position in the halogen column on the periodic table. The smallest and most electronegative atom makes a smaller σ-hole. The I atom produces a σ-hole that forms from −2.55 to −2.25 V, and for other potentials there is no σ-hole formation.

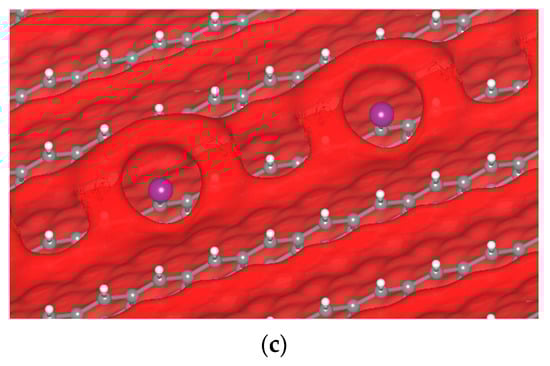
Figure 9.
Passivated H-terminated (001) surface. (a) Crystal of passivated graphite with iodine. Isopotential surface of graphite with iodine atom, separated between negative (red) and positive (blue) regions; (b) graphite atomic conformation and isopotential ±2.35 V; and (c) graphite atomic conformation and isopotential −2.35 V.
The presence of σ-holes and their nonbonded interactions in sulfur-containing compounds [54,55] leads us to extend this model to possible solid electrolyte materials that can see use in Li-ion batteries. Li3PS4, whose PS4 tetrahedron can feature σ-holes on sulfur, was studied as a crystal on the (001) surface. The formation of σ-holes has a preference to PS4 (Figure 10), the isopotential can be found from −3.3 to −2.8 V, and for other potentials there is no σ-hole formation.
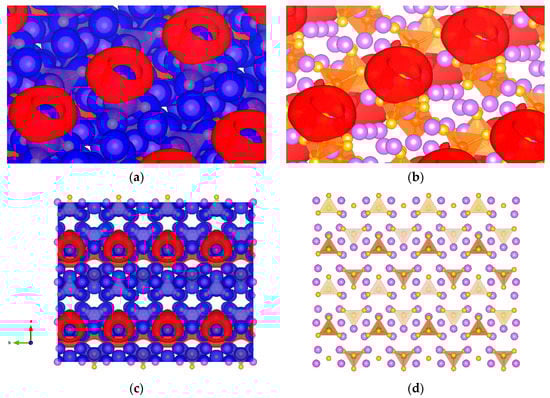
Figure 10.
Li3PS4 studied as a crystal on (001) surface (a) Isopotential ±3.1 V surface of Li3PS4 separated between negative (red) and positive (blue) regions; (b) Li3PS4 atomic conformation and isopotential −3.1 V; (c) top view of the crystal of Li3PS4 and isopotential ±3.1 V; and (d) top view of the crystal of Li3PS4. Solid purple spheres represent lithium, yellow for sulfur, and orange represents PS4 tetrahedron.
The other solid electrolyte material studied is Li7P2S8I on the (010) surface, whose PS4 tetrahedron, like Li3PS4 before it, suggests σ-hole formation. We found σ-holes in the surface along the b-axis, as shown in Figure 11a–c obtained at +0.5 and −3.8 V. The crystal structure of Li7P2S8I, as shown in Figure 11d, reveals the insertion of LiI in the interstitial sites of β-LPS. Additional Li were placed in the Li sites, and the iodine atoms were placed in lattice points of the Pnma space group. Thus, the crystal structure of Pnma is transformed into a similar P42/nmc with a unique b-axis [18].
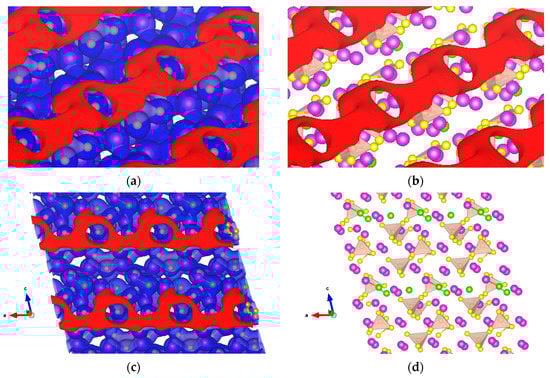
Figure 11.
Isopotential surfaces of solid electrolyte Li7P2S8I, separated between negative (red) and positive (blue) regions. (a) Shows the +0.5 and −3.8 V isosurfaces along the b-axis perpendicular to the crystal surface; (b) atomic conformation with the negative isopotential; (c) front view of the isopotential surfaces along b-axis; and (d) atomic conformation front view. Solid purple spheres represent lithium, green for iodine, yellow for sulfur, and orange for the PS4 tetrahedron.
We also determined different isopotentials by keeping the positive potential constant at +0.5 V and increasing the negative from −3.8 to −3.4 V as shown in Figure 12. The σ-hole closes completely by −3.4 V.

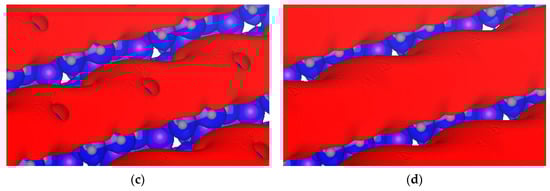
Figure 12.
Isopotential surfaces of Li7P2S8I, separated between negative (red) and positive (blue) regions. Positive isopotential remains constant at +0.5 V, and negative isopotentials are (a) −3.8; (b) −3.6; (c) −3.5; and (d) −3.4 V.
4. Conclusions
Successful demonstration of the σ-hole in molecules allows a larger-scale study by taking advantage of periodic boundary conditions of first-principle programs, such as VASP, when examining isopotentials in crystal surfaces. Previous assumptions of electrostatic behavior in halogen substituents, particularly those of covalently bonded molecules comprised of atoms in groups IV–VII, were previously thought to be uniformly negative, while further examination of both finite and extended systems shows that this might not be the case. By extending crystalline systems and examining isopotential surfaces of periodically repeating molecular structures, we are able to draw more realistic inferences of the molecular environments beyond the vacuum surrounding a single molecule. The systems investigated in this work resemble the molecular environments of graphite anodes and solid electrolytes. Even though the employed models are simplifications of real materials, the electronic structures and their main trends are well-captured, as demonstrated by the vast, well-known, first principles modeling battery materials literature. We found that, for these cases, the σ-holes in the solid electrolytes form preferentially at the PS4 tetrahedron. For solid electrolytes, we confirm the important role played by the PS4 in solid electrolytes for the diffusion of lithium ions. In particular, positive regions that would repel the Li-ions might act as driving-forces for Li-ions drifting through electrolytes, thus improving the Li-ion conductivity. It may also have important consequences for the electronic transport, as recently reported [56,57].
Acknowledgments
This material is based upon work supported by the U.S. Department of Energy’s Office of Energy Efficiency and Renewable Energy (EERE), as part of the Battery 500 Consortium, Award Number DE-EE0008210. We also appreciate the support of computational resources from Texas A and M High Performance Research Computing and the Texas Advanced Computing Center (TACC).
Author Contributions
C.R.-V. designed slab models and calculated the CEPs of Li3PS4 as well as of chlorine, iodine and fluorine attached to graphite; F.F.-G. designed the slab model and calculated the CEP of Li7P2S8I; R.J.A. calculated the MEP and generated isopotential surfaces of PF6, PF6−, benzene, and chlorobenzene; D.E.G.-A. leaded the writing of the manuscript; P.B.B. provided technical feedback and information on batteries; and J.M.S. directed the research.
Conflicts of Interest
The authors declare no conflict of interest.
References
- Chen, H.; Qiu, X.; Zhu, W.; Hagenmuller, P. Synthesis and High Rate Properties of Nanoparticled Lithium Cobalt Oxides as the Cathode Material for Lithium-Ion Battery. Electrochem. Commun. 2002, 4, 488–491. [Google Scholar] [CrossRef]
- Kumar, N.; Seminario, J.M. Lithium-Ion Model Behavior in an Ethylene Carbonate Electrolyte Using Molecular Dynamics. J. Phys. Chem. C 2016, 120, 16322–16332. [Google Scholar] [CrossRef]
- Jorn, R.; Kumar, R.; Abraham, D.P.; Voth, G.A. Atomistic Modeling of the Electrode–Electrolyte Interface in Li-Ion Energy Storage Systems: Electrolyte Structuring. J. Phys. Chem. C 2013, 117, 3747–3761. [Google Scholar] [CrossRef]
- Tao, T.; Lu, S.; Fan, Y.; Lei, W.; Huang, S.; Chen, Y. Anode Improvement in Rechargeable Lithium-Sulfur Batteries. Adv. Mater. 2017, 29. [Google Scholar] [CrossRef] [PubMed]
- Cheng, X.-B.; Zhang, R.; Zhao, C.-Z.; Zhang, Q. Toward Safe Lithium Metal Anode in Rechargeable Batteries: A Review. Chem. Rev. 2017, 117, 10403–10473. [Google Scholar] [CrossRef] [PubMed]
- Jana, A.; García, R.E. Lithium Dendrite Growth Mechanisms in Liquid Electrolytes. Nano Energy 2017, 41, 552–565. [Google Scholar] [CrossRef]
- Wu, B.; Lochala, J.; Taverne, T.; Xiao, J. The Interplay between Solid Electrolyte Interface (Sei) and Dendritic Lithium Growth. Nano Energy 2017, 40, 34–41. [Google Scholar] [CrossRef]
- Benitez, L.; Seminario, J.M. Electron Transport and Electrolyte Reduction in the Solid-Electrolyte Interphase of Rechargeable Lithium Ion Batteries with Silicon Anodes. J. Phys. Chem. C 2016, 120, 17978–17988. [Google Scholar] [CrossRef]
- Soto, F.A.; Martinez de la Hoz, J.M.; Seminario, J.M.; Balbuena, P.B. Modeling Solid-Electrolyte Interfacial Phenomena in Silicon Anodes. Curr. Opin. Chem. Eng. 2016, 13, 179–185. [Google Scholar] [CrossRef]
- Ramos-Sanchez, G.; Soto, F.A.; Martinez de la Hoz, J.M.; Liu, Z.; Mukherjee, P.P.; El-Mellouhi, F.; Seminario, J.M.; Balbuena, P.B. Computational Studies of Interfacial Reactions at Anode Materials: Initial Stages of the Solid-Electrolyte-Interphase Layer Formation. J. Electrochem. Energy Conver. Storage 2016, 13, 031002. [Google Scholar] [CrossRef]
- Soto, F.A.; Ma, Y.; Martinez de la Hoz, J.M.; Seminario, J.M.; Balbuena, P.B. Formation and Growth Mechanisms of Solid-Electrolyte Interphase Layers in Rechargeable Batteries. Chem. Mater. 2015, 27, 7990–8000. [Google Scholar] [CrossRef]
- Benitez, L.; Cristancho, D.; Seminario, J.M.; Martinez de la Hoz, J.M.; Balbuena, P.B. Electron Transfer through Solid-Electrolyte-Interphase Layers Formed on Si Anodes of Li-Ion Batteries. Electrochim. Acta 2014, 140, 250–257. [Google Scholar] [CrossRef]
- Kamaya, N.; Homma, K.; Yamakawa, Y.; Hirayama, M.; Kanno, R.; Yonemura, M.; Kamiyama, T.; Kato, Y.; Hama, S.; Kawamoto, K.; et al. A Lithium Superionic Conductor. Nat. Mater. 2011, 10, 682–686. [Google Scholar] [CrossRef] [PubMed]
- Stallworth, P.E.; Fontanella, J.J.; Wintersgill, M.C.; Scheidler, C.D.; Immel, J.J.; Greenbaum, S.G.; Gozdz, A.S. Nmr, Dsc and High Pressure Electrical Conductivity Studies of Liquid and Hybrid Electrolytes. J. Power Sources 1999, 81–82, 739–747. [Google Scholar] [CrossRef]
- Liu, Z.; Fu, W.; Payzant, E.A.; Yu, X.; Wu, Z.; Dudney, N.J.; Kiggans, J.; Hong, K.; Rondinone, A.J.; Liang, C. Anomalous High Ionic Conductivity of Nanoporous β-Li3PS4. J. Am. Chem. Soc. 2013, 135, 975–978. [Google Scholar] [CrossRef] [PubMed]
- Yubuchi, S.; Teragawa, S.; Aso, K.; Tadanaga, K.; Hayashi, A.; Tatsumisago, M. Preparation of High Lithium-Ion Conducting Li6PS5Cl Solid Electrolyte from Ethanol Solution for All-Solid-State Lithium Batteries. J. Power Sources 2015, 293, 941–945. [Google Scholar] [CrossRef]
- Rangasamy, E.; Liu, Z.; Gobet, M.; Pilar, K.; Sahu, G.; Zhou, W.; Wu, H.; Greenbaum, S.; Liang, C. An Iodide-Based Li7P2S8I Superionic Conductor. J. Am. Chem. Soc. 2015, 137, 1384–1387. [Google Scholar] [CrossRef] [PubMed]
- Kang, J.; Han, B. First-Principles Characterization of the Unknown Crystal Structure and Ionic Conductivity of Li7P2S8I as a Solid Electrolyte for High-Voltage Li Ion Batteries. J. Phys. Chem. Lett. 2016, 7, 2671–2675. [Google Scholar] [CrossRef] [PubMed]
- Brinck, T.; Murray, J.S.; Politzer, P. Surface Electrostatic Potentials of Halogenated Methanes as Indicators of Directional Intermolecular Interactions. Int. J. Quantum Chem 1992, 44, 57–64. [Google Scholar] [CrossRef]
- Murray, J.S.; Paulsen, K.; Politzer, P. Molecular Surface Electrostatic Potentials in the Analysis of Non-Hydrogen-Bonding Noncovalent Interactions. Proc. Indian Acad. Sci. (Chem. Sci.) 1994, 106, 267–275. [Google Scholar]
- Ibrahim, M.A.A. Molecular Mechanical Study of Halogen Bonding in Drug Discovery. J. Comput. Chem. 2011, 32, 2564–2574. [Google Scholar] [CrossRef] [PubMed]
- Clark, T.; Hennemann, M.; Murray, J.S.; Politzer, P. Halogen Bonding: The σ-Hole. J. Mol. Model. 2007, 13, 291–296. [Google Scholar] [CrossRef] [PubMed]
- Politzer, P.; Murray, J.S.; Clark, T. Halogen Bonding and Other σ-Hole Interactions: A Perspective. Phys. Chem. Chem. Phys. 2013, 15, 11178–11189. [Google Scholar] [CrossRef] [PubMed]
- Kolář, M.H.; Hobza, P. Computer Modeling of Halogen Bonds and Other σ-Hole Interactions. Chem. Rev. 2016, 116, 5155–5187. [Google Scholar] [CrossRef] [PubMed]
- Metrangolo, P.; Murray, J.S.; Pilati, T.; Politzer, P.; Resnati, G.; Terraneo, G. The Fluorine Atom as a Halogen Bond Donor, Viz. A Positive Site. CrystEngComm 2011, 13, 6593–6596. [Google Scholar] [CrossRef]
- Metrangolo, P.; Murray, J.S.; Pilati, T.; Politzer, P.; Resnati, G.; Terraneo, G. Fluorine-Centered Halogen Bonding: A Factor in Recognition Phenomena and Reactivity. Cryst. Growth Des. 2011, 11, 4238–4246. [Google Scholar] [CrossRef]
- Politzer, P.; Laurence, P.R.; Jayasuriya, K. Molecular Electrostatic Potentials: An Effective Tool for the Elucidation of Biochemical Phenomena. Environ. Health Perspect. 1985, 61, 191–202. [Google Scholar] [CrossRef] [PubMed]
- Otero-Navas, I.; Seminario, J.M. Molecular Electrostatic Potentials of DNA Base-Base Pairing and Mispairing. J. Mol. Model. 2012, 18, 91–101. [Google Scholar] [CrossRef] [PubMed]
- Cristancho, D.; Seminario, J.M. Polypeptides in Alpha-Helix Conformation Perform as Diodes. J. Chem. Phys. 2010, 132, 065102. [Google Scholar] [CrossRef] [PubMed]
- Jauregui, L.A.; Seminario, J.M. A DNA Sensor for Sequencing and Mismatches Based on Electron Transport through Watson-Crick and Non-Watson-Crick Base Pairs. IEEE Sens. J. 2008, 8, 803–814. [Google Scholar] [CrossRef]
- Salazar-Salinas, K.; Seminario, J.M. Energetics and Vibronics Analyses of the Enzymatic Coupled Electron-Proton Transfer from NfsA Nitroreductase to Trinitrotoluene. IEEE Trans. Nanotechnol. 2010, 9, 543–553. [Google Scholar] [CrossRef]
- Tour, J.M.; Kozaki, M.; Seminario, J.M. Molecular Scale Electronics: A Synthetic/Computational Approach to Digital Computing. J. Am. Chem. Soc. 1998, 120, 8486–8493. [Google Scholar] [CrossRef]
- Seminario, J.M.; Ma, Y.; Tarigopula, V. The Nanocell: A Chemically Assembled Molecular Electronic Circuit. IEEE Sens. J. 2006, 6, 1614–1626. [Google Scholar] [CrossRef]
- Seminario, J.M.; Yan, L. Cascade Configuration of Logical Gates Processing Information Encoded in Molecular Potentials. Int. J. Quantum Chem 2007, 107, 754–761. [Google Scholar] [CrossRef]
- Norma, L.R.; Jorge, M.S. Single Molecule Detection Using Graphene Electrodes. J. Phys. B At. Mol. Opt. Phys. 2010, 43, 115101. [Google Scholar]
- Rangel, N.L.; Seminario, J.M. Nanomicrointerface to Read Molecular Potentials into Current-Voltage Based Electronics. J. Chem. Phys. 2008, 128, 114711. [Google Scholar] [CrossRef] [PubMed]
- Kresse, G.; Hafner, J. Ab Initio. Phys. Rev. B 1993, 47, 558–561. [Google Scholar] [CrossRef]
- Kresse, G.; Hafner, J. Ab Initio. Phys. Rev. B 1994, 49, 14251–14269. [Google Scholar] [CrossRef]
- Kresse, G.; Furthmüller, J. Efficiency of Ab-Initio Total Energy Calculations for Metals and Semiconductors Using a Plane-Wave Basis Set. Comput. Mater. Sci. 1996, 6, 15–50. [Google Scholar] [CrossRef]
- Frisch, M.J.; Trucks, G.W.; Schlegel, H.B.; Scuseria, G.E.; Robb, M.A.; Cheeseman, J.R.; Scalmani, G.; Barone, V.; Mennucci, B.; Petersson, G.A.; et al. Gaussian 09; Gaussian, Inc.: Wallingford, UK, 2009. [Google Scholar]
- Blöchl, P.E. Projector Augmented-Wave Method. Phys. Rev. B 1994, 50, 17953–17979. [Google Scholar] [CrossRef]
- Kresse, G.; Joubert, D. From Ultrasoft Pseudopotentials to the Projector Augmented-Wave Method. Phys. Rev. B 1999, 59, 1758–1775. [Google Scholar] [CrossRef]
- Andersen, O.K. Linear Methods in Band Theory. Phys. Rev. B 1975, 12, 3060–3083. [Google Scholar] [CrossRef]
- Perdew, J.P.; Burke, K.; Ernzerhof, M. Generalized Gradient Approximation Made Simple. Phys. Rev. Lett. 1996, 77, 3865–3868. [Google Scholar] [CrossRef] [PubMed]
- Becke, A.D. A New Mixing of Hartree-Fock and Local Density-Functional Theories. J. Chem. Phys. 1993, 98, 1372–1377. [Google Scholar] [CrossRef]
- Perdew, J. Unified Theory of Exchange and Correlation Beyond the Local Density Approximation. In Electronic Structure of Solids; Ziesche, P., Eschrig, H., Eds.; Akademie Verlag: Berlin, Germangy, 1991; pp. 11–20. [Google Scholar]
- Petersson, G.A.; Bennett, A.; Tensfeldt, T.G.; Al-Laham, M.A.; Shirley, W.A.; Mantzaris, J. A Complete Basis Set Model Chemistry. I. The Total Energies of Closed-Shell Atoms and Hydrides of the First-Row Elements. J. Chem. Phys. 1988, 89, 2193–2218. [Google Scholar] [CrossRef]
- Petersson, G.A.; Al-Laham, M.A. A Complete Basis Set Model Chemistry. II. Open-Shell Systems and the Total Energies of the First-Row Atoms. J. Chem. Phys. 1991, 94, 6081–6090. [Google Scholar] [CrossRef]
- Mooibroek, T.J.; Gamez, P. Halogen···Phenyl Supramolecular Interactions in the Solid State: Hydrogen Versus Halogen Bonding and Directionality. CrystEngComm 2013, 15, 1802–1805. [Google Scholar] [CrossRef]
- Swierczynski, D.; Luboradzki, R.; Dolgonos, G.; Lipkowski, J.; Schneider, H.-J. Non-Covalent Interactions of Organic Halogen Compounds with Aromatic Systems—Analyses of Crystal Structure Data. Eur. J. Org. Chem. 2005, 2005, 1172–1177. [Google Scholar] [CrossRef]
- Kölmel, C.; Palm, G.; Ahlrichs, R.; Bär, M.; Boldyrev, A.I. Ab Initio Study of Structure, Stability and Ionization Potentials of the Anions Pf6− and P2f11−. Chem. Phys. Lett. 1990, 173, 151–156. [Google Scholar] [CrossRef]
- Ponce, V.; Galvez-Aranda, D.E.; Seminario, J.M. Analysis of a Li-Ion Nanobattery with Graphite Anode Using Molecular Dynamics Simulations. J. Phys. Chem. C 2017, 121, 12959–12971. [Google Scholar] [CrossRef]
- Galvez-Aranda, D.E.; Ponce, V.; Seminario, J.M. Molecular Dynamics Simulations of the First Charge of a Li-Ion-Si-Anode Nanobattery. J. Mol. Model. 2017, 23, 120. [Google Scholar] [CrossRef] [PubMed]
- Bauzá, A.; Mooibroek, T.J.; Frontera, A. The Bright Future of Unconventional σ/Π-Hole Interactions. ChemPhysChem 2015, 16, 2496–2517. [Google Scholar] [CrossRef] [PubMed]
- Murray, J.S.; Lane, P.; Politzer, P. Simultaneous σ-Hole and Hydrogen Bonding by Sulfur- and Selenium-Containing Heterocycles. Int. J. Quantum Chem. 2008, 108, 2770–2781. [Google Scholar] [CrossRef]
- Liu, Z.; Balbuena, P.B.; Mukherjee, P.P. Hole Polaron Diffusion in the Final Discharge Product of Lithium—Sulfur Batteries. J. Phys. Chem. C 2017, 121, 17169–17175. [Google Scholar] [CrossRef]
- Liu, Z.; Balbuena, P.B.; Mukherjee, P.P. Revealing Charge Transport Mechanisms in Li2S2 for Li-Sulfur Batteries. J. Phys. Chem. Lett. 2017, 8, 1324–1330. [Google Scholar] [CrossRef] [PubMed]
© 2018 by the authors. Licensee MDPI, Basel, Switzerland. This article is an open access article distributed under the terms and conditions of the Creative Commons Attribution (CC BY) license (http://creativecommons.org/licenses/by/4.0/).