Abstract
We studied the interaction between a Cu-doped graphene layer and a CO2 molecule, using DFT, ab initio calculations, and the pseudopotential formalism. We used the Quantum ESPRESSO code package, with the PBE XC functional expression and the semiempirical Grimme’s DFT-D3 Van der Waals correction. We found that the Cu atom, being absorbed in a C vacancy on the graphene surface, has a catalytic effect on the absorption of CO2 in said surface. The Van der Waals correction calculations showed that the CO2 is physisorbed, with an adsorption energy of −0.1786 eV. Our results are congruent with previously published results. The Cu-doped graphene surface could be suitable for the development of a CO2 sensor.
1. Introduction
It is well established that graphene—a 2D carbon allotrope—has a variety of exceptional electrical, thermal, and mechanical properties [1,2,3,4]. These properties make graphene quite interesting, as they open a wide range of potential applications in different fields like aerospace, materials, and electronics [5,6,7]. Graphene can also help develop environmental monitoring and sensing technologies, for instance, when combined with metal sulfides [8]. Common sulfide semiconductors used in combination with graphene for gas sensors include MoS2, ZnS, SnS2, and CdS. They are used to detect several pollutant gases like nitrogen dioxide (NO2), sulfur dioxide (SO2), carbon monoxide (CO), and carbon dioxide (CO2) [8,9]. Sensors based on epitaxial graphene can detect NO2 levels in the range between 5 and 50 parts per billion [10], and the addition of cuprous oxide (Cu2O) can also enhance the sensing properties of NO2 for graphene–metal sulfide-based gas sensors [11]. A recent work combining DFT calculations and experimentation [12] considered transition metal doping of graphene for the detection of both NO2 and CO2. In that work, the interactions studied were, on one hand, the absorption of CO2 by (Fe, Ni, Zn)-doped graphene, and on the other hand, that of NO2 by (Mn, Co, Cu)-doped graphene. It was found that all interactions considered resulted in chemisorption, and the particular case of Cu-doped graphene interacting with CO2 was not studied in that work.
Although the formation energy of single vacancies in graphene is relatively high, the feasibility of a Cu atom absorbed in the place of such a vacancy is validated by the fact that single vacancies have been extensively observed in previous experiments [13,14,15,16,17].
Cu is also used in Cu/ZnO particles to catalyze partial CO2 hydrogenation to methanol when supported in graphitic carbon structures [18]. Graphene-based optical, electrochemical, and electronic sensors are also being developed for water monitoring, targeting mercury ions (Hg2+) and other heavy metals [19,20,21].
Of particular interest is the sensing of CO2, which generally shows a weak interaction with graphene-based materials [22,23,24]. There are different strategies to enhance the sensing properties of graphene-based systems. These include using epitaxial growth to obtain controlled graphene layers [10,25], composite formation to improve selectivity [26], and doping or functionalizing graphene surfaces [20]. Recent advances in heteroatom doping have unlocked new avenues to tailor graphene’s chemical reactivity and electronic structure [27]. For instance, nitrogen doping of graphene—in the form of graphitic-N and pyridinic-N defects—has been shown to catalyze CO2 physisorption [28] or even chemisorption with the aid of an electric field [27].
First-principles studies have found the CO2 absorption and sensing performance of MN4-doped graphene, where M stands for different transition metals, including Cu. For the CuN4 G case, the CO2 is found to be physisorbed [28]. A tetracyanoethylene-modified graphene surface has also been considered as a potential sensor for CO2 [24]. Others have quantified the adsorption of CO2 on Cu-functionalized graphene, finding the former is chemisorbed for a Cu7/graphene system [23].
Copper is sufficiently abundant in the environment—it is the 26th most abundant element [29]—and Cu doping preserves graphene’s high surface area and conductivity and catalyzes its adsorption capabilities. This makes technologies based on Cu-doped graphene a promising addition to the expanding set of techniques for CO2 mitigation and detection [30,31]. In this work, we use DFT calculations of CO2 adsorption on a Cu-doped graphene sheet to further understand the role of dopant geometry and charge transfer in their interactions, offering a predictive framework for experimental validation. As global efforts to combat climate change intensify, understanding these absorption mechanisms can help develop scalable CO2 management and precision environmental monitoring technologies.
2. Materials and Methods
Applying Density Functional Theory (DFT) [32,33,34] methods, we performed ab initio calculations, under the Born–Oppenheimer approximation [35]. The initial structures used in this work were obtained from the Crystallography Open Database (COD) [36,37,38,39]. In particular, structures labeled 1010492 for CO2 [40] and 1200017 for graphite [41] were the base for building the unit cells studied in this work.
We used the open-source software package Quantum ESPRESSO, which considers periodic boundary conditions and plane waves for the basis set [42,43]. The Troullier–Martins norm-conserving pseudopotentials were also used, in the Kleinman–Bylander entirely separable form [44,45,46]. We considered the GGA approximation for the exchange and correlation energies, with the Perdew–Burke–Ernzerhof expression [47] as well as the semiempirical Grimme’s DFT–D3 van der Waals correction [48]. The program cif2cell [49] was used to transform the COD CIF structures into the Quantum ESPRESSO format.
The valence electronic states were considered as follows: for carbon: 2s22p2; for oxygen: 2s22p4; for copper: 4s1.53d9.5. The cut-off radii for the pseudopotentials considered are, for carbon: rs = 0.529 Å and rp = 0.476 Å; for oxygen: rs = rp = 0.529 Å; for copper: rs = rp = 0.688 Å. The calculations reported in this work are non-relativistic and non-polarized, because we are not interested in the magnetic properties of the system.
After a standard parameter optimization procedure, the cut-off energy was set to 1088 eV or 80 Ry, and the k-points mesh was fixed at a size of 4 × 4 × 1, within the Monkhorst–Pack special k-point scheme [50]. The threshold energy convergence was 1.1 × 10⁻⁵ eV. The structural relaxations performed are static calculations made by selecting the option ‘relax’ in the Quantum ESPRESSO input file. These calculations consider a vacuum around the samples. The Löwdin method was used for the charge population analysis [51,52,53]. We used the XCrySDen visualization software [54] to visualize the structures, VESTA to visualize the charge density plots [55], and Veusz to plot the partial density of states (PDOS) graphs [56], all of which are free software.
In this work, we calculate and report the absorption energies according to the following equation [57]:
The first term on the right side of Equation (1) is the total energy of the compound system. For the CO2 absorption exploration, this refers to the final configuration of the system involving both the CO2 molecule and the Cu-doped graphene surface. The second and third terms on the right side of Equation (1) correspond to the total energies—after being structurally relaxed separately—of the Cu-doped graphene system, and the Cu atom, respectively. In this work, the criterion to classify an interaction as either physisorption or chemisorption considers chemisorption when the binding energies are larger than 0.5 eV per atom (see [57], p. 195).
3. Results
3.1. Structure Optimization
We first relaxed the CO2 molecule to validate the pseudopotential, obtaining 1.1722 Å and 1.1723 Å for the C-O bond lengths, and 179.99° for the angle between the three atoms. The relaxed structure coincides with the experimental values of 1.1600 Å and 180° [58], with a maximum discrepancy of 1% with respect to the experimental values.
The unit cell considered includes 50 carbon atoms, and it has a side length of 12.31 Å in the a and b directions, as shown in Figure 1. The length of the unit cell in the c direction is 2.5 times that of the a and b directions, that is, 30.77 Å. This choice minimizes the spurious interactions between elements of the unit cell and their repetitions in adjacent unit cells, due to the use of periodic boundary conditions. In this way, the interactions at the graphene surface are modeled more accurately. We first performed a geometric relaxation calculation to optimize the structure of the graphene surface.
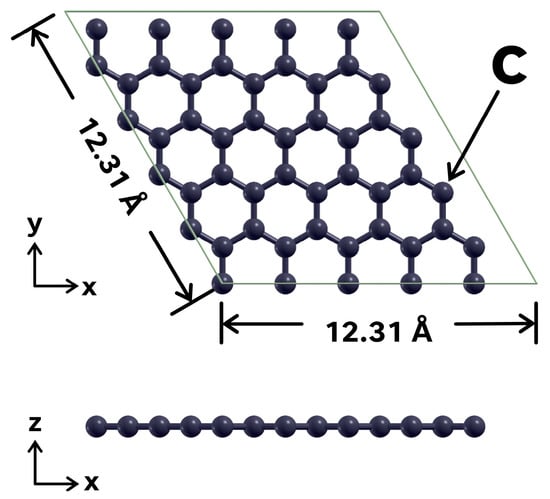
Figure 1.
Unit cell considered. The graphene sheet includes 50 C atoms. The vertical direction of the unit cell is 30.77 Å, large enough to avoid spurious interactions with image repetitions due to the use of periodical boundary conditions.
3.2. Absorption of a Cu Atom into the Graphene Sheet with a Vacancy (49G)
After the structure was geometrically optimized, a C atom was removed from the central region of the unit cell, to create a vacancy. After relaxing the resultant surface, labeled as 49G, we studied the interaction of a Cu atom with said 49G surface. The Cu atom was initially placed at 3 Å above the vacancy. A subsequent geometrical optimization showed that the Cu atom is promptly absorbed in the vacancy site, with an absorption energy of −3.5439 eV.
Table 1 shows the Löwdin charges for the Cu atom and the twelve carbon atoms nearest to it, for the initial and final configurations. The C atoms around the vacancy are labeled according to the labeling on Figure 2. The charges in Table 1 refer to the number of electrons present on each atom, concerning their valence charge. The partial charge values in the Löwdin charge analysis are meant to give a general idea of the reactivity, type of bond, or charge transfer direction for the selected atoms in the absorption process [51].

Table 1.
Lowdin charges analysis for the initial and final configurations of the absorption of a Cu atom in the 49G surface. The labeling C# for the C atoms corresponds to that of Figure 2.
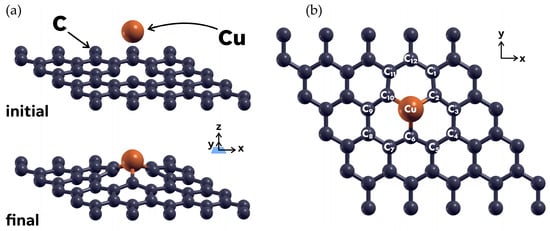
Figure 2.
(a) Initial and final configurations of the 49G + Cu system, after a relaxation calculation. The Cu atom was initially placed at 3 Å above the graphene surface, and it gets absorbed by the latter after a DFT relaxation calculation. (b) XY plane view of the final configuration. The twelve C atoms nearest to the Cu atom were labeled in a clockwise way, to identify them for the Lowdin charge analysis in Table 1.
As can be seen from Table 1, there is a measurable charge transfer from the C atoms to the Cu atom, particularly from the atoms nearest to it (C2, C6, and C10). This fact, along with the high absorption energy of Cu for this case, allows us to classify it as chemisorption.
Figure 3 shows a charge density plot corresponding to the final optimized structure of the 49G + Cu system (see Figure 2a), after the Cu atom is chemisorbed by the graphene at the vacancy site. The isosurface level in Figure 3 was set to 0.1, indicating that 90% of the electrons in the systems are expected to be inside the surface.
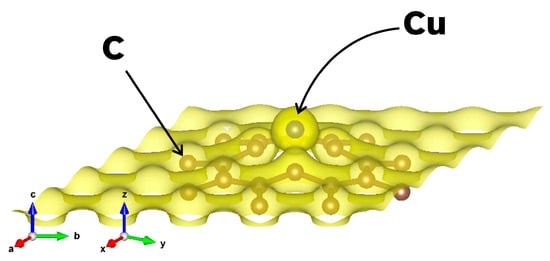
Figure 3.
Charge density plot for the optimized configuration of the 49G + Cu system. The isosurface contains 90% of the electrons, and it shows a presence of electronic charge between the chemisorbed Cu atom and the graphene surface. This is congruent with the findings from Table 1, indicating a charge transfer in the system.
3.3. Absorption of a CO2 Molecule into the 49G + Cu Composite
Next, we explored the interaction between a CO2 molecule and the graphene surface with the substitutionally absorbed copper atom, which we labeled as 49G + Cu. The first calculation, using the PBE functional but no Van der Waals correction, showed no interaction between the carbon dioxide and the Cu-doped graphene surface. We then added Grimme’s DFT-D3 Van der Waals correction, and the structural relaxation showed that the CO2 molecule was physisorbed by the 49G + Cu system, with an adsorption energy of −0.1786 eV. Figure 4 shows the initial and final configurations for this case. The initial vertical distance between the CO2 and the functionalized graphene surface was 3 Å.
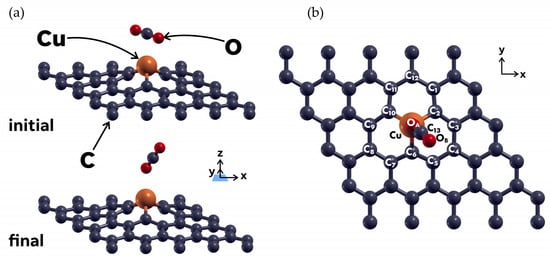
Figure 4.
(a) Initial and final configurations of the 49G + Cu system and the CO2 molecule interacting with it, after a relaxation calculation. The CO2 molecule was placed at 3 Å above the 49G + Cu surface. Relaxation calculations using Grimme’s DFT-D3 Van der Waals correction showed that the CO2 molecule is physisorbed by the composite system (b) XY plane view of the final configuration. The atom labeling corresponds to the Löwdin charge analysis shown in Table 2.
As in the previous case, Table 2 shows the Löwdin charge analysis for the absorption of the CO2 molecule into the Cu-doped graphene surface. The charge transfer mainly involves both oxygen atoms from the CO2 molecule (OA, OB in Figure 4b), the C atoms closest to the Cu atom (C2, C6, C10), and the Cu atom. The charge seems to have also been transferred from the set of carbon atoms (C1, C11, and C12) in the general direction pointed at by the CO2 molecule axis line, for the final configuration. The low adsorption energy obtained in this case and the small amount of charge transfer allow us to classify this interaction as a physisorption.

Table 2.
Lowdin charges analysis for the initial and final configurations of the absorption of a CO2 molecule in the 49G surface. The atom labeling corresponds to that of Figure 3.
As before, Figure 5 is a charge density plot corresponding to the final optimized structure of the 49G + Cu and CO2 system (see Figure 4a). The isosurface level was set as 0.1 as well. According to this figure, the charge transfer between the CO2 and the 49G + Cu system seems to be quite negligible. The physisorption in this case is suggested by the low absorption energy and the quite small amount of charge transferred according to Table 2.
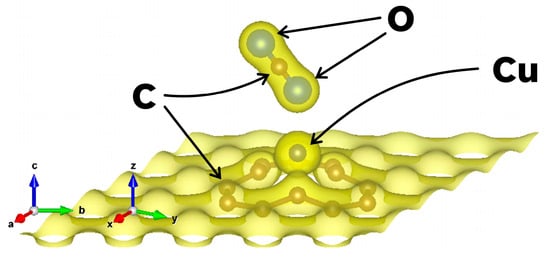
Figure 5.
Charge density plot for the optimized configuration of the 49G + Cu system and the CO2 molecule. The isosurface again contains 90% of the electrons, and it does not show a presence of electronic charge between the CO2 and the Cu-doped graphene surface.
3.4. PDOS of the Cases Considered
We then calculated the projected density of states (PDOS) for the cases considered in this work. Figure 6 shows the PDOS for said cases. We included the PDOS for the pristine graphene as a reference. The catalyzer effect of the Cu atom on the graphene surface is more evident at the bottom-right section of Figure 6, where the Cu 3d orbitals show signs of hybridization with the O 2p orbitals from the CO2 molecule. This is congruent with the charge transfer shown in the Löwdin analysis.
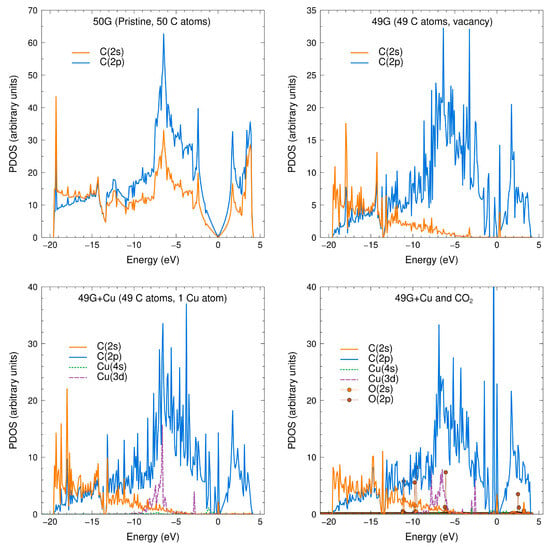
Figure 6.
PDOS for the cases considered in this work. (Top left): The characteristic pristine graphene PDOS structure is reproduced, with its Dirac cone at the Fermi level. (Top right): The addition of a vacancy destroys the Dirac cone. The C 2s orbitals are reduced in the vicinity of the Fermi level. (Bottom left): The Cu atom further adds states that can catalyze the physisorption of the CO2 molecule. (Bottom right): PDOS for the interaction between the CO2 molecule and the composite system. The O 2p orbitals of CO2 appear to hybridize with the Cu 3d orbital.
3.5. Additional Cases Considered
We considered an additional case that showed results of less interest. This consisted of adding a second Cu atom to the 49G + Cu system. The second Cu atom was placed 3 Å directly above the previously absorbed Cu atom, and it was swiftly chemisorbed by it (see Figure 7a). The absorption energy for the second Cu atom was −3.0961 eV, with a 12.6% reduction in the energy with respect to the chemisorption of the first Cu atom. Subsequently, we studied the interaction of a CO2 molecule with the 49 + 2Cu system, which turned out to be rather small but different from zero (see Figure 7b). The absorption energy in this case was only −0.0428 eV, which is probably too low to make this case suitable for CO2 sensing.
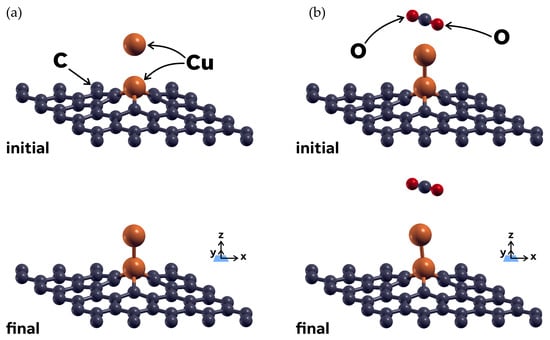
Figure 7.
We considered an additional case where a second Cu atom was placed 3 Å above the already chemisorbed Cu atom. Part (a) (left) shows the initial and final configurations of the structural relaxation that resulted in chemisorption of the second Cu atom. Part (b) (right) shows the subsequent interaction between the CO2 molecule and the 49 + 2Cu system. The CO2 molecule moves further above the system before stabilizing, with a calculated absorption energy of only –0.0428 eV.
4. Discussion
In this work, we studied the catalytic effect that a Cu atom can have on the possible absorption of a CO2 molecule into a graphene surface, when the Cu atom is substitutionally absorbed in a vacancy, with an absorption energy of −3.5439 eV, which can be safely classified as chemisorption. We found that, when weak interactions are considered by means of a Van der Waals correction, the previously chemisorbed Cu atom can promote the physisorption of a CO2 molecule into a graphene surface, with an adsorption energy of −0.1786 eV. The Löwdin charge analysis and PDOS for the cases considered confirm the physisorption mechanism. In particular, the PDOS in Figure 4 shows a degree of hybridization between the O 2p orbitals from the CO2 and the Cu 3d orbital. This is also in general quantitative agreement with previous studies [22,23,28]. The work by Cai & Luo [28] explored a similar case as ours, considering a complex structure of CuN4-doped graphene. The four N atoms surrounded the Cu atom in a symmetrical array, as if they were anchoring the Cu, while enlarging the vacancy where the former would be absorbed. In that study, the Cu atom was perfectly aligned with the rest of the C atoms in the plane of the graphene surface. They found that the CO2 was physisorbed for that system, and the linear Cu–O–C–O structure from their initial configuration is maintained (see Figure 3 in [28]).
There are several differences worth pointing out in our study compared to [28]. Firstly, we omitted the N atoms, considering it would be interesting to see if the Cu atom would suffice to attract the CO2. In both studies, a physisorption of the CO2 by the Cu-doped graphene is observed. Quantitatively, we found further differences, because the adsorption energy in [28] is −4.6060 × 10⁻⁴ Hartree, or −0.0125 eV (see Table 4 in [28]), which is about 14 times smaller than the adsorption energy we found for CO2.
Additionally, there are two possible reasons why the vertical linear Cu–O–C–O structure observed in [28] is not maintained in our study. Firstly, the smaller vacancy space in which the Cu atom was chemisorbed made it difficult for the structure to remain completely symmetrical after the geometrical relaxation; so much so that in this work, the Cu atom protrudes from the graphene surface. This could in turn cause an asymmetrical configuration when the CO2 interacts with the composite surface. Secondly, the initial position of the CO2 in our study is different from the one in [28]. In that study, the CO2 axis is vertically aligned, with one of the O atoms facing the Cu atom. The axis is horizontally aligned in ours, with the C atom placed above the Cu. Our study had no linear structure to begin with, and we placed it that way because we wanted to further explore the Cu-doped graphene’s ability to absorb CO2 in a different, less symmetrical configuration. These two factors may have influenced the different final configuration observed between studies.
The unit cell considered in this work (see Section 3.1) is also larger than that of [28], which contains 26 C atoms and N atoms, besides the Cu and CO2. In this way, the effect of the Cu doping can be evaluated in more detail, as the periodic repetitions due to the boundary conditions used by Quantum ESPRESSO are farther away between them.
A comparison with the study by Lisovski et al. [23] is also worthwhile. This study focuses on different Cu doping schemes for graphene, and they also considered the case of a single Cu atom on a graphene surface with a single vacancy. Both studies coincide quite well in the reported absorption energy of the Cu atom in the graphene vacancy site, which was −3.59 eV in [23], compared with the value of −3.5439 eV from this work.
The energy of vacancy formation reported in [23] is relatively large (17.5 eV), from which the authors did not explore the interaction of Cu absorbed in a single vacancy of graphene and its interaction with CO2. However, as mentioned in the Introduction, single vacancies in graphene have been widely observed in previous experimental investigations [13,14,15,16,17]. They can be created by irradiating the graphene or by rapid quenching, and they have been the subject of extensive experimental and theoretical studies because of the great impact they have on the properties of graphene [59,60,61,62]. Experiments have demonstrated that Cu atoms are stable in pre-existing defects on graphene layers [63,64,65,66,67]. According to Zhang et al. [68], nitrogen-doped graphene is one of the most common types of these defects, and it exhibits good binding energies. They focused on single-atom catalysts and reported that a system with a Cu atom embedded in nitrogen-doped graphene can be stably anchored. This system shows an adsorption energy of 0.25 eV, which is very close to our own value of approximately 0.17 eV, both of which fall within the physisorption range. The charge density difference isosurface presented in their findings indicates that the electrochemical activity is primarily located at the defect site and the Cu atom, aligning with our results and the electronic interactions identified through our charge analysis.
Finally, an addition not considered in previous studies was that of a second Cu atom. As can be seen in Section 3.5, we found that the 2Cu doping of graphene decreases the already weak interaction with the CO2 molecule. The resulting adsorption energy of the CO2 for this case is –0.0428 eV, which is of the same order of magnitude as the one reported in [28], discussed above. This suggests an equivalence between a 2Cu/graphene system and a CuN4/graphene one. The bimetallic analysis included in Section 3.5 provides complementary insights that could inform the rational design of Cu-doped graphene-based catalysis, aimed at potential applications for CO2 sensing and environmental monitoring.
Author Contributions
Conceptualization, R.M.d.C.V. and J.M.R.-d.-A.; data curation, J.O.L.F. and J.M.R.-d.-A.; formal analysis, J.O.L.F., R.M.d.C.V. and J.M.R.-d.-A.; funding acquisition, R.M.d.C.V. and J.M.R.-d.-A.; investigation, J.O.L.F., R.M.d.C.V. and J.M.R.-d.-A.; methodology J.O.L.F., R.M.d.C.V. and J.M.R.-d.-A.; project administration, R.M.d.C.V. and J.M.R.-d.-A.; supervision, R.M.d.C.V. and J.M.R.-d.-A.; validation, J.O.L.F., R.M.d.C.V. and J.M.R.-d.-A.; writing—original draft, J.M.R.-d.-A.; writing—review and editing, R.M.d.C.V. and J.M.R.-d.-A. All authors have read and agreed to the published version of the manuscript.
Funding
Dirección General de Asuntos del Personal Académico de la Universidad Nacional Autónoma de México (DGAPA-UNAM), by grant number PAPIIT DGAPA IN109124, and LANCAD-UNAM-DGTIC-385.
Data Availability Statement
The raw data supporting the conclusions of this article will be made available by the authors on request.
Acknowledgments
We thank (DGAPA-UNAM) for partial financial support by Grant PAPIIT DGAPA IN109124. We also appreciate UNAM-Miztli-Super-Computing Center technical assistance by the project LANCAD-UNAM-DGTIC-385.
Conflicts of Interest
The authors declare no conflicts of interest.
References
- Novoselov, K.S.; Geim, A.K.; Morozov, S.V.; Jiang, D.; Zhang, Y.; Dubonos, S.V.; Grigorieva, I.V.; Firsov, A.A. Electric Field Effect in Atomically Thin Carbon Films. Science 2004, 306, 666–669. [Google Scholar] [CrossRef] [PubMed]
- Lee, C.; Wei, X.; Kysar, J.W.; Hone, J. Measurement of the elastic properties and intrinsic strength of monolayer graphene. Science 2008, 321, 385–388. [Google Scholar] [CrossRef]
- Han, Z.; Ruan, X. Thermal conductivity of monolayer graphene: Convergent and lower than diamond. Phys. Rev. B 2023, 108, L121412. [Google Scholar] [CrossRef]
- Cao, K.; Feng, S.; Han, Y.; Gao, L.; Hue Ly, T.; Xu, Z.; Lu, Y. Elastic straining of free-standing monolayer graphene. Nat. Commun. 2020, 11, 284. [Google Scholar] [CrossRef] [PubMed]
- Siochi, E.J. Graphene in the sky and beyond. Nat. Nanotechnol. 2014, 9, 745–747. [Google Scholar] [CrossRef]
- Sood, A.K.; Lund, I.; Puri, Y.R.; Efstathiadis, H.; Haldar, P.; Dhar, N.K.; Lewis, J.; Dubey, M.; Zakar, E.; Wijewarnasuriya, P.; et al. Review of Graphene Technology and Its Applications for Electronic Devices. In Graphene—New Trends and Developments; Ebrahimi, F., Ed.; InTech: London, UK, 2015; ISBN 978-953-51-2220-3. [Google Scholar]
- Lavagna, L.; Meligrana, G.; Gerbaldi, C.; Tagliaferro, A.; Bartoli, M. Graphene and Lithium-Based Battery Electrodes: A Review of Recent Literature. Energies 2020, 13, 4867. [Google Scholar] [CrossRef]
- Balram, D.; Lian, K.-Y.; Sebastian, N.; Kumar, V.; Yadav, V.K.; Patel, A.; Singh, K. Graphene-metal sulfide composite based gas sensors for environmental sustainability: A review. Sens. Int. 2024, 5, 100269. [Google Scholar] [CrossRef]
- Hong, H.S.; Phuong, N.H.; Huong, N.T.; Nam, N.H.; Hue, N.T. Highly sensitive and low detection limit of resistive NO2 gas sensor based on a MoS2/graphene two-dimensional heterostructures. Appl. Surf. Sci. 2019, 492, 449–454. [Google Scholar] [CrossRef]
- Novikov, S.; Lebedeva, N.; Satrapinski, A.; Walden, J. Graphene Based Sensor for Environmental Monitoring of NO2. Procedia Eng. 2015, 120, 586–589. [Google Scholar] [CrossRef]
- Ding, Y.; Guo, X.; Kuang, D.; Hu, X.; Zhou, Y.; He, Y.; Zang, Z. Hollow Cu2O nanospheres loaded with MoS2/reduced graphene oxide nanosheets for ppb-level NO2 detection at room temperature. J. Hazard. Mater. 2021, 416, 126218. [Google Scholar] [CrossRef]
- Mollaamin, F.; Monajjemi, M. Transition metal (X = Mn, Fe, Co, Ni, Cu, Zn)-doped graphene as gas sensor for CO2 and NO2 detection: A molecular modeling framework by DFT perspective. J. Mol. Model. 2023, 29, 119. [Google Scholar] [CrossRef] [PubMed]
- Bhatt, M.D.; Kim, H.; Kim, G. Various defects in graphene: A review. RSC Adv. 2022, 12, 21520–21547. [Google Scholar] [CrossRef]
- Gass, M.H.; Bangert, U.; Bleloch, A.L.; Wang, P.; Nair, R.R.; Geim, A.K. Free-standing graphene at atomic resolution. Nat. Nanotechnol. 2008, 3, 676–681. [Google Scholar] [CrossRef]
- Meyer, J.C.; Kisielowski, C.; Erni, R.; Rossell, M.D.; Crommie, M.F.; Zettl, A. Direct Imaging of Lattice Atoms and Topological Defects in Graphene Membranes. Nano Lett. 2008, 8, 3582–3586. [Google Scholar] [CrossRef]
- Yazyev, O.V.; Helm, L. Defect-induced magnetism in graphene. Phys. Rev. B 2007, 75, 125408. [Google Scholar] [CrossRef]
- Zhang, Y.; Li, S.-Y.; Huang, H.; Li, W.-T.; Qiao, J.-B.; Wang, W.-X.; Yin, L.-J.; Bai, K.-K.; Duan, W.; He, L. Scanning Tunneling Microscopy of the π Magnetism of a Single Carbon Vacancy in Graphene. Phys. Rev. Lett. 2016, 117, 166801. [Google Scholar] [CrossRef] [PubMed]
- Peng, L.; Jurca, B.; Garcia-Baldovi, A.; Tian, L.; Sastre, G.; Primo, A.; Parvulescu, V.; Dhakshinamoorthy, A.; Garcia, H. Nanometric Cu-ZnO Particles Supported on N-Doped Graphitic Carbon as Catalysts for the Selective CO2 Hydrogenation to Methanol. Nanomaterials 2024, 14, 476. [Google Scholar] [CrossRef]
- Liu, C.; Chen, X.; Zong, B.; Mao, S. Recent advances in sensitive and rapid mercury determination with graphene-based sensors. J. Mater. Chem. A 2019, 7, 6616–6630. [Google Scholar] [CrossRef]
- Molina, J.; Cases, F.; Moretto, L.M. Graphene-based materials for the electrochemical determination of hazardous ions. Anal. Chim. Acta 2016, 946, 9–39. [Google Scholar] [CrossRef]
- Zhang, T.; Liu, J.; Wang, C.; Leng, X.; Xiao, Y.; Fu, L. Synthesis of graphene and related two-dimensional materials for bioelectronics devices. Biosens. Bioelectron. 2017, 89, 28–42. [Google Scholar] [CrossRef]
- Del Castillo, R.M.; Calles, A.G.; Espejel-Morales, R.; Hernández-Coronado, H. Adsorption of CO2 on graphene surface modified with defects. Comput. Condens. Matter 2018, 16, e00315. [Google Scholar] [CrossRef]
- Lisovski, O.; Piskunov, S.; Bocharov, D.; Zhukovskii, Y.; Kleperis, J.; Knoks, A.; Lesnicenoks, P. CO2 and CH2 Adsorption on Copper-Decorated Graphene: Predictions from First Principle Calculations. Crystals 2022, 12, 194. [Google Scholar] [CrossRef]
- Osouleddini, N.; Rastegar, S.F. DFT study of the CO2 and CH4 assisted adsorption on the surface of graphene. J. Electron Spectrosc. Relat. Phenom. 2019, 232, 105–110. [Google Scholar] [CrossRef]
- Melios, C.; Panchal, V.; Edmonds, K.; Lartsev, A.; Yakimova, R.; Kazakova, O. Detection of Ultralow Concentration NO2 in Complex Environment Using Epitaxial Graphene Sensors. ACS Sens. 2018, 3, 1666–1674. [Google Scholar] [CrossRef] [PubMed]
- Joucken, F.; Henrard, L.; Lagoute, J. Electronic properties of chemically doped graphene. Phys. Rev. Mater. 2019, 3, 110301. [Google Scholar] [CrossRef]
- Esrafili, M.D. Electric field assisted activation of CO2 over P-doped graphene: A DFT study. J. Mol. Graph. Model. 2019, 90, 192–198. [Google Scholar] [CrossRef] [PubMed]
- Cai, Y.; Luo, X. First-principles investigation of carbon dioxide adsorption on MN 4 doped graphene. AIP Adv. 2020, 10, 125013. [Google Scholar] [CrossRef]
- Emsley, J. Nature’s Building Blocks: An A-Z Guide to the Elements; Reprinted with corrections; Oxford University Press: Oxford, UK, 2003; ISBN 978-0-19-850340-8. [Google Scholar]
- Lecomte, F.; Broutin, P.; Lebas, É.; Jones, T. CO2 Capture: Technologies to Reduce Greenhouse Gas Emissions; IFP Publications; Éd. Technip: Paris, France, 2010; ISBN 978-2-7108-0948-7. [Google Scholar]
- Rana, A.; Andino, J.M. A Review of Materials for Carbon Dioxide Capture. Catalysts 2025, 15, 273. [Google Scholar] [CrossRef]
- Dreizler, R.M.; Gross, E.K.U. Density Functional Theory; Springer: Berlin/Heidelberg, Germany, 1990; ISBN 978-3-642-86107-9. [Google Scholar]
- Cottenier, S. Density Functional Theory and the Family of (L)APW-Methods: A Step-by-Step Introduction, 2nd ed.; Independently published: Leuven, Belgium, 2013; ISBN 978-90-807215-1-7. [Google Scholar]
- Parr, R.G.; Yang, W. Density-Functional Theory of Atoms and Molecules; International series of monographs on chemistry; Oxford University Press: Oxford, UK; Clarendon Press: New York, NY, USA, 1989; ISBN 978-0-19-504279-5. [Google Scholar]
- Born, M.; Oppenheimer, R. Zur Quantentheorie der Molekeln. Ann. Phys. 1927, 389, 457–484. [Google Scholar] [CrossRef]
- Gražulis, S.; Chateigner, D.; Downs, R.T.; Yokochi, A.F.T.; Quirós, M.; Lutterotti, L.; Manakova, E.; Butkus, J.; Moeck, P.; Le Bail, A. Crystallography Open Database—An open-access collection of crystal structures. J. Appl. Crystallogr. 2009, 42, 726–729. [Google Scholar] [CrossRef]
- Gražulis, S.; Daškevič, A.; Merkys, A.; Chateigner, D.; Lutterotti, L.; Quirós, M.; Serebryanaya, N.R.; Moeck, P.; Downs, R.T.; Le Bail, A. Crystallography Open Database (COD): An open-access collection of crystal structures and platform for world-wide collaboration. Nucleic Acids Res. 2012, 40, D420–D427. [Google Scholar] [CrossRef]
- Gražulis, S.; Merkys, A.; Vaitkus, A.; Okulič-Kazarinas, M. Computing stoichiometric molecular composition from crystal structures. J. Appl. Crystallogr. 2015, 48, 85–91. [Google Scholar] [CrossRef] [PubMed]
- Vaitkus, A.; Merkys, A.; Gražulis, S. Validation of the Crystallography Open Database using the Crystallographic Information Framework. J. Appl. Crystallogr. 2021, 54, 661–672. [Google Scholar] [CrossRef] [PubMed]
- De Smedt, J.; Keesom, W.H. XVI. Das Gitter des festen Kohlendioxyds. Z. Für Krist.-Cryst. Mater. 1925, 62, 312–313. [Google Scholar] [CrossRef]
- Hassel, O.; Mark, H. Über die Kristallstruktur des Graphits. Z. Für Phys. 1924, 25, 317–337. [Google Scholar] [CrossRef]
- Giannozzi, P.; Andreussi, O.; Brumme, T.; Bunau, O.; Buongiorno Nardelli, M.; Calandra, M.; Car, R.; Cavazzoni, C.; Ceresoli, D.; Cococcioni, M.; et al. Advanced capabilities for materials modelling with Quantum ESPRESSO. J. Phys. Condens. Matter 2017, 29, 465901. [Google Scholar] [CrossRef] [PubMed]
- Giannozzi, P.; Baroni, S.; Bonini, N.; Calandra, M.; Car, R.; Cavazzoni, C.; Ceresoli, D.; Chiarotti, G.L.; Cococcioni, M.; Dabo, I.; et al. QUANTUM ESPRESSO: A modular and open-source software project for quantum simulations of materials. J. Phys. Condens. Matter 2009, 21, 395502. [Google Scholar] [CrossRef]
- Harrison, W.A. Pseudopotentials in the Theory of Metals; University of Virginia: Charlottesville, VA, USA, 1966. [Google Scholar]
- Troullier, N.; Martins, J. A straightforward method for generating soft transferable pseudopotentials. Solid State Commun. 1990, 74, 613–616. [Google Scholar] [CrossRef]
- Phillips, J.C.; Kleinman, L. New Method for Calculating Wave Functions in Crystals and Molecules. Phys. Rev. 1959, 116, 287–294. [Google Scholar] [CrossRef]
- Perdew, J.P.; Burke, K.; Ernzerhof, M. Generalized Gradient Approximation Made Simple. Phys. Rev. Lett. 1996, 77, 3865, Erratum in Phys. Rev. Lett. 1997, 78, 1396. [Google Scholar] [CrossRef]
- Grimme, S.; Antony, J.; Ehrlich, S.; Krieg, H. A consistent and accurate ab initio parametrization of density functional dispersion correction (DFT-D) for the 94 elements H-Pu. J. Chem. Phys. 2010, 132, 154104. [Google Scholar] [CrossRef]
- Björkman, T. CIF2Cell: Generating geometries for electronic structure programs. Comput. Phys. Commun. 2011, 182, 1183–1186. [Google Scholar] [CrossRef]
- Monkhorst, H.J.; Pack, J.D. Special points for Brillouin-zone integrations. Phys. Rev. B 1976, 13, 5188–5192. [Google Scholar] [CrossRef]
- Cramer, C.J. Essentials of Computational Chemistry: Theories and Models, 2nd ed.; Wiley: Chichester, UK; Hoboken, NJ, USA, 2004; ISBN 978-0-470-09182-1. [Google Scholar]
- Cusachs, L.C.; Politzer, P. On the problem of defining the charge on an atom in a molecule. Chem. Phys. Lett. 1968, 1, 529–531. [Google Scholar] [CrossRef]
- Löwdin, P.-O. On the Nonorthogonality Problem. In Advances in Quantum Chemistry; Elsevier: Amsterdam, The Netherlands, 1970; Volume 5, pp. 185–199. ISBN 978-0-12-034805-3. [Google Scholar]
- Kokalj, A. XCrySDen—A new program for displaying crystalline structures and electron densities. J. Mol. Graph. Model. 1999, 17, 176–179. [Google Scholar] [CrossRef]
- Momma, K.; Izumi, F. VESTA 3 for three-dimensional visualization of crystal, volumetric and morphology data. J. Appl. Crystallogr. 2011, 44, 1272–1276. [Google Scholar] [CrossRef]
- Sanders, J. Veusz—A Scientific Plotting Package. 2023. Available online: https://veusz.github.io/ (accessed on 1 April 2025).
- Oura, K.; Lifshits, V.G.; Saranin, A.A.; Zotov, A.V.; Katayama, M. Surface Science: An Introduction; Springer: Berlin/Heildeberg, Germany; New York, NY, USA, 2003; ISBN 978-3-540-00545-2. [Google Scholar]
- Haynes, W.M. CRC Handbook of Chemistry and Physics: A Ready-Reference Book of Chemical and Physical Data, 97th ed.; CRC Press: Boca Raton, FL, USA; London, UK; New York, NY, USA, 2017; ISBN 978-1-4987-5429-3. [Google Scholar]
- Amara, H.; Latil, S.; Meunier, V.; Lambin, P.; Charlier, J.-C. Scanning tunneling microscopy fingerprints of point defects in graphene: A theoretical prediction. Phys. Rev. B 2007, 76, 115423. [Google Scholar] [CrossRef]
- Warner, J.H.; Rümmeli, M.H.; Ge, L.; Gemming, T.; Montanari, B.; Harrison, N.M.; Büchner, B.; Briggs, G.A.D. Structural transformations in graphene studied with high spatial and temporal resolution. Nat. Nanotechnol. 2009, 4, 500–504. [Google Scholar] [CrossRef]
- Banhart, F.; Kotakoski, J.; Krasheninnikov, A.V. Structural Defects in Graphene. ACS Nano 2011, 5, 26–41. [Google Scholar] [CrossRef]
- Wang, M.C.; Yan, C.; Ma, L.; Hu, N.; Chen, M.W. Effect of defects on fracture strength of graphene sheets. Comput. Mater. Sci. 2012, 54, 236–239. [Google Scholar] [CrossRef]
- Yamada, Y.; Miyauchi, M.; Kim, J.; Hirose-Takai, K.; Sato, Y.; Suenaga, K.; Ohba, T.; Sodesawa, T.; Sato, S. Exfoliated graphene ligands stabilizing copper cations. Carbon 2011, 49, 3375–3378. [Google Scholar] [CrossRef]
- Bulushev, D.A.; Chuvilin, A.L.; Sobolev, V.I.; Stolyarova, S.G.; Shubin, Y.V.; Asanov, I.P.; Ishchenko, A.V.; Magnani, G.; Riccò, M.; Okotrub, A.V.; et al. Copper on carbon materials: Stabilization by nitrogen doping. J. Mater. Chem. A 2017, 5, 10574–10583. [Google Scholar] [CrossRef]
- Meng, F.; Peng, M.; Chen, Y.; Cai, X.; Huang, F.; Yang, L.; Liu, X.; Li, T.; Wen, X.; Wang, N.; et al. Defect-rich graphene stabilized atomically dispersed Cu3 clusters with enhanced oxidase-like activity for antibacterial applications. Appl. Catal. B Environ. 2022, 301, 120826. [Google Scholar] [CrossRef]
- Islam, A.E.; Susner, M.A.; Carpena-Núñez, J.; Back, T.C.; Rao, R.; Jiang, J.; Pachter, R.; Tenney, S.A.; Boeckl, J.J.; Maruyama, B. Defect engineering of graphene using electron-beam chemistry with radiolyzed water. Carbon 2020, 166, 446–455. [Google Scholar] [CrossRef]
- Li, Y.; He, Z.; Wu, F.; Wang, S.; Cheng, Y.; Jiang, S. Defect engineering of high-loading single-atom catalysts for electrochemical carbon dioxide reduction. Mater. Rep. Energy 2023, 3, 100197. [Google Scholar] [CrossRef]
- Zhang, Y.; Xu, W.; Kumar, A.; Sun, H.; Cao, A.; Zhang, Z.; Jiang, Z.; Yang, Z.; Dong, J.; Li, Y. CO2 reduction performance of Cu/Er supported on N-doped graphene: A first principles study. Mol. Catal. 2023, 547, 113335. [Google Scholar] [CrossRef]
Disclaimer/Publisher’s Note: The statements, opinions and data contained in all publications are solely those of the individual author(s) and contributor(s) and not of MDPI and/or the editor(s). MDPI and/or the editor(s) disclaim responsibility for any injury to people or property resulting from any ideas, methods, instructions or products referred to in the content. |
© 2025 by the authors. Licensee MDPI, Basel, Switzerland. This article is an open access article distributed under the terms and conditions of the Creative Commons Attribution (CC BY) license (https://creativecommons.org/licenses/by/4.0/).